-

Figure 1.
(a) Shoot biomass, (b) root biomass and (c) picture of plant pot experiments of alfalfa under different treatments. CK: 100% soil; 10%: 10% SMS; 20%: 20% SMS; 30%: 30% SMS; CF: 100% soil with chemical fertilizers added. Different lowercase letters above the columns represent significant differences among these treatments according to Duncan tests.
-
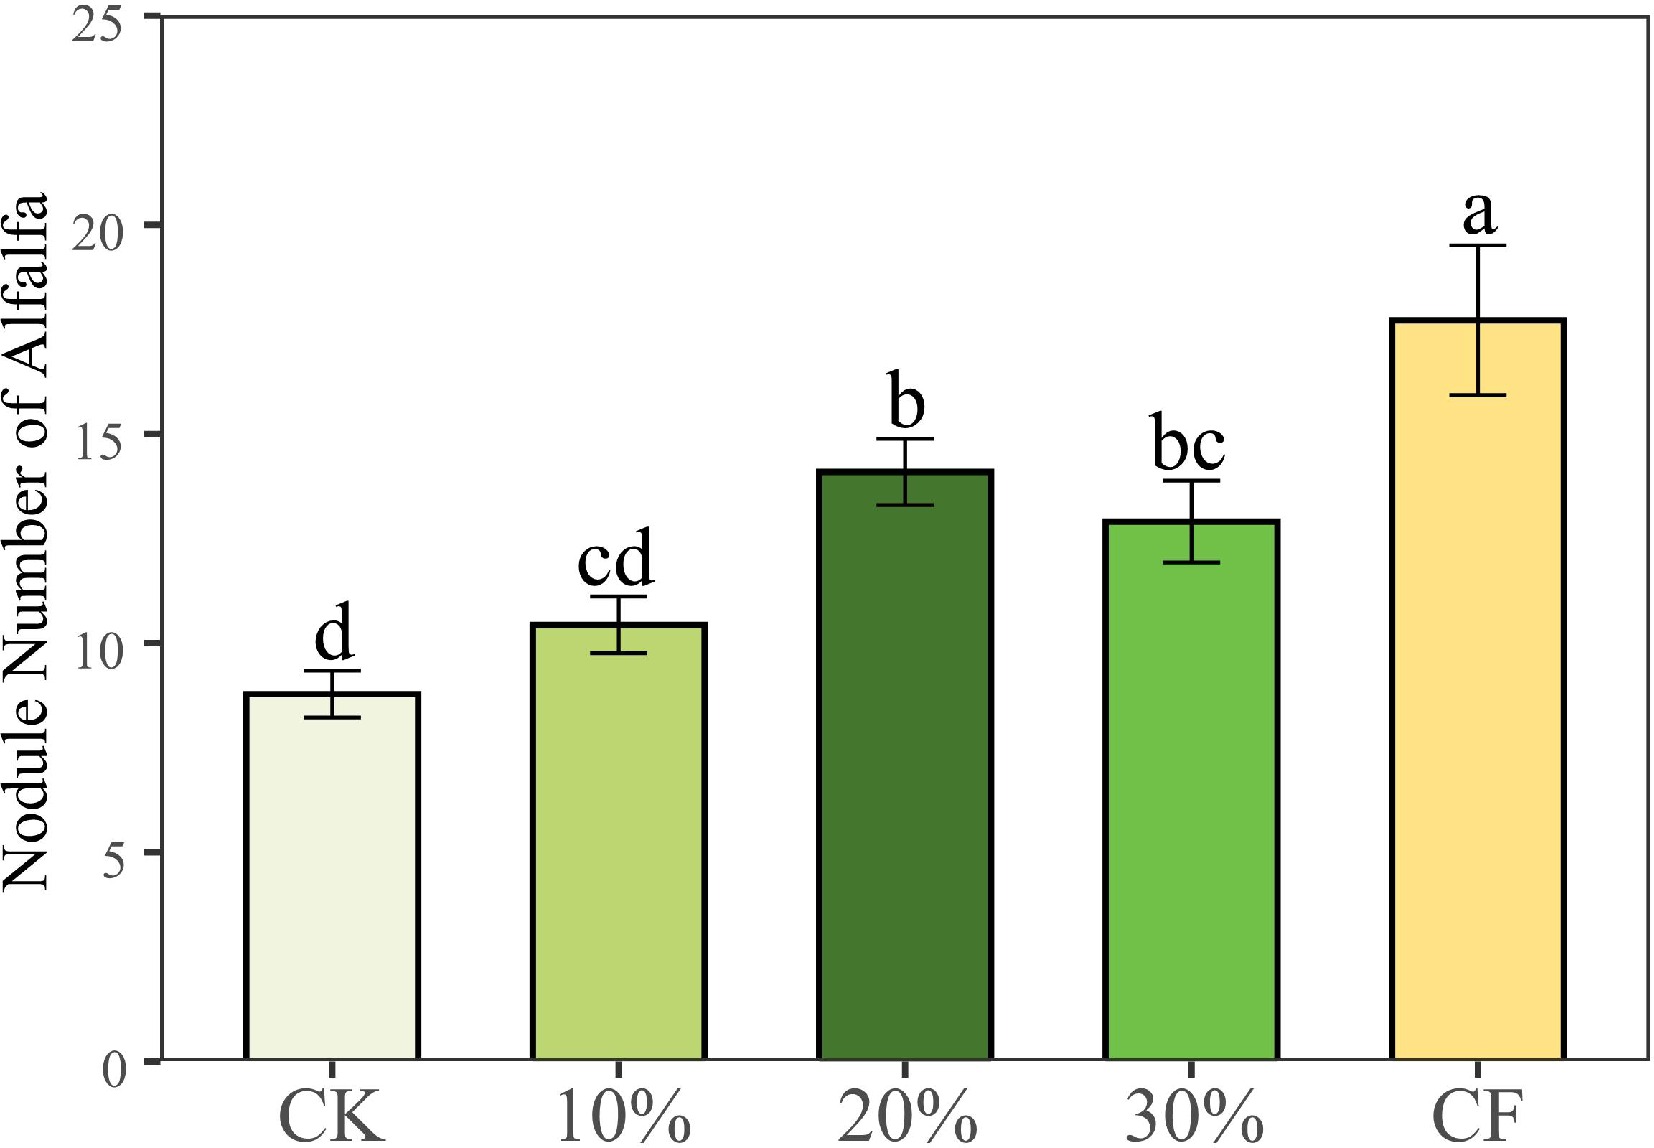
Figure 2.
Number of alfalfa nodules under different treatments. CK: 100% soil; 10%: 10% SMS; 20%: 20% SMS; 30%: 30% SMS; CF: 100% soil with chemical fertilizers added. Different lowercase letters above the columns represent significant differences among these treatments according to Duncan tests.
-

Figure 3.
Effects of different treatments on (a) soil dissolved organic carbon (DOC), (b) available P, (c) microbial biomass nitrogen (MBN), (d) microbial biomass carbon (MBC), (e) nitrate nitrogen (
$\text{NO}_3^- $ $\text{NH}_4^+ $ -
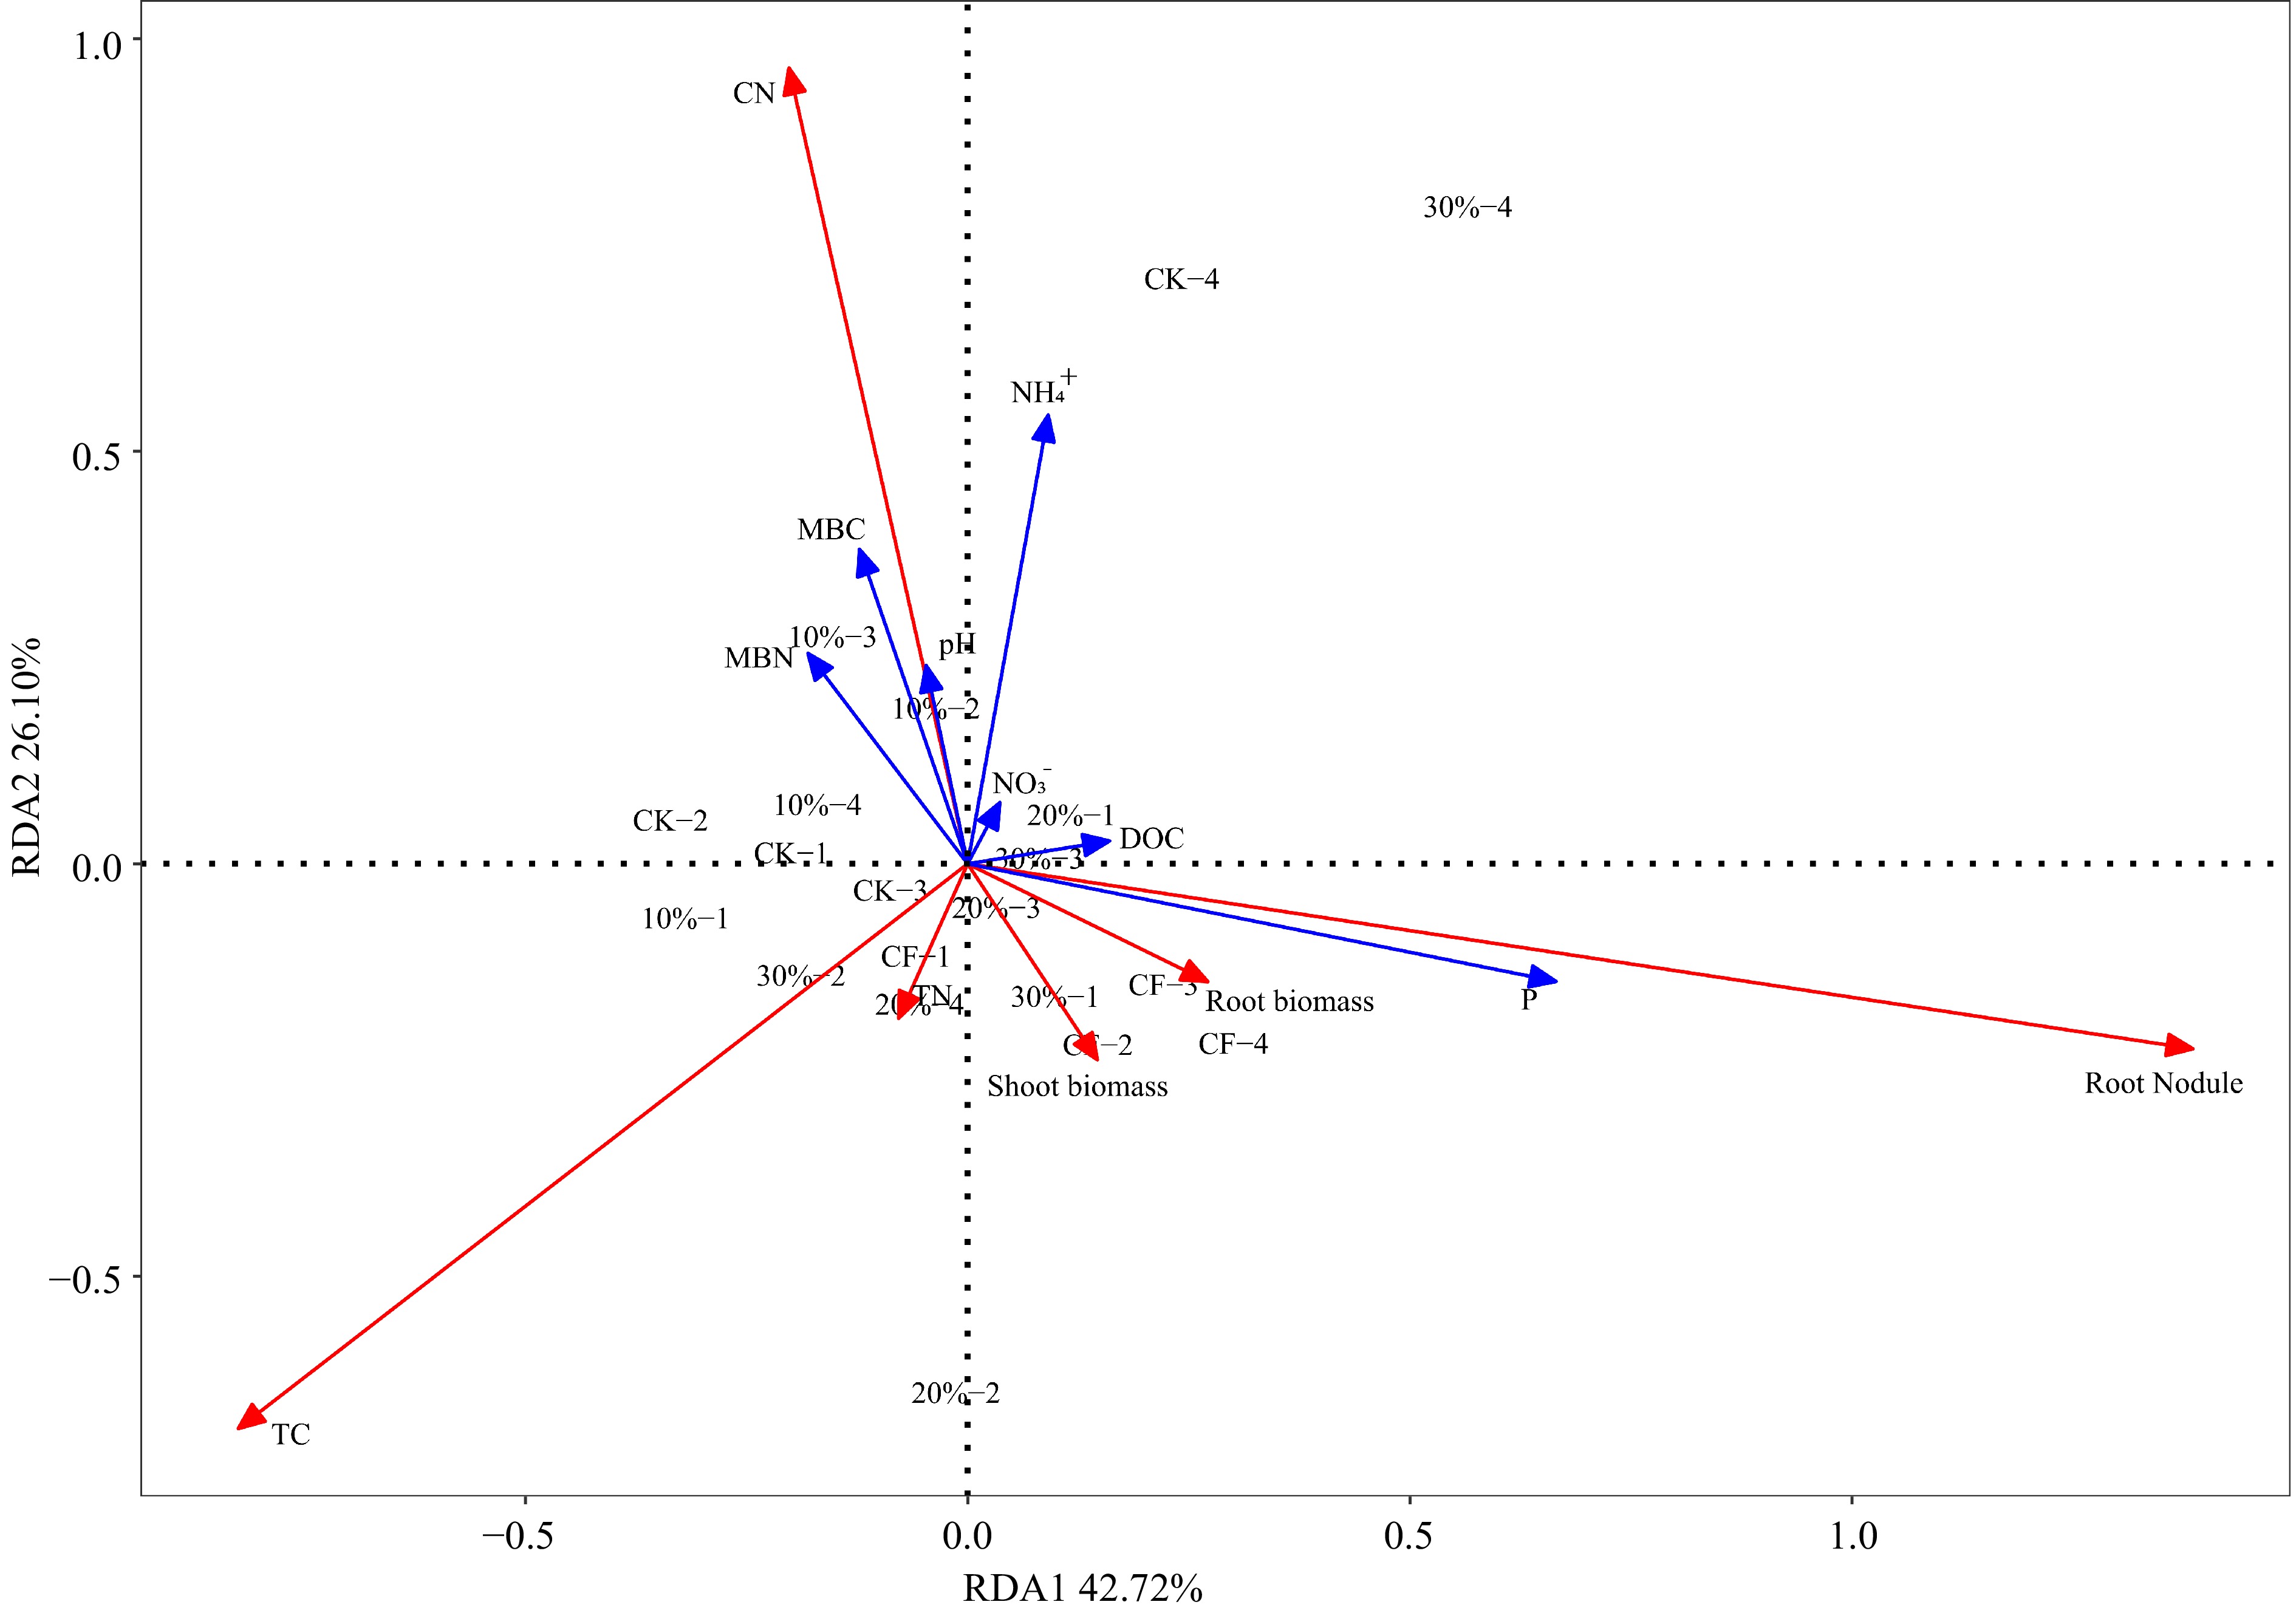
Figure 4.
The Redundancy Analysis (RDA) shows the effects of five experimental treatments on physical and chemical properties in substrate including pH, dissolved organic carbon (DOC), microbial biomass nitrogen (MBN), microbial biomass carbon (MBC),
$\text{NH}_4^+ $ $\text{NO}_3^- $ -

Figure 5.
Correlation heatmaps of alfalfa growth indicators (shoot biomass and root biomass) and of nutrient concentration indicators in substrates (
$\text{NO}_3^- $ $\text{NH}_4^+ $ $\text{NO}_3^- $ $\text{NH}_4^+ $ -
Treatment Root-TN (g) Root-TC (g) Root-C/N (%) Stem-TN (g) Stem-TC (g) Stem-C/N (%) Leaf-TN (g) Leaf-TC (g) Leaf-C/N (%) CK 0.53 ± 0.26b 8.05 ± 3.69b 15.44 ± 0.86b 0.27 ± 0.11b 7.27 ± 2.73c 27.17 ± 1.27a 0.73 ± 0.49a 12.51 ± 8.20b 23.32 ± 12.55ab 10% SMS 0.83 ± 0.28ab 14.13 ± 4.18ab 17.13 ± 1.09a 0.28 ± 0.09b 8.49 ± 2.96bc 29.99 ± 3.39a 0.98 ± 0.47a 23.49 ± 9.58ab 24.8 ± 3.63a 20% SMS 1.00 ± 0.30ab 17.71 ± 5.83a 17.56 ± 0.79a 0.52 ± 0.16a 14.58 ± 4.21ab 28.23 ± 2.71a 2.50 ± 2.16a 29.74 ± 7.79a 15.7 ± 6.43ab 30% SMS 1.04 ± 0.52ab 17.92 ± 8.80a 17.28 ± 0.57a 0.44 ± 0.19ab 13.16 ± 5.88abc 29.82 ± 2.14a 1.60 ± 1.09a 25.07 ± 17.19ab 11.76 ± 7.87b CF 1.16 ± 0.15a 19.77 ± 2.30a 17.13 ± 0.45a 0.58 ± 0.13a 15.53 ± 2.61a 27.78 ± 6.58a 1.93 ± 0.21a 29.06 ± 1.85ab 15.14 ± 1.13ab Different lowercase letters in the table represent significant differences among these treatments according to Duncan tests. Table 1.
Total carbon, nitrogen content, and carbon and nitrogen ratio (TC, TN, C/N) of alfalfa harvested in different treatments.
-
Experimental treatment pH CK 7.12 ± 0.18a 10% SMS 7.08 ± 0.09a 20% SMS 7.06 ± 0.08a 30% SMS 7.06 ± 0.15a CF 7.10 ± 0.06a Different lowercase letters in the table represent significant differences among these treatments according to Duncan tests. Table 2.
The pH of substrate with different treatments after harvesting.
Figures
(5)
Tables
(2)