-
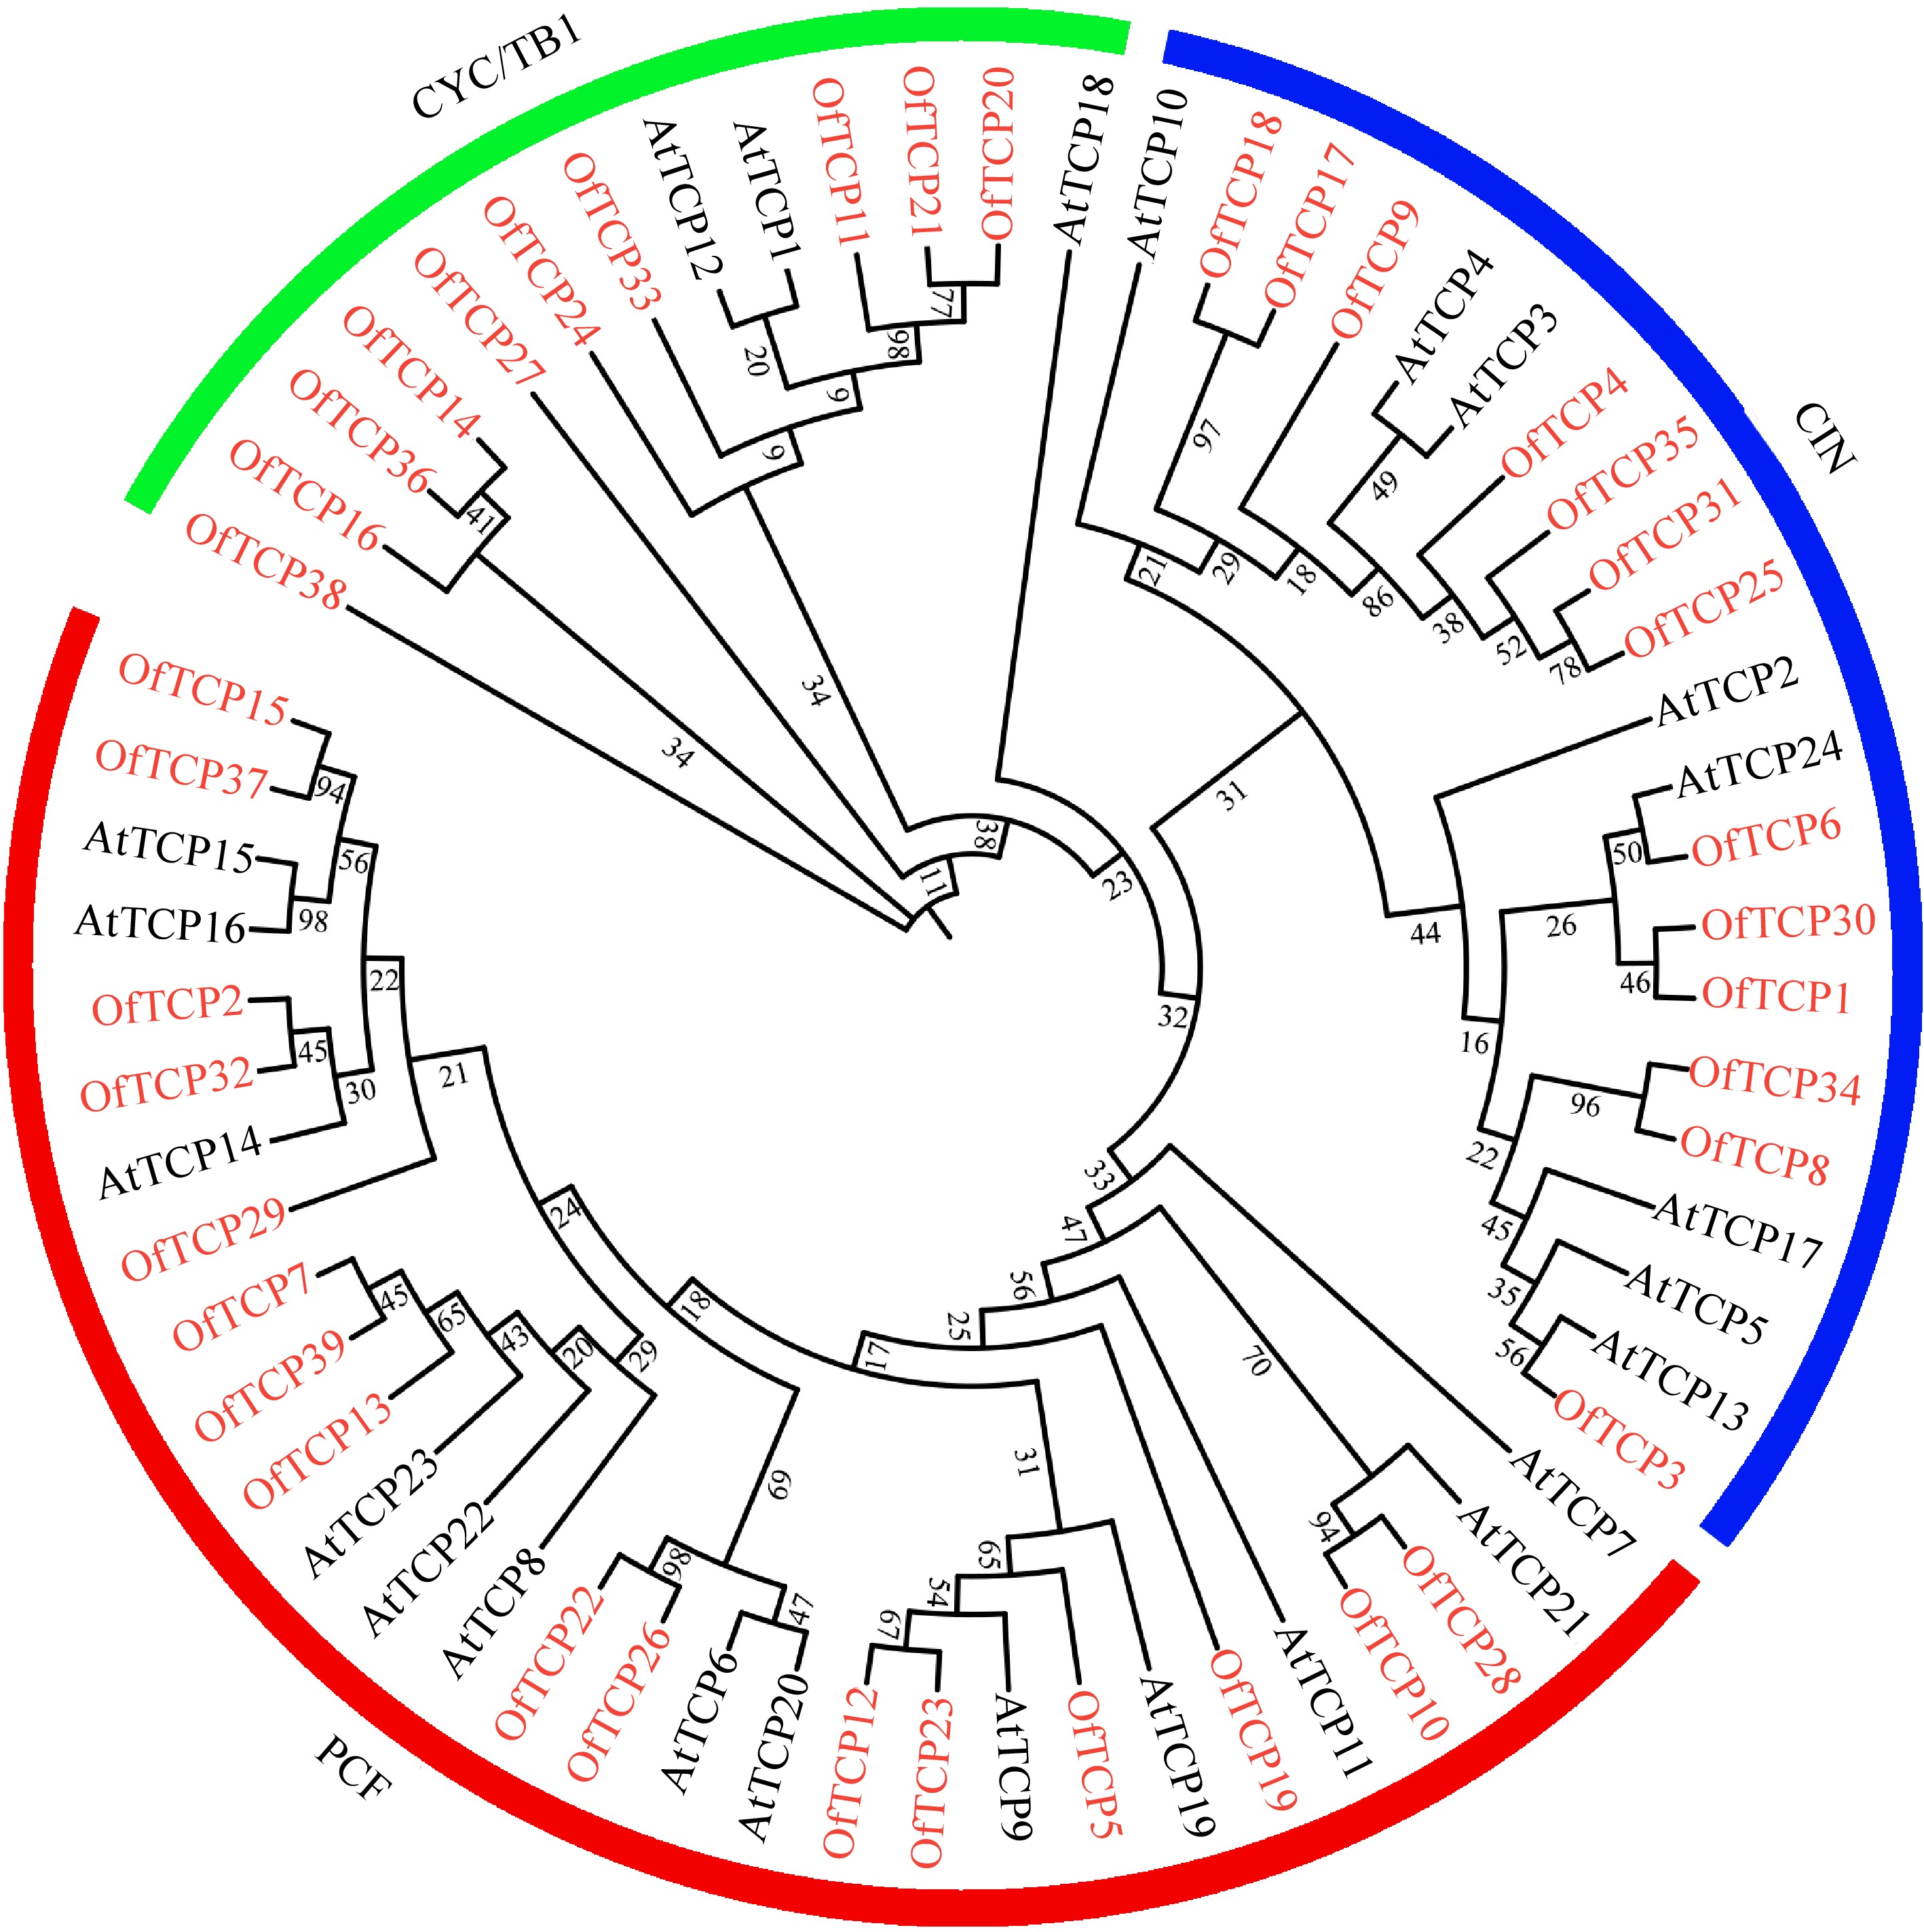
Figure 1.
Phylogenetic analysis of TCP members from Arabidopsis and O. fragrans. Note: Red font represents O. fragrans, black font represents Arabidopsis.
-
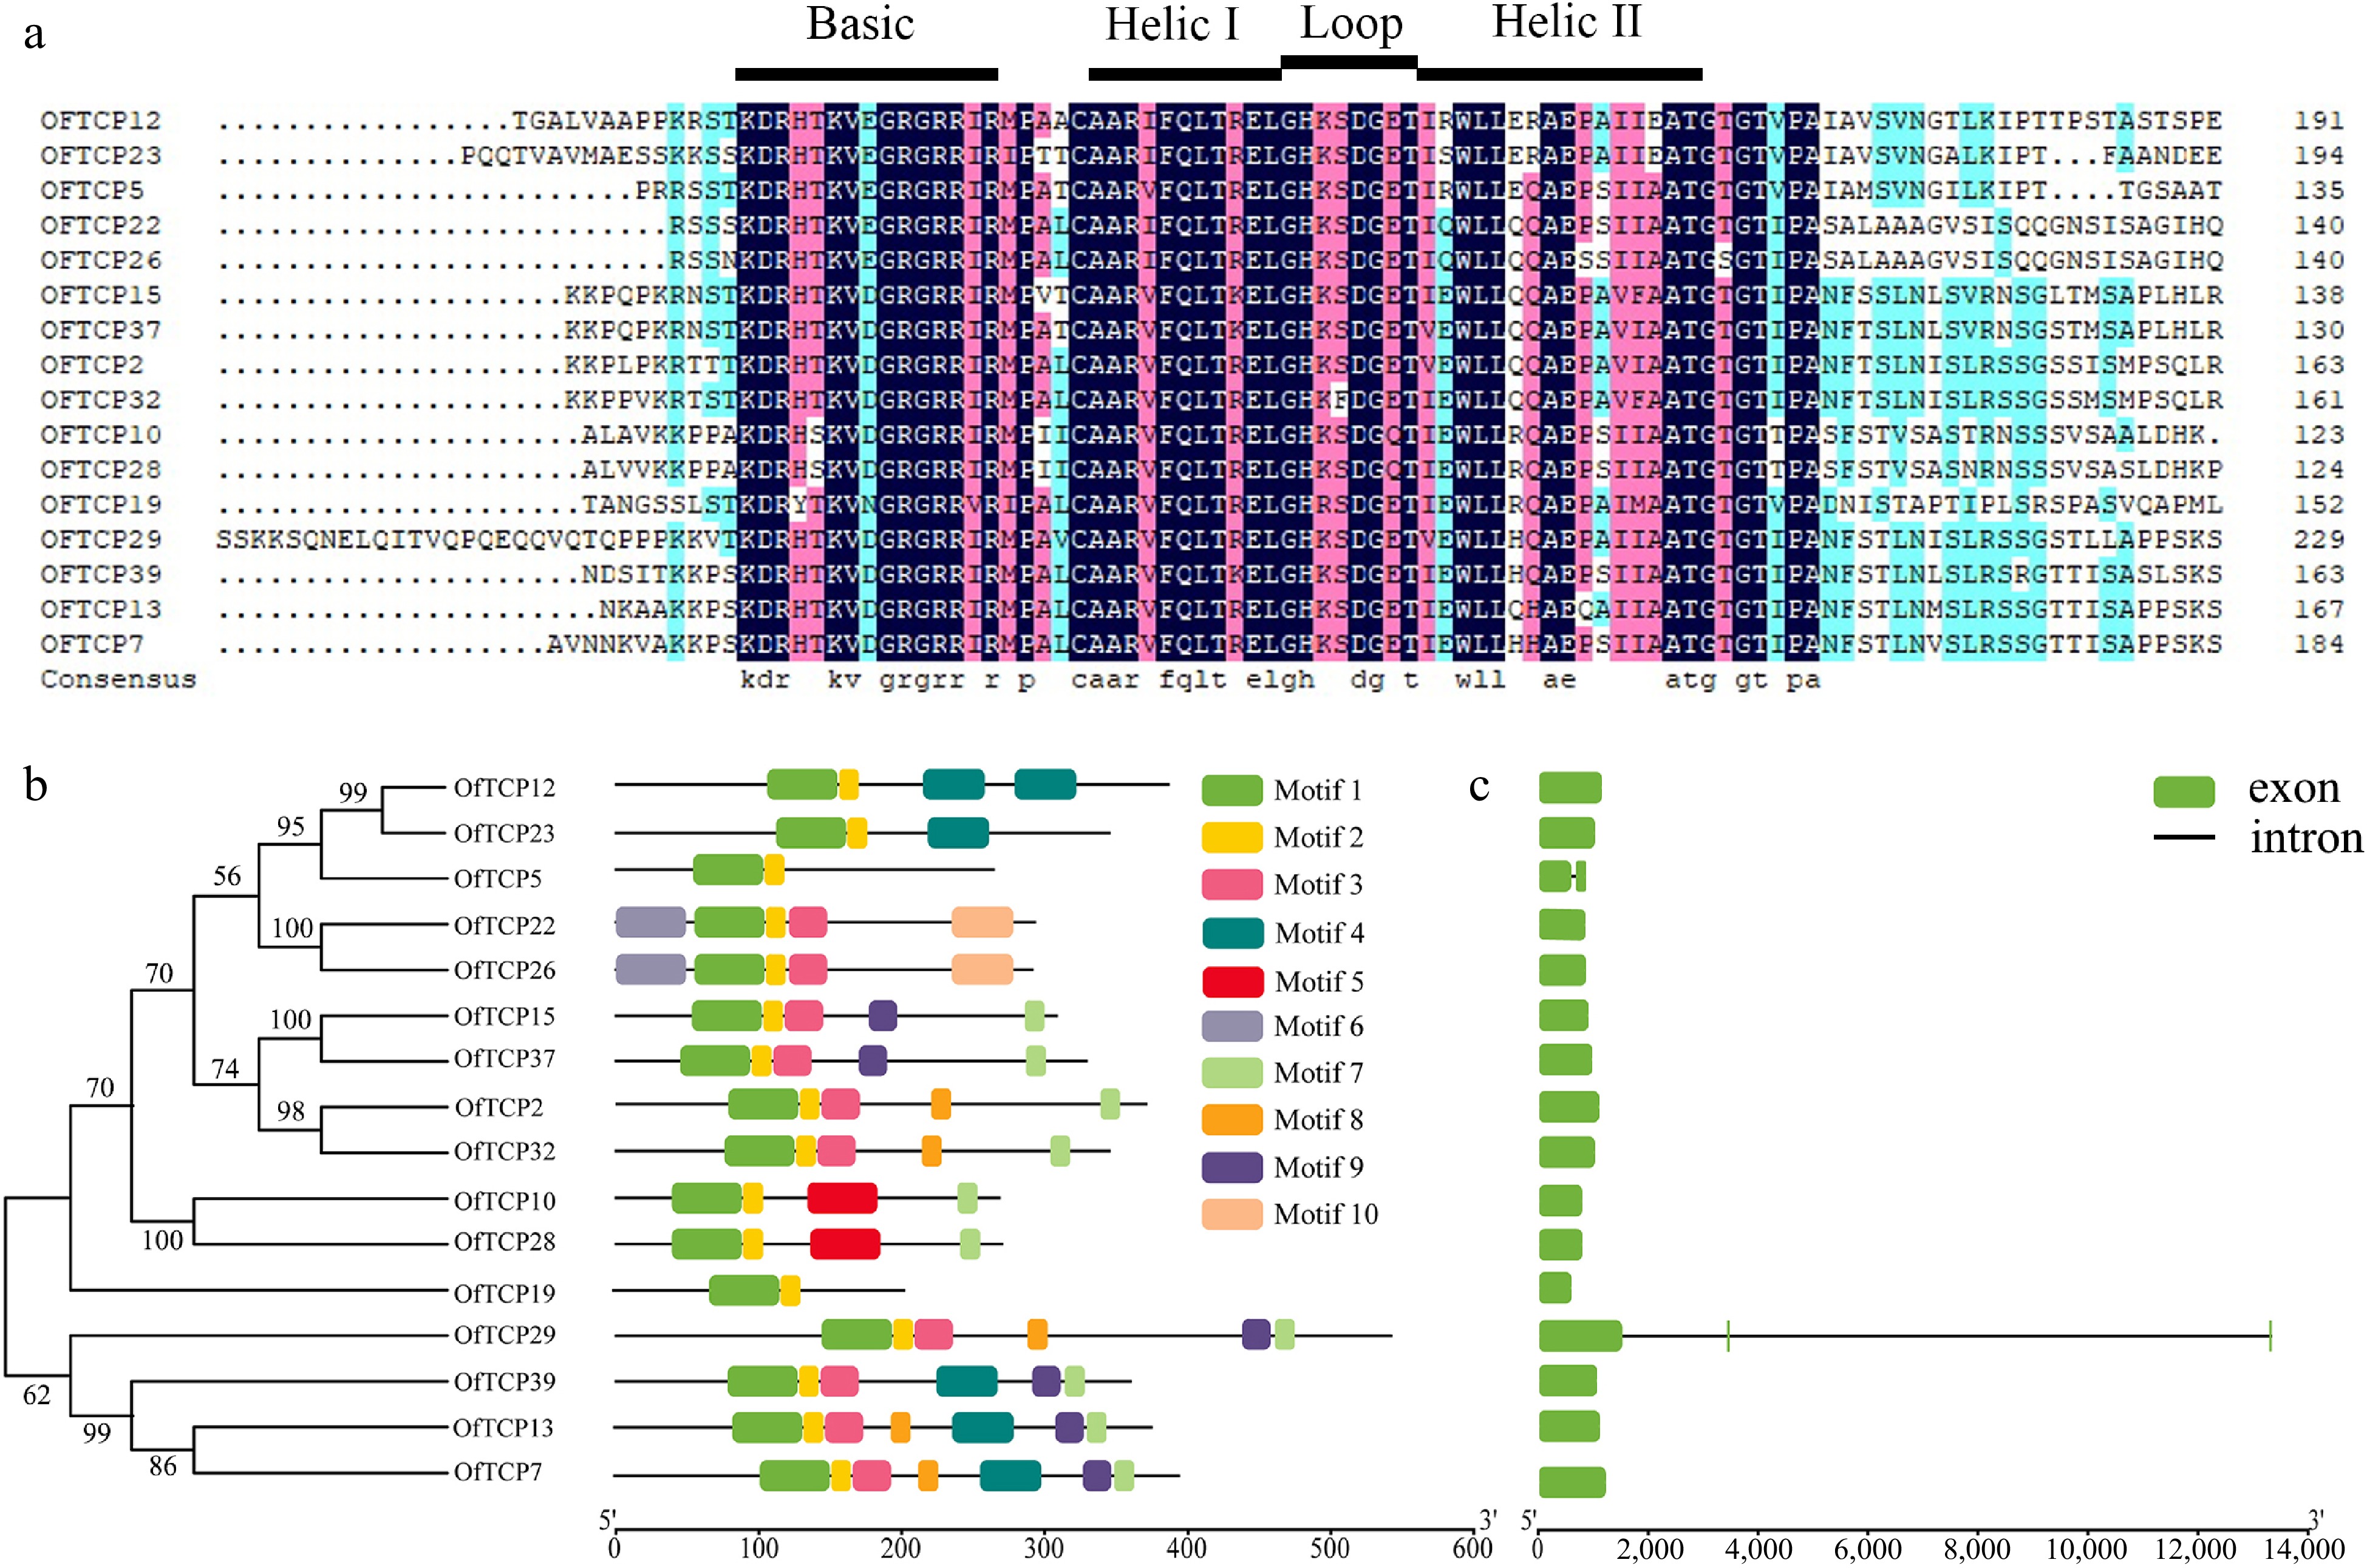
Figure 2.
Analysis of class I TCP gene sequence characteristics in O. fragrans. (a) Alignment of class I OfTCP protein sequences. (b) Motif distribution of class I OfTCPs. (c) Class I OfTCP gene structure analysis.
-
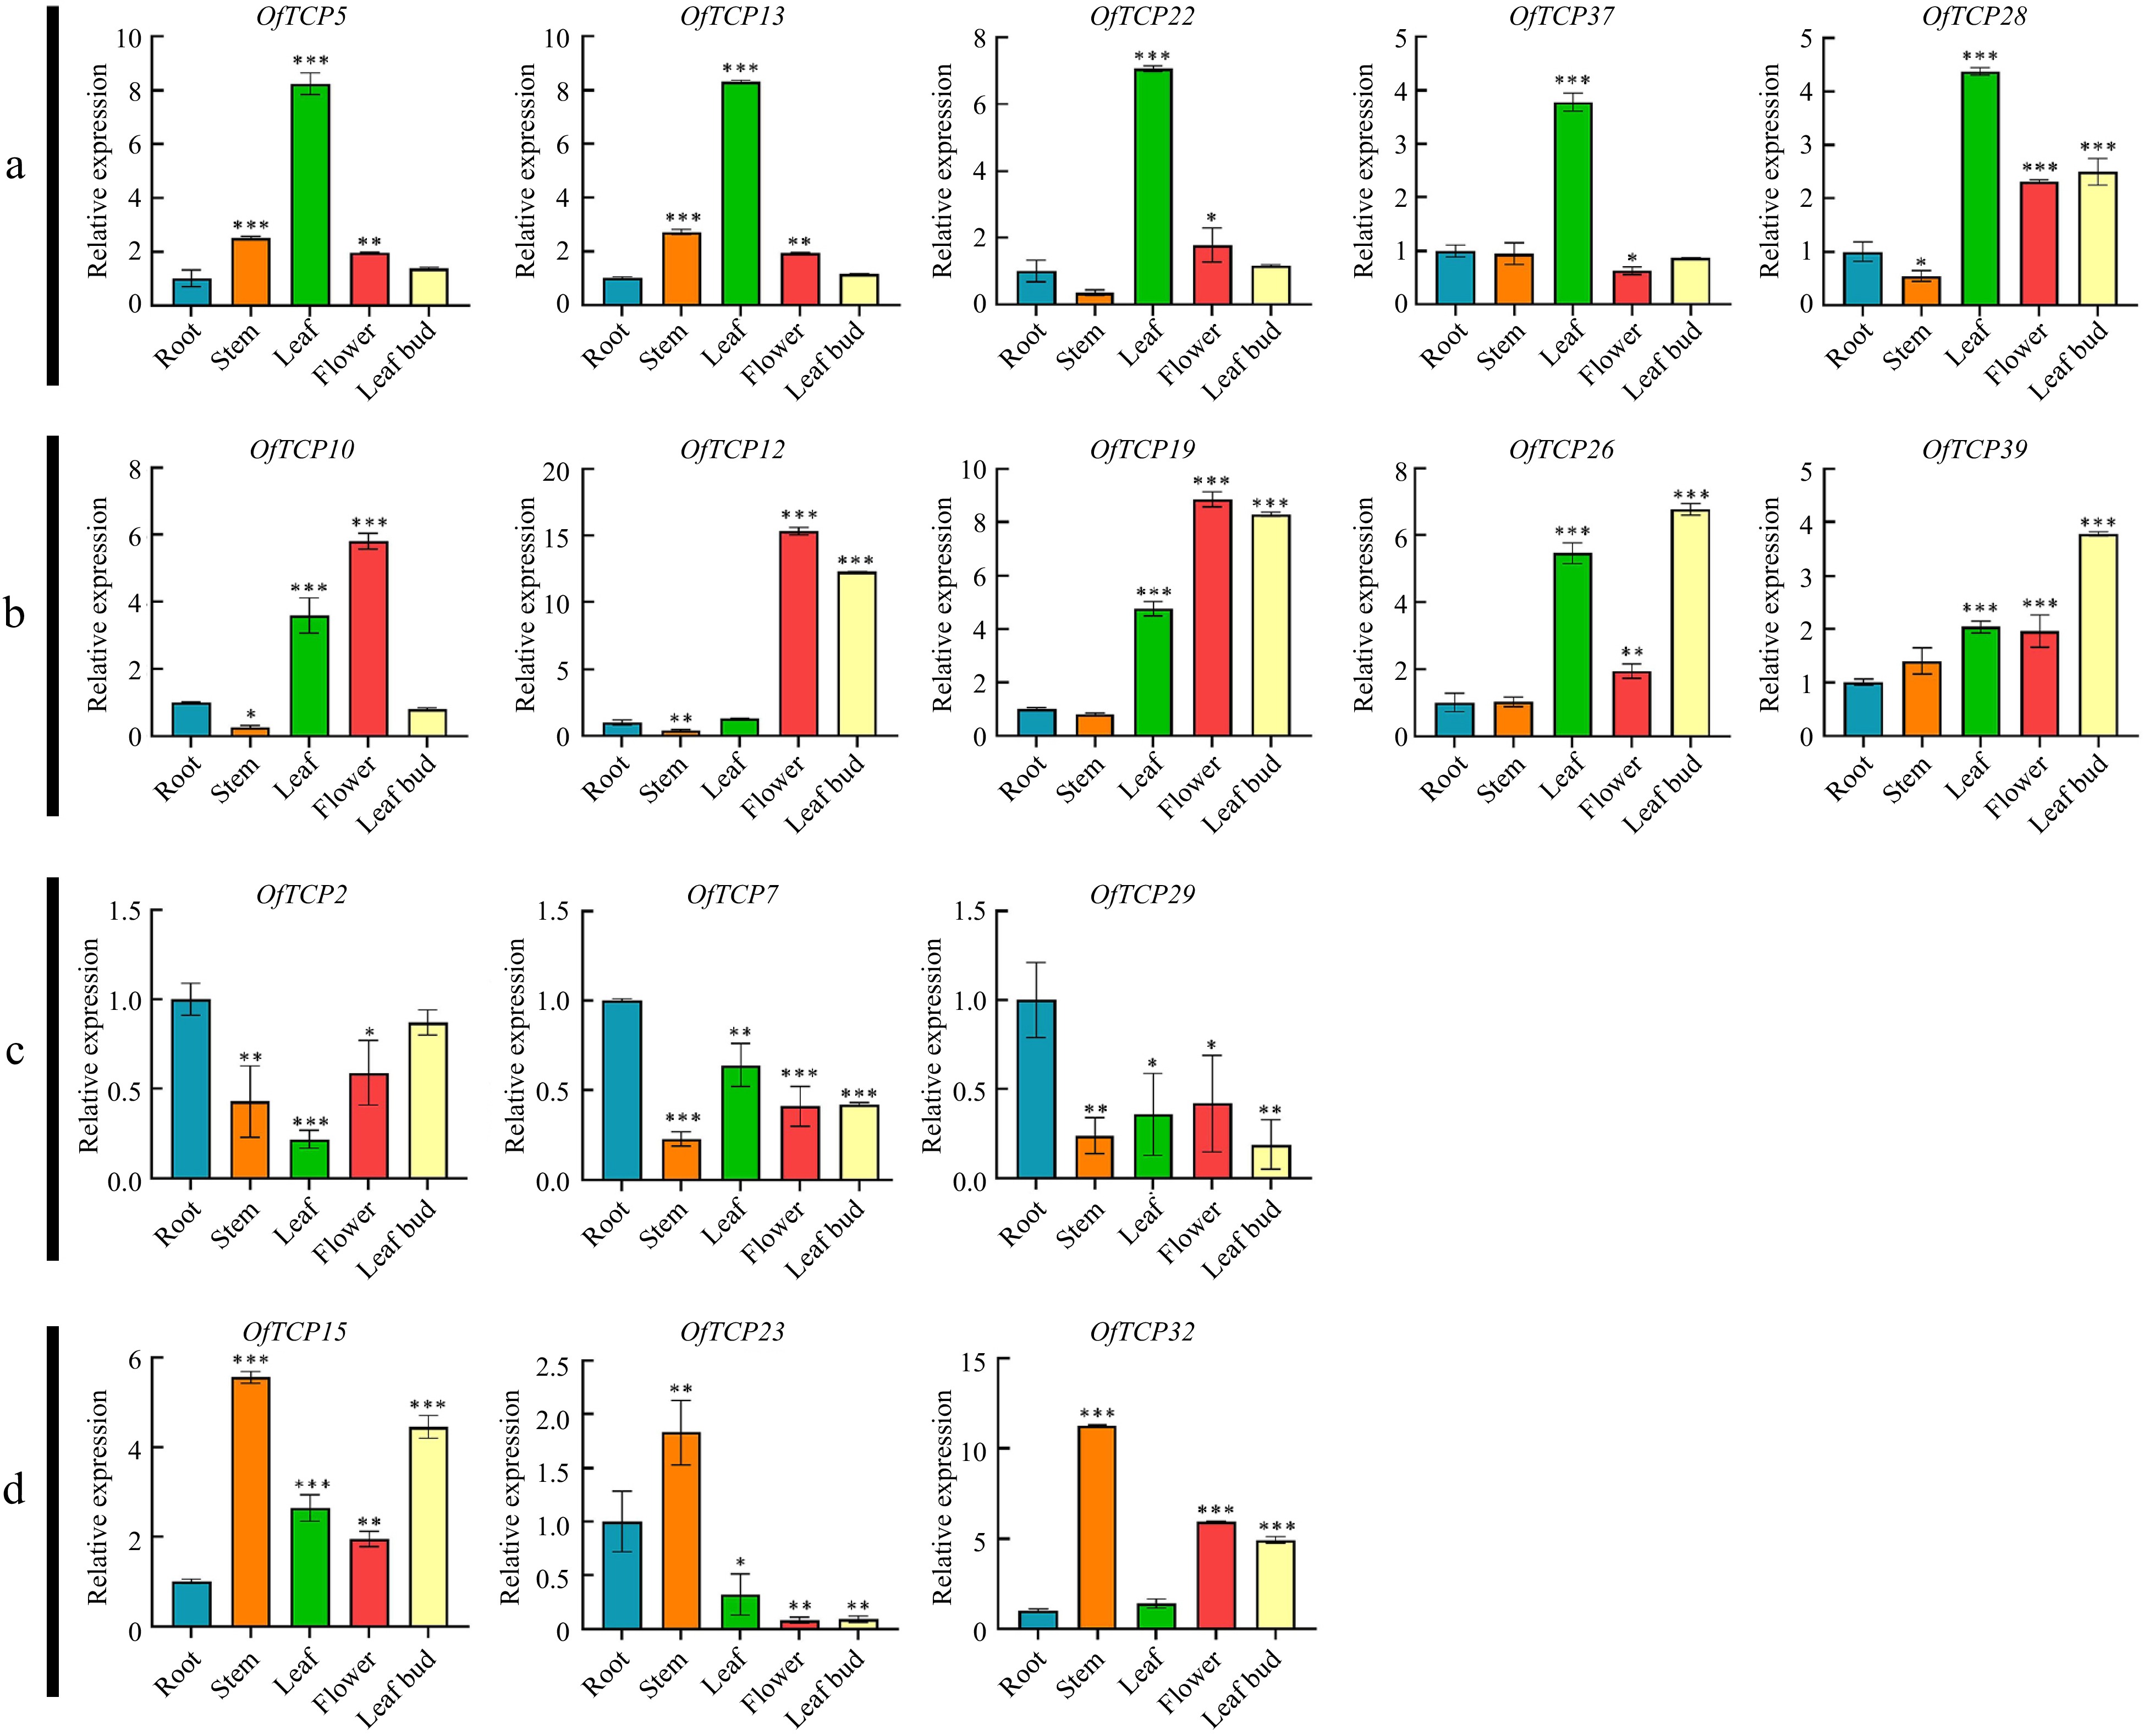
Figure 3.
Expression patterns of class I OfTCP genes in different tissues of O. fragrans. * p < 0.05, ** p < 0.01, *** p < 0.001, t test.
-
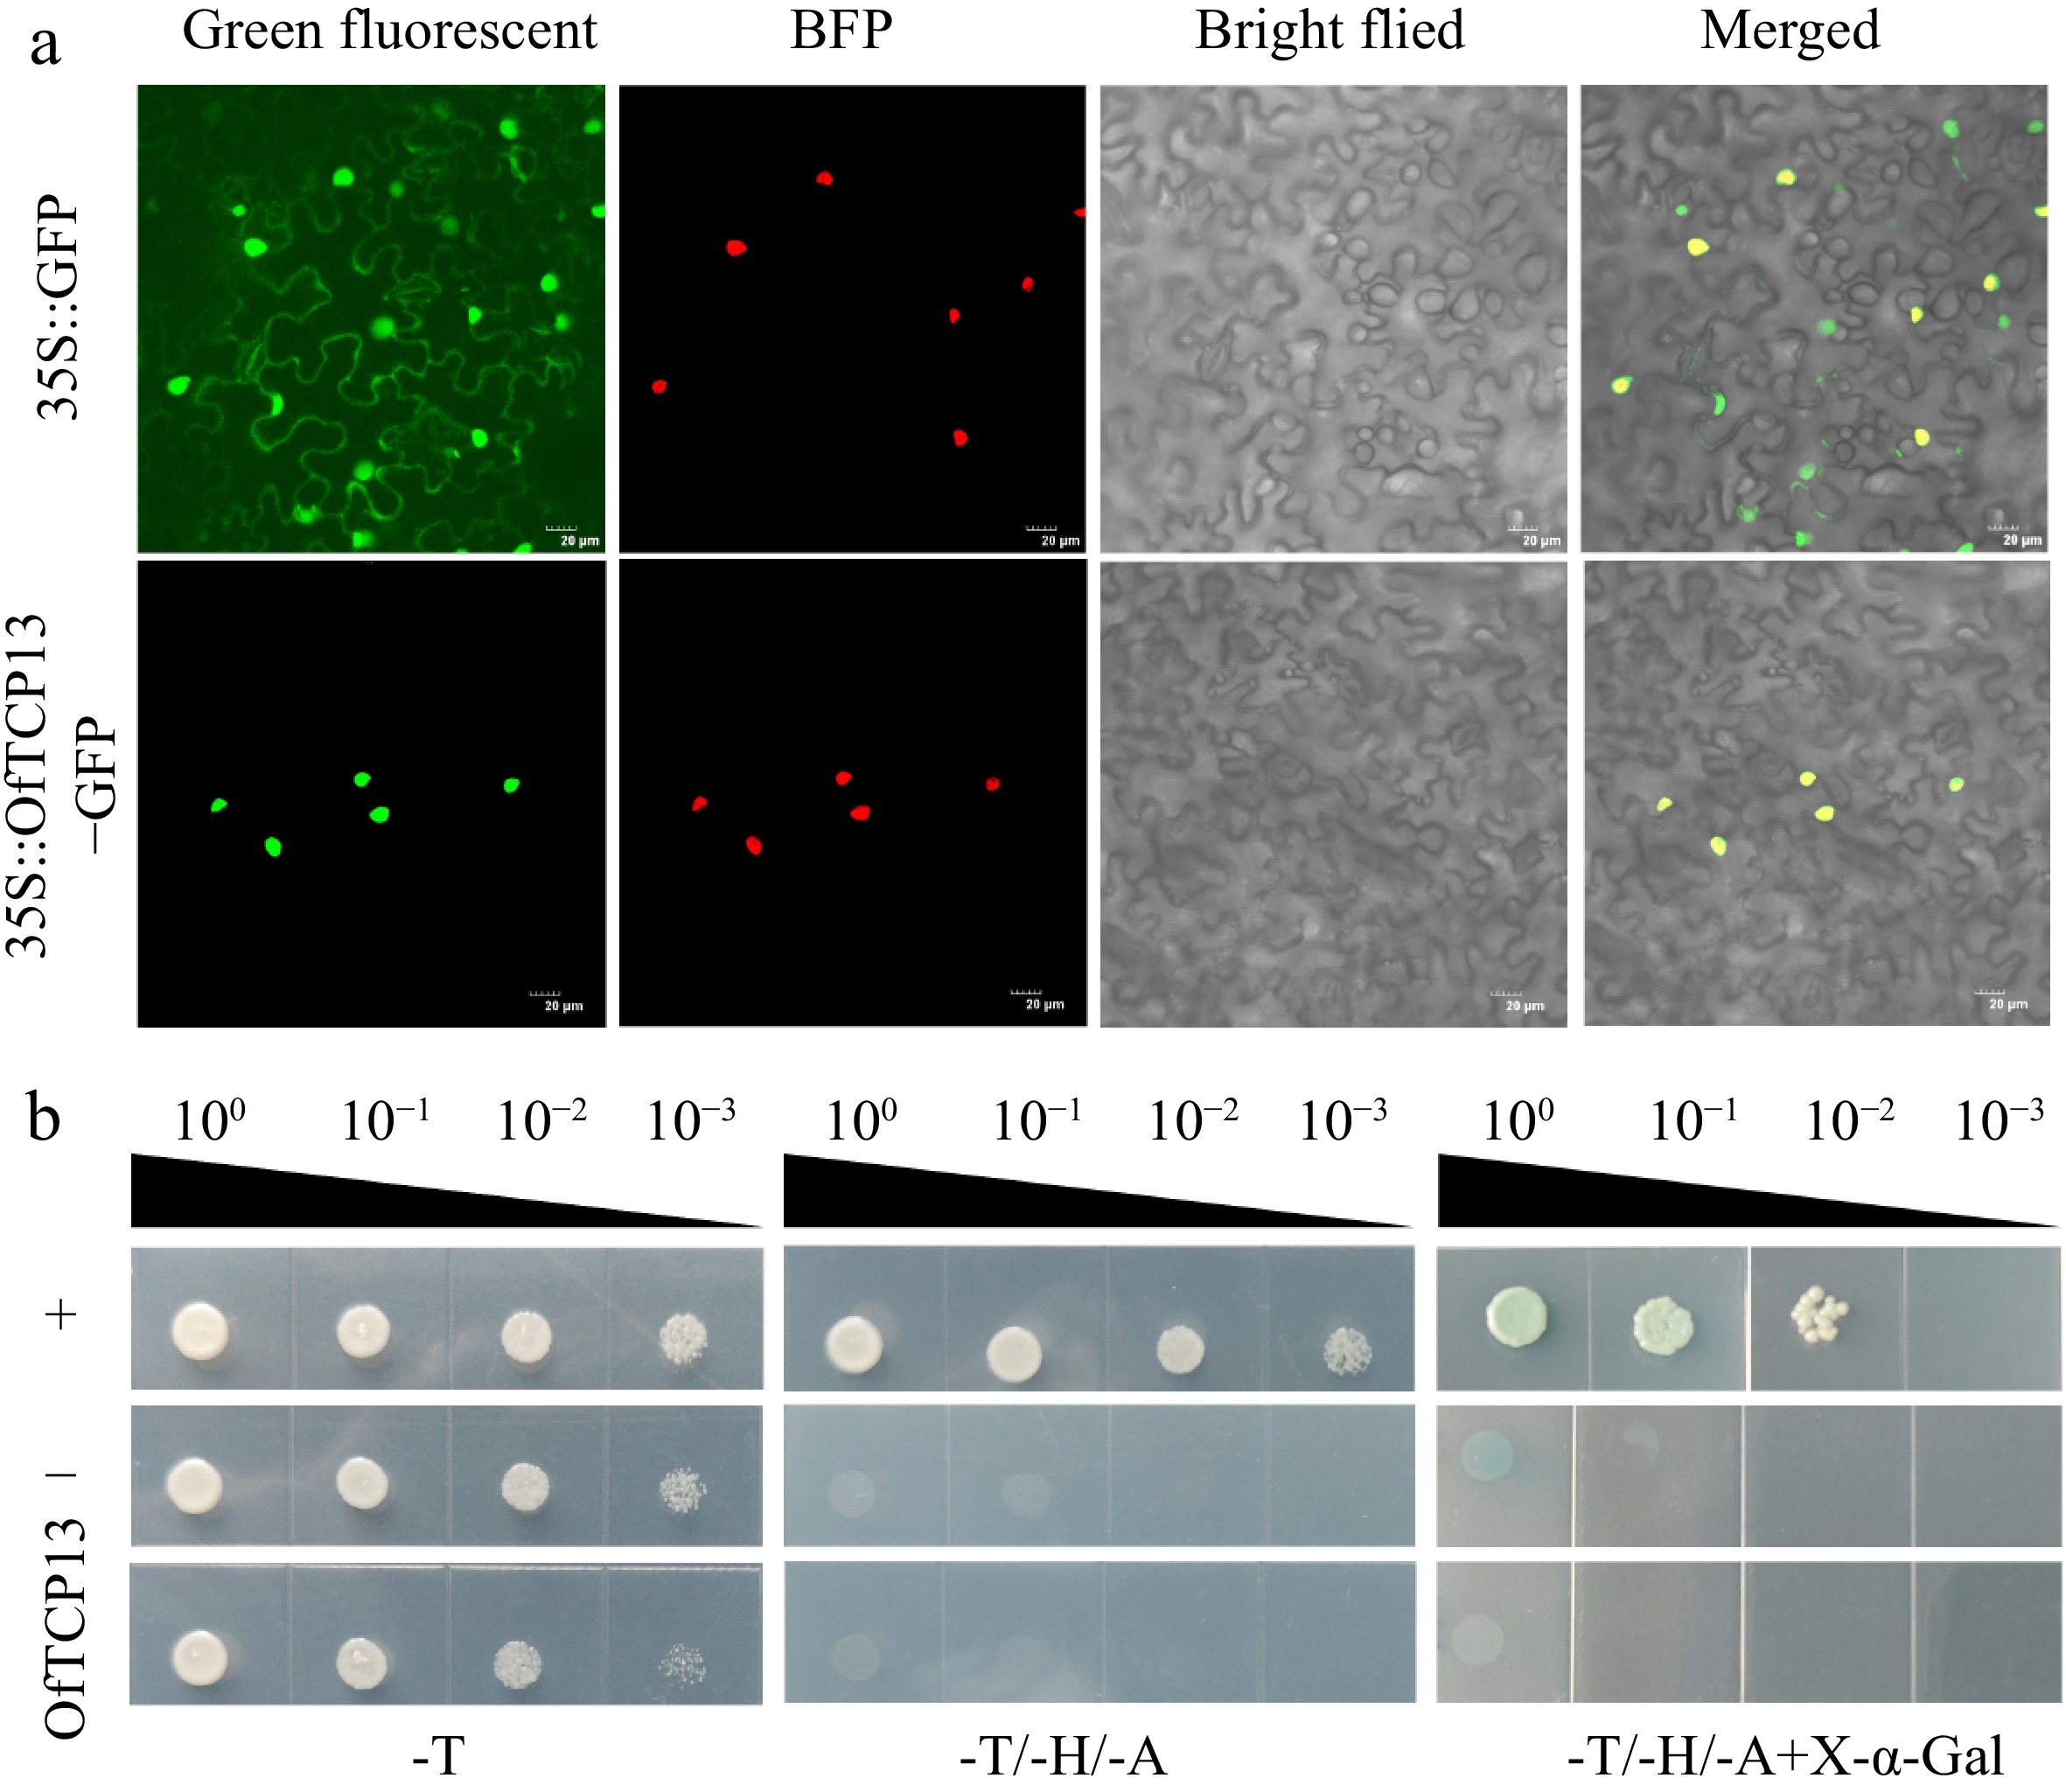
Figure 4.
OfTCP13 subcellular localization and transactivation activity. (a) Subcellular localization of OfTCP13 in N. benthamiana epidermal cells. 35S::GFP is used as a control, 35::D53-RFP is a nuclear marker. Scale bars = 20 µm. (b) Transcriptional activity analysis of OfTCP13 in yeast. Note: + represents positive control, − represents negative control.
-
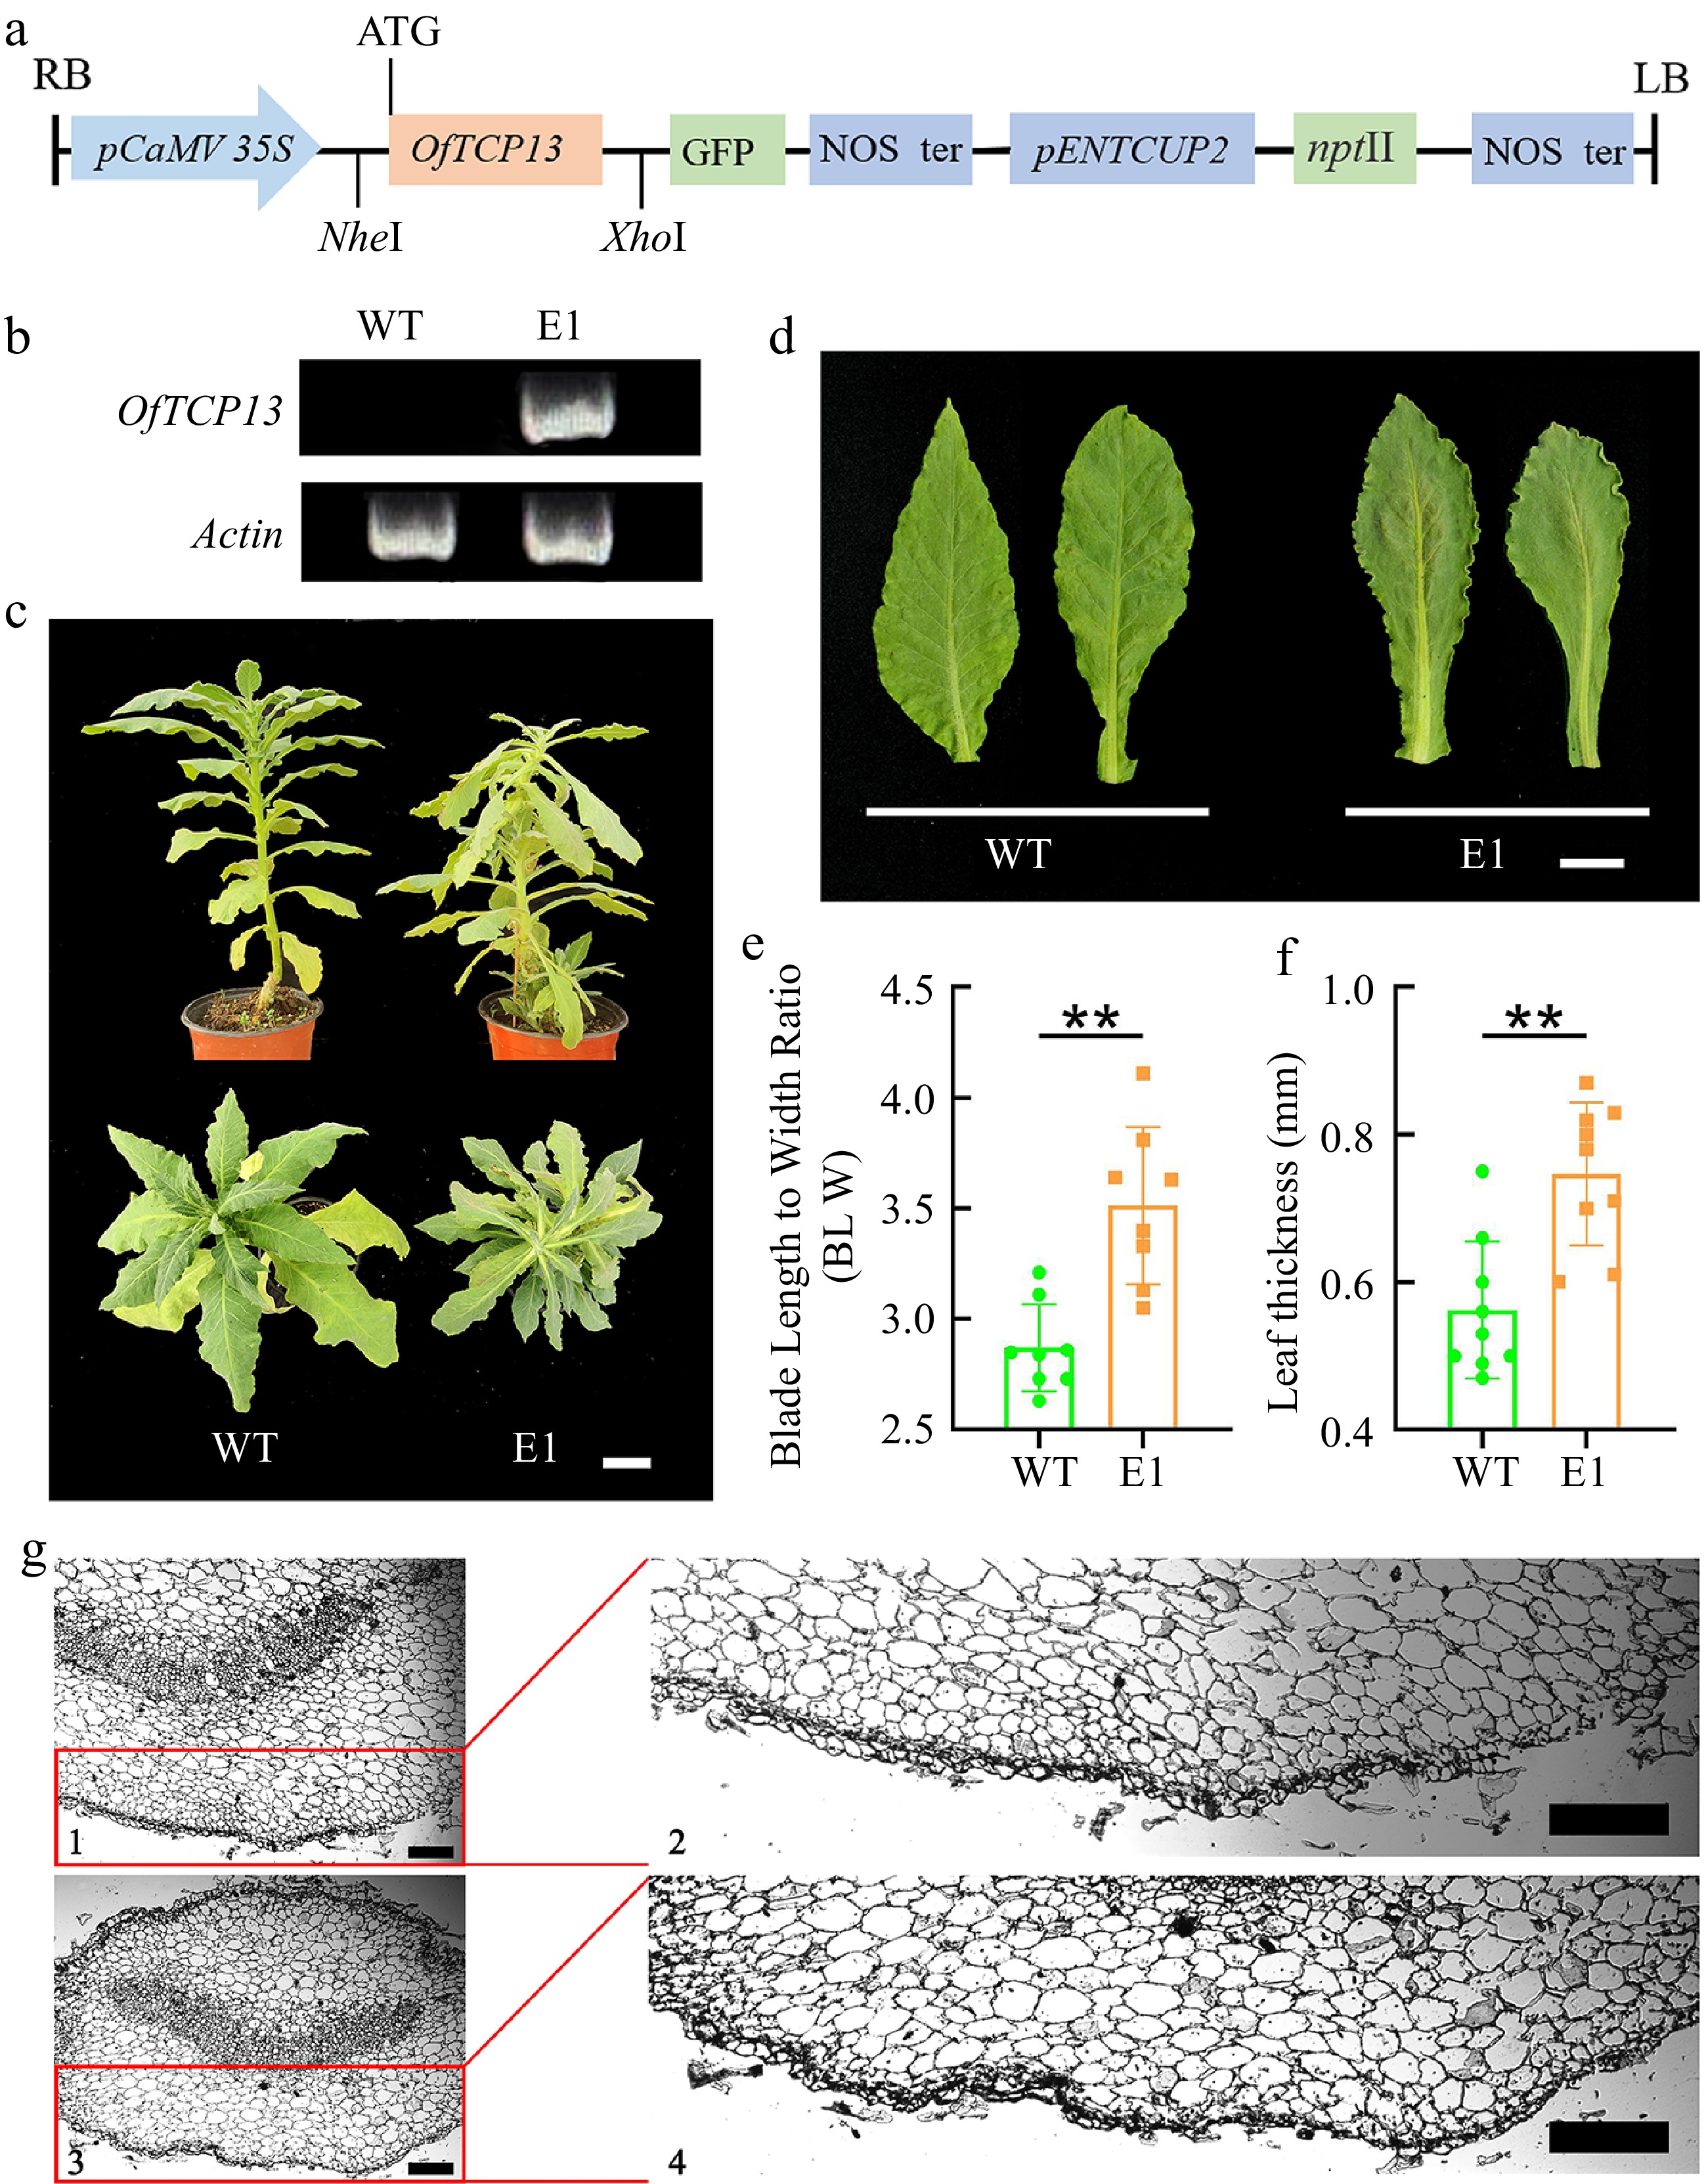
Figure 5.
Overexpression of OfTCP13 affects leaf morphology in tobacco plant. (a) Structure of pORE-R4-OfTCP13 vector for tobacco transformation. (b) Identification of OfTCP13 transgenic lines by PCR analysis (c) Phenotypic characteristics of WT and transgenic tobacco. Scale bars = 5 cm. (d) Leaf morphology of WT and transgenic tobacco. Scale bars = 2 cm. (e) Blade length to width ratio, ** p < 0.01, t test. (f) Leaf thickness, ** p < 0.01, t test. (g) Cross-sectional of leaf blade. 1 and 2 represents the leaf cross-sectional of transgenic plants, 3 and 4 are WT. Note: Three lines were used for the leaf morphology investigation, Fig. 5c & d present the typical leaf traits of line E1. Ve indicates veins. Scale bars = 200 µm.
Figures
(5)
Tables
(0)