-
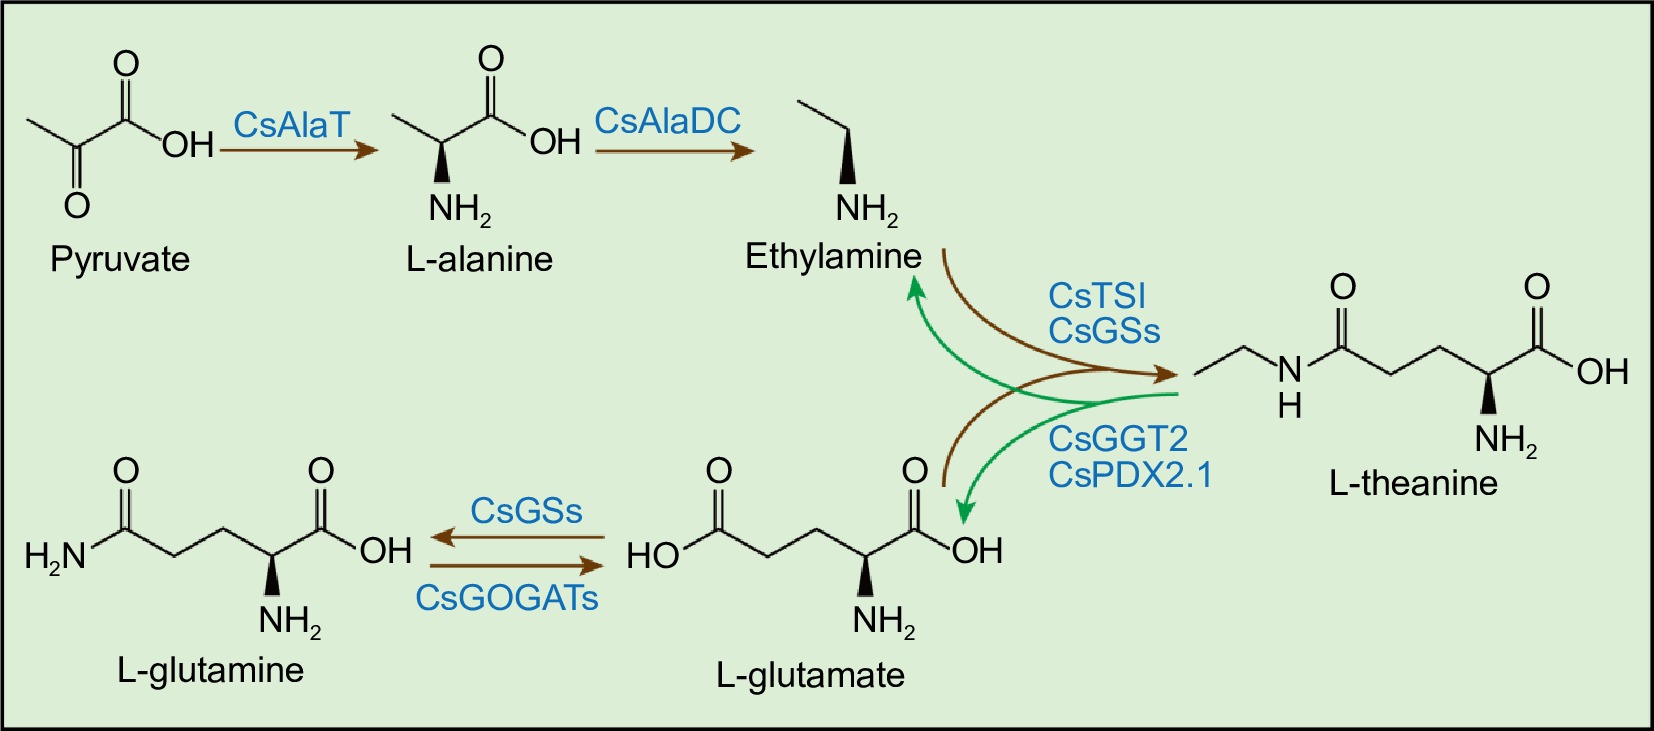
Figure 1.
Theanine metabolic pathway in tea plants. CsGSs, Glutamine Synthetase; CsGOGATs, Glutamate Synthase; CsAlaT, Alanine Transaminase; CsAlaDC, Alanine Decarboxylase; CsTSI, Theanine Synthetase I; CsGGT2, γ-glutamyl-transpeptidase 2; CsPDX2.1, Pyridoxine biosynthesis 2.1. Brown arrows represent the theanine biosynthesis pathway. Green arrows represent the theanine catabolism pathway.
-
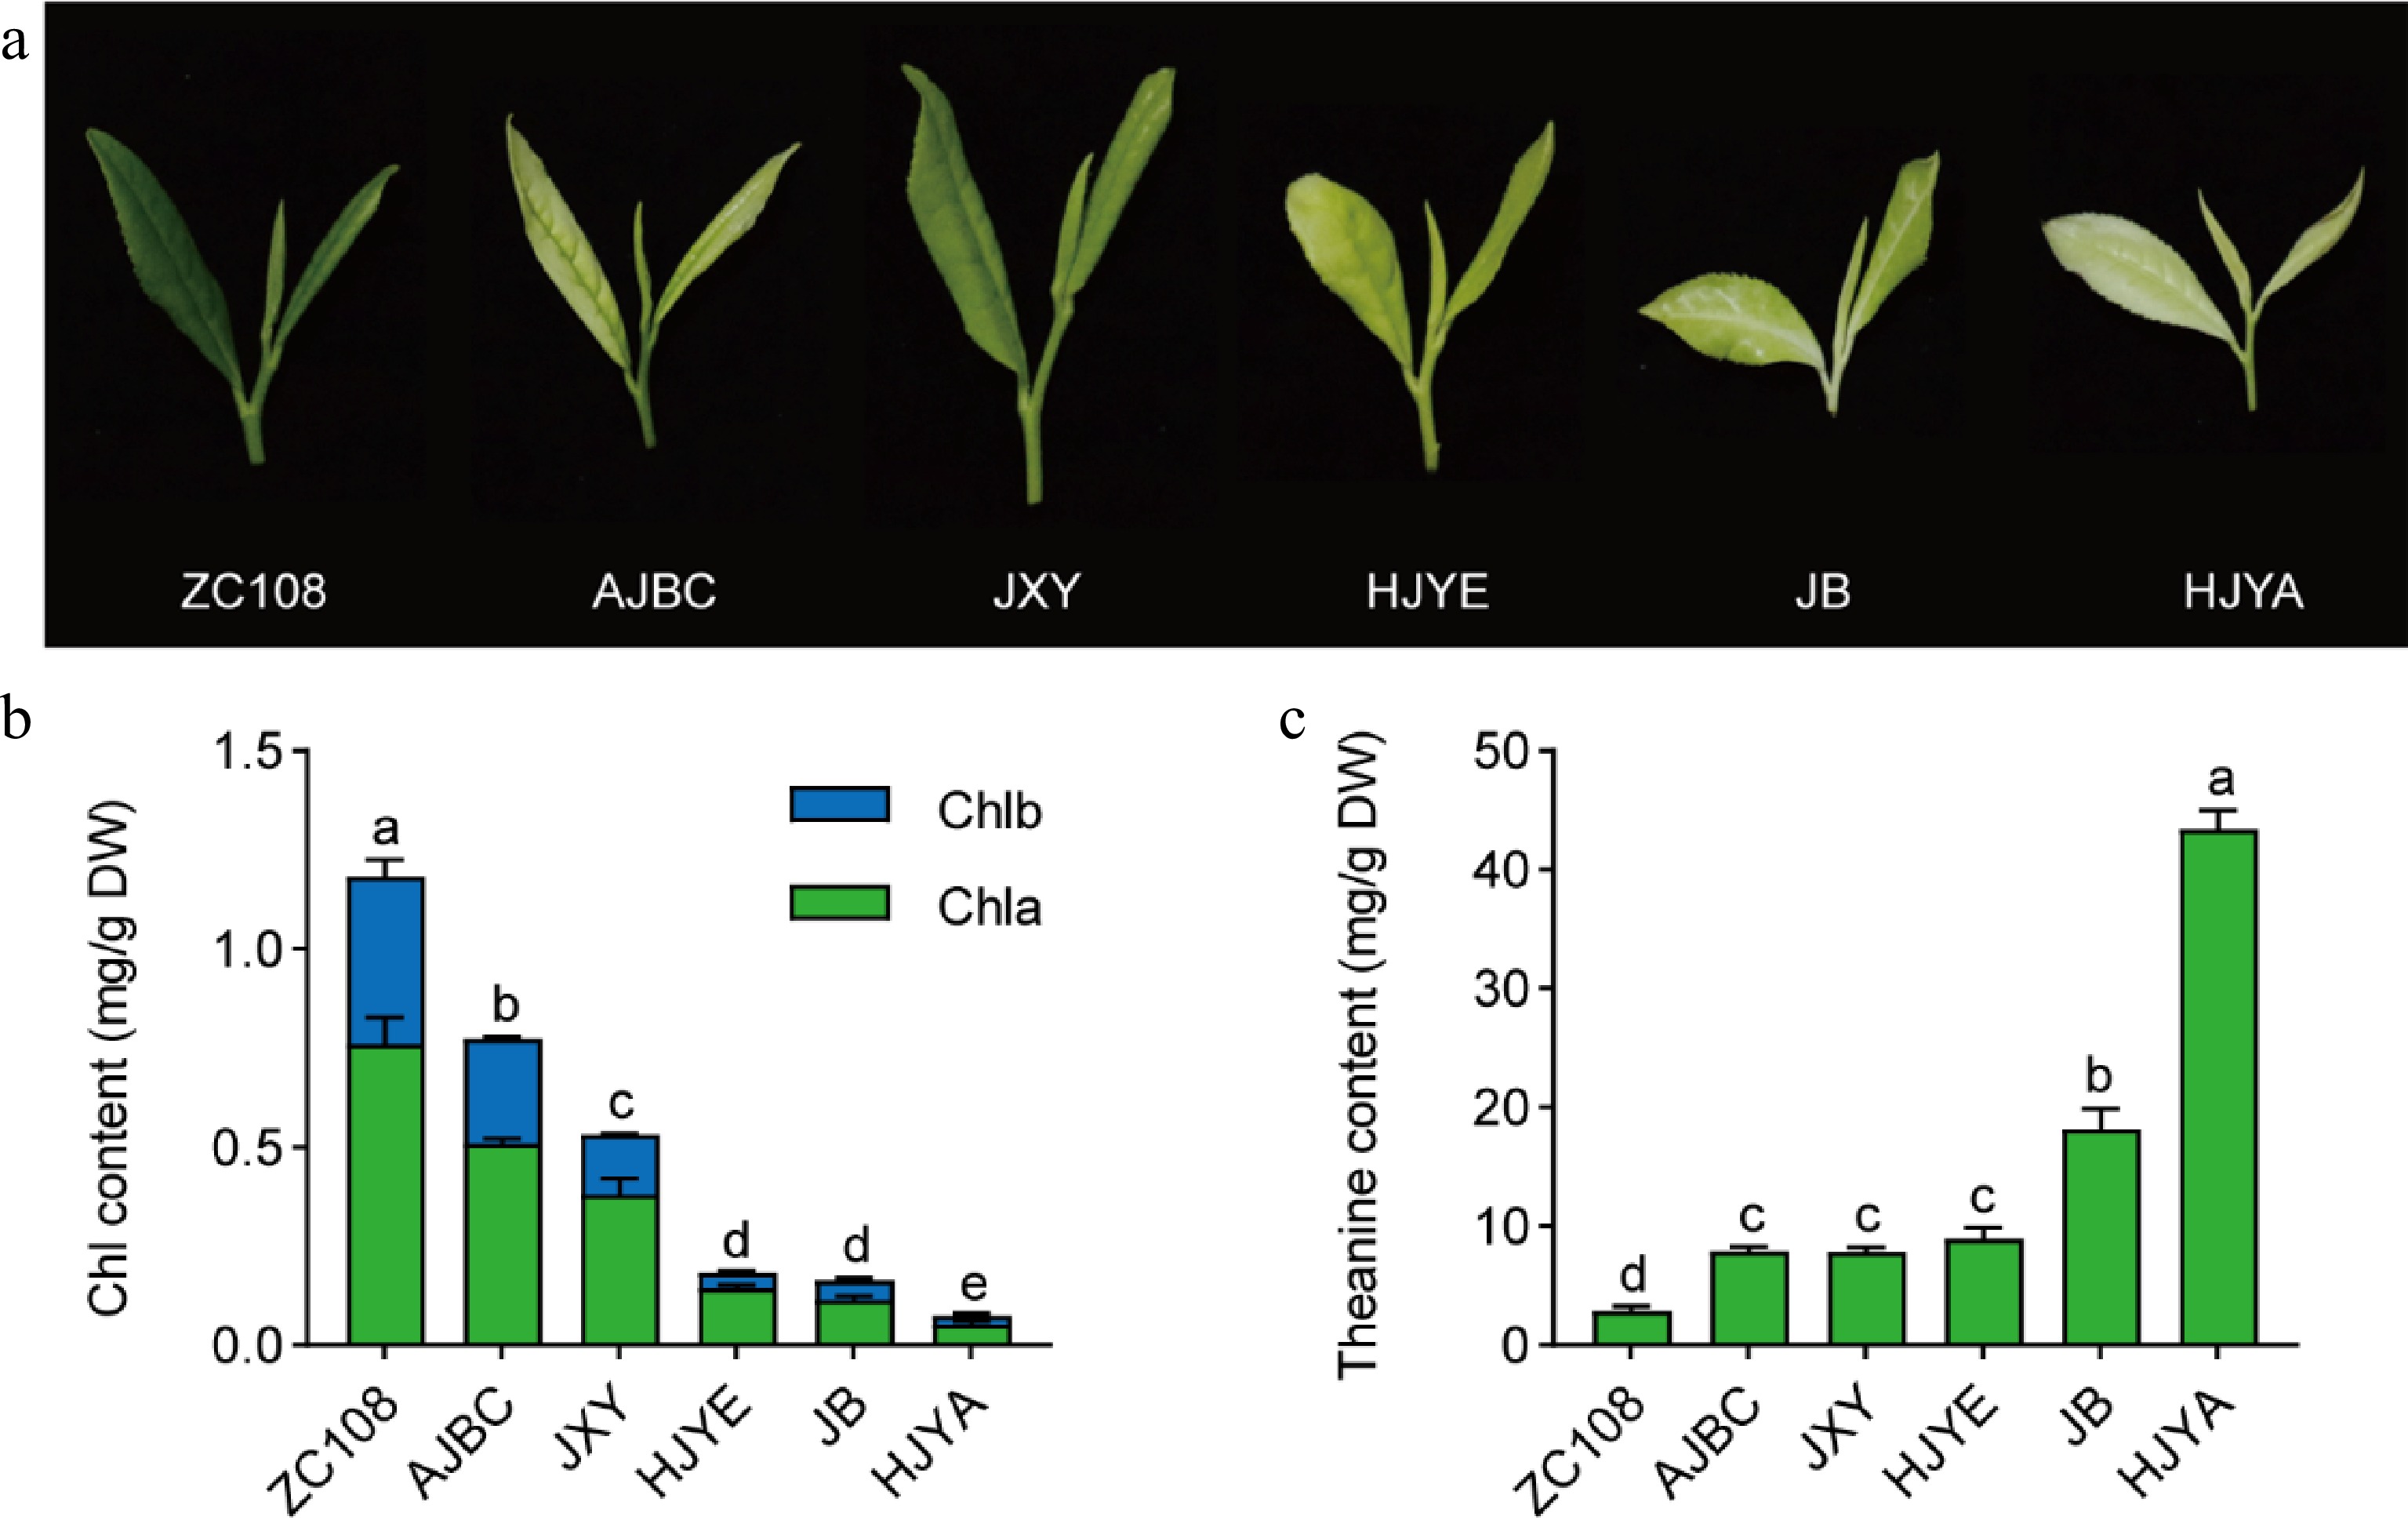
Figure 2.
(a) Phenotype of new shoots picked in April. (b) Chlorophyll contents in new shoots. Chla, chlorophyll a; Chlb, chlorophyll b; Chl, total chlorophyll. (c) The content of theanine in new shoots. Data were denoted as means ± SD (n = 3), statistical significance (p < 0.05) was marked with distinct letters, based on Duncan's multiple range test.
-
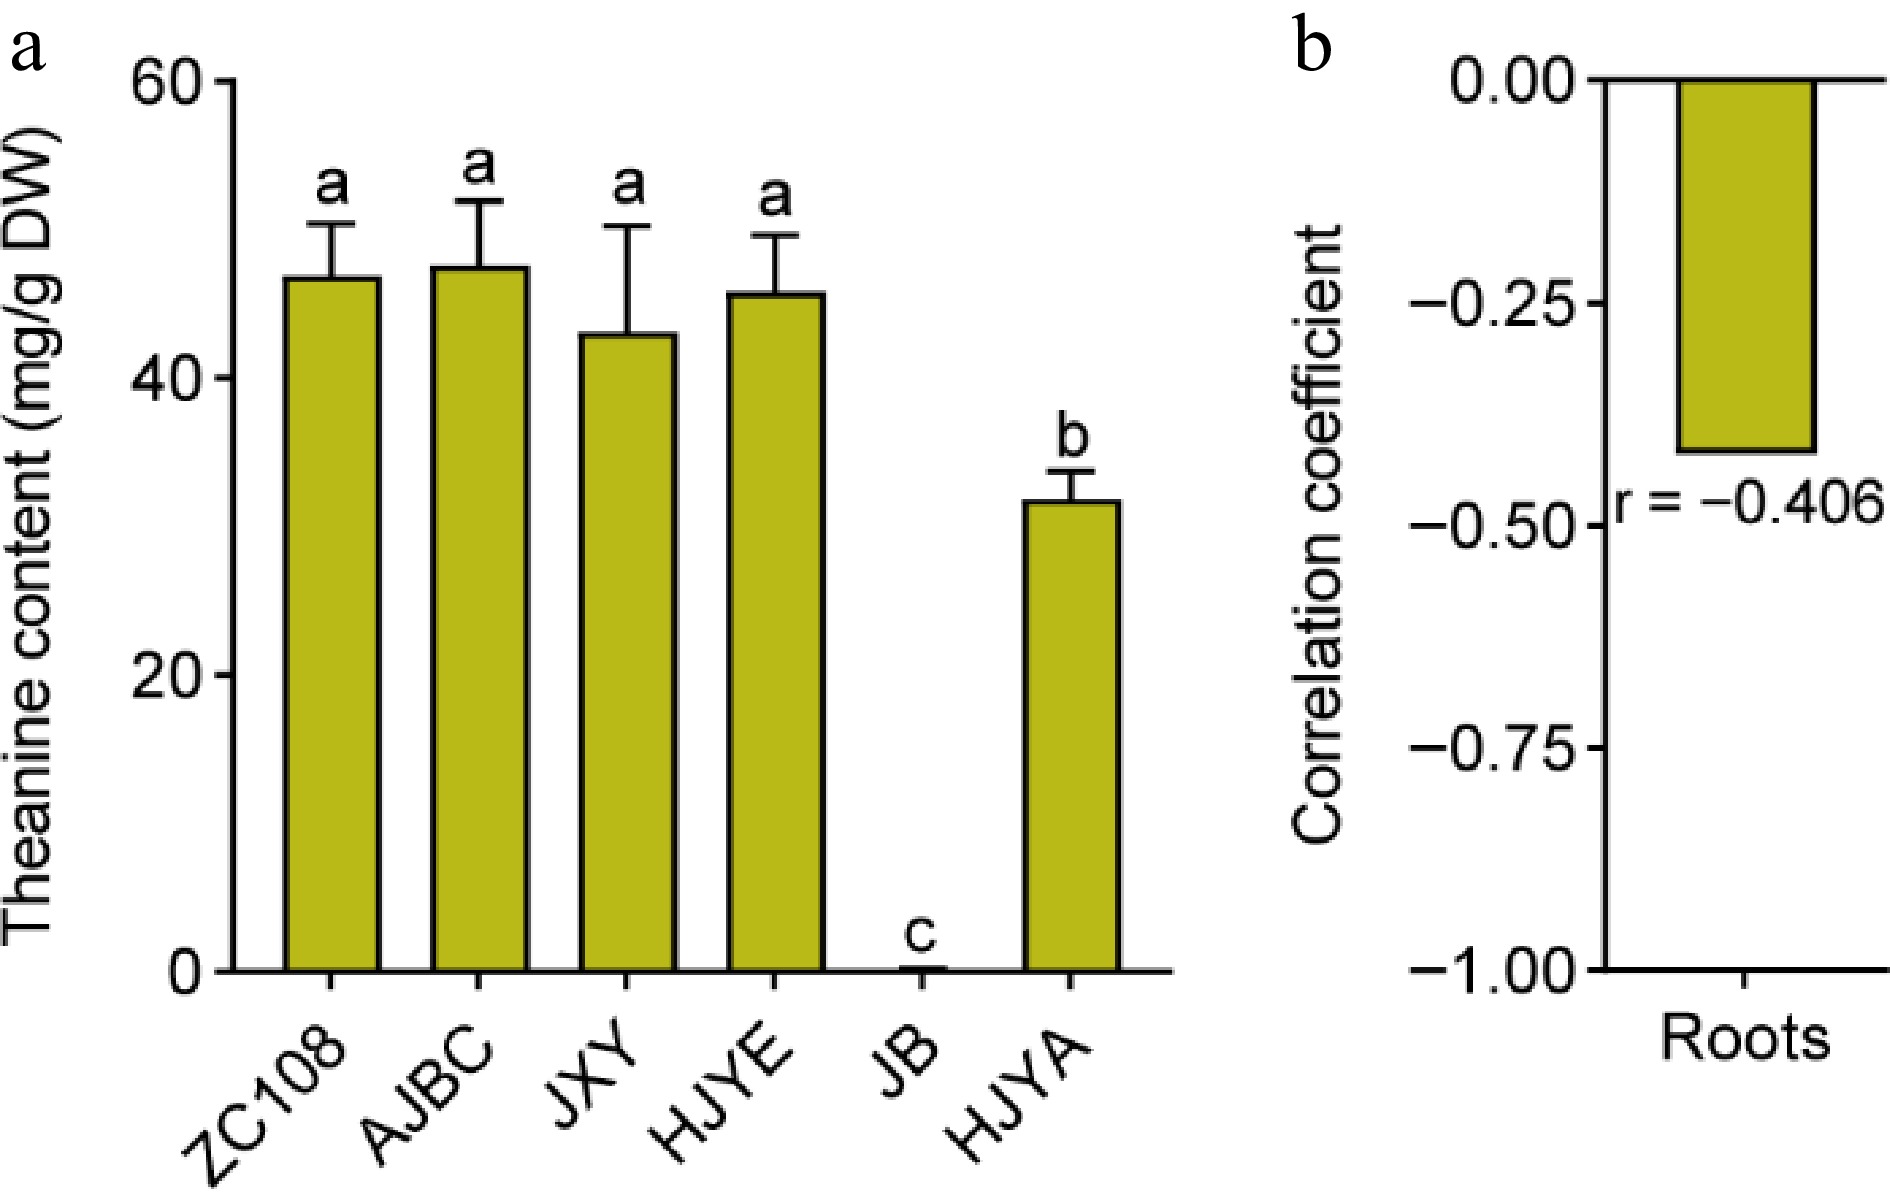
Figure 3.
(a) The content of theanine in roots of common green and albino/etiolated tea plant cultivars. Data were denoted as means ± SD (n = 3), statistical significance (p < 0.05) was marked with distinct letters, based on Duncan's multiple range test. (b) The correlation coefficient of theanine contents in roots with theanine contents in new shoots. Asterisks represent statistical significance determined by Duncan's multiple range test (* p < 0.05, ** p < 0.01.)
-
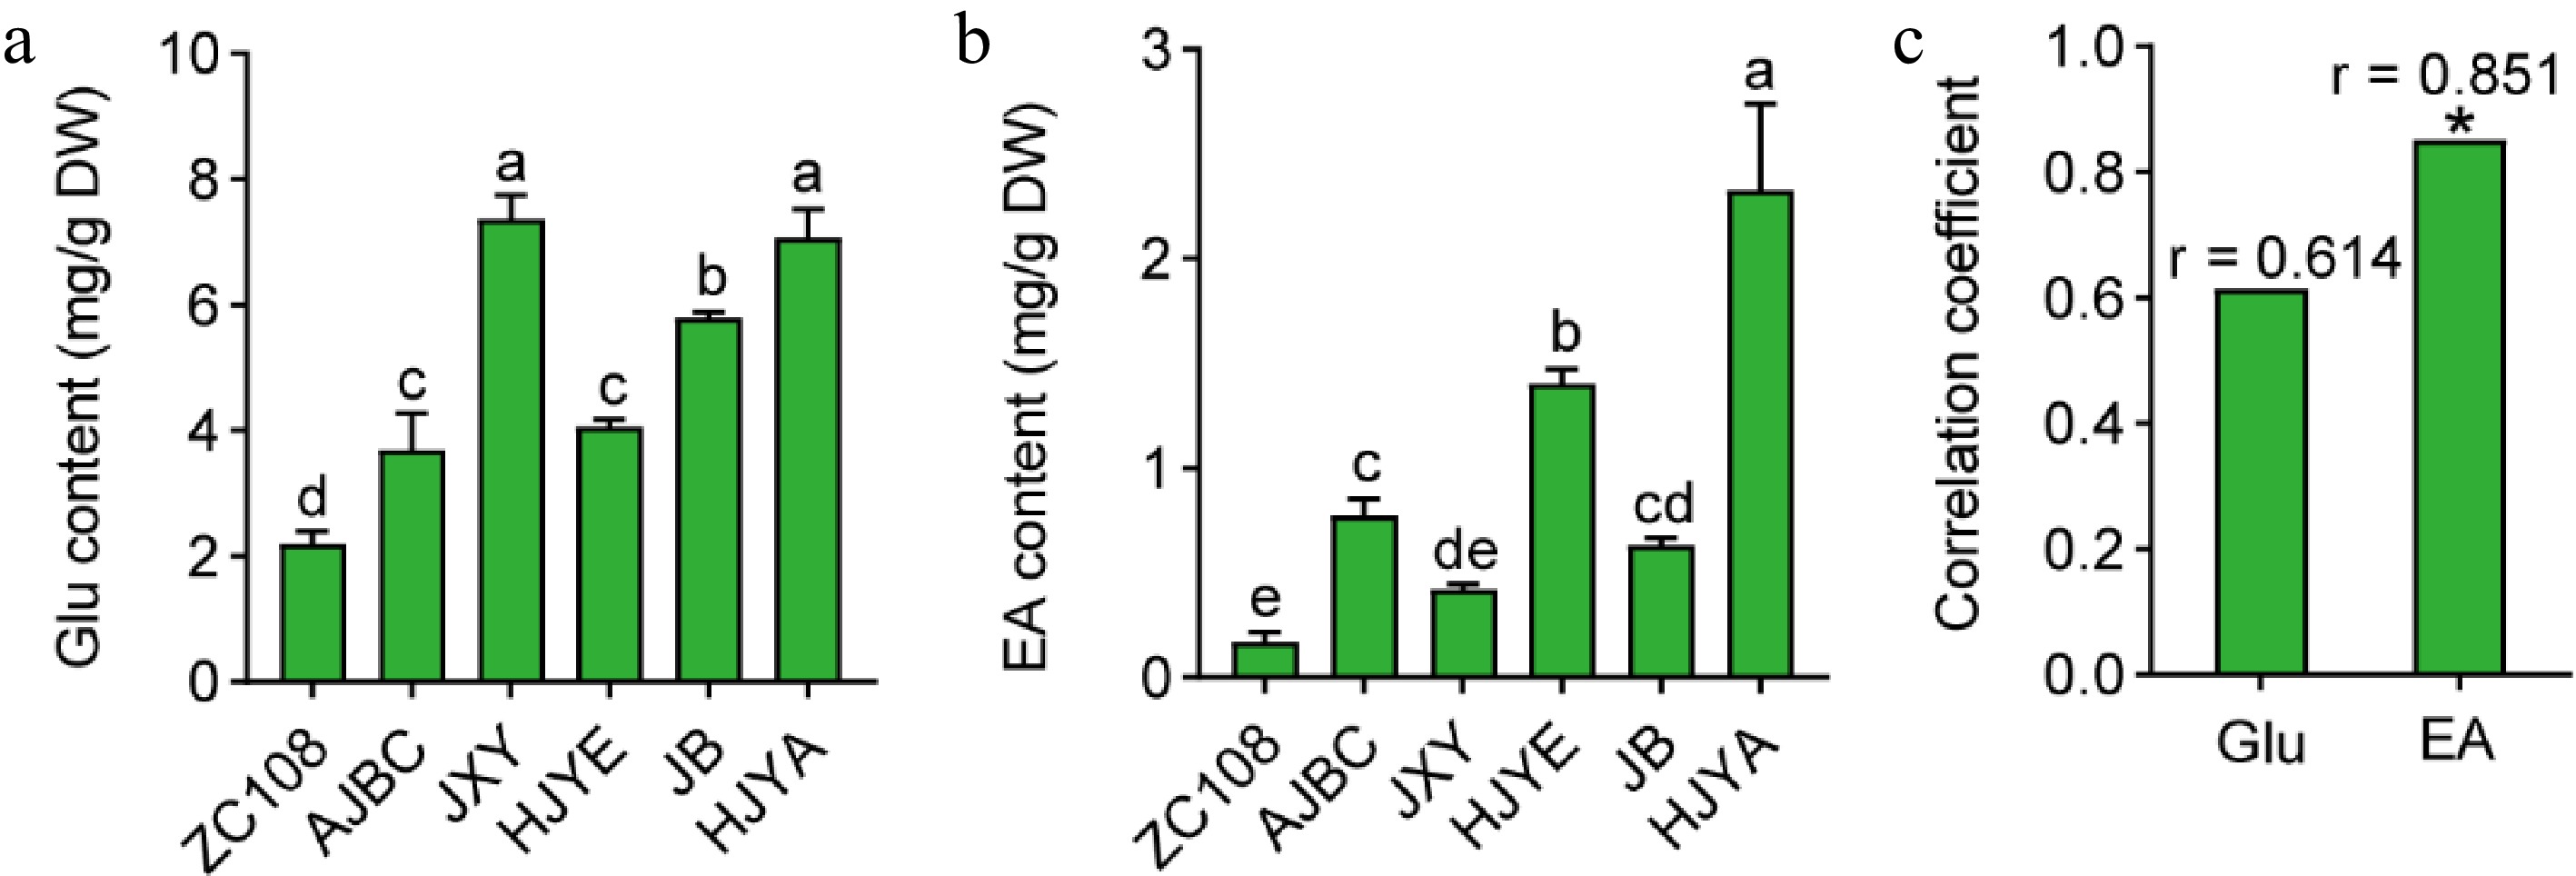
Figure 4.
(a) Glu content in shoots of different tea cultivars. (b) EA content in tea shoots. Data were denoted as means ± SD (n = 3), statistical significance (p < 0.05) was marked with distinct letters, based on Duncan's multiple range test. (c) Correlation coefficient between the contents of Glu and EA with the accumulation of theanine in tea shoots. Asterisks represent statistical significance determined by Duncan's multiple range test (* p < 0.05, ** p < 0.01.)
-
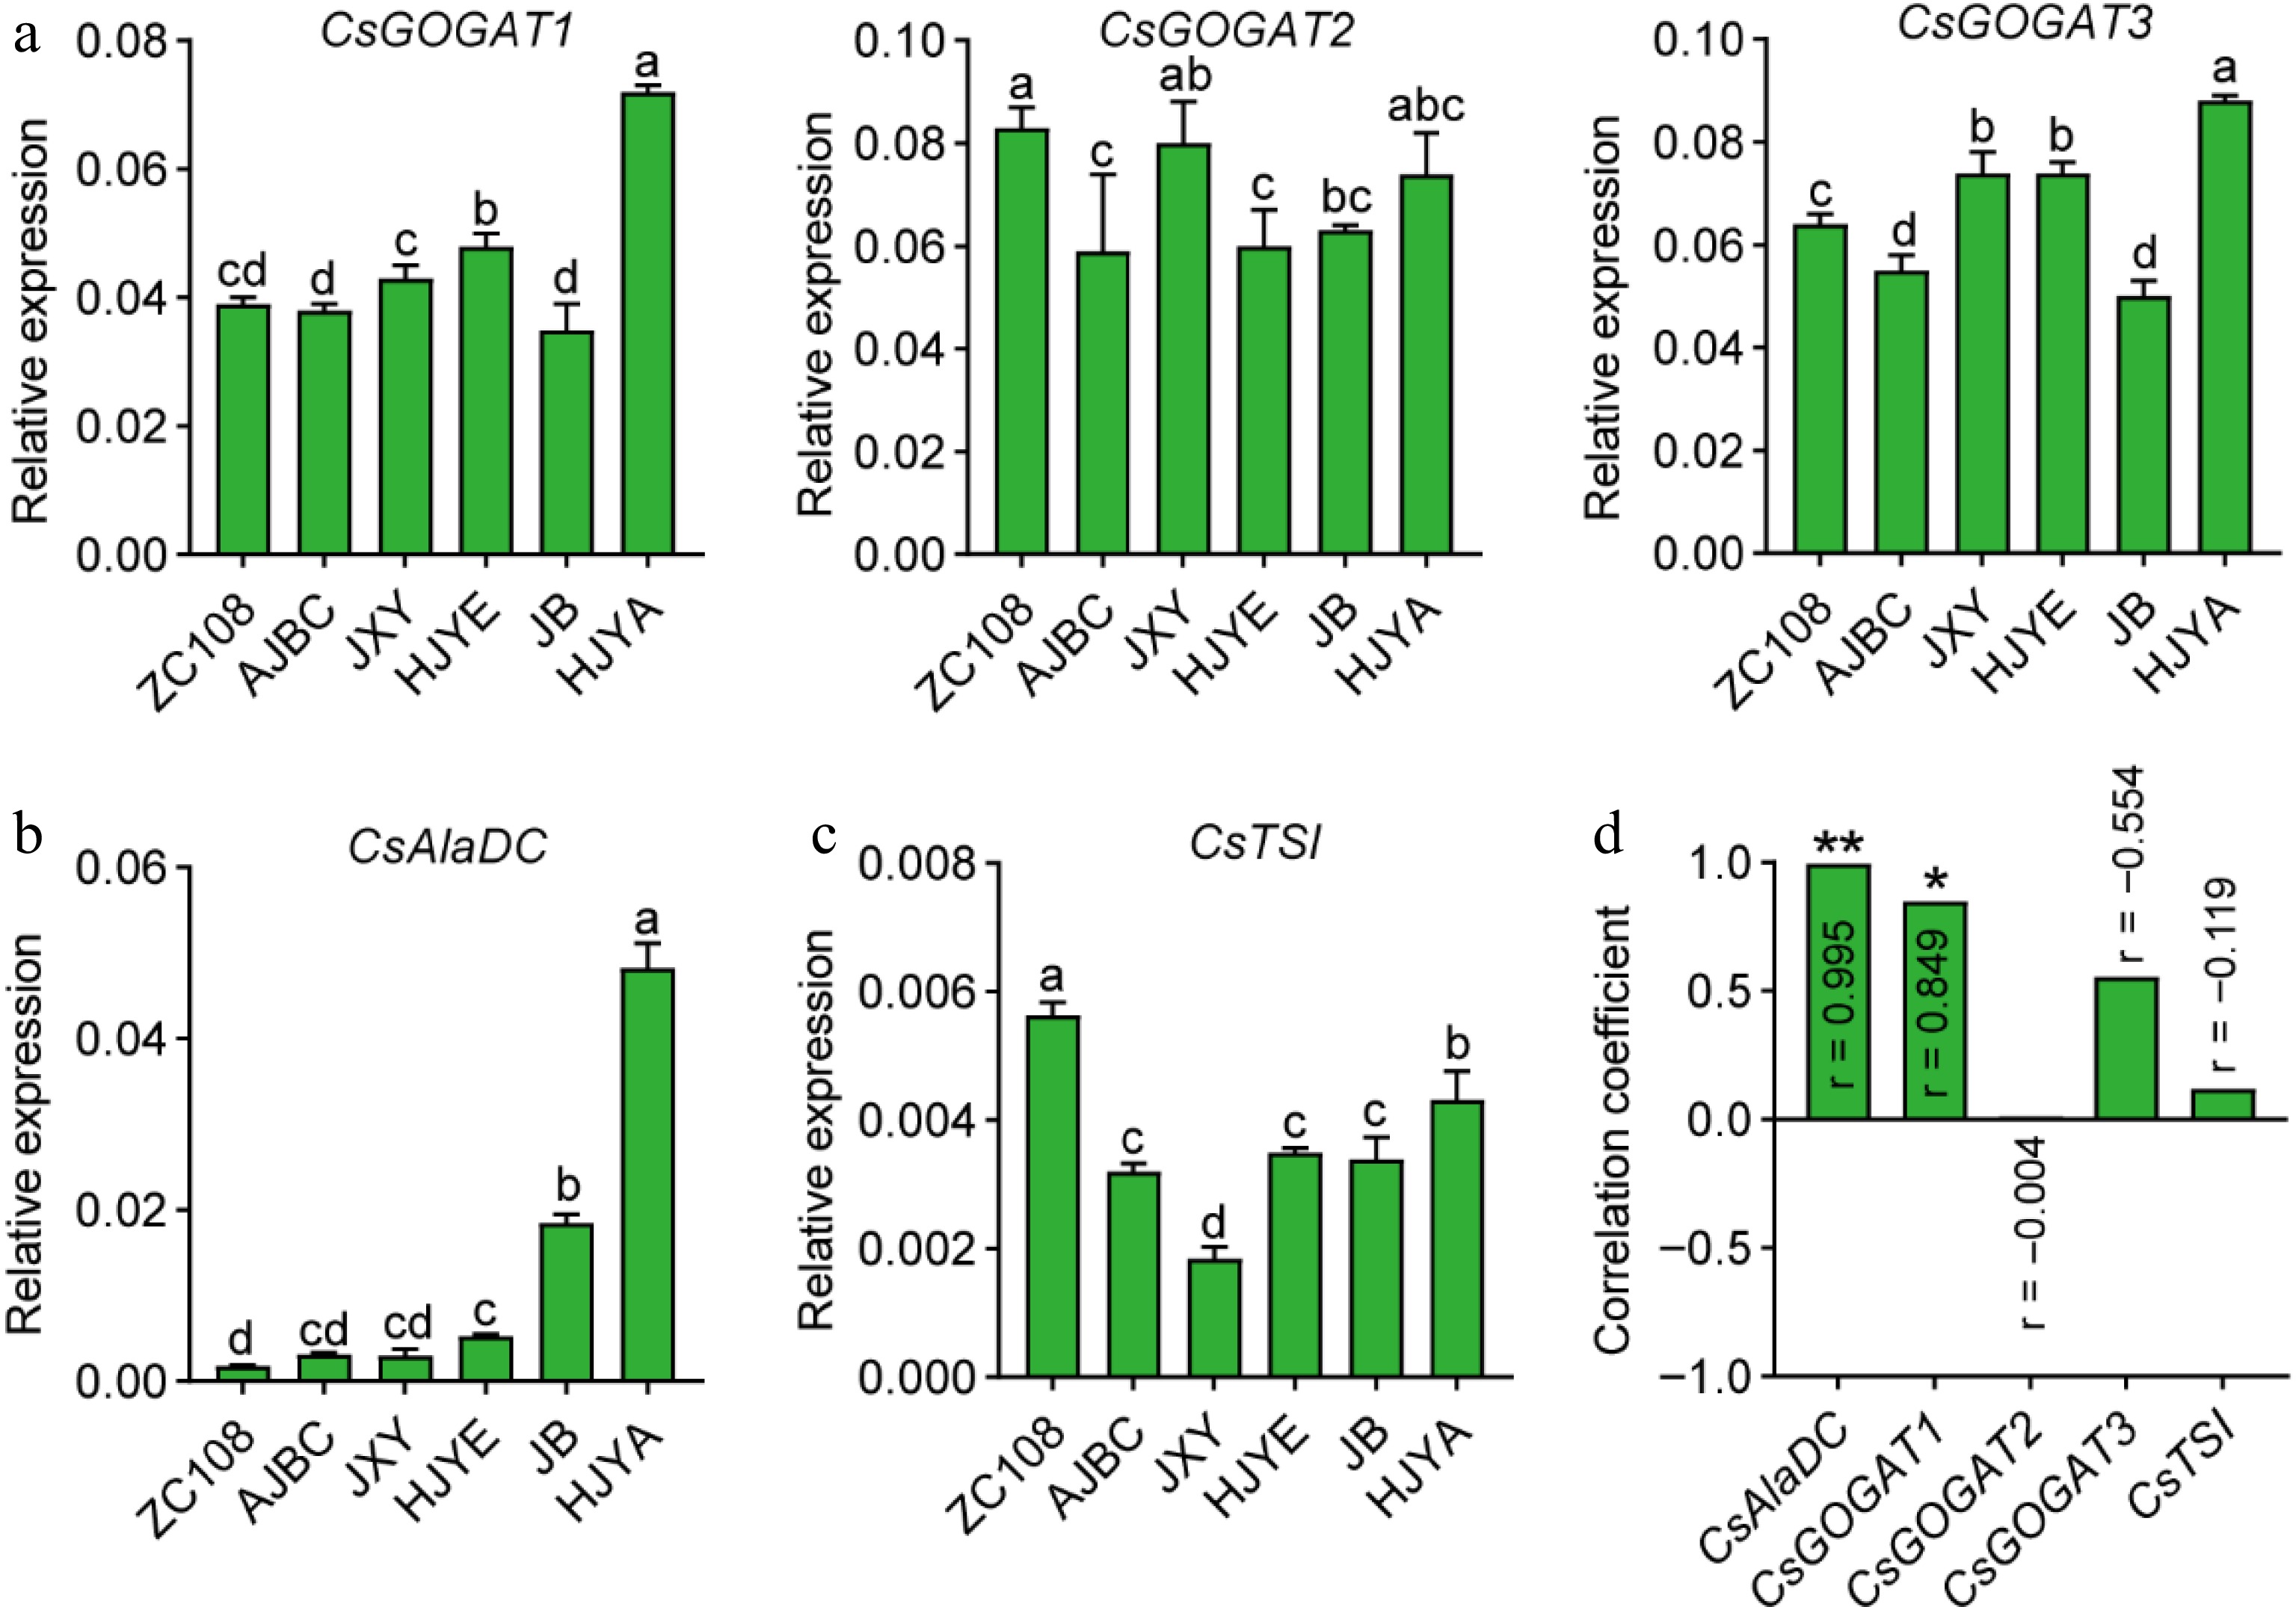
Figure 5.
(a) CsGOGATs expression in tea shoots. (b) CsAlaDC expression in tea shoots. (c) CsTSI expression in normal green and albino/etiolated tea shoots. CsGAPDH was applied as the internal standardization. Data were denoted as means ± SD (n = 3), statistical significance (p < 0.05) was marked with distinct letters, based on Duncan's multiple range test. (d) The correlation coefficient between the expression levels of theanine biosynthesis genes with the content of theanine in tea shoots. Asterisks represent statistical significance determined by Duncan's multiple range test (* p < 0.05, ** p < 0.01.)
-
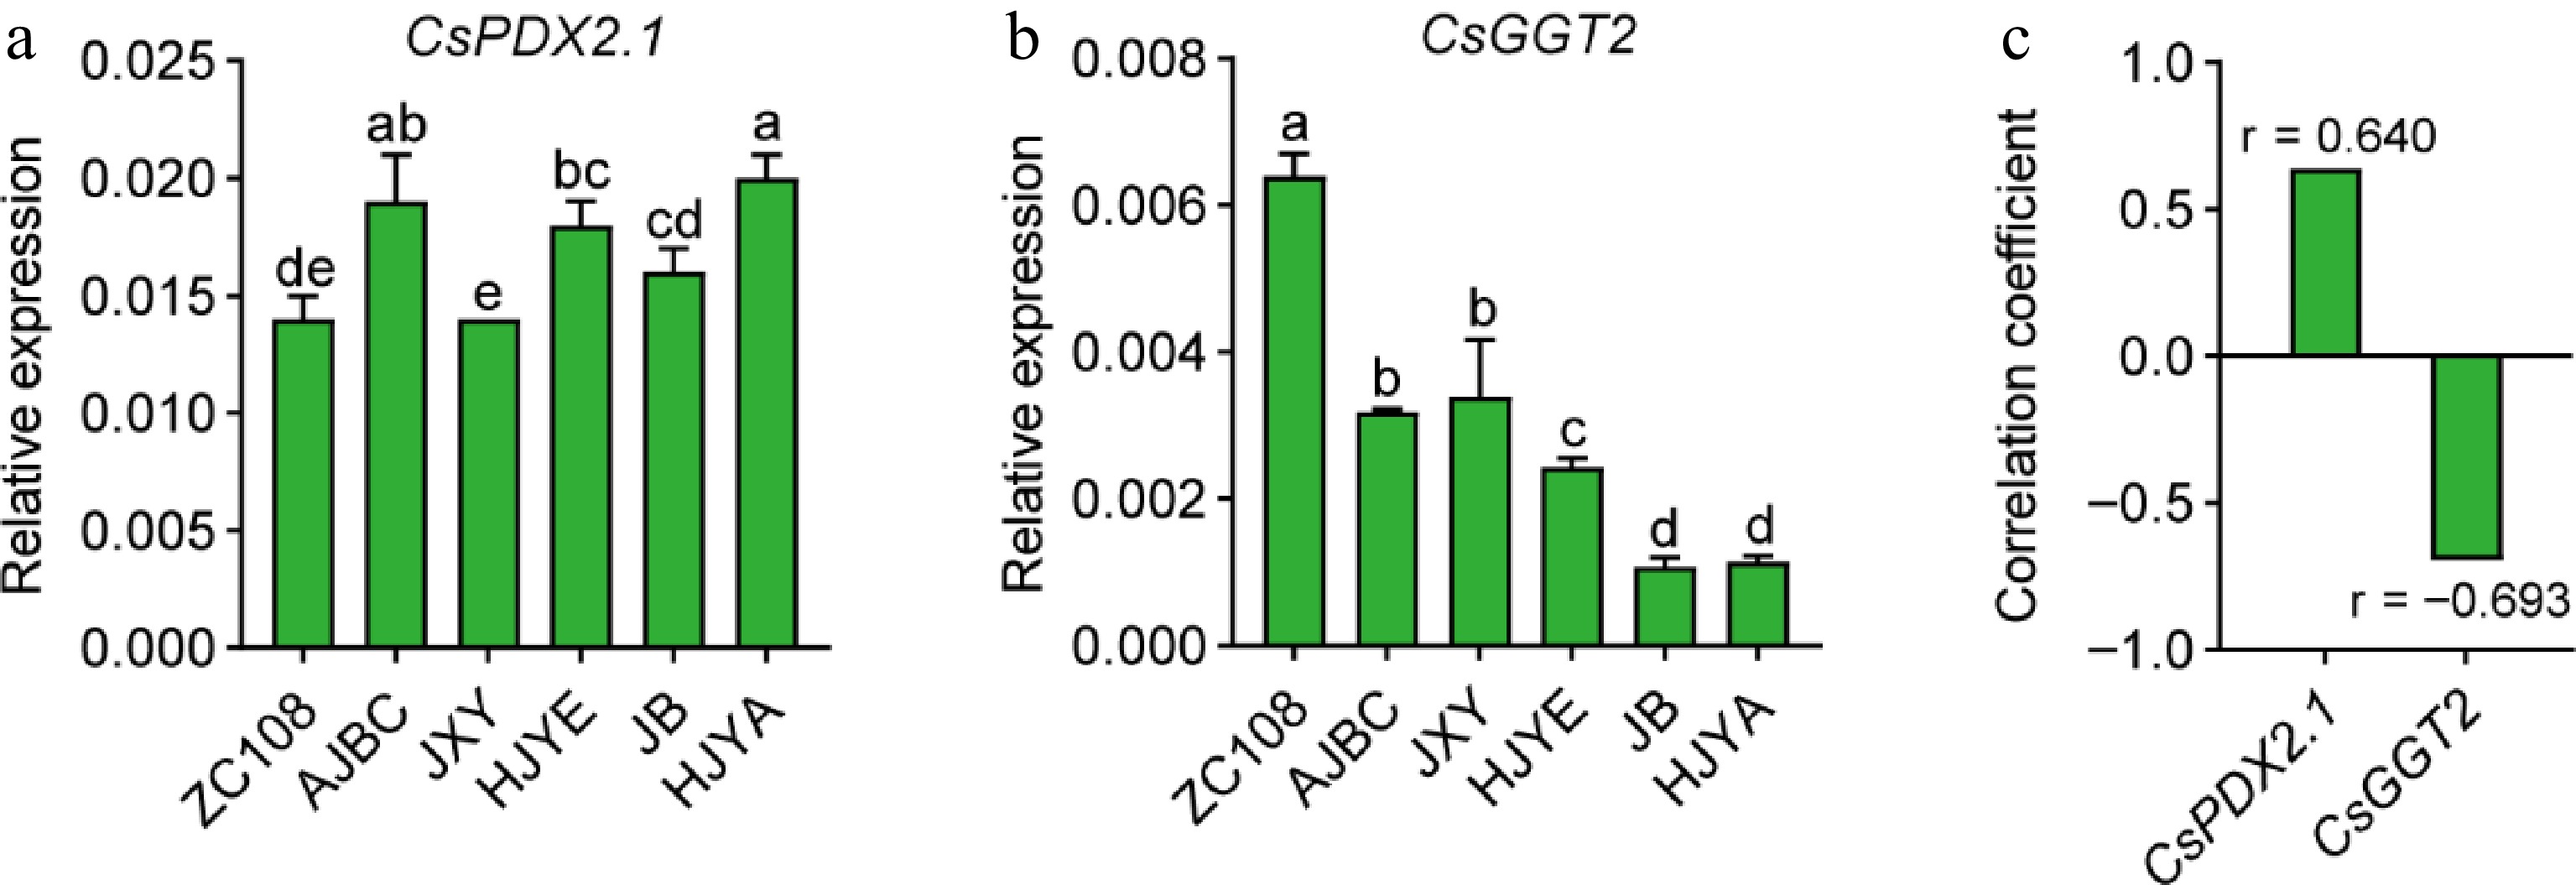
Figure 6.
(a) CsPDX2.1 expression tea shoots, (b) CsGGT2 expression in tea shoots. CsGAPDH was applied as the internal standardization. Data were denoted as means ± SD (n = 3), statistical significance (p < 0.05) was marked with distinct letters, based on Duncan's multiple range test. (c) The correlation coefficient between the CsPDX2.1 and CsGGT2 expression with the content of theanine in tea shoots. Asterisks represent statistical significance determined by Duncan's multiple range test (* p < 0.05, ** p < 0.01.).
-
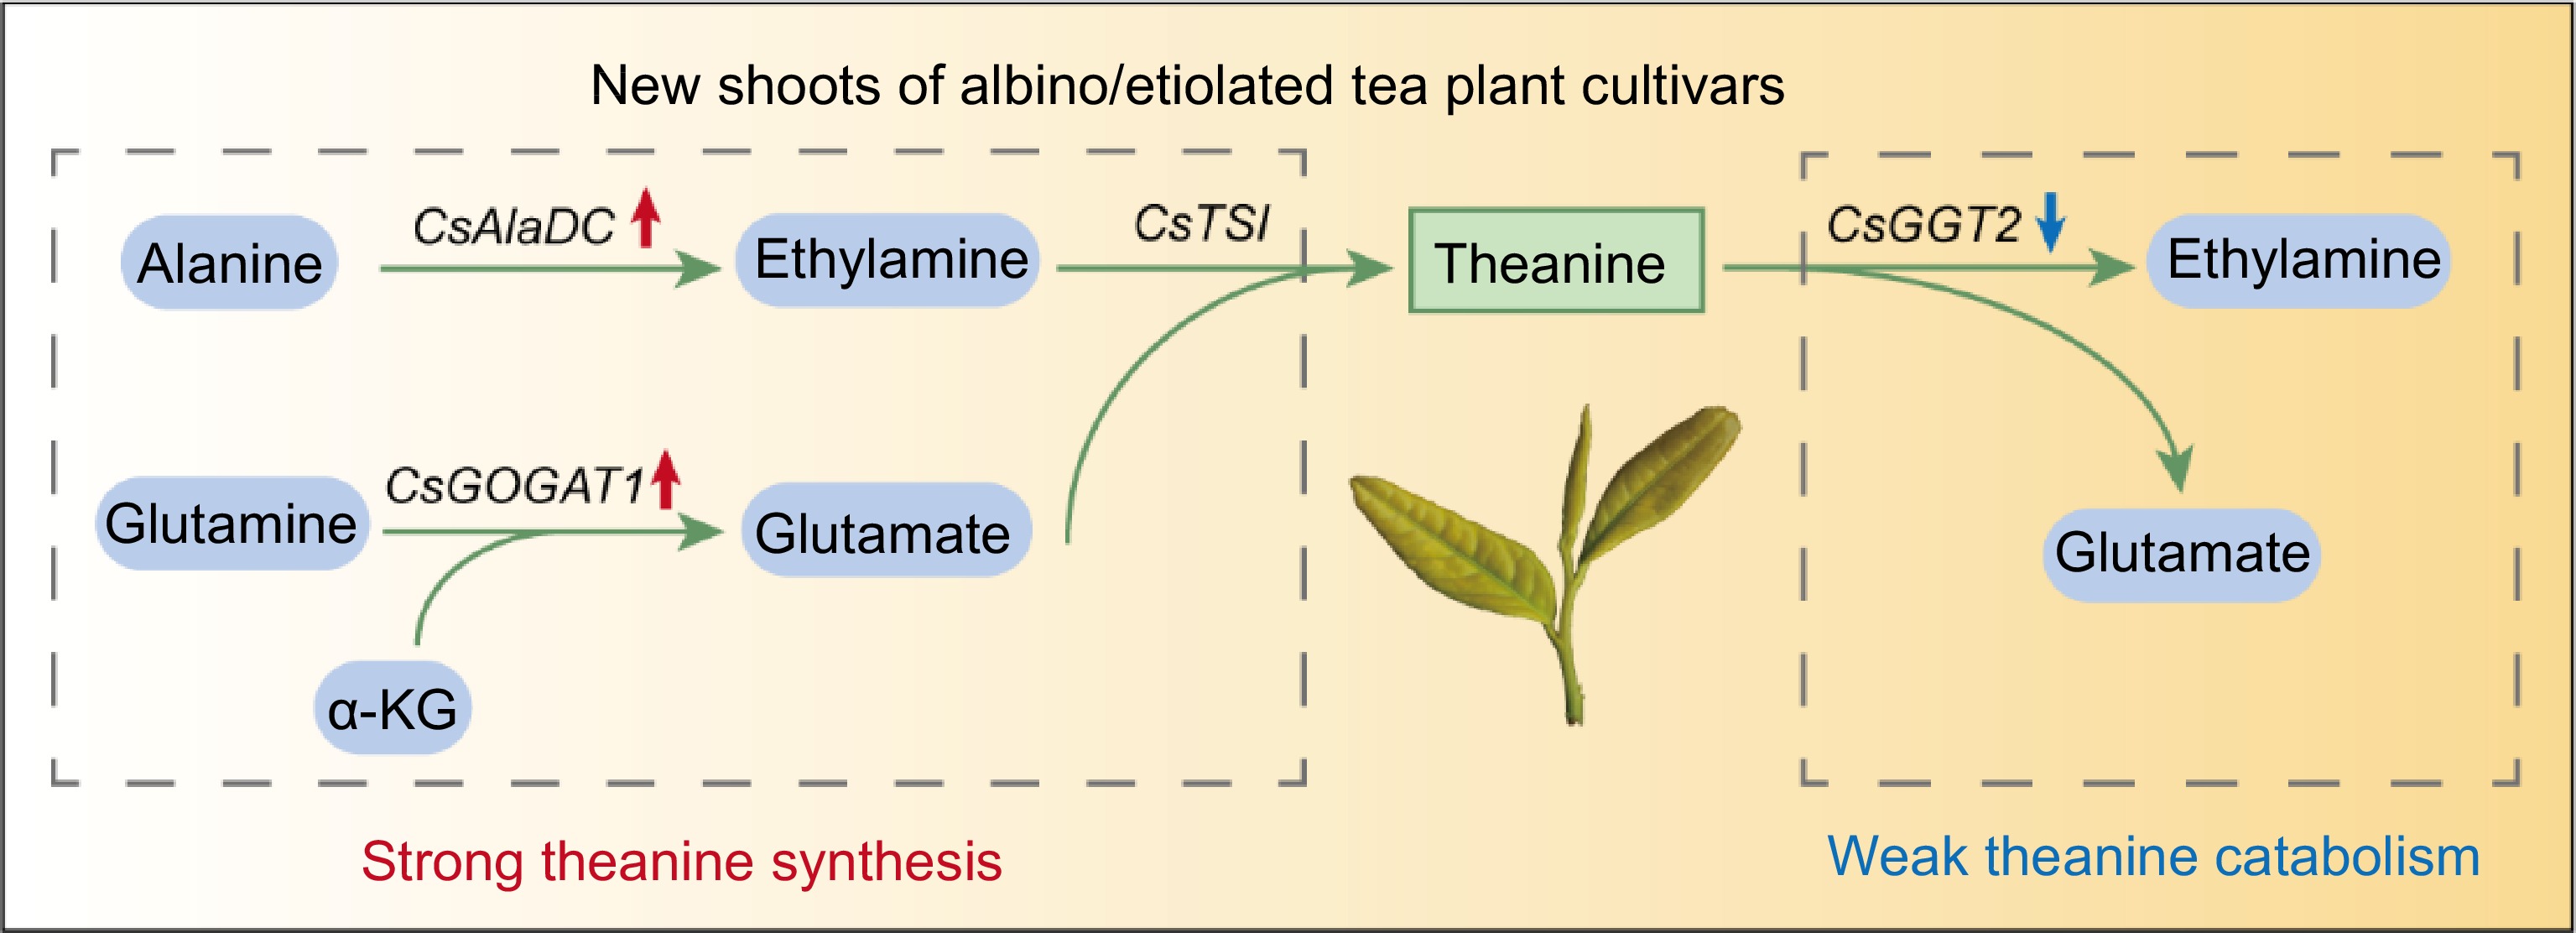
Figure 7.
Proposed model for high theanine accumulation in albino/etiolated tea shoots. α-KG, α-Ketoglutarate. The red and blue arrows indicate up-regulated and down-regulated gene expression in albino/etiolated tea shoots, respectively. In the albino/etiolated tea shoots, CsAlaDC-catalyzed EA biosynthesis and CsGOGAT1-catalyzed Glu biosynthesis were more active, CsGGT2-catalyzed theanine catabolism was weaker. Therefore, we proposed that the strong biosynthesis and weak catabolism of theanine in shoots both contribute to the high accumulation of theanine in albino/etiolated tea shoots.
Figures
(7)
Tables
(0)