-
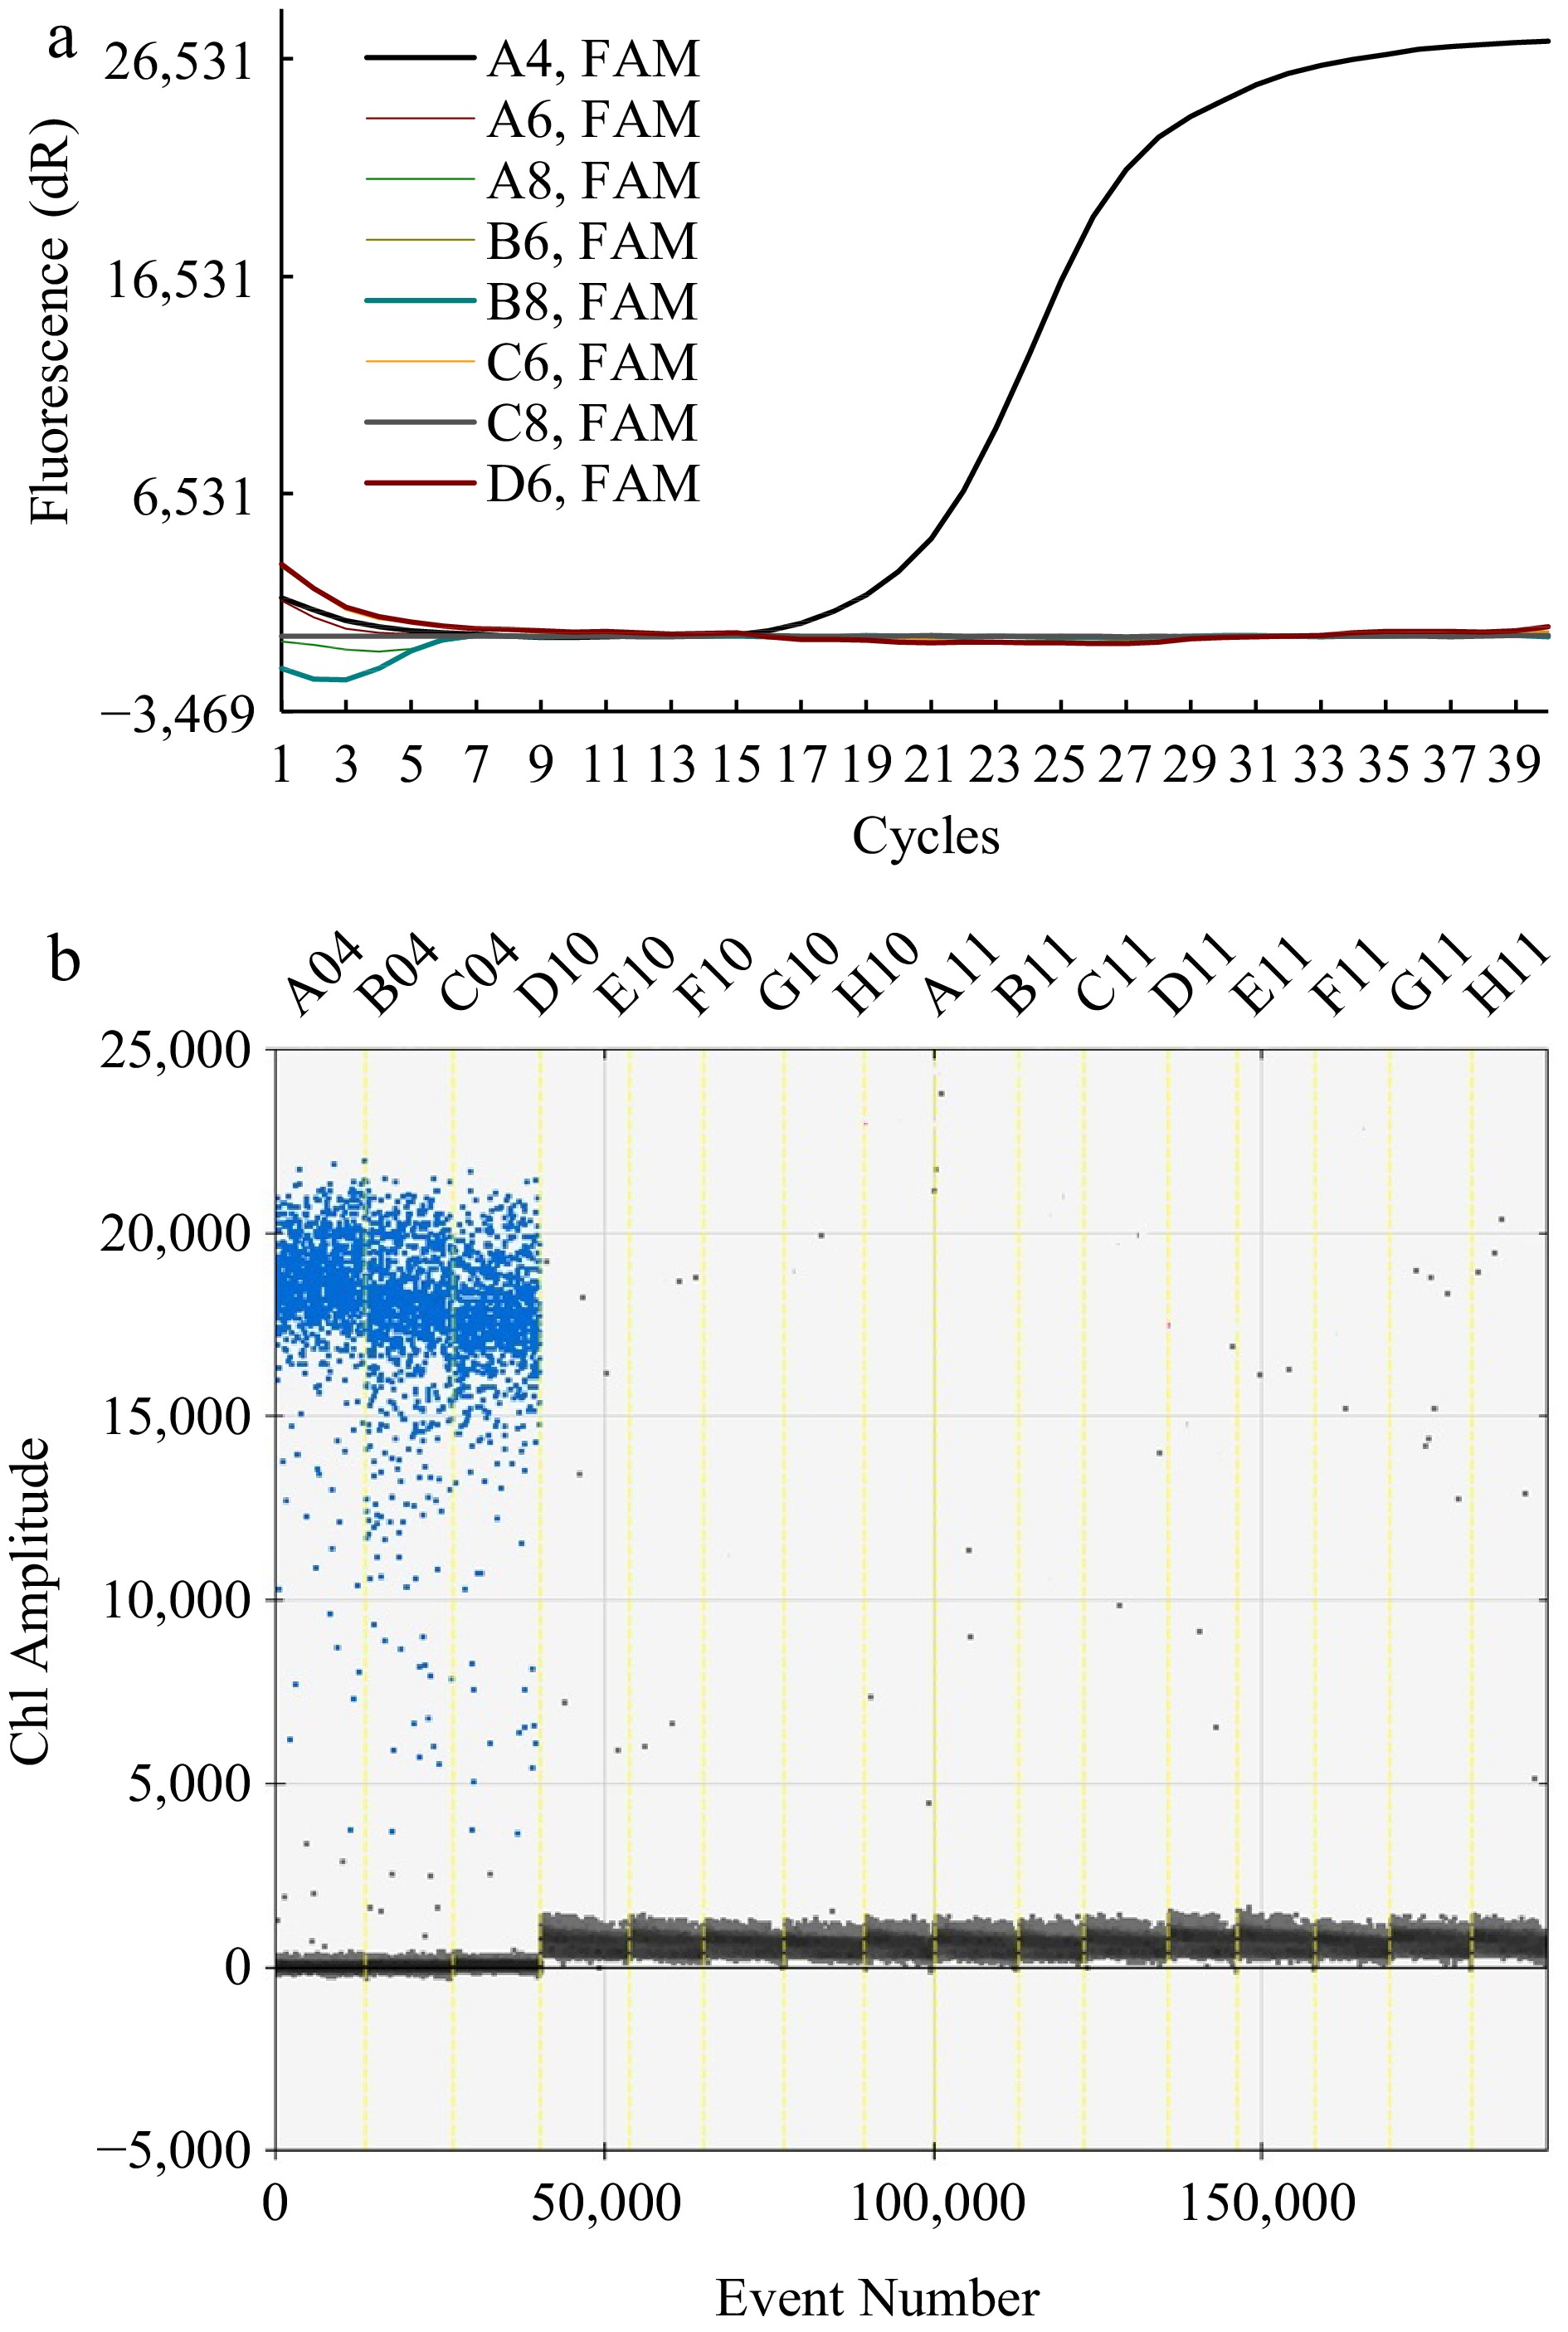
Figure 1.
Specific detection of primers used for the RT-qPCR and ddPCR methods. (a) Fluorescence intensity in response to amplification cycles with RT-qPCR methods. The curve with amplification was for A4 (F. solani) and that without amplification was for the negative strains (A6~D6). (b) Ch1 amplitude in response to event number using the ddPCR method. The blue signals concentrated across A04, B04, and C04 reflected the DNA of F. solani while those scattered across D10~H11 represented the DNA of the negative strain, including S. ginseng (D10, E10), I. robusta (F10, G10), A. Panax (H10, A11), B. cinerea (B11, C11), F. oxysporum (D11, E11), F. graminearum (F11, G11), and F. moniliforme (H11).
-
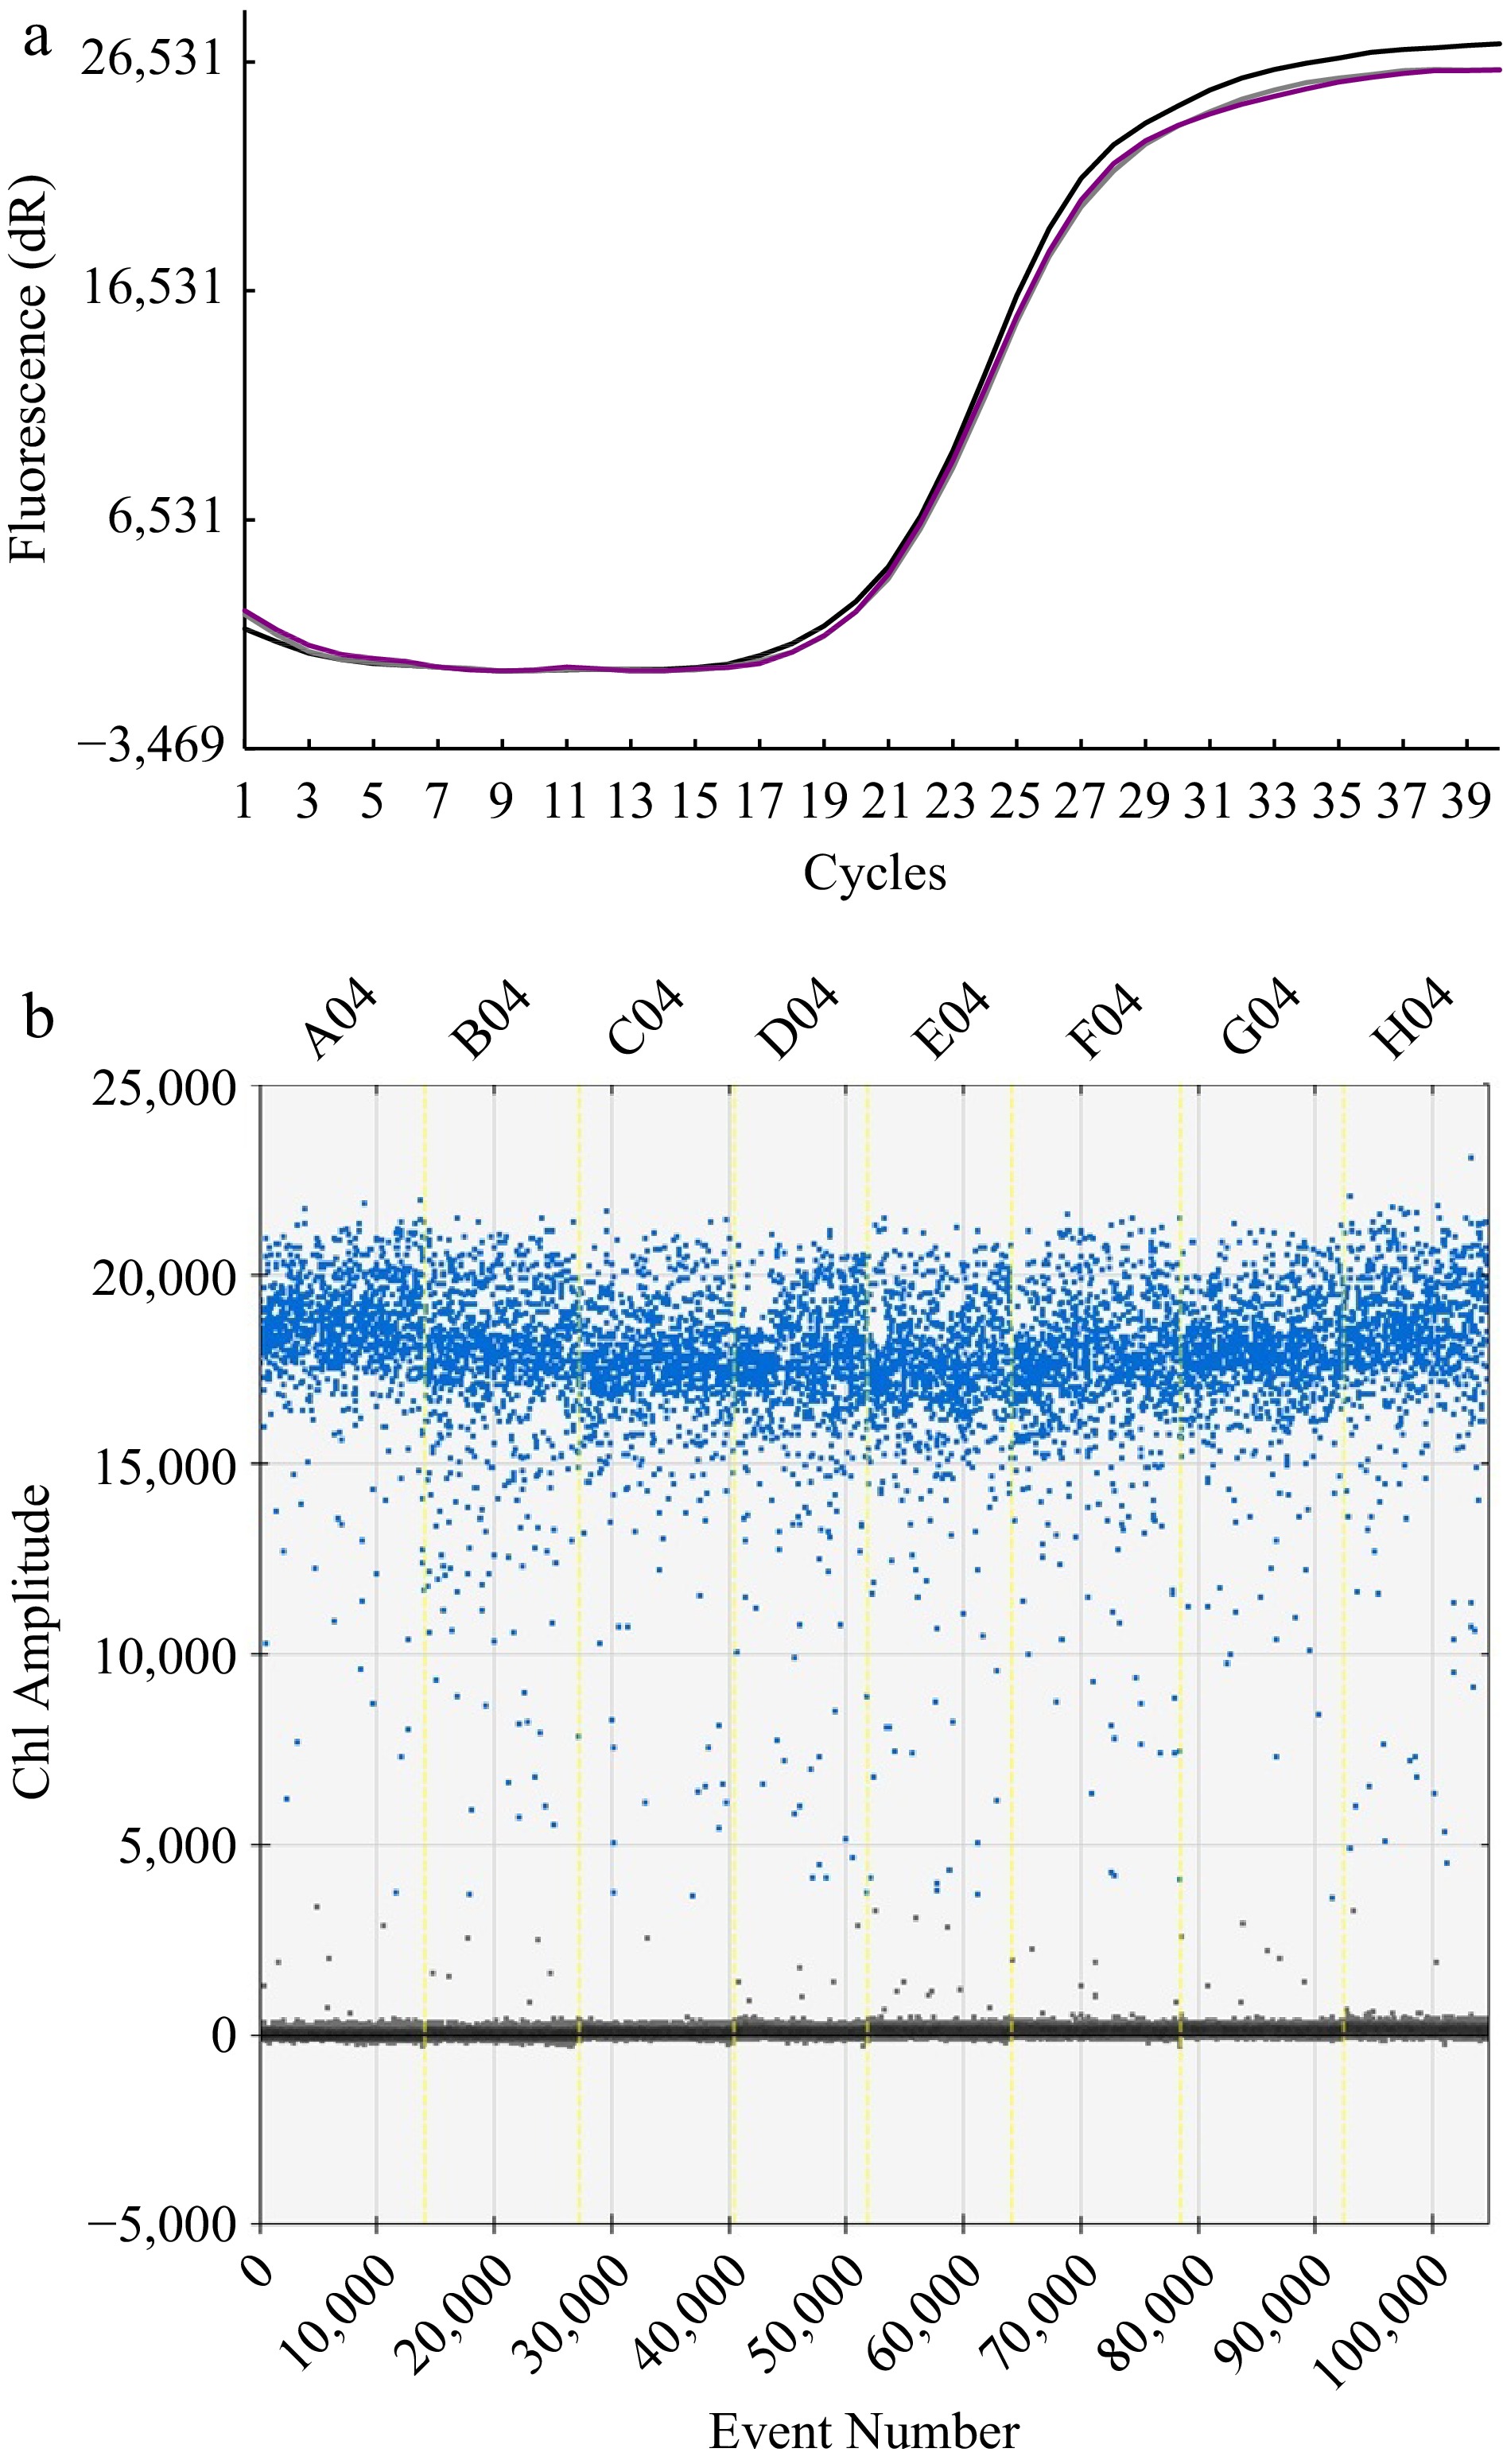
Figure 2.
The test for reproducibility of the methods. (a) Florescence response to repeated cycle of amplification with RT-qPCR method. Note that the curves of three independent runs are almost consistent. (b) Ch1 amplitude response to event number.
-
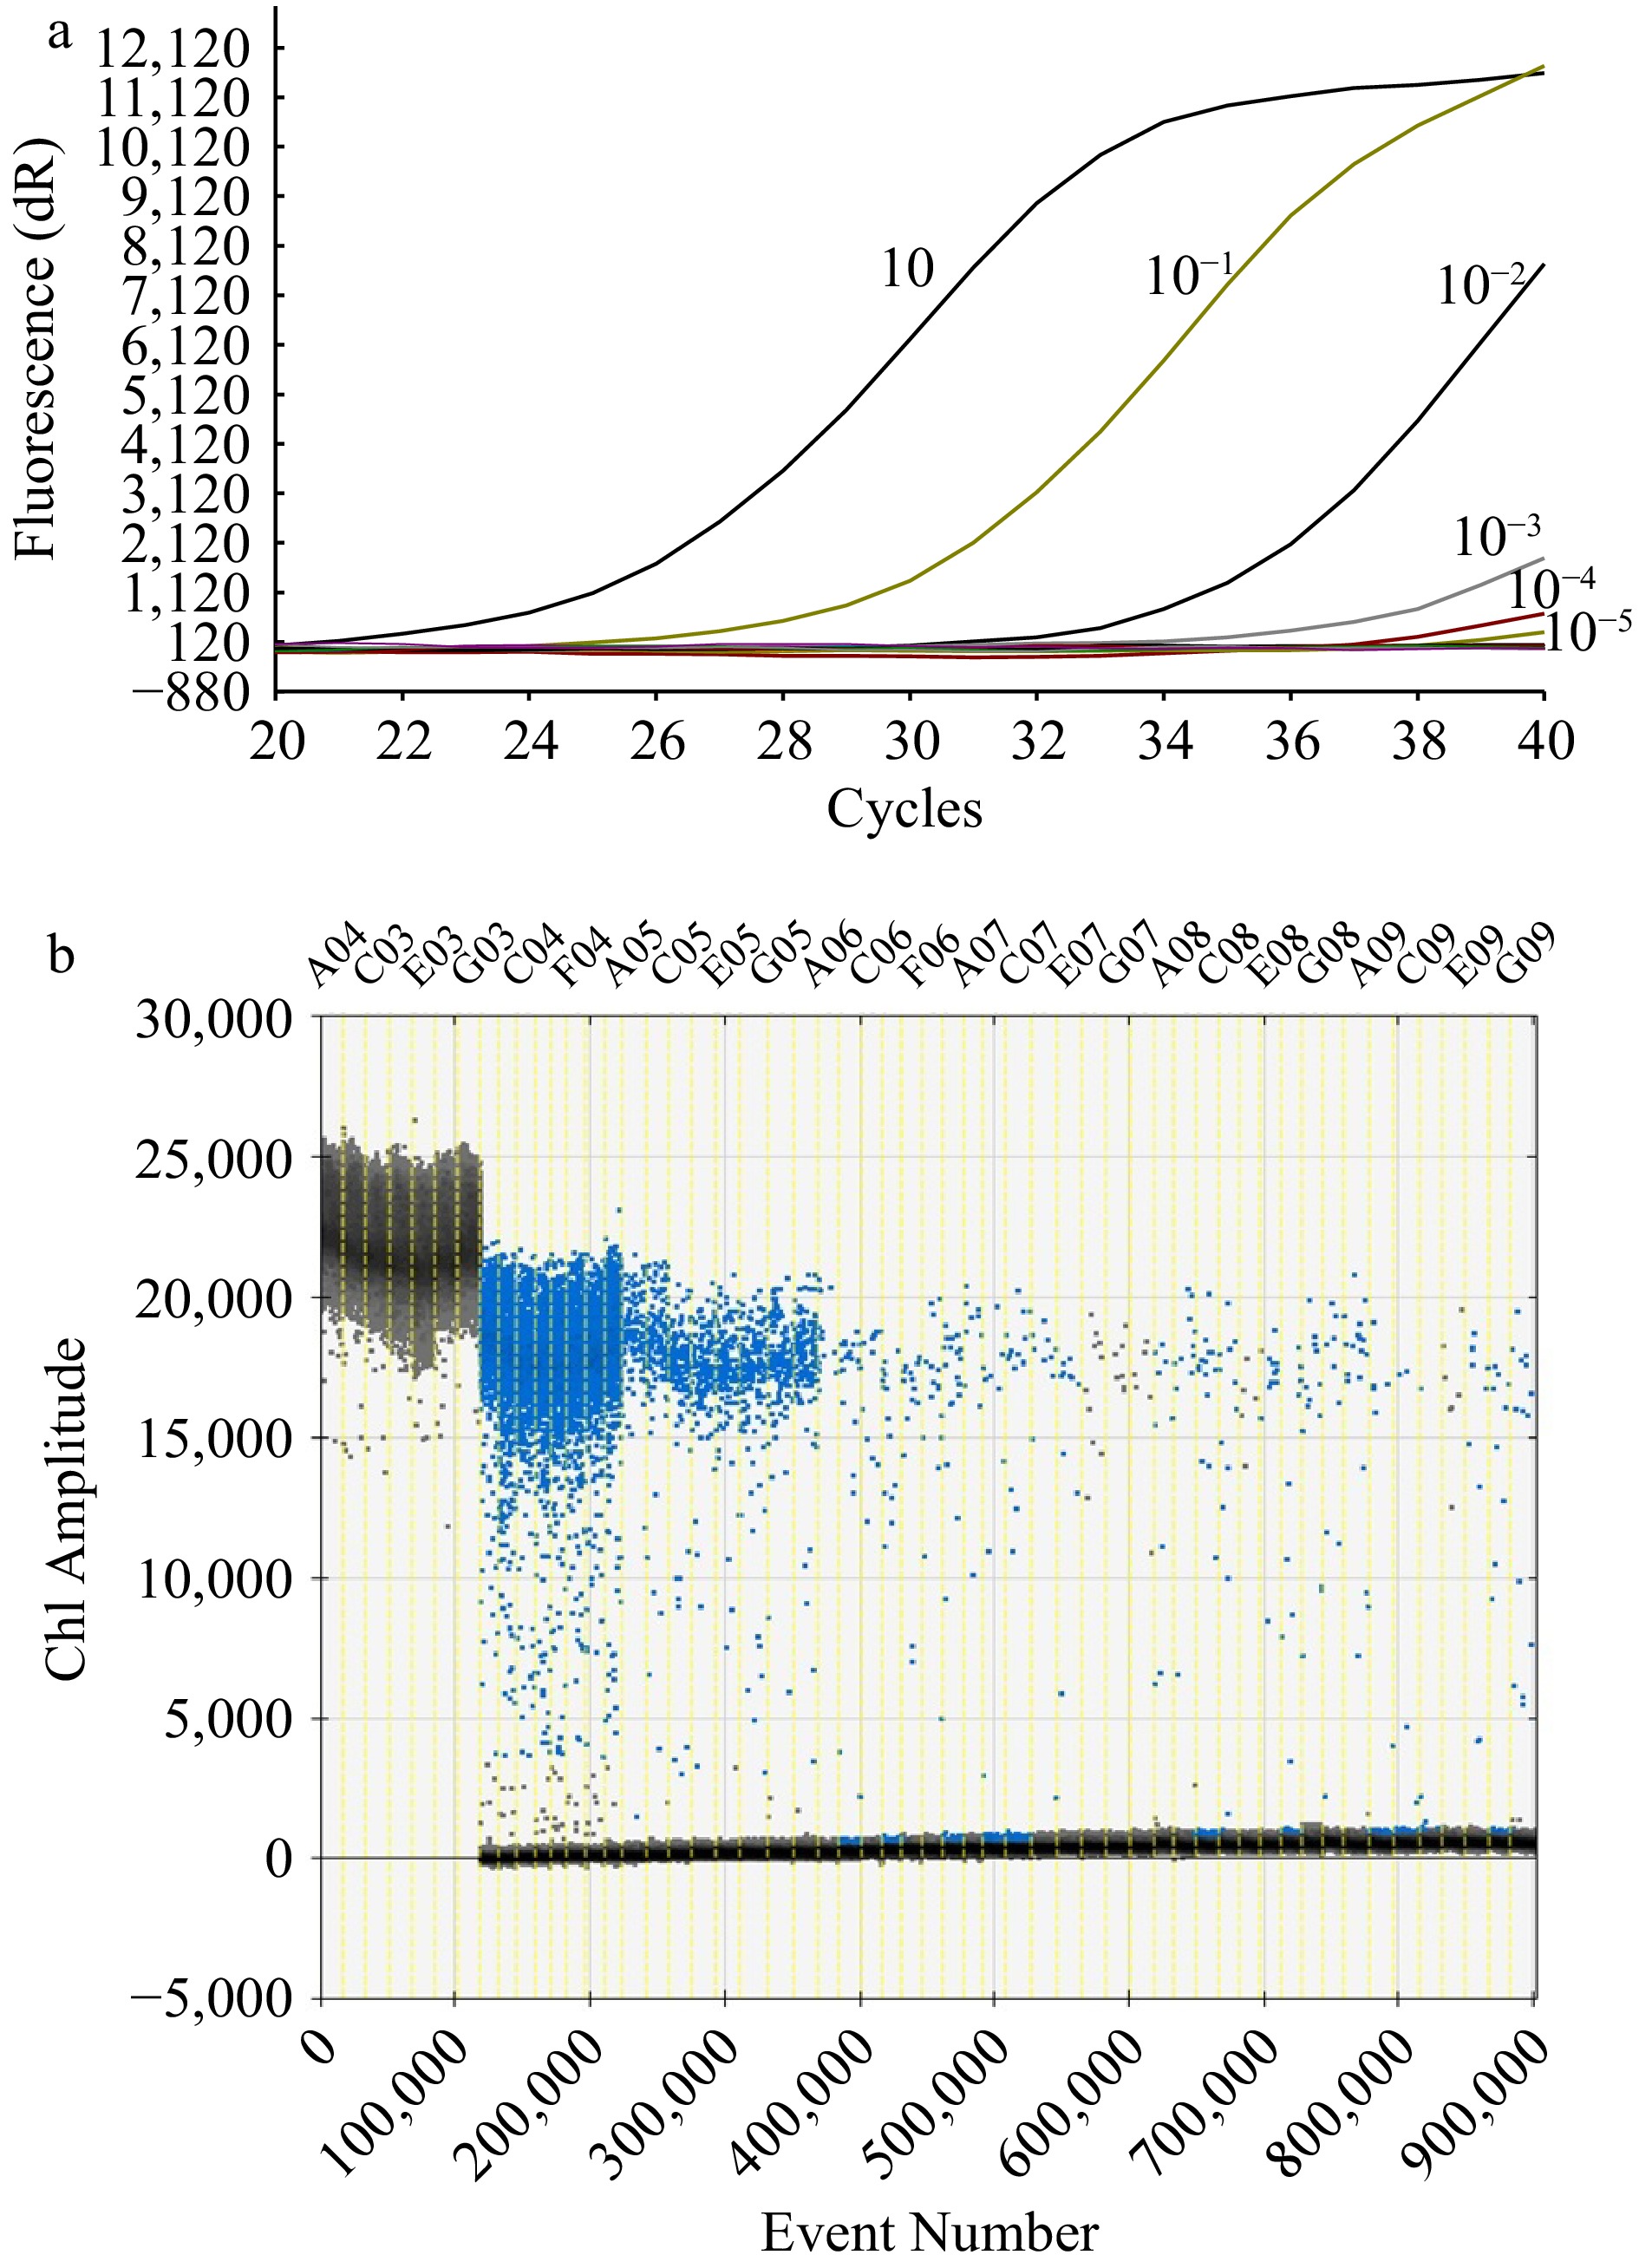
Figure 3.
Sensitivity test of the methods. (a) Amplification curve with RT-qPCR method of a concentration of 10, 10−1, 10−2, 10−3, 10−4, 10−5 ng·μL−1 respectively from left to right. (b) Ch1 amplitude response to event number with the ddPCR method. The black signals represented the positive strain (A03, C03, E03, G03) while the blue signals in the regions represented the concentration respectively at 10 (C04, F04), 10−1 (A05, C05, E05, G05), 10−2 (A06, C06, F06), 10−3 (A07, C07, E07, G07), 10−4 (A08, C08, E08, G08), 10−5 ng Μl−1 (A09, C09, E09, G09).
-
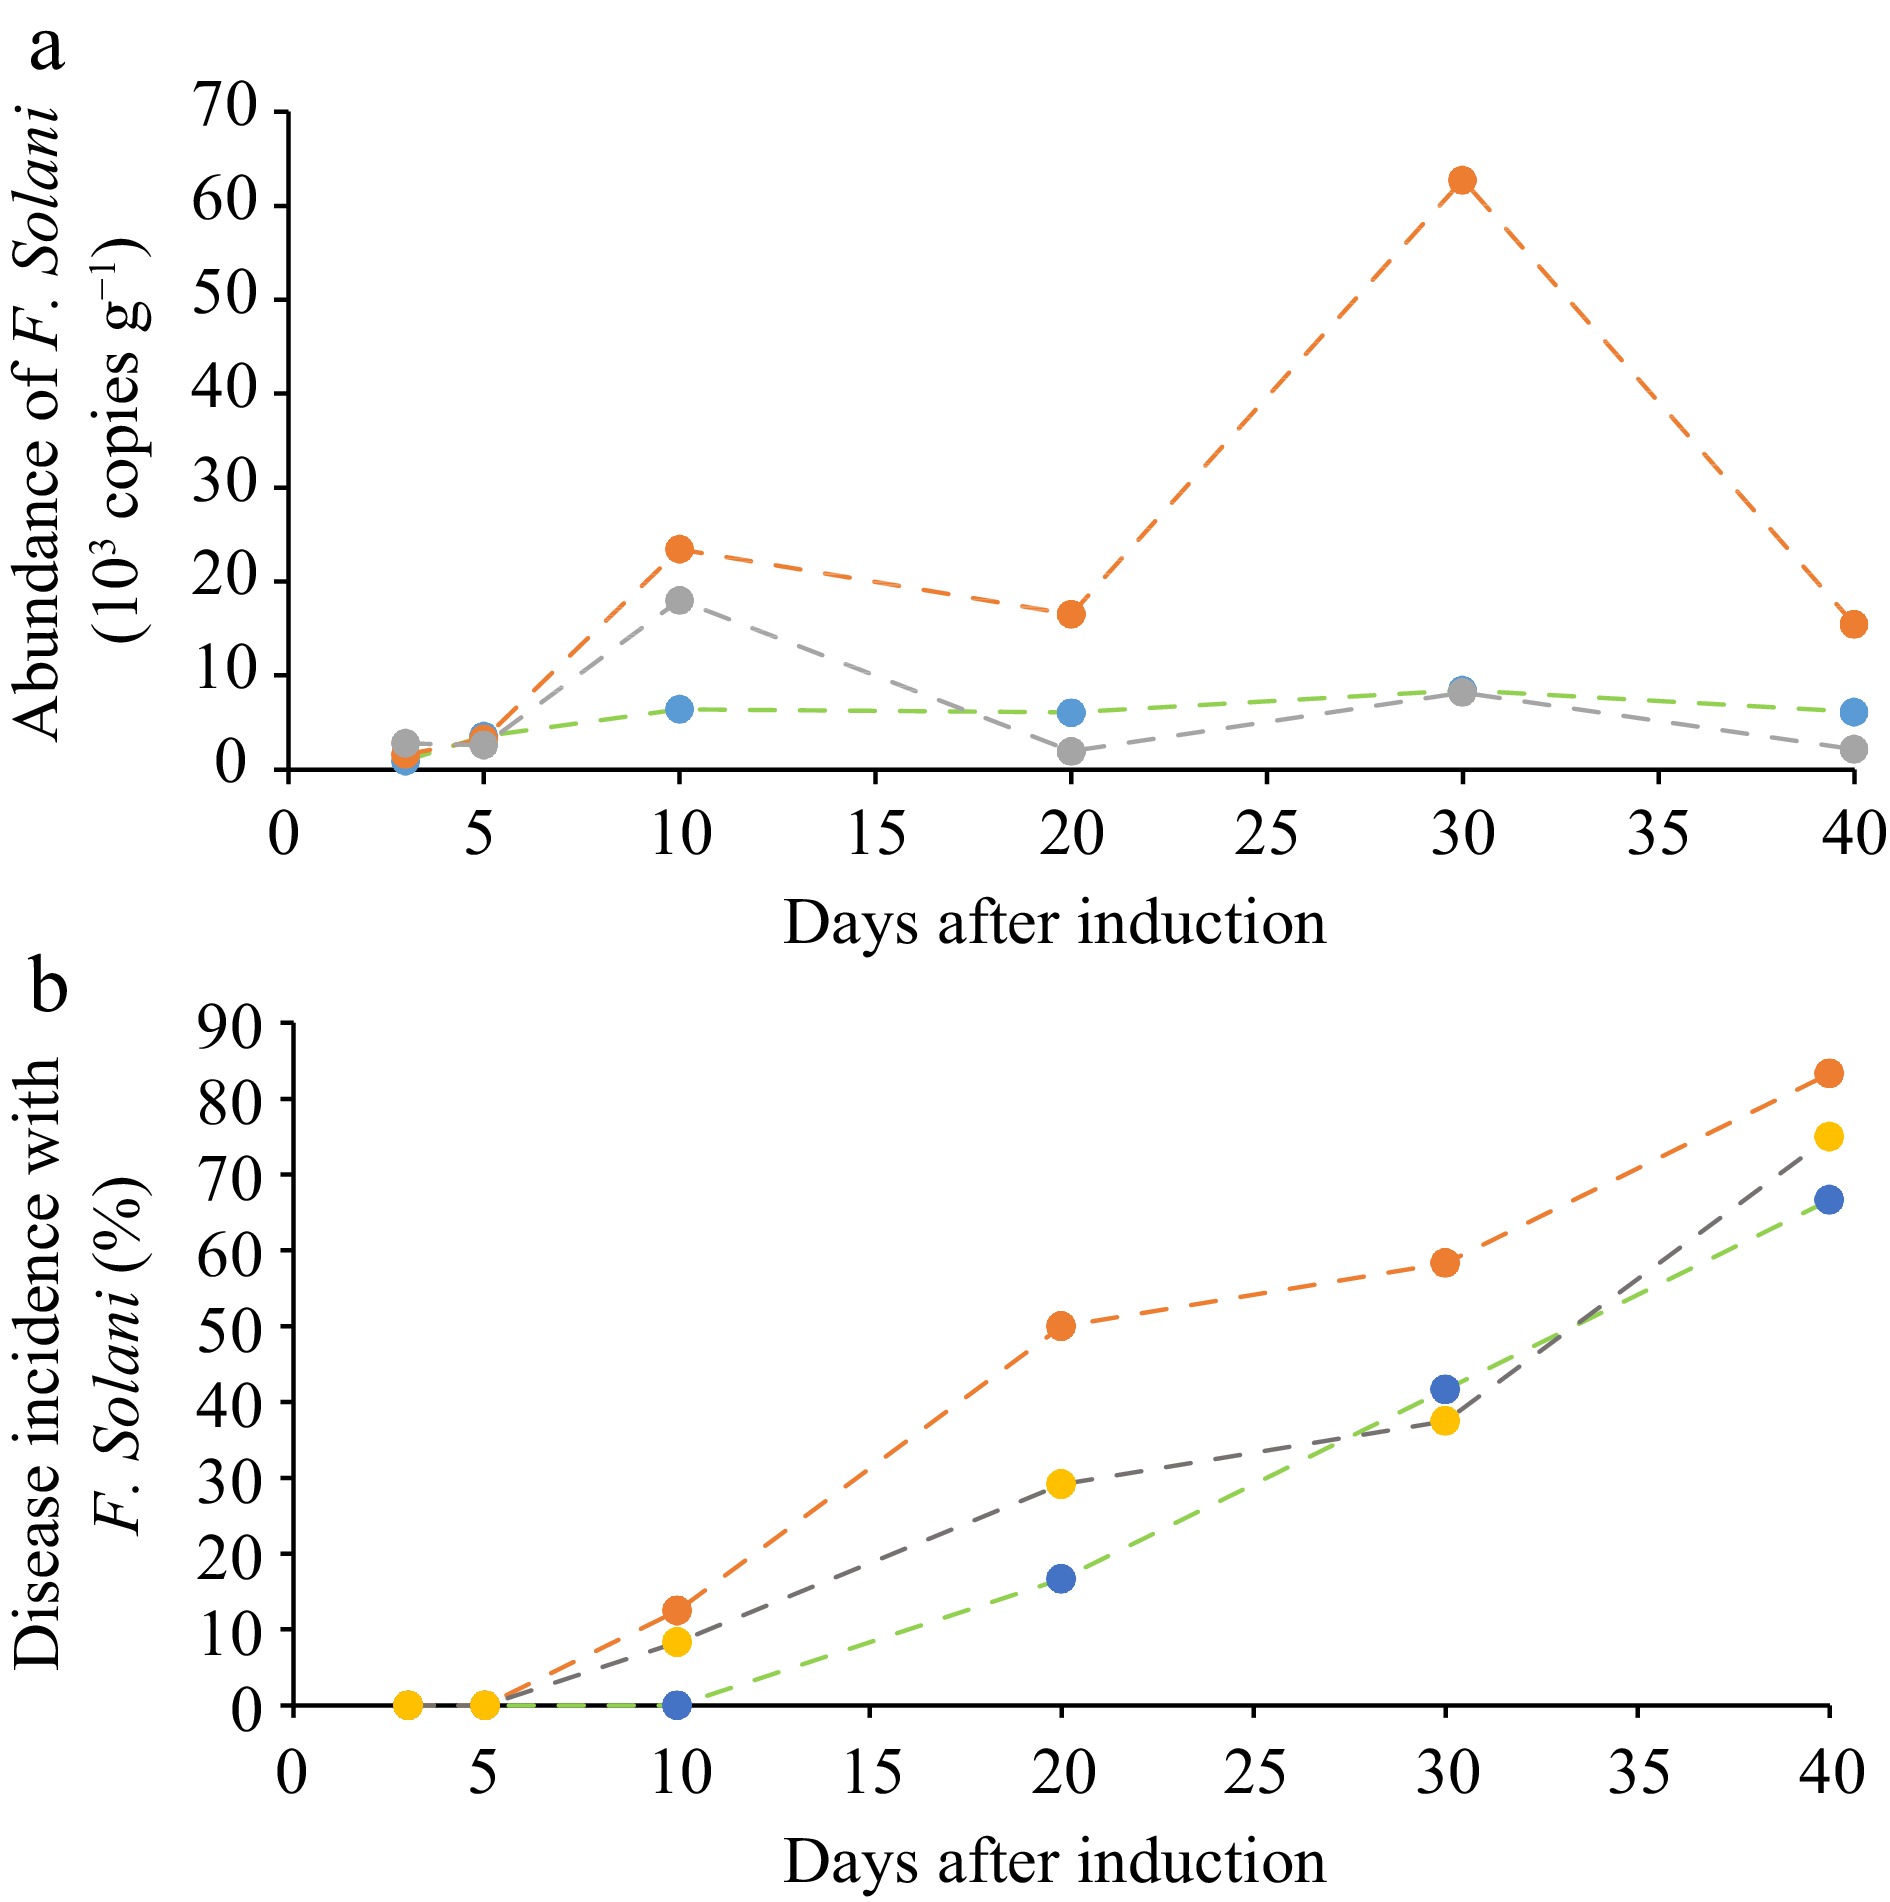
Figure 4.
Quantitative dynamics of F. solani in ginseng root zone. (a) Observed with the developed ddPCR method and (b) the disease incidence rate (%) of ginseng plants in the pot experiment. Green line, control; Red line, the disease induction treatment; Gray line, disease induction plus pesticide treatment.
-
Gene primer/
probeSequence (5′-3′) Product
size (bp)ITS forward GGAACAGACGGCCCTGTAA 149 reverse TTTCGCTGCGTTCTTCATCG probe CCGCCAGAGGACCCCTAACTCTGTT Table 1.
Detailed information of primers and probes used in this study.
-
Soil under ginseng Gene abundance of F. solani
(103 copies g−1)August September Healthy plant n.d. d 2.10 ± 0.19b Root rot plants 43.7 ± 1.91a 10.6 ± 0.96a Rust rot plants 4.48 ± 0.97c 2.76 ± 0.29b Gray mold disease plants 29.9 ± 1.33b 1.85 ± 1.28b Black spot disease plants 1.71 ± 0.43d n.d. d n.d., Not detected as below the detection limit of the ddPCR prorocol. Lowercase letters indicate the difference is significant (p < 0.05). Table 2.
Abundance of F. solani in the rooted soil with plants infected by different diseases.
Figures
(4)
Tables
(2)