-
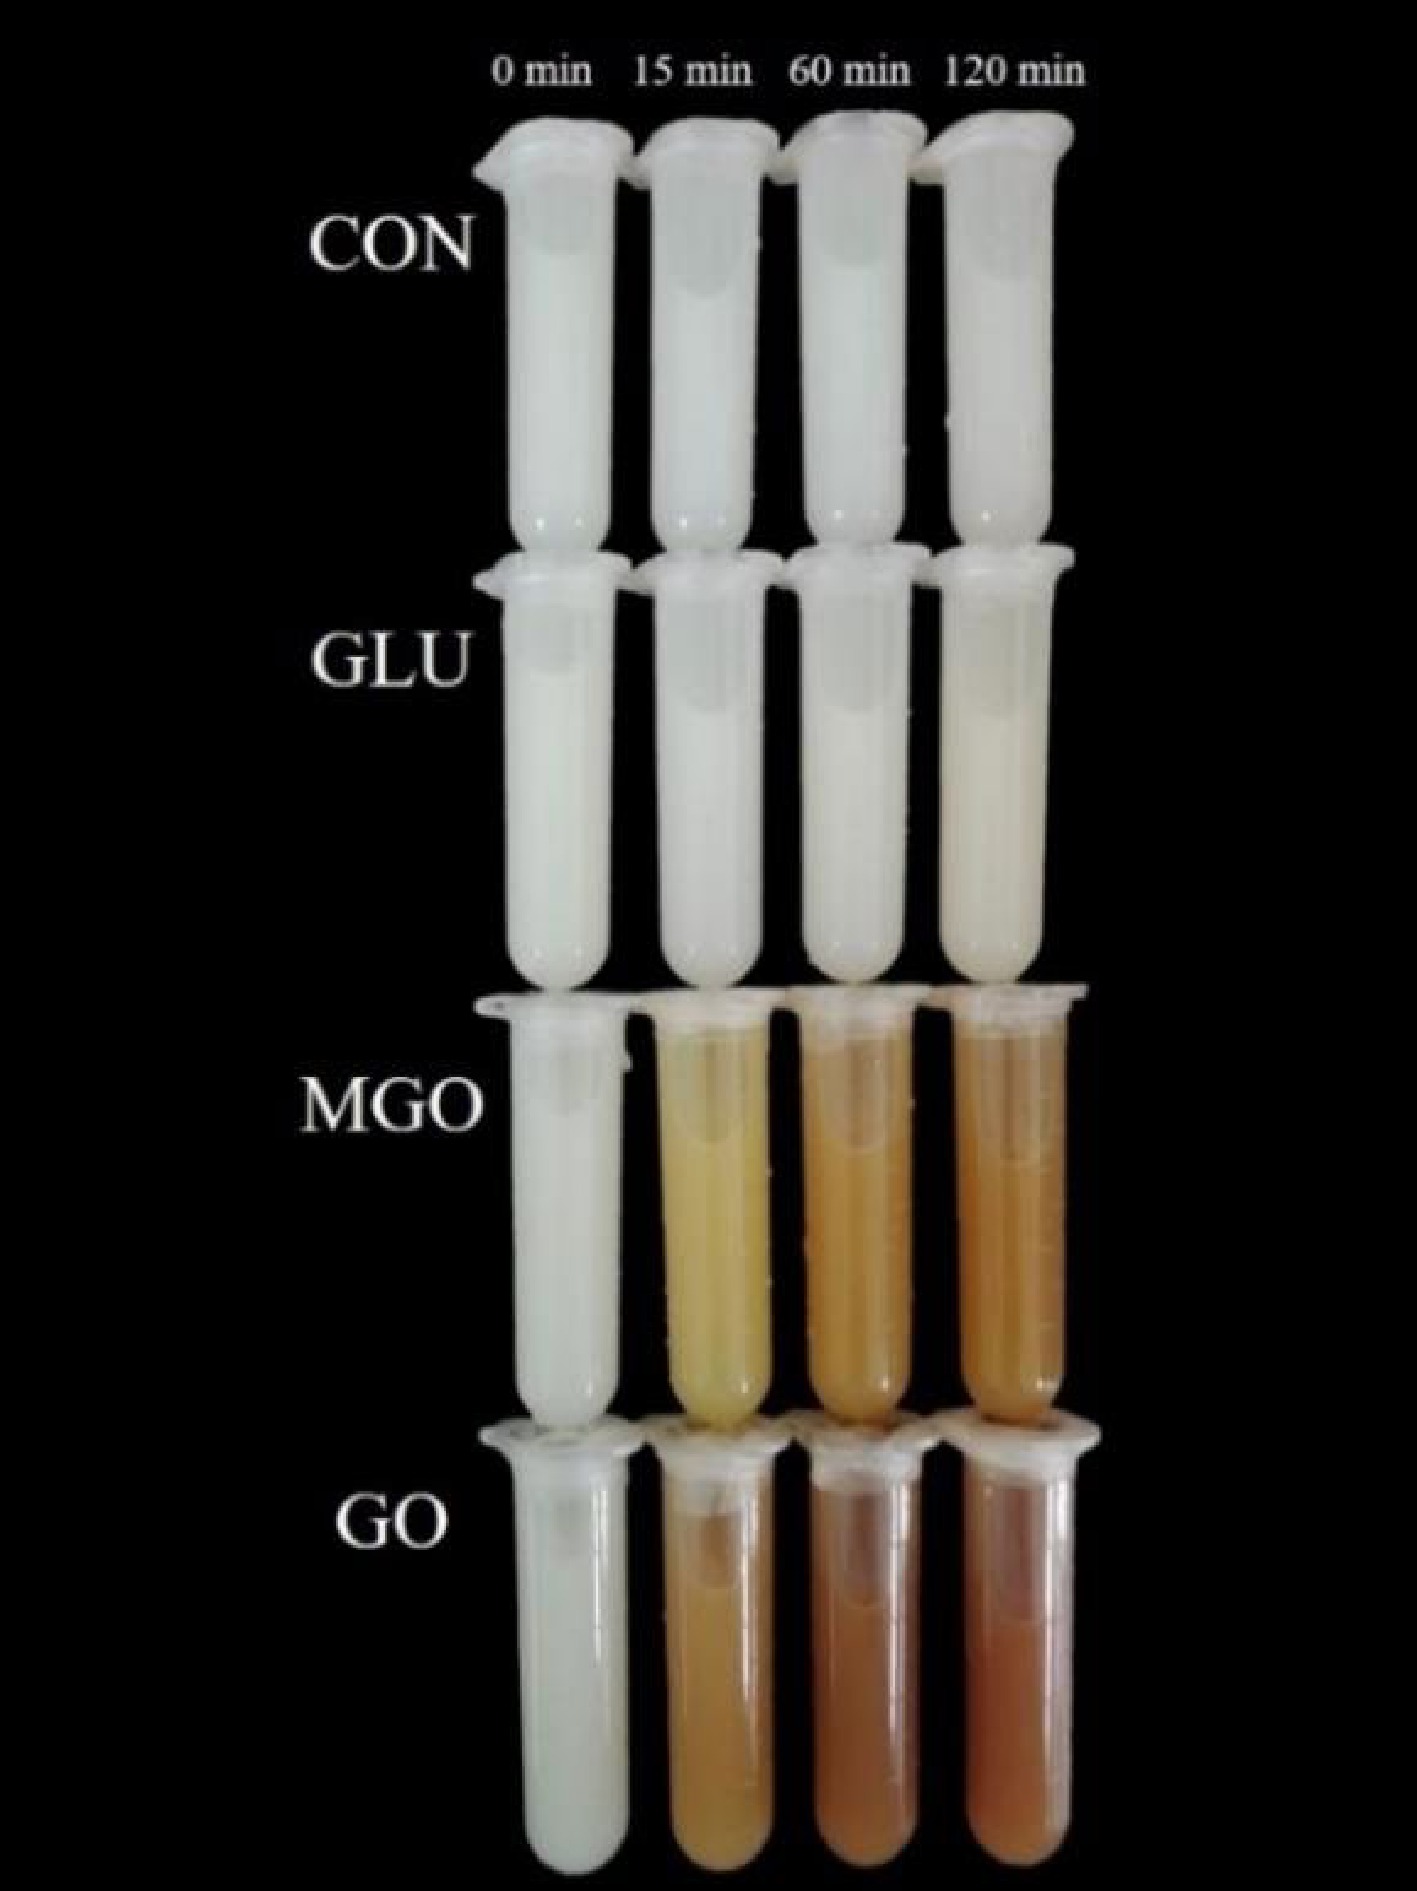
Figure 1.
Changes in appearance during whey protein glycation, including control (CON), glucose (GLU), methylglyoxal (MGO) and glyoxal (GO) group.
-
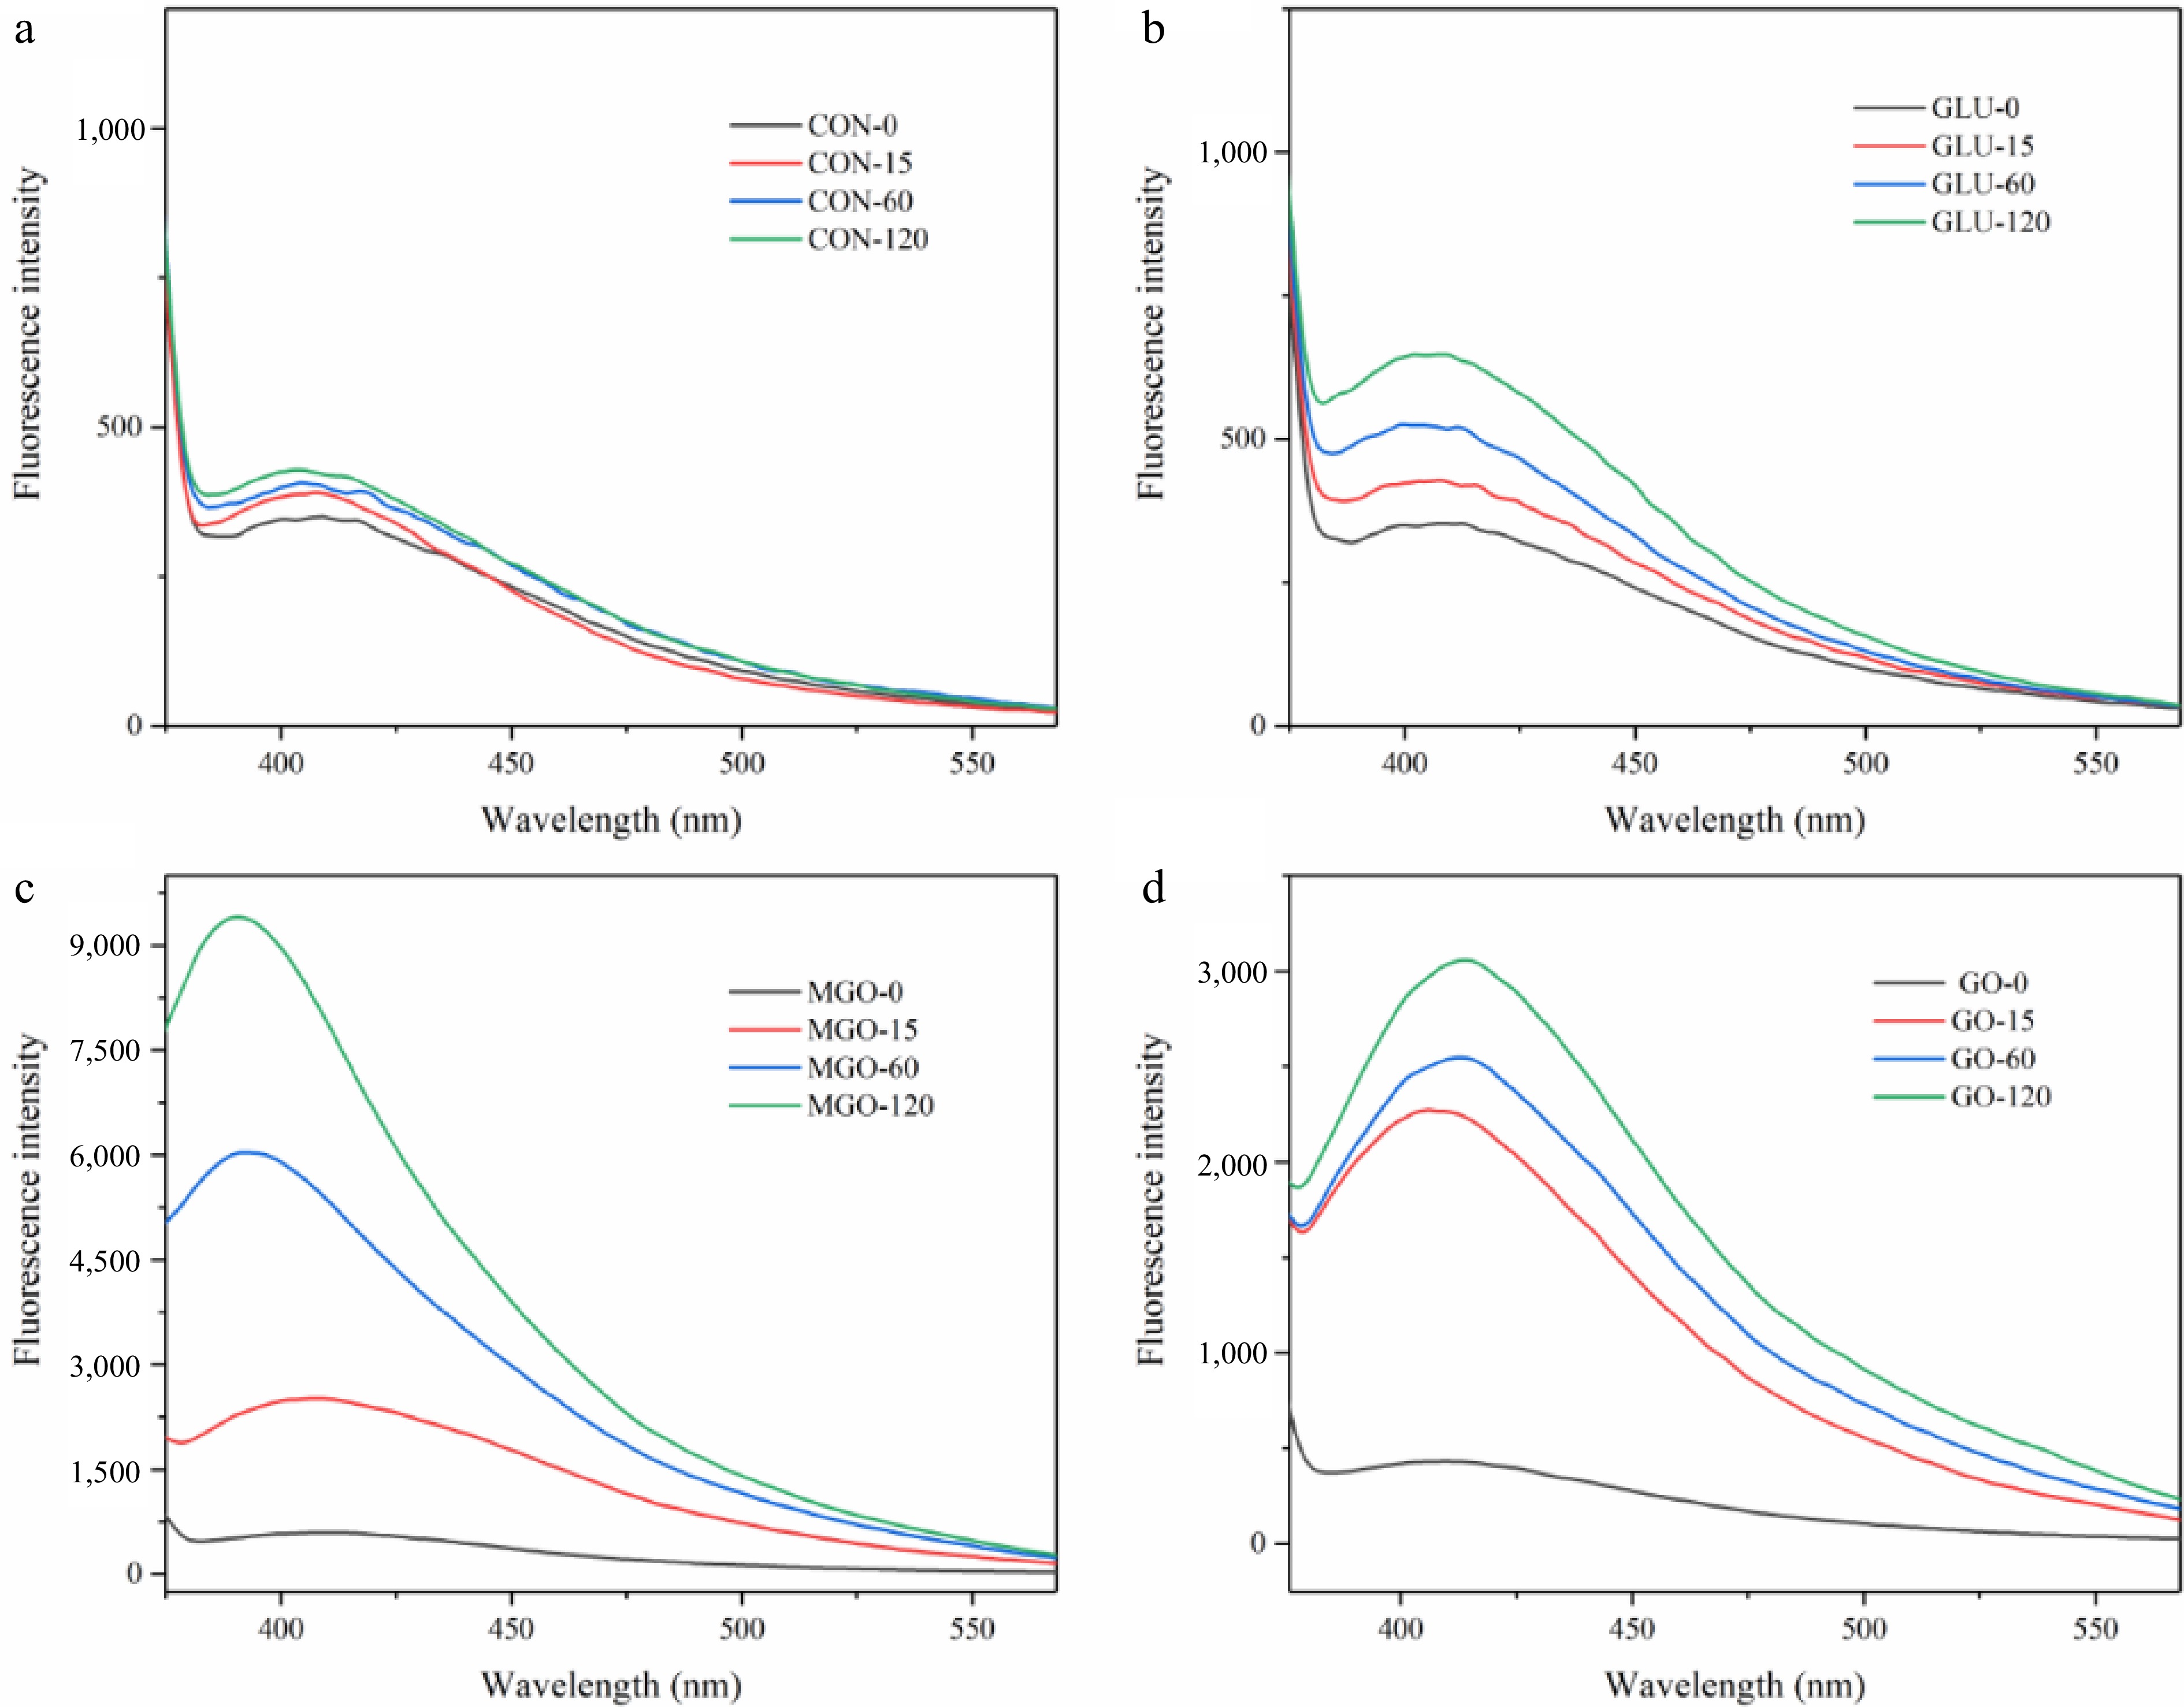
Figure 2.
Fluorescence emission spectroscopy of whey protein after glycation, representing (a) control, (b) glucose, (c) methylglyoxal (MGO) and (d) glyoxal (GO) group at 120 min of glycation processing respectively.
-
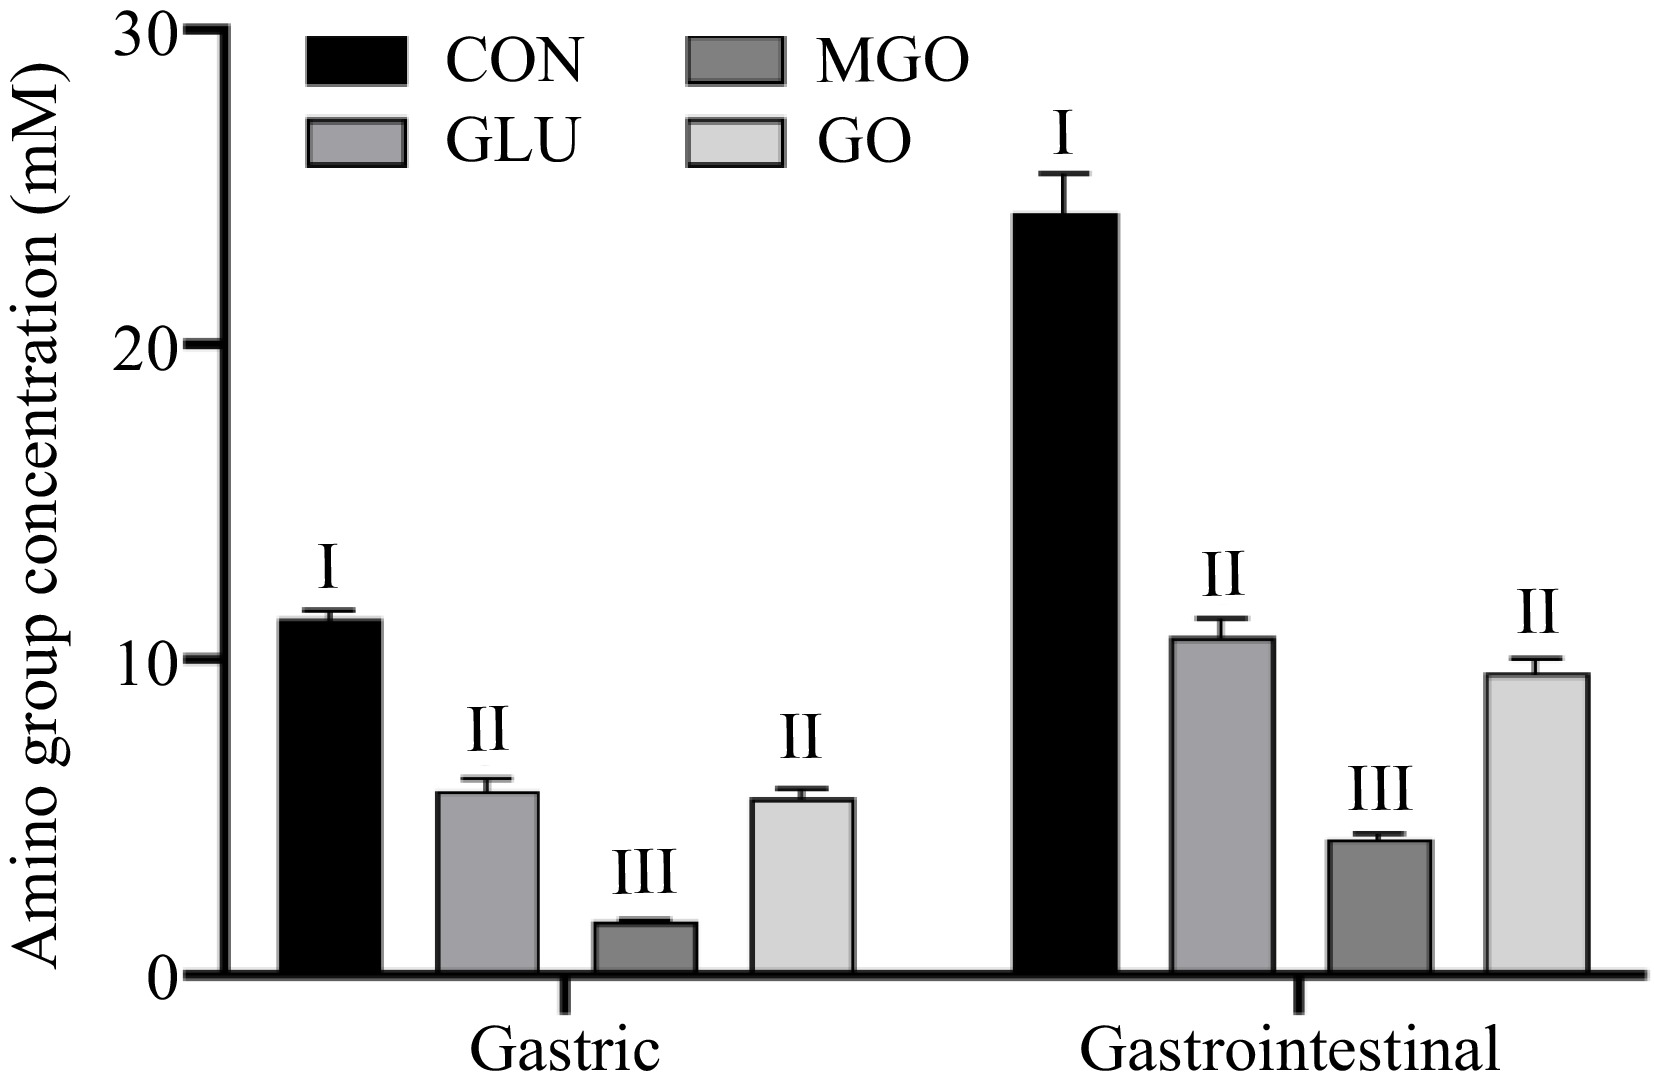
Figure 3.
Changes in amino group releasing glycated whey protein after in vitro gastrointestinal digestion. Letters I−III denote significance levels (p < 0.05) between different treatment groups after the same digestion time, including control (CON), glucose (GLU), methylglyoxal (MGO) and glyoxal (GO) group.
-
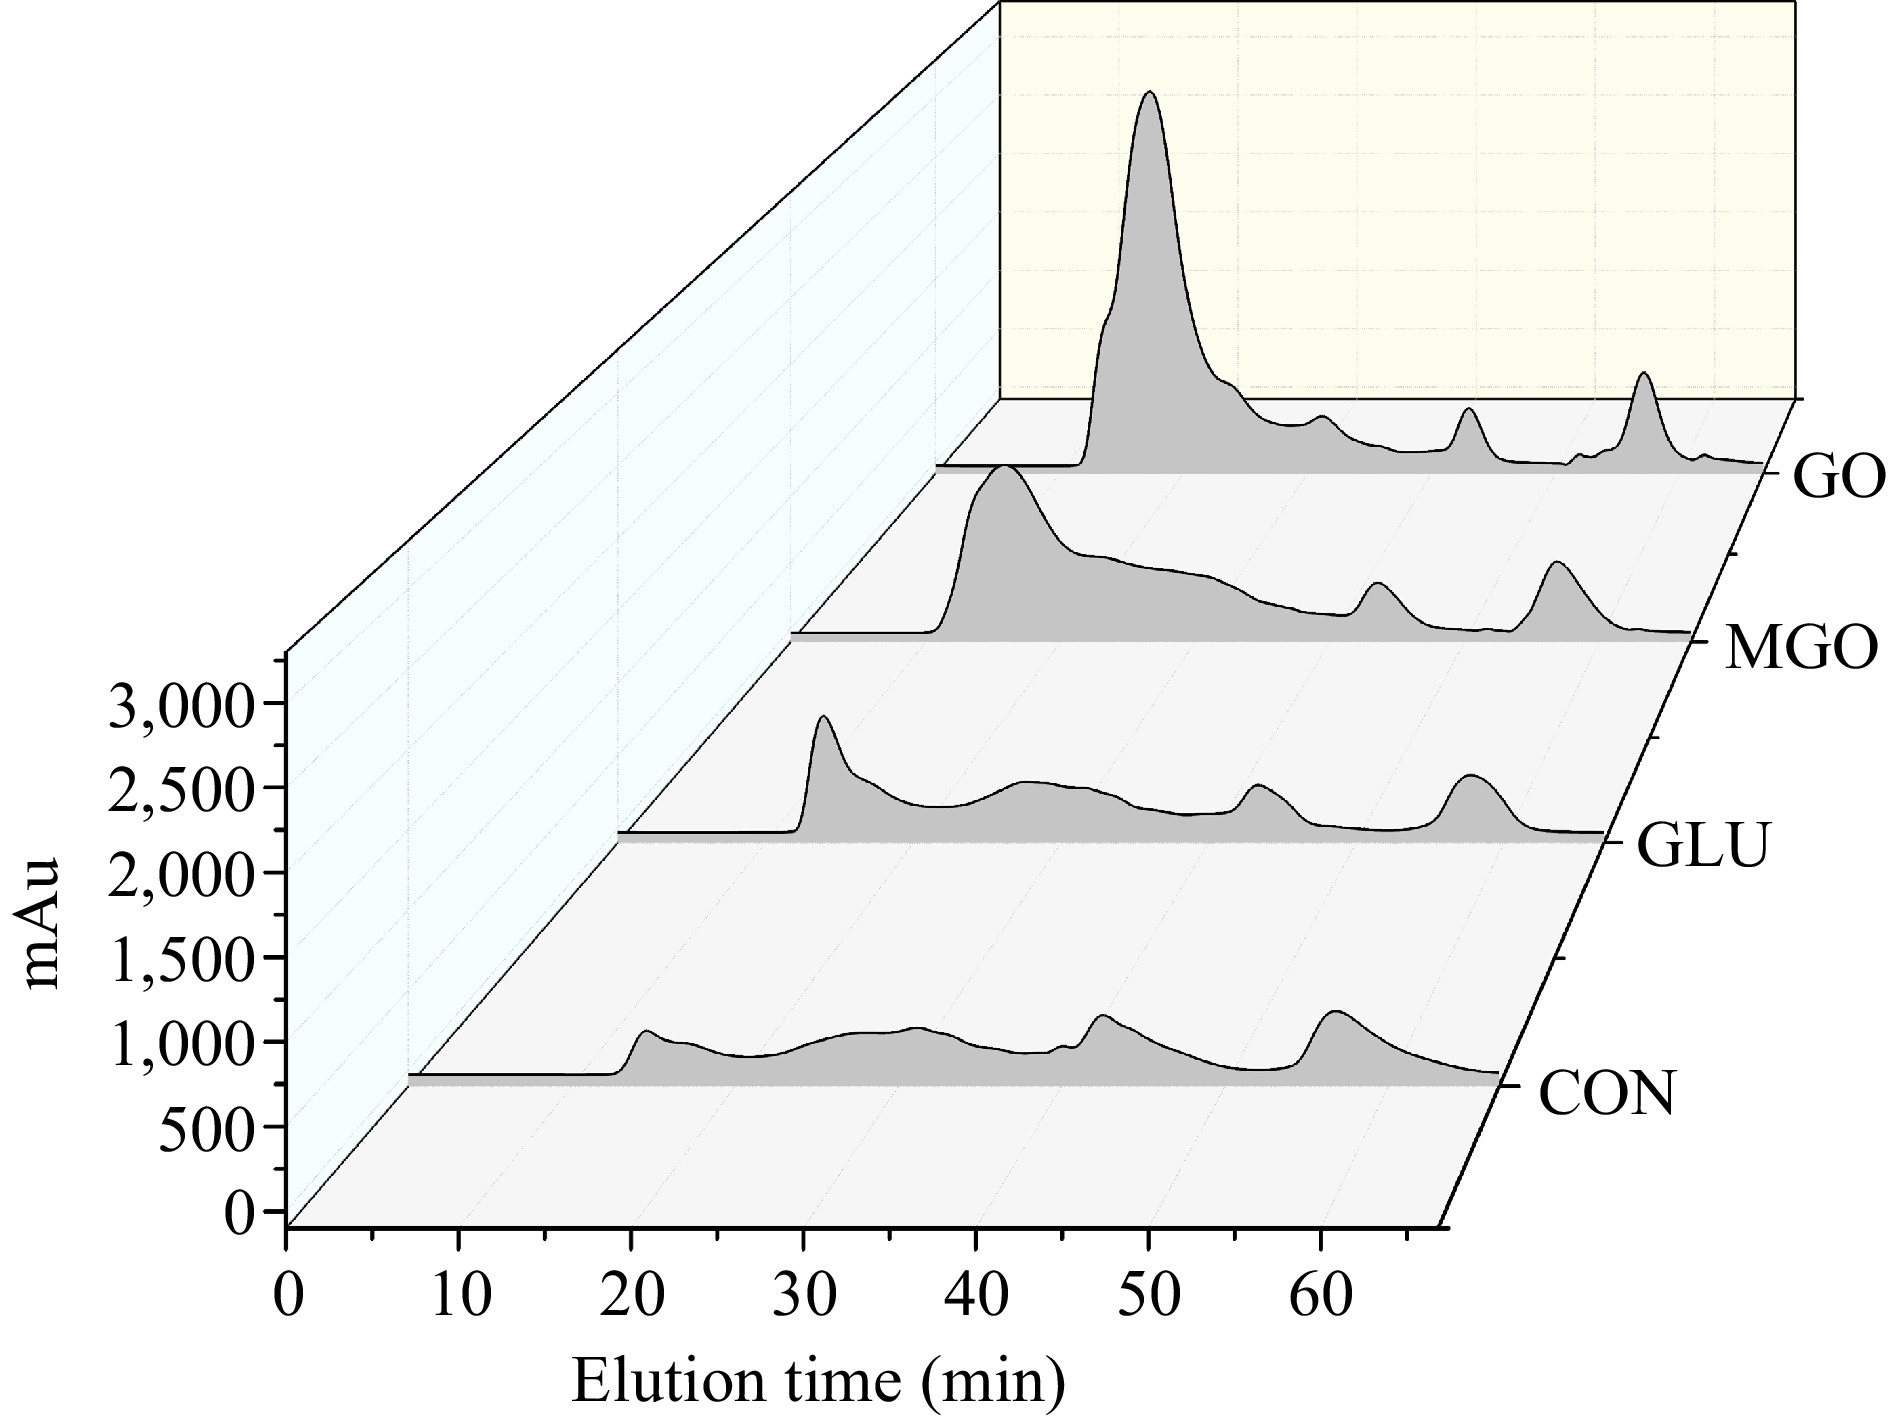
Figure 4.
FPLC profiles for gastrointestinal digests from control or glycated whey protein, including control (CON), glucose (GLU), methylglyoxal (MGO) and glyoxal (GO) group.
-
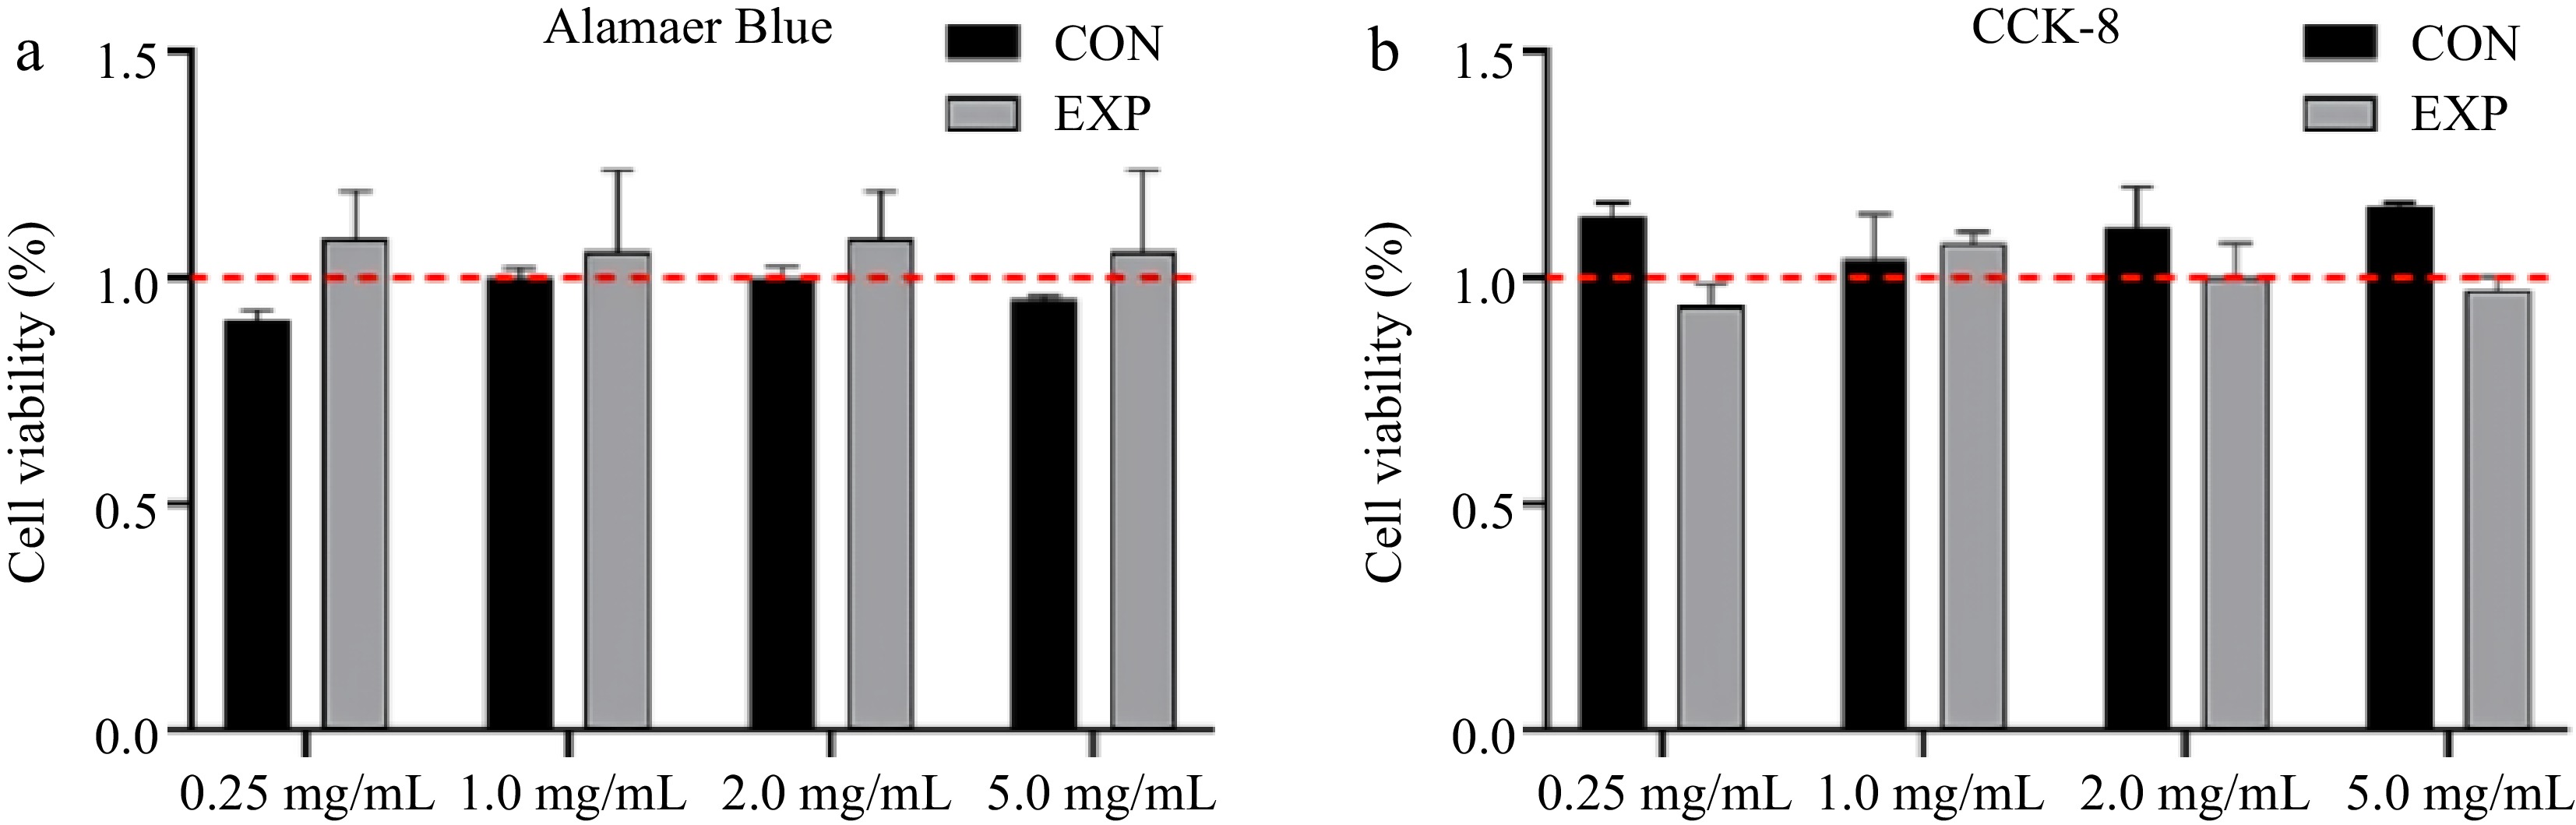
Figure 5.
Influence of different concentration of whey protein digests treatment on STC-1 cells viability, which was tested by (a) Alamar blue and (b) CCK-8.
-
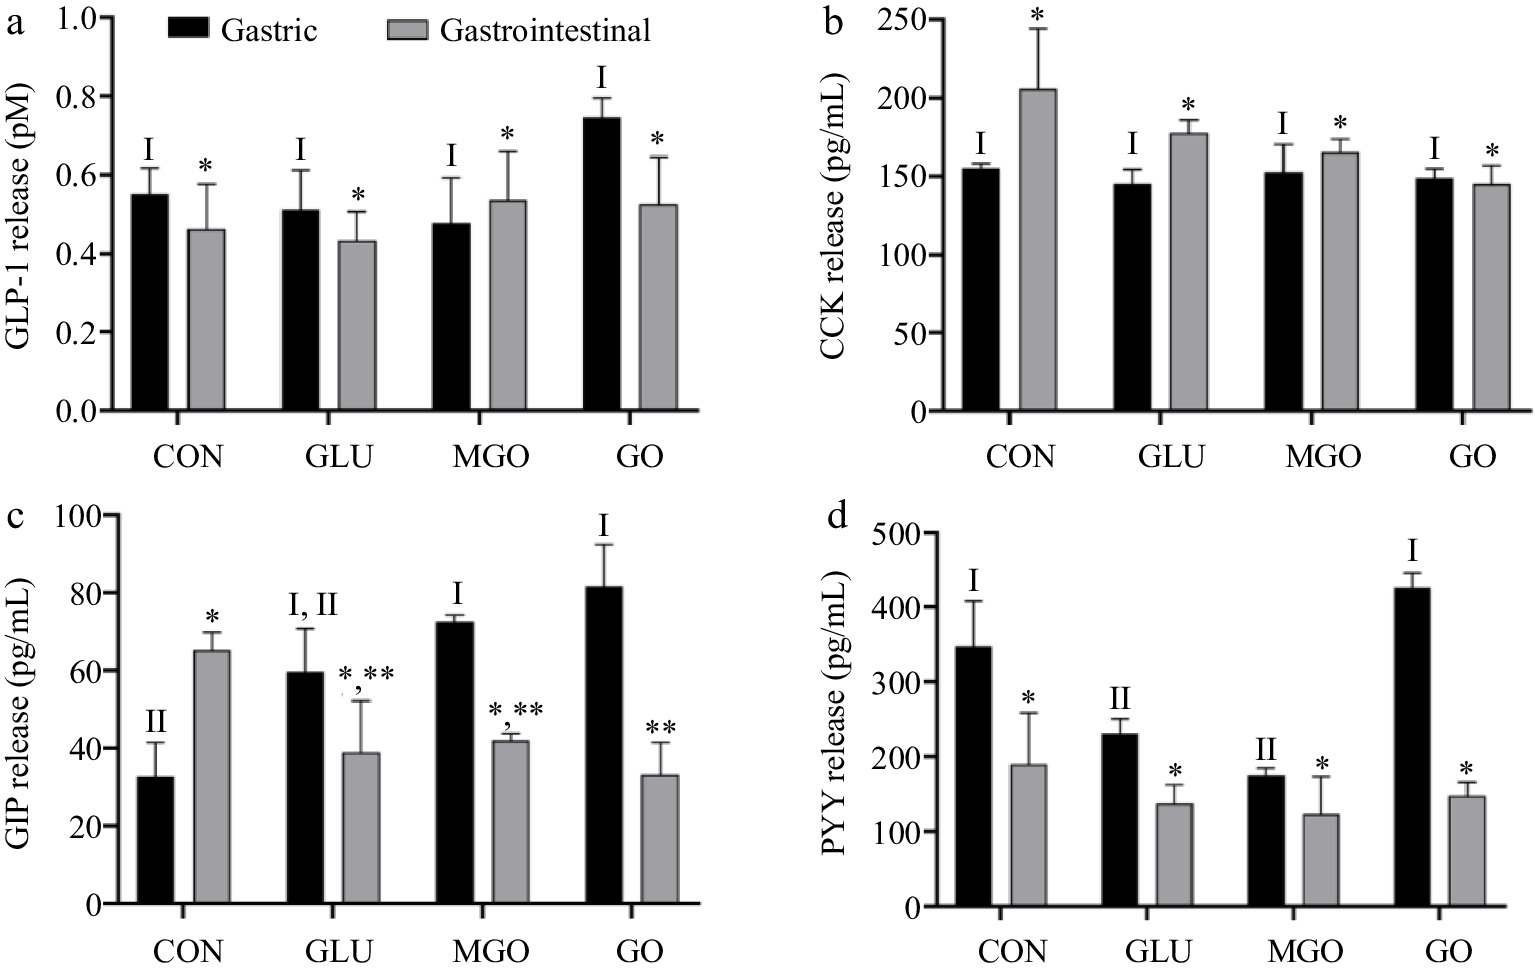
Figure 6.
The quantity of (a) GLP-1, (b) CCK, (c) GIP, (d) PYY secreted by STC-1 cells after glycated whey protein gastrointestinal digests treatment. Letters I−II denote significance levels (p < 0.05) between treatment groups after gastrointestinal digestion, including control (CON), glucose (GLU), methylglyoxal (MGO) and glyoxal (GO) group.
-
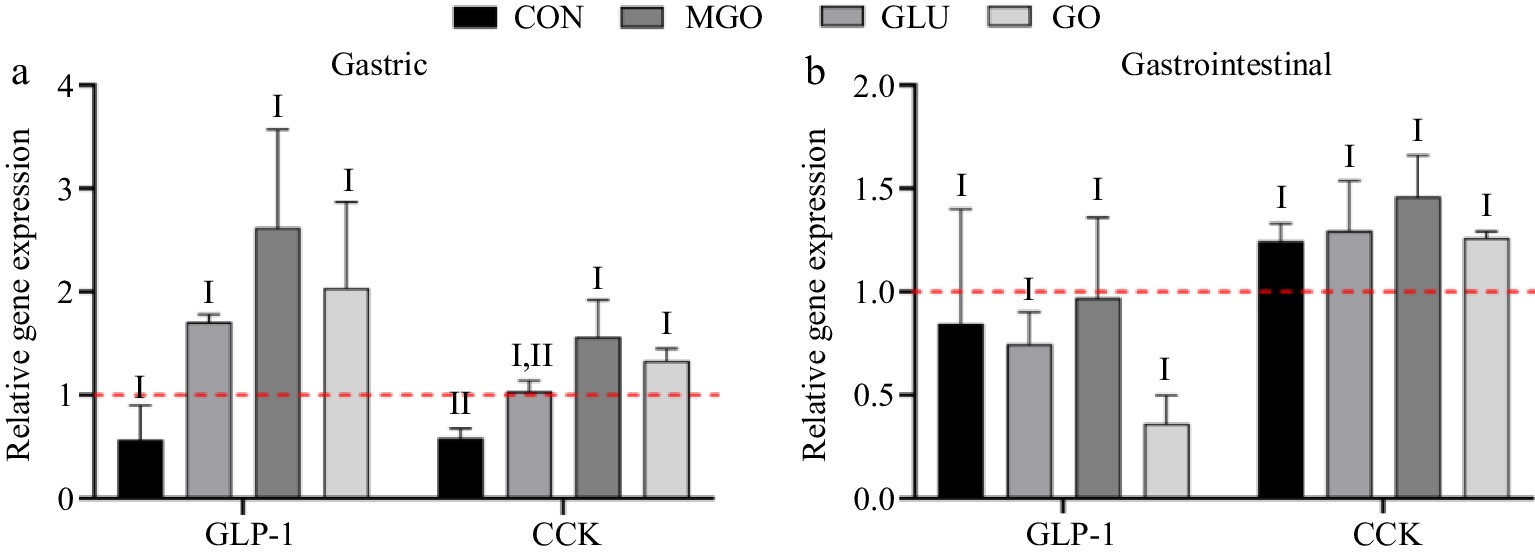
Figure 7.
GLP-1 and CCK mRNA levels in STC-1 cells after (a) glycated whey protein gastric and (b) intestinal digests treatment. Letters I and II denote significance levels (p < 0.05) between different treatment groups for the same hormones mRNA secreted after gastric and gastrointestinal digestion, including control (CON), glucose (GLU), methylglyoxal (MGO) and glyoxal (GO) group.
-
Sample UV absorbance 0 min 15 min 60 min 120 min CON 0.29 ± 0.01c,B 0.33 ± 0.01b,A 0.35 ± 0.01b,A 0.34 ± 0.02a,A GLU 0.38 ± 0.01a,B 0.42 ± 0.01a,A 0.42 ± 0.02a,A 0.37 ± 0.01a,B MGO 0.32 ± 0.01b,B 0.32 ± 0.01b,B 0.34 ± 0.01b,A 0.31 ± 0.01b,B GO 0.28 ± 0.01c,A 0.22 ± 0.01c,B 0.13 ± 0.00c,C 0.13 ± 0.00c,C Table 1.
Changes in free amino acids during whey protein glycation, including control (CON), glucose (GLU), methylglyoxal (MGO) and glyoxal (GO) group.
Figures
(7)
Tables
(1)