


-
Glycation stands as a prevalent chemical reaction in protein processing and modification. Among various methods, the Maillard reaction is a straightforward and efficient non-enzymatic protein glycation modification. The ability of glycation to significantly enhance the functional properties of proteins, e.g., solubility, water-retaining ability, and allergenicity, has led to numerous studies in the past decades[1,2].
Currently, global research interests have shifted from protein properties to the influence of dietary protein on human physiological metabolism. Understanding the process of protein absorption, metabolism and resulting regulation in the intestine necessitates profound exploration. It is fundamental for intestinal nutrient perception to maintain physiological homeostasis of blood glucose and regulate food intake[3]. Moreover, food digestion in the gastrointestinal tract stimulates various endocrine cells situated in the epithelium and triggers the secretion of associated hormones[4,5].
The physiological metabolic mechanisms of carbohydrates and a variety of dietary proteins in the human gastrointestinal tract have been comprehensively studied. However, the effects of complex compounds, particularly glycated proteins and products of the Maillard reaction produced during deep processing of food, remain unclear. This knowledge gap calls for extensive research to improve understanding in this direction.
The influence of glycation on human digestive metabolism comprise various factors, including protein glycation degree, protein structure alterations, digestive property changes, and differences in intestinal nutrient perception[6−8]. The glycation degree and the subsequent changes in protein physicochemical properties form the starting point to tackle this intricate issue. Crucial questions to be addressed in this study include the influence of compounds with varying glycation abilities on protein physicochemical properties, digestive properties, and regulation of the sensory response function of intestinal endocrine cells.
In this study, whey proteins were selected as the model. Compounds with significantly different glycation abilities, including glucose (GLU), glyoxal (GO), and methylglyoxal (MGO), were used to modify the proteins. The INFOGEST2.0 standardized static digestion model was used to explore the impact of different glycation degrees on protein digestion and metabolism. Neuroendocrine cells, widely recognized as an effective model for studying hormone secretion, were used to investigate the nutritional perception of digests of glycated protein.
Glycation might affect the secretion of insulin metabolism related hormones by enteroendocrine cells, as these cells are able to directly detect and respond to differences in nutrient concentrations in the intestinal lumen. This study aimed to address the effects of glycated proteins on intestinal nutrient sensing processes, and provide a reference point for further exploration in this topic. Current research might facilitate future interventions and treatment strategies for chronic diseases, e.g. obesity and diabetes, and promote the research progress of precision nutrition.
-
An 80 wt% whey protein concentrate was procured from Shanghai Yuanye Biotechnology Company (Shanghai, China,). Glyoxal (GO) at 40 wt% in H2O, methylglyoxal (MGO) at 40 wt%, D-(+)-glucose, 98 wt% O-Phthalaldehyde, and HEPES (≥ 99.5) were sourced from Shanghai Aladdin Biochemical Technology Company (Shanghai, China). Pepsin (≥ 2,400 U/mg protein), Pancreatin (≥ 40 TAME/mg protein), and fluorescamine were purchased from Sigma-Aldrich (Shanghai, China).
GibcoTM Dulbecco's Modified Eagle Medium (high glucose with GlutaMAXTM added), GibcoTM peptide bovine serum (special grade, heat inactivated), GibcoTM trypsin (EDTA (0.25%) with phenol red), and GibcoTM penicillin-streptomycin (10,000 U/mL) were procured from Thermo Fisher (USA).
CCK-8 Cell Proliferation and Toxicity Assay Kit (YSRIBIO-C1041), Alamar Blue Indicator (YSRIBIO-C1172), Mouse Cholecystokinin (CCK) ELISA Kit (YS-S516), Mouse Gastric Inhibitory Peptide (GIP) ELISA Kit (YS-S330), and Mouse Tyrosine Peptide (PYY) ELISA Kit (YS-S631) were procured from Shanghai Yansheng Industrial Co. Ltd (China).
HiScript III RT SuperMix for qPCR (+gDNA wiper) (R323-01), ChamQ Universal SYBR qPCR Master Mix (Q711-02), and FastPure Cell/Tissue Total RNA Isolation Kit (RC101-01) were procured from Nanjing Novozymes Biotechnology Co. Ltd (China). The cells used in the experiments were purchased from American type culture collection (ATCC, USA) and revived for use.
Glycation of whey protein
-
In a solvent of 50 mM (pH = 7.0) phosphate buffer solution, 50 mM of GO, MGO, and 200 mM of glucose solutions were prepared. These solutions were respectively blended with a whey protein solution (30 mg/mL, dissolved in 50 mM phosphate buffer solution (pH = 7.0)) by a 1:1 volume ratio, thus reducing the concentrations of protein, glucose and α-dicarbonyl compounds by half. Whey protein controls consisting of a 15 mg/mL protein were dissolved in a 50 mM phosphate buffer (pH = 7.0). All mixed system were subjected to a water bath at 95 ± 1 °C to simulate thermal food processing. Samples were drawn at 0, 15, 60, and 120 min of heating, promptly cooled in an ice bath, and kept at −20°C for future analysis.
The 120 min water bath-heated glycated protein system was post-cooled, and the remaining samples underwent dialysis through a 3 kDa molecular weight cut-off dialysis bag. Dialysis was conducted at 4 °C over three days with water changes twice per day to prevent protein sample contamination and to ensure complete removal of residual carbonyl compounds and other small molecules. Following dialysis, the protein solution was lyophilized and stored at −20 °C for subsequent experiments.
Determination of free amino groups during glycation
-
The o-phthalaldehyde (OPA) working solution was concocted by dissolving 40 mg of o-phthalaldehyde powder in 25 mL of 10 mM sodium tetraborate solution, adding 2.5 mL of 20% (w/v) sodium dodecyl sulfate and 100 μL of β-mercaptoethanol, and adjusting the final volume to 50 mL. The OPA blank solution was prepared without the addition of o-phthalaldehyde powder[9]. For the measurement, 100 μL of protein sample solution (5 mg/mL) was mixed with 2 mL of OPA working solution and 2 mL of OPA blank solution. The reaction proceeded at 40 °C for 3 min in a water bath, and the UV absorbance of the reaction system was measured at 340 nm in a multifunctional enzyme standard. The absorption meter of OPA working liquid system is A1, and the absorption meter of OPA blank liquid system is A2. The absorbance values of the final free amino acids were calculated as following:
$\rm OD_{340}=A1-A2 $ (1) Fluorescence spectra of glycated proteins
-
During the glycation process, Advanced Glycation End Products (AGEs) possessing fluorescent properties were generated and quantified by fluorescence spectroscopy[10]. Glycation samples taken at 0, 15, 60, and 120 min were equivalently diluted to ensure the emission fluorescence intensity remained below 10,000. The emission spectra conditions were set as follows: voltage 700 V, excitation wavelength 330 nm, with an emission wavelength intensity scan spanning from 370 to 570 nm.
In vitro digestion of proteins
-
In vitro digestion of glycated proteins was conducted following the INFOGEST 2.0 protocol[11]. Prior to simulated gastric digestion, pepsin was dissolved in simulated gastric fluid (SGF) to achieve a final enzyme activity of 2,000 U/mL within a 30 mL gastric digestion system. A total of 900 mg of lyophilized glycated protein samples (net protein content) were dissolved in 20 mL of SGF. Subsequently, the system pH was adjusted to 3.0 using a 6 M HCl solution, followed by the addition of 2 mL of gastric enzyme solution. The system was then brought up to a volume of 30 mL with SGF. Gastric digestion was simulated in a constant temperature shaker at 37 °C and 200 rpm. Samples were taken after 60 and 120 min of digestion, following which an equal volume of intestinal fluid (SIF) was added to terminate the gastric enzyme reaction. These samples were then frozen at −20 °C for subsequent analysis.
Before simulated intestinal digestion, trypsin was dissolved in SIF to ensure the enzymatic activity of trypsin in the system reached 100 U/mL within a 40 mL intestinal digestion system. During simulated intestinal digestion, 2 mL of trypsin solution was added to the remaining 20 mL of the gastric digestion system. The intestinal digestion system was then topped up to 40 mL using SIF, and the system pH was adjusted to 7.0. The simulated intestinal digestion system was placed in a constant temperature shaker and digested at 37 °C and 200 rpm. Samples were collected after 60 and 120 min of intestinal digestion. Trypsin activity was terminated by heating in a 95 °C water bath for 10 min, and then samples were quickly transferred to −20 °C for storage and subsequent analysis.
Quantification of released amino group during digestion
-
Samples were blended with 24 wt% Trichloroacetic acid (TCA) solution in equal proportions, followed by a 30-min reaction in an ice bath and then centrifugation for 20 min at 4 °C and 13,000 rpm[12]. A total 30 μL of supernatant was then added to 900 μL of 0.1 M sodium tetraborate solution and 300 μL of fluorescamine acetone solution (0.2 mg/mL). The mixture was then agitated vigorously for 15−20 min in the dark. Fluorescence intensity was measured using a multifunctional enzyme marker with an excitation wavelength of 400 nm and an emission wavelength of 480 nm. The primary amine concentration was calculated using the external standard curve of the leucine standard.
Molecular weight distribution of digests
-
Digests of glycated proteins were separated based on differing molecular weights using size exclusion chromatography (SEC) within an Fast Protein Liquid Chromatography (FPLC) system[13]. A Superdex Peptide 10/300 GL exclusion column was employed for sample separation. The mobile phase was a 25 mM phosphate buffer (pH = 7.0, containing 100 mM NaCl) at a flow rate of 0.5 mL/min, with a UV detection wavelength of 280 nm and a single injection volume of 1 mL. The eluate was collected from 10 min to 65 min, and frequency was one tube every 5 min. Molecular weight calibration was achieved using bovine serum albumin (BSA, 66.5 kDa), cytochrome C (12.4 kDa), bacillus peptide (6.5 kDa), lysozyme (1.5 kDa), Gly-Gly tyr-Arg tetrapeptide (0.5 kDa), and Gly-Gly-Gly tripeptide (0.2 kDa). The peak times of tryptophan and tyrosine were measured using their respective standards.
STC-1 cell culture
-
STC-1 cells were cultured adhering to the instructions set out by Verhoeckx et al.[14]. The cells were recovered from the ATCC and cultured in dulbecco's modified eagle medium (DMEM) medium (high sugar, no sodium pyruvate, 10% fetal bovine serum, 100 U/mL double antibody) at 37 °C under 5% CO2. Based on the growth status of the cells, they could be passaged when the cell density reached 80%−90% in a 10 cm dish. Once the cells reached 10 generations, they were then suitable for subsequent experiments.
Intervention of STC-1 cells with digest products of proteins
-
Digests of glycated proteins after gastric and intestinal digestion for 120 min were used for cellular intervention. These products were diluted with a HEPES buffer solution (140 mM NaCl, 4.5 mM KCl, 1.2 mM CaCl2, 1.2 mM MgCl2, 20 mM HEPES), and then filtered through 0.22 μm sterile filters. Prior to the intervention, STC-1 cells were seeded into six-well culture plates at approximately 1.5 × 10⁶ cells per well and incubated with DMEM at 37 °C and 5% CO2 for 18 h. The cells were washed twice with HEPES buffer and then subjected to a one-hour starvation period with 1 mL of HEPES buffer in each well. After starvation, the cells were intervened with 1 mL of diluted whey protein digest and glycated protein digest for 3 h. Finally, the cell intervention solution was removed, followed by the addition of 10 μL of 10× stopping proteinase and phosphatase inhibitor, along with 10 μL of 10× EDTA solution. The treated cells were then immediately stored at −80 °C.
Cell viability assay of intervened STC-1 cells
-
Whey protein digests after gastric and intestinal digestion were diluted to concentrations of 0.25, 1, 2, and 5 mg/mL with HEPES buffer. The control group prepared by an empty digestion solution without glycated protein was diluted with HEPES at the same volume ratio, and then filtered using 0.22 μm sterile filters. STC-1 cells were transferred to 96-well plates and incubated for 24 h. Afterwards, the supernatant was discarded and the cells were washed with HEPES buffer. Different concentrations of whey protein digests from gastric and intestinal sources, as well as the control, were then added to the cells and incubated at 37 °C and 5% CO2 for 3 h.
The Alamar Blue method was performed after three-hour incubation, where 10 μL of Alamar blue reagent (pre-melted and mixed) was added, and the incubation continued for one additional hour. Subsequently, the fluorescence value was detected at an excitation wavelength of 530−560 nm and an emission wavelength of 590 nm.
For the CCK-8 method, the supernatant was discarded after the three-hour incubation. All cells were then rinsed with HEPES buffer, and 100 μL HEPES buffer and 10 μL CCK-8 reagent were added to each well. The incubation continued for an additional hour, after which the UV absorbance at 450 nm was detected.
Quantification of levels of intervened STC-1 cell hormones GLP-1 and CCK
-
The secretion levels of the cytokines GLP-1 and CCK were measured by their corresponding ELISA kits. To minimize the potential impact of cross background on measurement outcomes, the maximum antibody concentrations were used for the GLP-1 ELISA kit (EMD Millipore, Billerica, MA, USA) and CCK ELISA kit (Shanghai YSRIBIO industrial co., LTD). To improve data reliability, each sample treatment was replicated at least twice with three parallel groups executed for each.
Examination of GLP-1 and CCK gene expression in intervened STC-1 cells
-
Following intervention with intestinal digests, total RNA from STC-1 cells was extracted using the FastPure® Cell/Tissue Total RNA Isolation Kit (Vayzme, Nanjing, China). The RNA sample concentration was determined with Nanodrop 2000 (ThermoFisher Scientific, Waltham, MA, USA). Total RNA was then reverse transcribed using HiScript® III RT SuperMix for qPCR (+gDNA wiper) (Vazyme, Nanjing, China), to obtain cDNA suitable for fluorescent quantitative PCR. Target genes were quantified using the ChamQ Universal SYBR qPCR Master Mix, following the provided instructions. The primers, synthesized by Kingsray Biotechnology, were designed in accordance with the method set out by Santos-Hernández et al.[3]. β-Actin (accession No. NM_007393.5) served as the internal reference with the sequences: (F) 5'-AGCTGCGTTTTACACCCTTT-3'; (R) 5'-AAGCCATGCCAATGTTGTCT-3'. The sequences for GLP-1 (accession No. NM_008100.4) were: (F) 5'-AGAGACATGCTGAAGGGACC-3; (R) 5'-CTTTCACCAGCCACGCAATG-3’.
Statistical analysis
-
One-way analysis of variance (ANOVA) with Duncan's post hoc test was used in SAS 9.2 to examine statistical differences. Significant difference was shown when the P value was less than 0.05. Figures were illustrated using GraphPad Prism (Version 8.0.0 , San Diego, CA,USA)
-
The glycation of proteins normally results in various dark substances, which could perform as an indirect indicator of the glycation process. As shown in Fig. 1, the color intensity of glycated whey proteins increased over time. Specifically, glycation groups treated with GO and MGO displayed a significant color deepening, indicating an efficient glycation process. Upon observation in the initial 15-min period, the groups treated with GO and MGO displayed a sharp color deepening, suggesting that the two α-dicarbonyl compound had rapidly progressed to the end of the Maillard reaction within 15 min. This reaction involves GO and MGO rapidly binding with amino acids to produce glycation end products e.g. melanoidins, which is the product of cleavage post-Amadori rearrangement. When the glycation time extended to 60 min, the GO and MGO treatment groups continued to produce brown substances, whereas the group treated with glucose displayed minimal changes. This might be due to the fact that the glucose glycation process was still in the early or intermediate stages after 60 min, without producing sufficient aldehydes, ketones, or furfural-like substances to react with the amino acids After 120 min, the GO and MGO treatment groups did not display significant changes in appearance or color, indicating that the Maillard reaction had essentially reached equilibrium and the protein glycation was completed previously. Meanwhile, the color of the glucose treatment group transitioned to a yellow hue, indicating the production of brown substances.
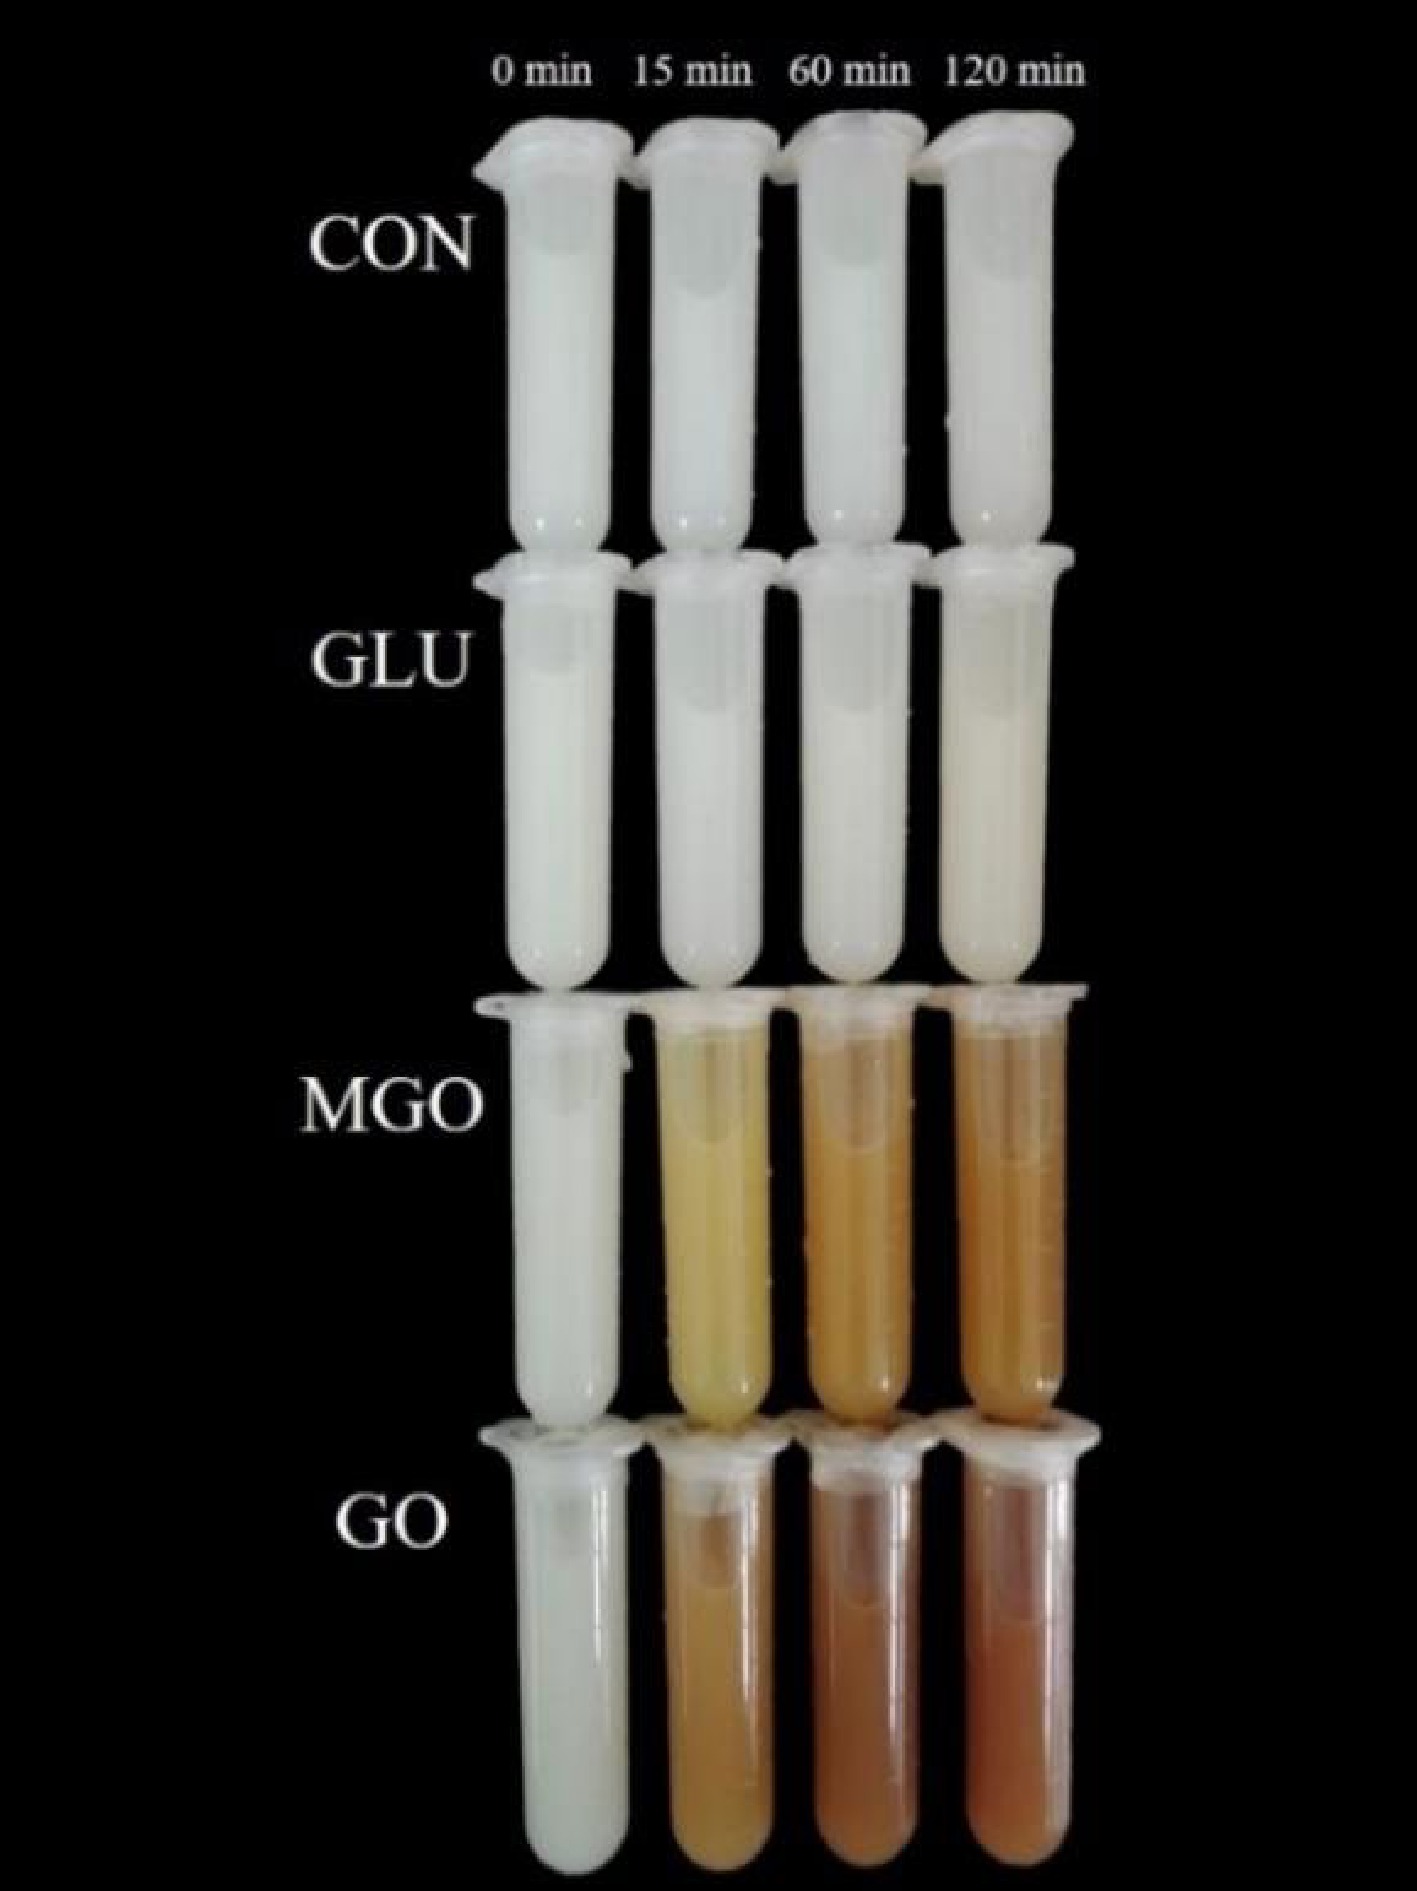
Figure 1.
Changes in appearance during whey protein glycation, including control (CON), glucose (GLU), methylglyoxal (MGO) and glyoxal (GO) group.
Alterations in whey protein solubility during the glycation process
-
As depicted in Supplemental Fig. S1, the solubility of whey protein within the system varied with the progression of the glycation process, and different glycation treatments caused disparate results. In the control group (pure whey protein), whey protein solubility within the system notably decreased over time during the 95 °C water bath. This observation aligned with the findings by Shimada & Cheftel[15] which could be attributed to the occurrence of reversible or irreversible thermal denaturation reactions in whey protein and the subsequent aggregation of globular proteins after irreversible unfolding and refolding[16]. A similar trend was observed in the glucose treatment group, although it showed a higher average protein solubility (8.91 mg/mL) than the control group (6.80 mg/mL). This suggested that glucose glycation enhanced the solubility of whey proteins to a certain extent.
Interestingly, the GO and MGO glycation groups displayed higher solubility with increasing glycation time, representing 11.04 and 12.87 mg/mL, respectively, after two hours of glycation. This phenomenon could be ascribed to the binding of α-dicarbonyl compounds, which generated more hydrophilic groups on the protein surface and then enhanced the affinity of whey protein with water[17].
These observations strongly suggested that the positive effect of glycation on protein solubility is significantly greater than the negative effect of thermal aggregation. Furthermore, the carbonyl groups introduced during the glycation process might also enhance the spatial steric hindrance to inhibit the aggregation of whey proteins.
Progression of the Maillard reaction in the whey protein glycation system
Alterations in free amino groups in whey protein glycation systems
-
Table 1 demonstrates that after 120 min glycation, the quantity of detectable free amino groups in each system reduced to varying extents. In the initial 15 min of glycation treatment, the quantity of free amino groups in the control and glucose group systems were 13.80% and 10.53%, respectively. This increase might be associated with the exposure of additional amino groups due to the unfolding of whey proteins during thermal denaturation. Conversely, in the GO and MGO treatment groups with robust glycation reaction, the quantity of free amino groups detected in the system either remained static or decreased significantly (21.43%). Heating could increase the quantity of free amino groups in the system, thus it could be inferred that a strong glycation reaction occurred in the MGO and GO treatment groups at the onset of the glycation treatment. The glycation efficiency of GO appeared superior to that of MGO, potentially due to the steric hindrance and electron-pushing effects of alkyl groups in MGO, which could affect the nucleophilic activity of its carbonyl group[18].
Table 1. Changes in free amino acids during whey protein glycation, including control (CON), glucose (GLU), methylglyoxal (MGO) and glyoxal (GO) group.
Sample UV absorbance 0 min 15 min 60 min 120 min CON 0.29 ± 0.01c,B 0.33 ± 0.01b,A 0.35 ± 0.01b,A 0.34 ± 0.02a,A GLU 0.38 ± 0.01a,B 0.42 ± 0.01a,A 0.42 ± 0.02a,A 0.37 ± 0.01a,B MGO 0.32 ± 0.01b,B 0.32 ± 0.01b,B 0.34 ± 0.01b,A 0.31 ± 0.01b,B GO 0.28 ± 0.01c,A 0.22 ± 0.01c,B 0.13 ± 0.00c,C 0.13 ± 0.00c,C After 60 min of glycation, the quantity of free amino acids was still increasing in the control group, whereas no change was noted in the glucose treatment group, suggesting that glycation had taken place to some degree in the glucose glycation system at this time. The MGO treatment group also demonstrated an increasing trend in the quantity of free amino acids, indicating that the binding efficiency of the carbonyl group to the amino group during the glycation process from 15 to 60 min was lower than the exposure rate of the amino group during the heating process. In contrast, the quantity of free amino acids was significantly lower in the GO glycation treatment group, indicating that the binding rate of free amino groups in the GO binding system was significantly higher than that of the other compound treatment groups at this stage.
The decline of free amino acids in the control group after the final 60 min of glycation might be related to the 80% purity of used whey protein isolate, which could not completely avoid the presence of lactose and other substances. Consequently, these substances could bind to the free amino acids in the system to a certain extent. On the other hand, prolonged high temperature treatment might cause protein denaturation. As indicated previously, the glycation of the glucose treatment group intensified at this stage, indicating that the glucose treated system produced a large amount of complex melanoidins to combine with the free amino groups, and resulted in an 11.9% reduction of free amino groups. The quantity of free amino acids in the MGO glycation system kept decreasing, which might due to various complex Maillard reaction products continuing to bind to the free amino groups to generate advanced glycation end products. Intriguingly, no change was detected in the quantity of free amino acids in the GO glycation group compared to an hour earlier. Considering the initial intensity of the GO glycation reaction, this could be explained that the release rate of free amino acids from the system had reached equilibrium with its binding efficiency, or the Maillard reaction had reached equilibrium at the end of the glycation process. The total reduction of free amino groups in the GO treatment group was 53.57%, compared to the pre-glycation group, which greatly surpassed the other glycation treatment groups.
Production of fluorescent glycation structures during whey protein glycation
-
Glycation structures e.g. pyrrolesin, pentosin, Glyoxal derived lysine arginine imidazolinone (G-H1), etc., are generated during the protein glycation process. By analyzing the trend of fluorescent glycation structures during glycation, the degree of glycation and the progression of the Maillard reaction can be explained. All treatment groups exhibited an increasing trend of fluorescent glycation structures intensity with the progression of glycation time, compared to the control group (pure whey protein). This trend showed as peaks in the emission wavelength range from 390 to 415 nm. It should be noted that the peak positions of the α-dicarbonyl compounds treatment group migrated significantly from those of the glucose treatment group. In the MGO treatment group, the peak position progressively 'blue-shifted' with the extension of glycation time. The peak in the MGO glycation group shifted from 408 to 391 nm and from 2,514 to 9,403 A.U. within 15 to 120 min. Intriguingly, the change in peak position of the GO treatment group demonstrated an exact contrast to that in the MGO treatment group, which showed a gradual 'red shift' from 404 nm at 15 min to 414 nm at 120 min, and the peak increasing from 2,280 to 3,059 A.U. In comparison with glucose and GO, the MGO treatment group was capable of generating more glycation structures by reacting with whey protein in a water bath at 95 °C.
According to Fig. 2, the rate of glycation structures generation during glycation was more uniform in glucose and MGO treatment groups with a substantial number of glycation structures generated in the first 15 min of glycation, compared to the GO treatment group. This result was also consistent with the free amino acid assay result above, indicating that GO has higher free amino acid binding efficiency in the early stage of glycation. Additionally, the production rate of fluorescent glycation structures in the GO treatment group significantly slowed down after one hour of glycation compared to the initial 15 min.
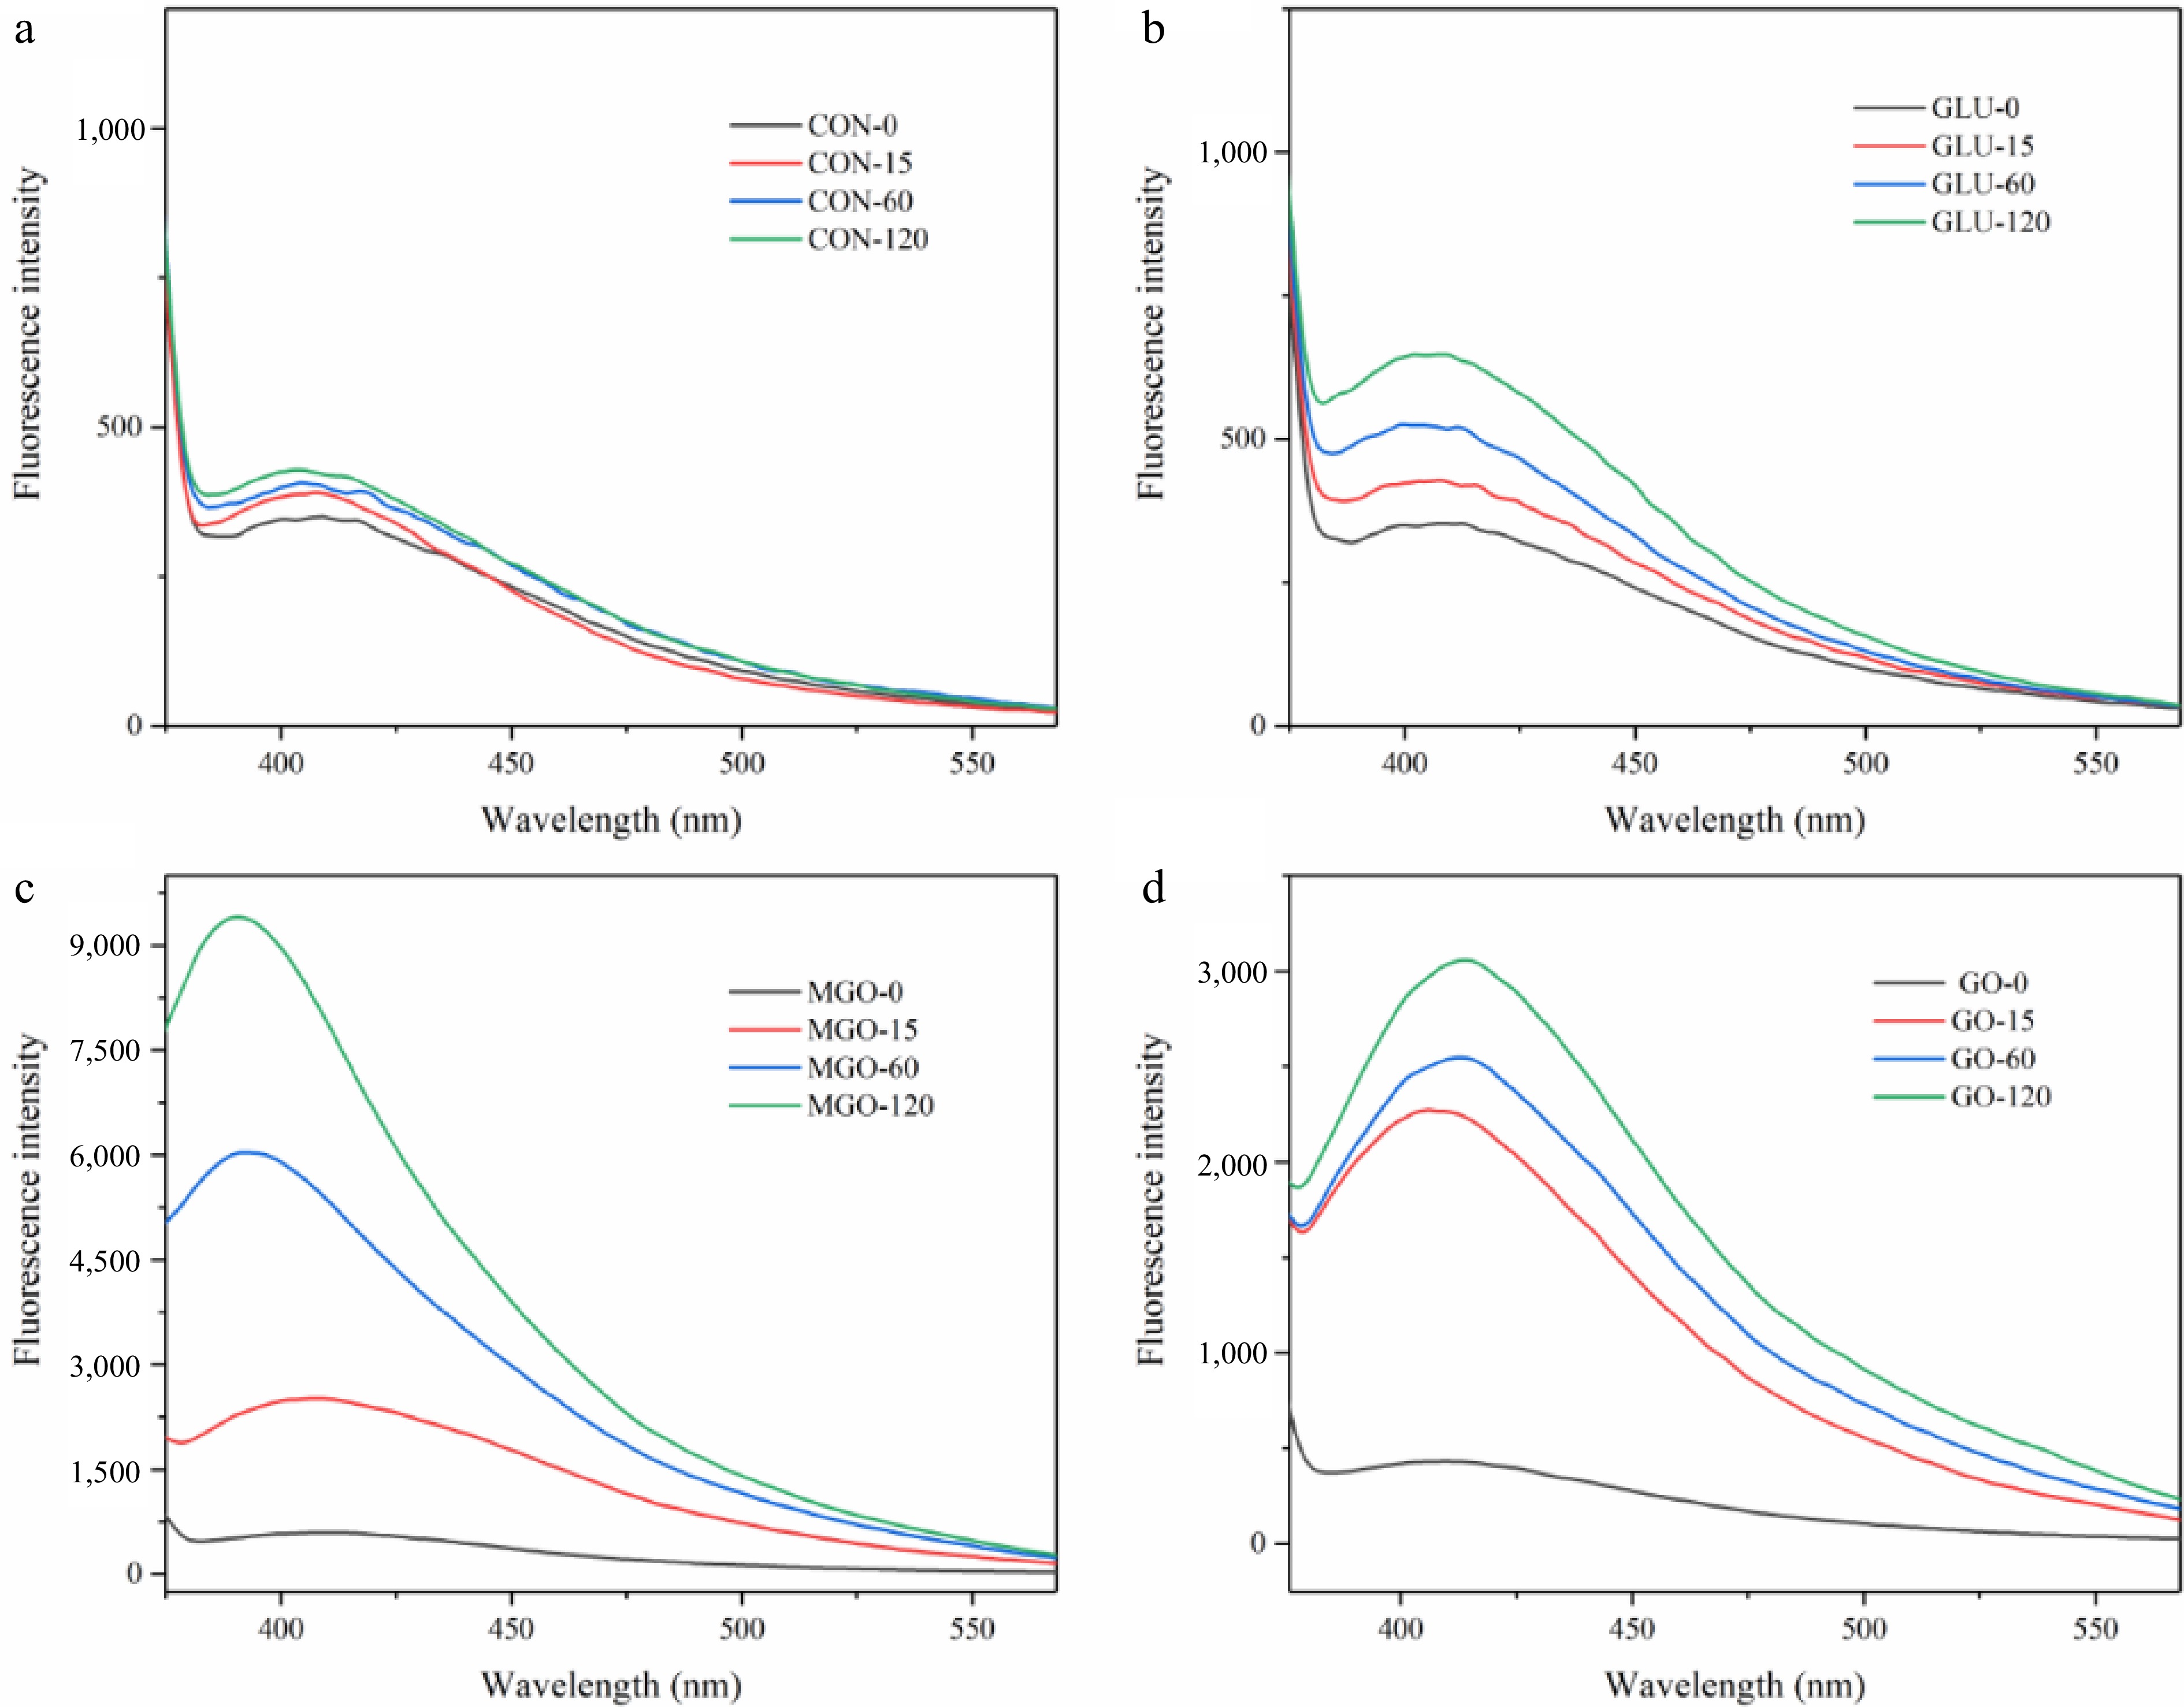
Figure 2.
Fluorescence emission spectroscopy of whey protein after glycation, representing (a) control, (b) glucose, (c) methylglyoxal (MGO) and (d) glyoxal (GO) group at 120 min of glycation processing respectively.
Changes in the secondary structure of whey protein during the glycation processing of different compounds
-
The program calculation results showed no significant differences or patterns in the alterations of α-helix, β-fold and β turn angle contents during glycation. However, the quantity of random coils in whey protein gradually decreased with the extension of glycation time. This could be due to the protein structure unfolding caused by heat treatment or the steric hindrance effect after the linkage of carbonyl.
According to Supplemental Fig. S2, the far-UV circular dichroism chromatograms provided a clear visualization of the effect of different compounds on the glycation of whey proteins. Interestingly, the negative peaks of the glucose and MGO treatment groups decreased and showed 'red-shift' in the samples at the onset of glycation However, the most reactive glyoxal was almost the same as the control group when the glycation time reached 15 min. The shift of the circular dichroism peak represented the change of protein hydrophobicity, and the 'red-shift' indicated the increase of hydrophilicity and decrease of hydrophobicity of the protein system. These results showed that the binding of carbonyl groups during glycation exposed more hydrophilic groups to the whey protein, which also corresponded to the above results of the effect of glycation on protein solubility.
As glycation proceeded, the peak of the control group gradually approached that of the glycated group. This might be due to the purity of the used whey protein containing residual lactose, which could also cause glycation effects on the protein itself and affect its secondary structure[19]. Interestingly, some studies about the secondary structure of glycated whey protein demonstrated an increase in the peak of circular dichroism and a 'blue shift' as glycation proceeded[20,21], which contradicted the results of this experiment. These difference could be due to the fact that the glycation method was wet and the temperature (95 °C) was significantly higher than the conditions of those studies (65 and 80 °C). Besides, the combination of high temperature and linkage of carbonyl led to high complexity of protein structural changes.
Modification of whey protein gastrointestinal digestive properties in vitro by glycation
Impact of glycation modifications on amino group release during whey protein digestion
-
Figure 3 demonstrates that glycation modification not only significantly suppressed both gastric and intestinal digestion of proteins. Considering the distinct hydrolysis sites of pepsin (phenylalanine, tryptophan, tyrosine, etc.) and the modification sites of protein glycation, the glycation modifications might influence the gastric digestion of proteins by other mechanisms, possibly including steric hindrance and electrostatic repulsion[22].
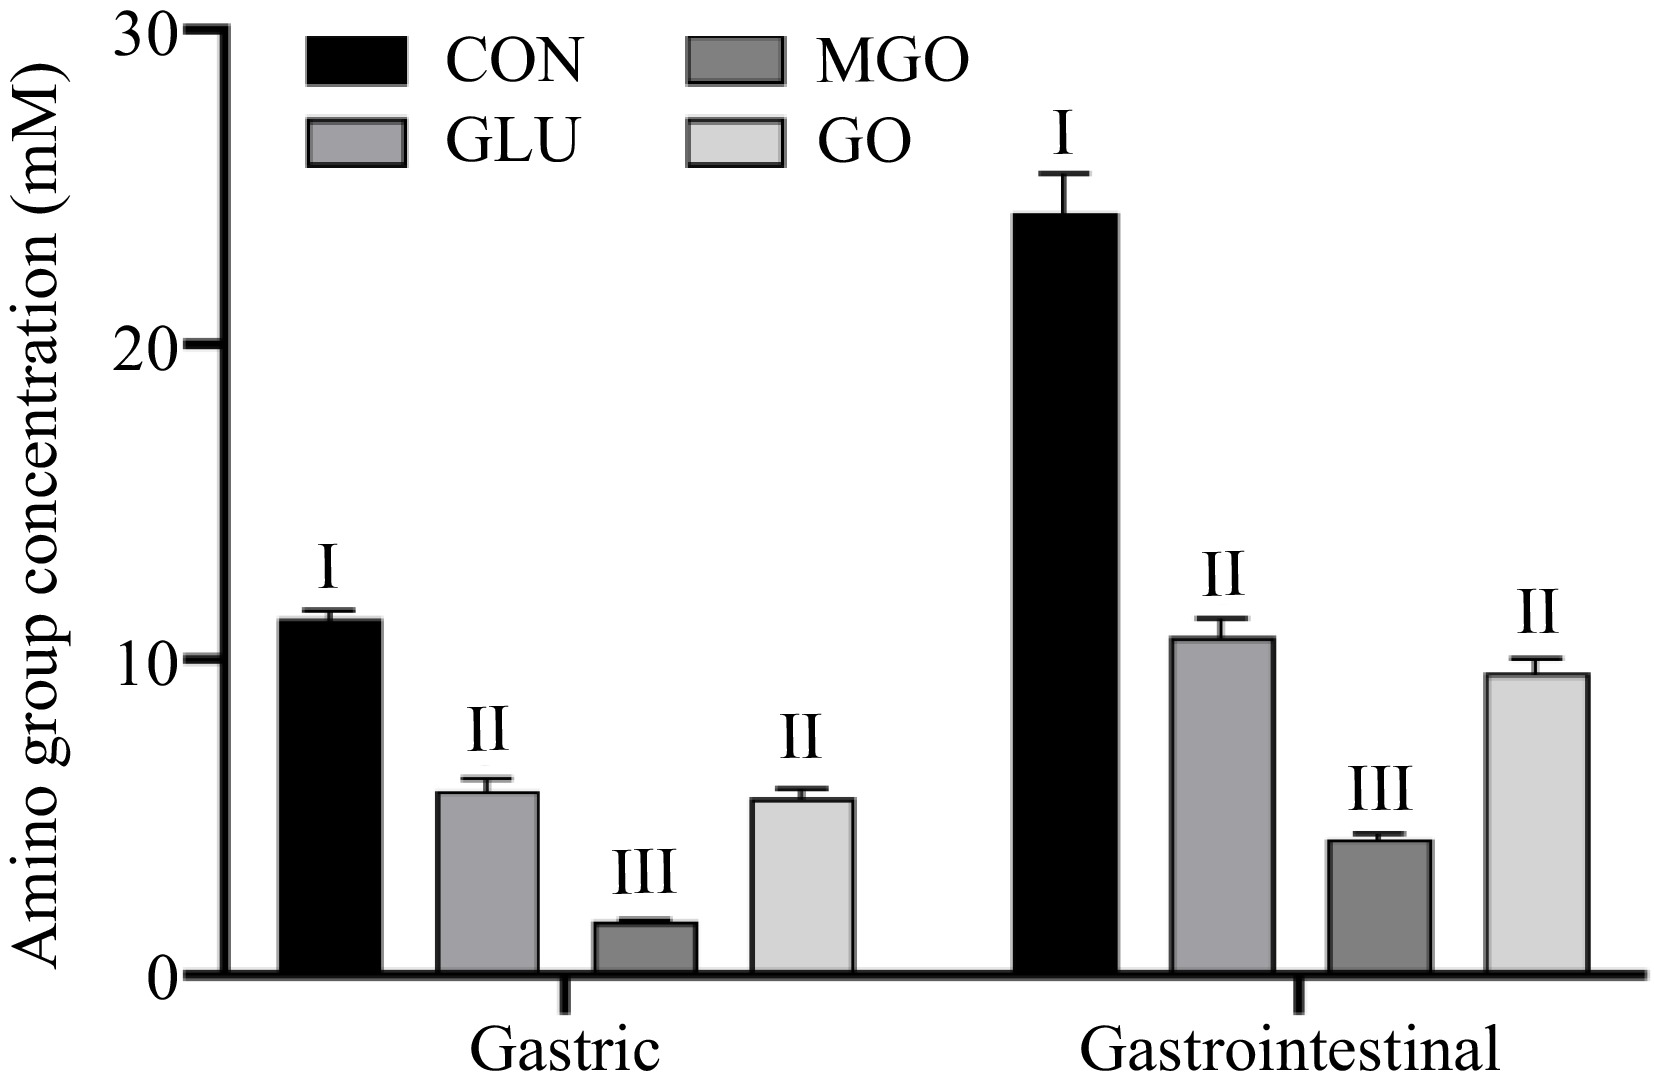
Figure 3.
Changes in amino group releasing glycated whey protein after in vitro gastrointestinal digestion. Letters I−III denote significance levels (p < 0.05) between different treatment groups after the same digestion time, including control (CON), glucose (GLU), methylglyoxal (MGO) and glyoxal (GO) group.
Observations from Fig. 3 reveal that all three glycation treatment groups released fewer amino group during the gastric digestion than control group. Compared to the control group (11.32 mM), the whey protein in the glucose treatment and GO treatment groups released 5.84 mM and 5.61 mM of amino group, respectively, exhibiting similar inhibitory effects after gastric digestion. This indicated that the glucose treatment groups generated comparable effects to the GO treatment groups that could prevent the action of pepsin during gastric digestion process. Considering the alteration of surface hydrophobicity on the whey protein by glycation did not account for the change in digestion level, this inhibition might be attributed to the introduction of mechanical and spatial resistance to gastric enzymes by the sugar chain structure. MGO glycation exhibited the most potent inhibitory effect on whey protein digestion, compared to the control group with an 82.79% decrease in the level of amino acid release during gastric digestion. This might be due to the alkyl groups in MGO that could form stronger steric block and electron-pushing effect on the function of gastric enzymes, compared to glucose and GO treatment groups.
During the intestinal digestion, the inhibitory outcomes of glycation treatment groups were consistent with the gastric digestion process. The level of amino acid released from whey protein after glycation with glucose, GO and MGO decreased by 55.59%, 60.26% and 82.16%, respectively, compared to the control group. A negative correlation existed between the degree of glycation and the level of protein digestion, i.e., higher glycation degrees result in fewer hydrolyzed amino group from the protein. This phenomenon might be due to the loss of the trypsin cleavage site (lysine, arginine) after glycation[21,23,24], the steric hindrance caused by the introduction of the sugar chain structure and the formation of macromolecular cross-linked structure by the Maillard reaction product, which was confirmed by Luz Sanz et al.[25] and Zhao et al.[26]. Considering the production of fluorescent glycation structures during the glycation process as mentioned above, it was plausible to hypothesize that the glycation structures generated during the Maillard reaction could also affect the function of digestive enzymes in the stomach and intestine to some extent.
Distribution patterns of gastrointestinal digests of glycated whey protein across different molecular weight ranges
-
The digest patterns depicted in Fig. 4 indicate that the digests produced between the 10th and 24th min possess molecular weights exceeding 10 kDa. Those appearing between the 24th and 30th min have molecular weights ranging between 1 and 10 kDa, while those surfacing between the 30th and 65th min carry molecular weights of less than 1 kDa. The tyrosine sample is eluted at the 44th min and the tryptophan sample at the 57th min.
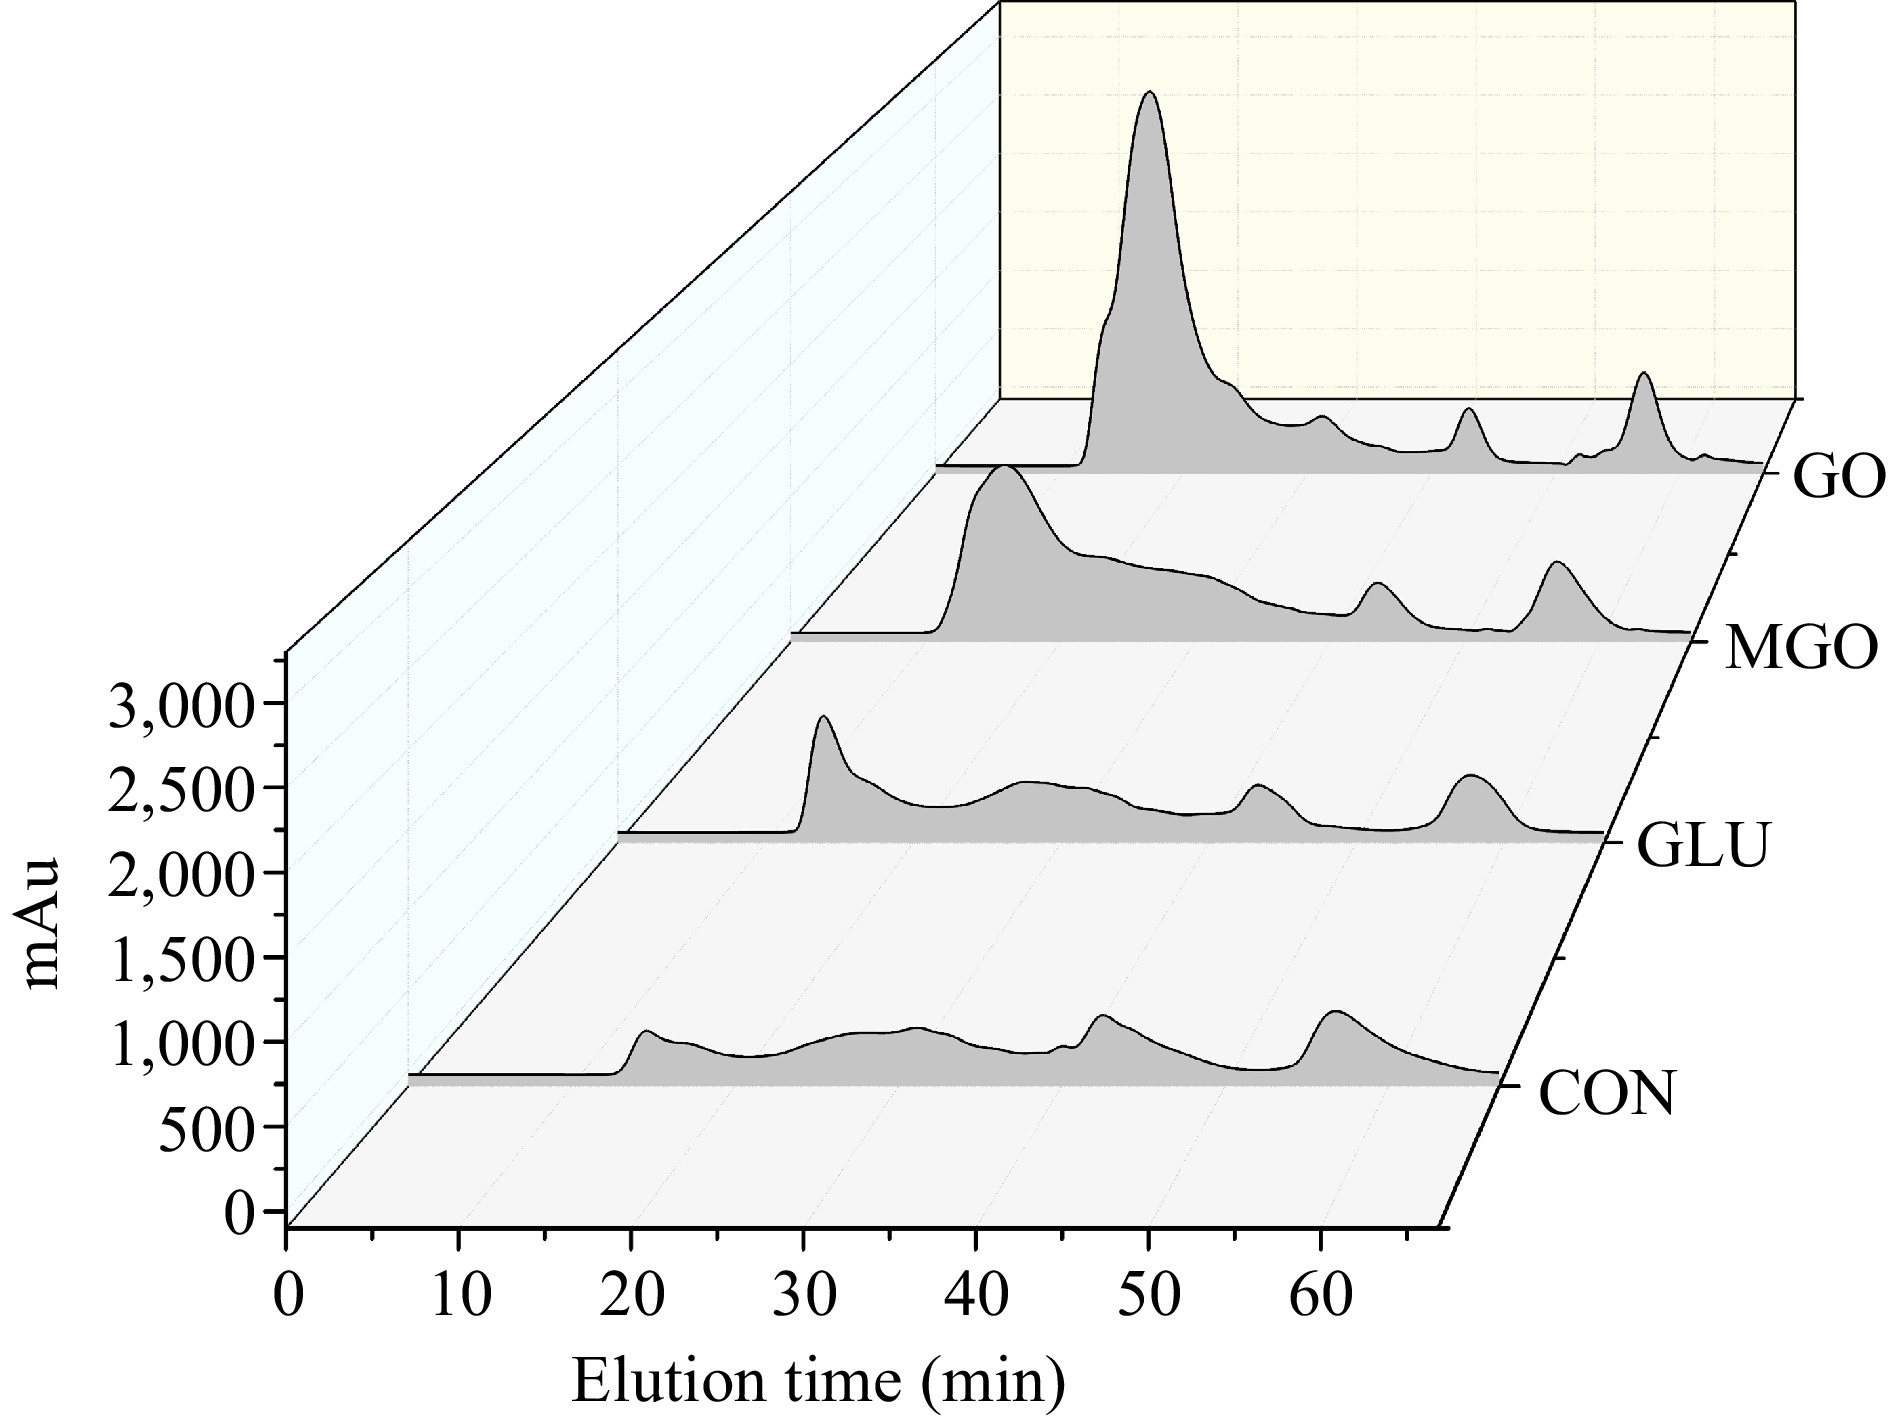
Figure 4.
FPLC profiles for gastrointestinal digests from control or glycated whey protein, including control (CON), glucose (GLU), methylglyoxal (MGO) and glyoxal (GO) group.
From the analysis above, it was determined that glycation modification could significantly reduce the degree of protein digestion, which was supported by the molecular weight distribution in Fig. 4. It was evident that the quantity of large molecular weight digests notably increased after glycation modification. This increase was especially pronounced in both MGO and GO treatment groups, which had much more digests larger than 10 kDa than that in the glucose treatment and control groups. It should be noted that the tyrosine peak in the glycation treatment groups was slightly lower than that in the control group, whereas the tryptophan peak was higher than that in the control group. This observation suggested that the introduction of sugar chain structures decreased the digestion efficiency at tyrosine sites by pepsin/chymotrypsin during gastrointestinal digestion, while it enhanced the hydrolysis at tryptophan sites. This phenomena indicated that the integration of sugar chain structures could cause a complex impact on the efficiency of digestive enzymes by generating additional steric hindrance or other repulsive effects
Intervention impact of whey protein gastrointestinal digests on STC-1 cells
-
Intervention of STC-1 cells was executed to define the cellular activity employing both Alamar blue and CCK-8 methodologies. Figure 5 shows that the gastric and intestinal digests of whey protein, across different concentrations, did not exert substantial toxic effects on STC-1 cells. Consequently, concentration selection primarily focused on the nutritional perception, especially the stimulation of hormone secretion, of the protein by STC-1 cells.
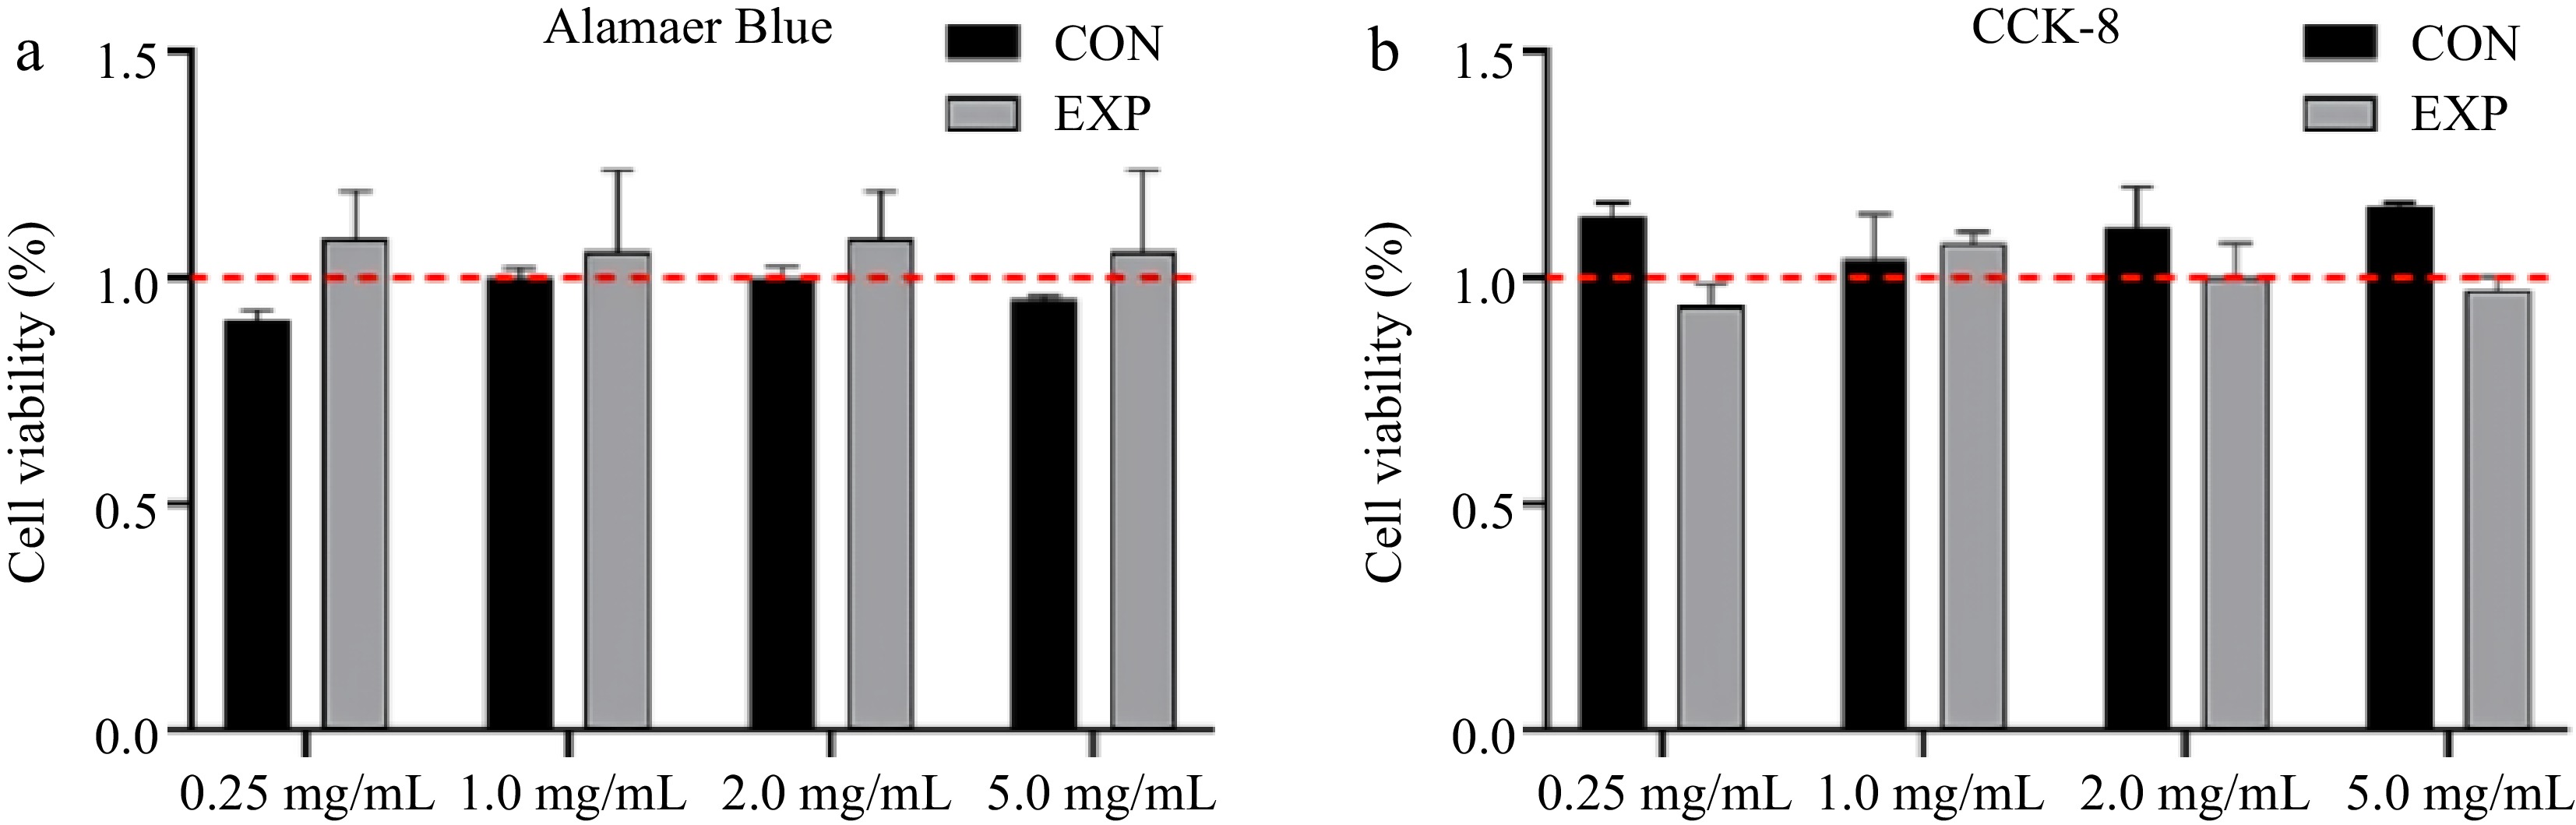
Figure 5.
Influence of different concentration of whey protein digests treatment on STC-1 cells viability, which was tested by (a) Alamar blue and (b) CCK-8.
Comparison of cellular state of STC-1 cells before and after the intervention of glycated whey protein digests
-
The transfer of cells to the six-well plate allowed for a comprehensive view of their morphology and growth state before and after intervention, which could be observed by microscopy. STC-1, the mouse intestinal epithelial cells, is typically capable of growth. As illustrated in Supplemental Fig. S3a, at initial transfer to the six-well plate, the cells displayed a spherical shape. After 18-h of incubation (Supplemental Fig. S3b), the cells visibly adhered to the wall and displayed a standard 'shuttle' shape, indicating a healthy growth state. Following the introduction of 2 mg/mL of glycated whey protein gastric and intestinal digests and a 3-h control group (Supplemental Fig. S3c), STC-1 cells exhibited healthy growth and maintained normal physiological status.
Influence of glycated whey protein gastrointestinal digests on hormone secretion levels of STC-1 cells
-
Gastric and intestinal digests from the four treatment groups were used to incubated STC-1 cells for three hours. The concentrations of GLP-1, CCK, GIP, and PYY in the intervention solution were measured by ELISA. As shown in Fig. 6a, neither gastric nor intestinal digests of whey protein significantly stimulate GLP-1 secretion in STC-1 cells. However, gastric digests of the control, glucose and GO treatment groups demonstrated a significantly stronger stimulatory effect on GLP-1 secretion in STC-1 cells, compared to their intestinal digests. Additionally, gastric digests of GO treatment groups exhibited the strongest stimulatory effect. This observation might arise from the fact that gastric digests of GO treatment groups contained more large-molecule glycation products, which was the main factor confirmed by Santos-Hernández et al.[3]. This could also explain the weaker stimulatory effect of intestinal digests on GLP-1 secretion, compared to gastric digests.
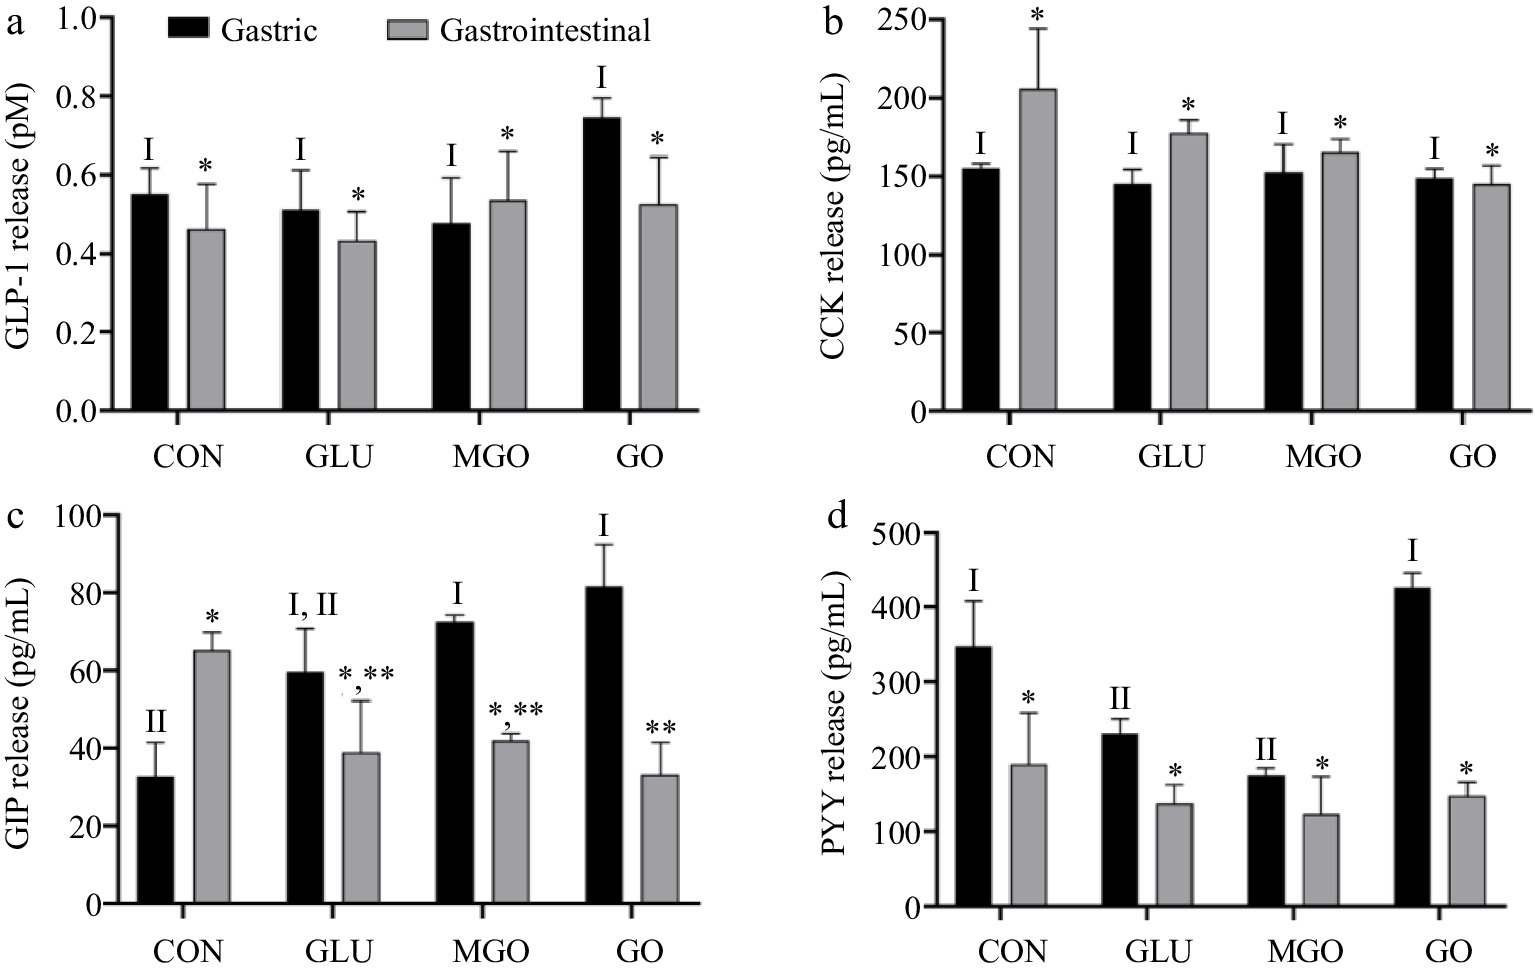
Figure 6.
The quantity of (a) GLP-1, (b) CCK, (c) GIP, (d) PYY secreted by STC-1 cells after glycated whey protein gastrointestinal digests treatment. Letters I−II denote significance levels (p < 0.05) between treatment groups after gastrointestinal digestion, including control (CON), glucose (GLU), methylglyoxal (MGO) and glyoxal (GO) group.
As Fig. 6b depicts, the gastric and intestinal digests of glycated whey protein did not significantly affect the regulation of CCK secretion in cells. However, the intestinal digests of all three glycation groups seemed to exhibit some inhibition of CCK secretion, compared to the control group. It has been demonstrated that varying STC-1 cell lines might exhibit different hormonal secretory capacities, and whey protein hydrolysis products did not stimulate CCK release in STC-1 cells[27]. Therefore, it could be assumed that some of the gastrointestinal digests of glycated whey protein might inhibit the CCK secretion process in STC-1 cells.
Figure 6c presents the variation in the quantity of GIP secreted by cells, which, as mentioned earlier, was influenced by the perception of both carbohydrates and proteins by enteroendocrine cells (EECs). Therefore, the quantity of GIP secretion exhibited much significant differences. Intestinal digests stimulated GIP secretion more significantly than gastric digestive products in the control group, and the stimulatory effect of gastric digests of glucose treatment group was not significantly different from that of the control group. However, the MGO and GO treatment groups demonstrated stronger stimulatory effects than control and glucose treatment groups. This could be due to the superior glycation capability of MGO and GO, introducing more sugar chain structures in whey protein. Therefore, their digests could induce a stronger stimulation effect on STC-1. Moreover, smaller molecular weight of gastrointestinal digests seemed to exhibit stronger facilitation effect on GIP secretion. Due to the negative effect of glycation on whey protein digestion causing higher proportion of large-molecular-weight digests, the glycation treatment group exhibited the lowest level of GIP secretion, especially in the GO treatment group.
Figure 6d shows the alterations in cellular PYY secretion after intervention. Evidently, the stimulation of PYY secretion by gastric digests was comparatively weak in all four treatment groups. Both glucose and MGO treatment groups displayed an inhibitory effect on PYY secretion compared to the control group. However, the GO treatment group did not seem to be significantly affected. Regarding gastrointestinal digestive products, all four treatment groups demonstrated low levels of secretion, and no significant differences were observed among each group.
Influence of gastrointestinal digests of glycated whey protein on mRNA levels of STC-1 cytokines
-
Considering no significant differences of the secretion levels of GLP-1 and CCK among groups using ELISA assay, and the inherent instability of these hormones, the mRNA levels of their corresponding genes were examined. As shown in Fig. 7a, the gastric digests in all three glycation treatment groups upregulated the mRNA levels of GLP-1. However, no significant differences were found due to the relatively large Scanning Electron Microscope (SEM) in each group. Additionally, the mRNA levels of the CCK were significantly upregulated by the gastric digests of the MGO and GO treatment groups. This could be attributed to the increased molecular weight of the gastric digest of glycated whey protein. It was mentioned above that a large-molecular-weight digest could stimulate the secretion of GLP-1.
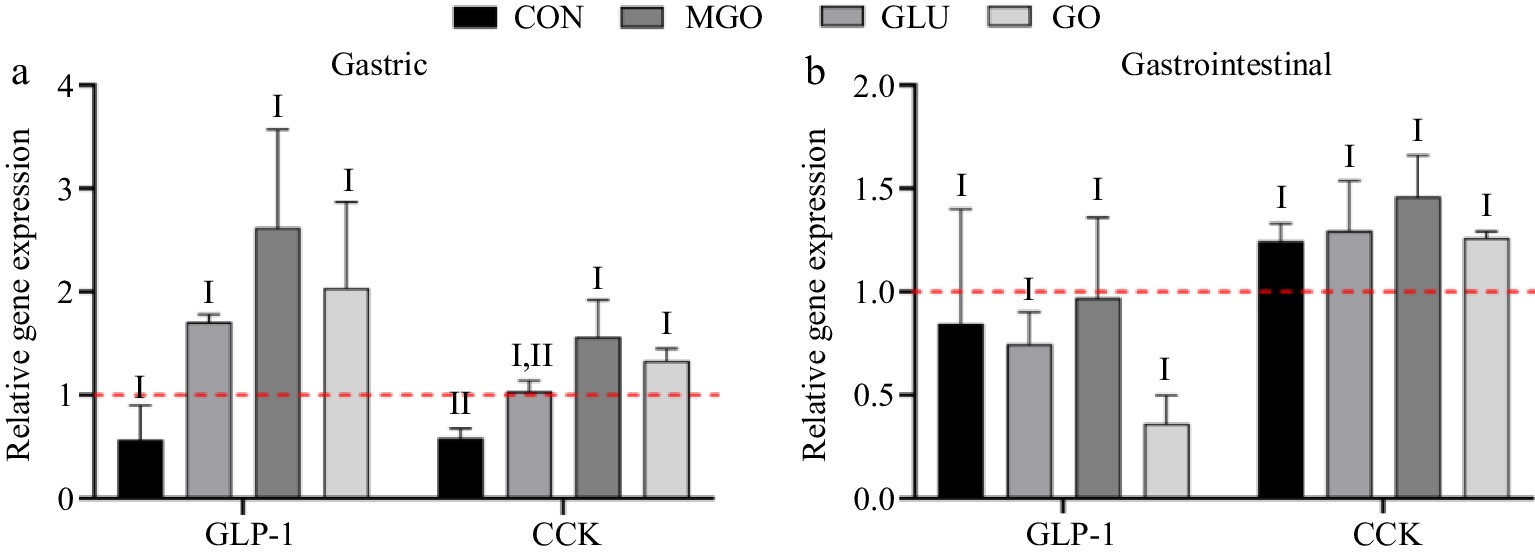
Figure 7.
GLP-1 and CCK mRNA levels in STC-1 cells after (a) glycated whey protein gastric and (b) intestinal digests treatment. Letters I and II denote significance levels (p < 0.05) between different treatment groups for the same hormones mRNA secreted after gastric and gastrointestinal digestion, including control (CON), glucose (GLU), methylglyoxal (MGO) and glyoxal (GO) group.
For the intestinal digests, neither the control group nor the glycation treatment group showed significant regulation of mRNA levels of GLP-1 and CCK hormone. However, the GO treatment group exhibited the lowest mRNA levels of GLP-1, while it displayed relatively higher GLP-1 secretion.
-
The α-dicarbonyl compounds (GO, MGO) could quickly glycate with free amino groups of lysine and arginine presenting in whey protein, leading to an increase in the solubility of whey protein. Among all experimental compounds, GO exhibited a higher glycation efficiency. During the glycation process, the incorporation of sugar chain structure and the exposure of hydrophilic groups resulted in a decrease surface hydrophobicity and an increase in hydrophilicity of whey protein. The gastrointestinal digestibility of whey protein was reduced due to the cross-linked sugar chain structure, the spatial blocking effect of glycol-conjugate introduction into whey protein, and the loss of lysine sites during after glycation.
The gastrointestinal digests of the GO treatment group exerted the most potent stimulating effect on GLP-1 secretion in STC-1 cells. The gastrointestinal digests of glycated whey protein partially inhibited CCK secretion while significantly promoted GIP secretion. The gastrointestinal digests of the treatment groups demonstrated a notable promotion of PYY secretion, in comparison to the gastrointestinal digests of the glycated proteins, and upregulated the mRNA levels of GLP-1 and CCK.
This study is an initial exploration of the effects of gastrointestinal digests of glycated proteins on the hormone secretion of intestinal endocrine cells. The findings could potentially play a role in the dietary intervention and treatment of many long-standing chronic diseases, e.g., obesity and diabetes. Furthermore, these results might promote the research of precision nutrition and contribute to the progress of this important field.
-
The authors confirm contribution to the paper as follows: Conceptualization, funding acquisition: Zhao D; data curation: Zhang K, Wang Y; formal analysis: Zhang K, Wang Y, Sheng B; draft manuscript preparation: Zhang K, Zhao D; manuscript review & editing: Sheng B, Zhao D. All authors reviewed the results and approved the final version of the manuscript.
-
The datasets generated during and/or analyzed during the current study are available from the corresponding author on reasonable request.
This work was financially supported by the National Natural Science Foundation of China (No. 32001722).
-
The authors declare that they have no conflict of interest.
-
These authors contributed equally: Kexin Zhang, Yuxuan Wang
- Supplemental Fig. S1 Changes in solubility of whey protein after glycation for 0, 15, 60 and 120. Letters a-d denote significance levels (P < 0.05) between different glycation time under same treatment.
- Supplemental Fig. S2 Far-UV circular changes of whey protein during glycation, letters A/B/C/D represent the CD spectrum of control and experimental group at 0, 15, 60 and 120minutes during glycation processing.
- Supplemental Fig. S3 Cell state before and after glycated whey protein digests treatment. (A) represents the state of STC- 1 when they were just seeded into six well plates, (B) represents the state of STC- 1 before glycated whey protein digests treatment and (C) represents to the cell state after digests treatment.
- Copyright: © 2023 by the author(s). Published by Maximum Academic Press on behalf of Nanjing Agricultural University. This article is an open access article distributed under Creative Commons Attribution License (CC BY 4.0), visit https://creativecommons.org/licenses/by/4.0/.
-
About this article
Cite this article
Zhang K, Wang Y, Sheng B, Zhao D. 2023. Influence of gastrointestinal digests of glycated whey protein on the hormone secretion of enteroendocrine cells. Food Materials Research 3:29 doi: 10.48130/FMR-2023-0029 

Influence of gastrointestinal digests of glycated whey protein on the hormone secretion of enteroendocrine cells
- Received: 15 July 2023
- Accepted: 06 September 2023
- Published online: 02 November 2023
Abstract: The present research used two α-dicarbonyl compounds, glyoxal and methylglyoxal and whey protein as subjects, and evaluated the alterations of physicochemical properties, structure, and digestibility of whey protein throughout the glycation process. The STC-1 cells were used as a model to investigate the implications of glycation on the protein nutrition sensing of enteroendocrine cells. Results showed that glycation substantially enhanced the surface hydrophilicity and solubility of whey protein. Additionally, the incorporation of sugar chain structure introduced steric hindrance, facilitating the binding of the free amino group of lysine and resulting in the formation of macromolecular crosslinking glycation structures. These structures potentially hindered the function of gastrointestinal digestive enzymes, thus reducing the degree of digestion. Furthermore, the gastric and intestinal digests of glycated whey protein variably modulated the intestinal hormone secretion of STC-1 cells and elevated the mRNA levels of pertinent hormones. Derived patterns of the effect of the gastrointestinal digestion products of glycated proteins on the level of hormone secretion in enteroendocrine cells.
-
Key words:
- Glycated protein /
- Digestibility /
- Nutrients sensing