-
Nuts have been a significant part of humans' diet since pre-horticultural times[1]. A nut is considered organically as a basic dry natural product with one seed (or all the more in some cases) and a solidified ovary divider at development. In any case, in a culinary sense, nuts are generally sorted, and the term is applied to numerous seeds that are not naturally acknowledged as nuts. It incorporates oily kernels found inside a shell that is utilized in food. A few models include almonds, Brazil nuts, pistachios, cashew, pine nuts, groundnuts, etc. They are consumed moreover as snacks or part of a meal[2, 3]. They can be eaten entirely (fresh or roasted), in spreads (almond paste, peanut butter), or as part of commercial items, such as heated products, sauces, and oils. Almond utilization has developed lately because of current investigations concentrating on the potential remedial advantages of almonds. As per a few examinations, almond utilization may decrease low-thickness lipoprotein (LDL) cholesterol fixation, and due to its low glycemic list, it doesn't adversely influence insulin affectability[4, 5]. Wien et al.[6] discovered that a diet supplemented with almonds could enhance insulin sensitivity and reduce the risk of cardiovascular diseases in individuals with pre-diabetes. A recent study demonstrated that prolonged consumption of almonds exhibited hypophagic and nootropic effects in rodents[7, 8]. The nut frames, as explained by the FDA, may be classified as follows: 'Scientific evidence suggests, but does not prove, that consuming 1.5 ounces per day of most nuts as part of a diet low in saturated fat and cholesterol can reduce the risk of heart disease'[9]. Almond oil includes five main fatty acids: including three (03) UFAs (oleic acid, monounsaturated, palmitoleic and linoleic acid, polyunsaturated), that account for 90% of the total lipids; and two (02) SFA (palmitic and stearic acid). Almond oil also contains eight (08) minor fatty acids. Among them, it is worth mentioning that polyunsaturated α-linolenic acid (ALA), like linoleic acid, is an essential fatty acid which is not synthesized by the human organism, so it must be taken in through the diet[10, 11].
The oxidation of oils and fats can detrimentally influence their quality and attractiveness. The assault of oxygen on the methylene carbons among double bonds of monounsaturated fatty acids (MUFA) and polyunsaturated fatty acids (PUFA) produces hydroperoxides[12]. Moros et al.,[13] reported that the oxidation method is particularly complex, involving several reactions that give rise to various chemical and physical changes in lipids. Bhattacharya et al.[14] reported that during oxidation, the atmospheric oxygen reacts instantly with oil and other (natural compounds) to cause structural degradation in the oil, which leads to loss of quality of food and is risky to human health. The hydroperoxides can deteriorate further to potentially harmful compounds such as aldehydes. Pezzuto et al.[15] demonstrate that oxidation imparted rancid and undesirable flavors to oil products and generated reactive oxygen species connected to inflammation, aging, carcinogenesis, and cardiovascular disorders. Man et al.[16] reported that oxidative and thermal reaction changes the oil's physicochemical, nourishing, and tangible properties. The beginning of oxidation in PUFAs, for example, unsaturated fats, offer to ascend to items that might be negative to human wellbeing. Incorporating n-3 unsaturated fats into human weight control plans may anticipate coronary illness and show calming properties[17]. It is crucial to protect PUFAs from oxidation to maintain health benefits and extend the shelf life of processed oils. To prevent oxidation, it is recommended to add antioxidant and metal inhibitors to protect the oil with a nitrogen barrier. The objectives of our study are to monitor the oxidative stability of three different cultivars of almonds kernel/oil (Australian, American and Iranian) during storage at 60 °C for 21 d. The oil samples were also studied by using Fourier transform infrared spectrophotometer (FT-IR), Gas chromatography Mass spectrometry (GC-MS) as well as different conventional methods.
-
The almond kernels of different varieties (Australian, American, and Iranian) were collected in August 2021 from the local market of District Hyderabad (Longitude: 25.1827° N and Latitude: 69.1924° E) Sindh, Pakistan. All chemicals and reagents used in the present study were obtained from E-Merck, Darmstadt, Germany.
Oxidation of almond oil samples
-
The 300 g sample of oil from three different varieties of almond kernels was weighed in glass bottles. Each sample was kept in the oven at the maintained temperature of 60 °C. After every 3rd day of constant heating, the samples were taken out from the oven to determine the FFA, PV, p-AV, TOTOX and instrumental characterization FT-IR and GC-MS analysis until 21 d.
Free fatty acid (FFA)
-
The FFA as a (%) of oleic acid was determined by using a standard procedure AOCS Aa 6-38 through titration[18]. The extracted almond kernel oil was dissolved in warm neutral ethanol and titrated with sodium hydroxide (0.01N) along with indicator phenolphthalein.
Peroxide Value (PV)
-
The PV of almond kernel oil was determined by AOCS standard method Cd 8−53[18]. Briefly, 5 g of each sample was mixed with a 30 mL solution of acetic acid and chloroform (3:2 v/v ratio) in a conical flask. The mixture was constantly shaken until the sample was completely dissolved in the solution. After that, 0.5 mL of a saturated solution of potassium iodide was added and the flask was shaken occasionally. After following the solution to stand for about 1 min, 30 mL of distilled water was added. The mixture was titrated using a 0.1 N standardized solution of sodium thiosulphate until the yellow color almost disappeared. An indicator, 1% of 0.5 mL starch, was added, which resulted in a blue color. The titration process continued with constant agitation until blue color just disappeared.
p-Anisidine Value (p-AV)
-
The p-AV was determined according to the official standard method AOCS Cd 8-53[18]. In this procedure, 2 g of extracted almond kernel oil was measured into a 25 mL volumetric flask and then diluted with isooctane. After that, the absorbance of the solution was recorded with a UV-Visible spectrophotometer at 350 nm where the reference solvent isooctane was used as blank. Finally, 5 mL of oil sample was added with 1 mL of p-AV solution the mixture was then kept for 10 min, and then absorbance was recorded. p-AV solution was used as a blank in the reference cell.
Total Oxidative Value (TOTOX)
-
TOTOX value of the oil samples was determined by the sum of PV and p-AV values[18].
TOTOX value = 2PV + p-AV
Fourier Transform Infrared Spectrophotometer (FT-IR)
-
The extracted almond kernel oil was performed on (Thermo Nicolet FTIR-5700 sensitive analytic instrument, Madison, WI, USA). Fifty μL of extracted oil (almond) was put on the crystal made of zinc selenide for spectra recording. The preceding crystal was cleaned carefully after the taken each spectrum with n-hexane using soft tissue to remove the contamination of the previous sample. The instrument was controlled by OMNIC software 7.2 versions. The entire spectrum was recorded in the -mid-IR range (650 to 4,000 cm−1) with 4 cm−1 resolution and 16 scans/sample using a removable ZnSe SB-ATR sampling accessory. The spectrum of various prepared samples was obtained against the background of the air spectrum.
Gas Chromatography-Mass Spectrometry (GC-MS)
-
Fatty acid methyl ester (FAME) for different varieties of almond kernel oil samples was prepared according to the standard method (IUPAC 2.301). The FAME was analyzed and identified by GC-MS using (Agilent 6890 N gas chromatograph) coupled with (mass selective detector) Agilent Technologies (MS-5975 inert XL). The FA components were separated on a 5% phenyl methylsiloxane containing HP–5MS capillary column. A 1.0 μL methyl ester sample solution was injected into a capillary column (HP-5MS) through an autosampler (7683-B). Helium was used as a carrier gas with a 1.0 mL·min−1 flow rate; detector and injector temperatures were set in the range of 150 and 270 °C, and the split ratio was 1:35. Initially, the temperature of the oven was set at 150 °C for 2 min then the temperature was raised to 270 °C at the rate of 0 °C/min (4 min hold). The mass spectrometer instrument was operated in the electron impact (EI) mode at 70 eV in the range between 50−550 m/z.
Statistics
-
All of the analytical tests in the current study were replicated three times, and the results are presented as a mean value and standard deviation. ANOVA (one-way analysis of variance) was used to analyses the data, and Tukey's test of significant difference at p < 0.05 was used to distinguish between the means.
-
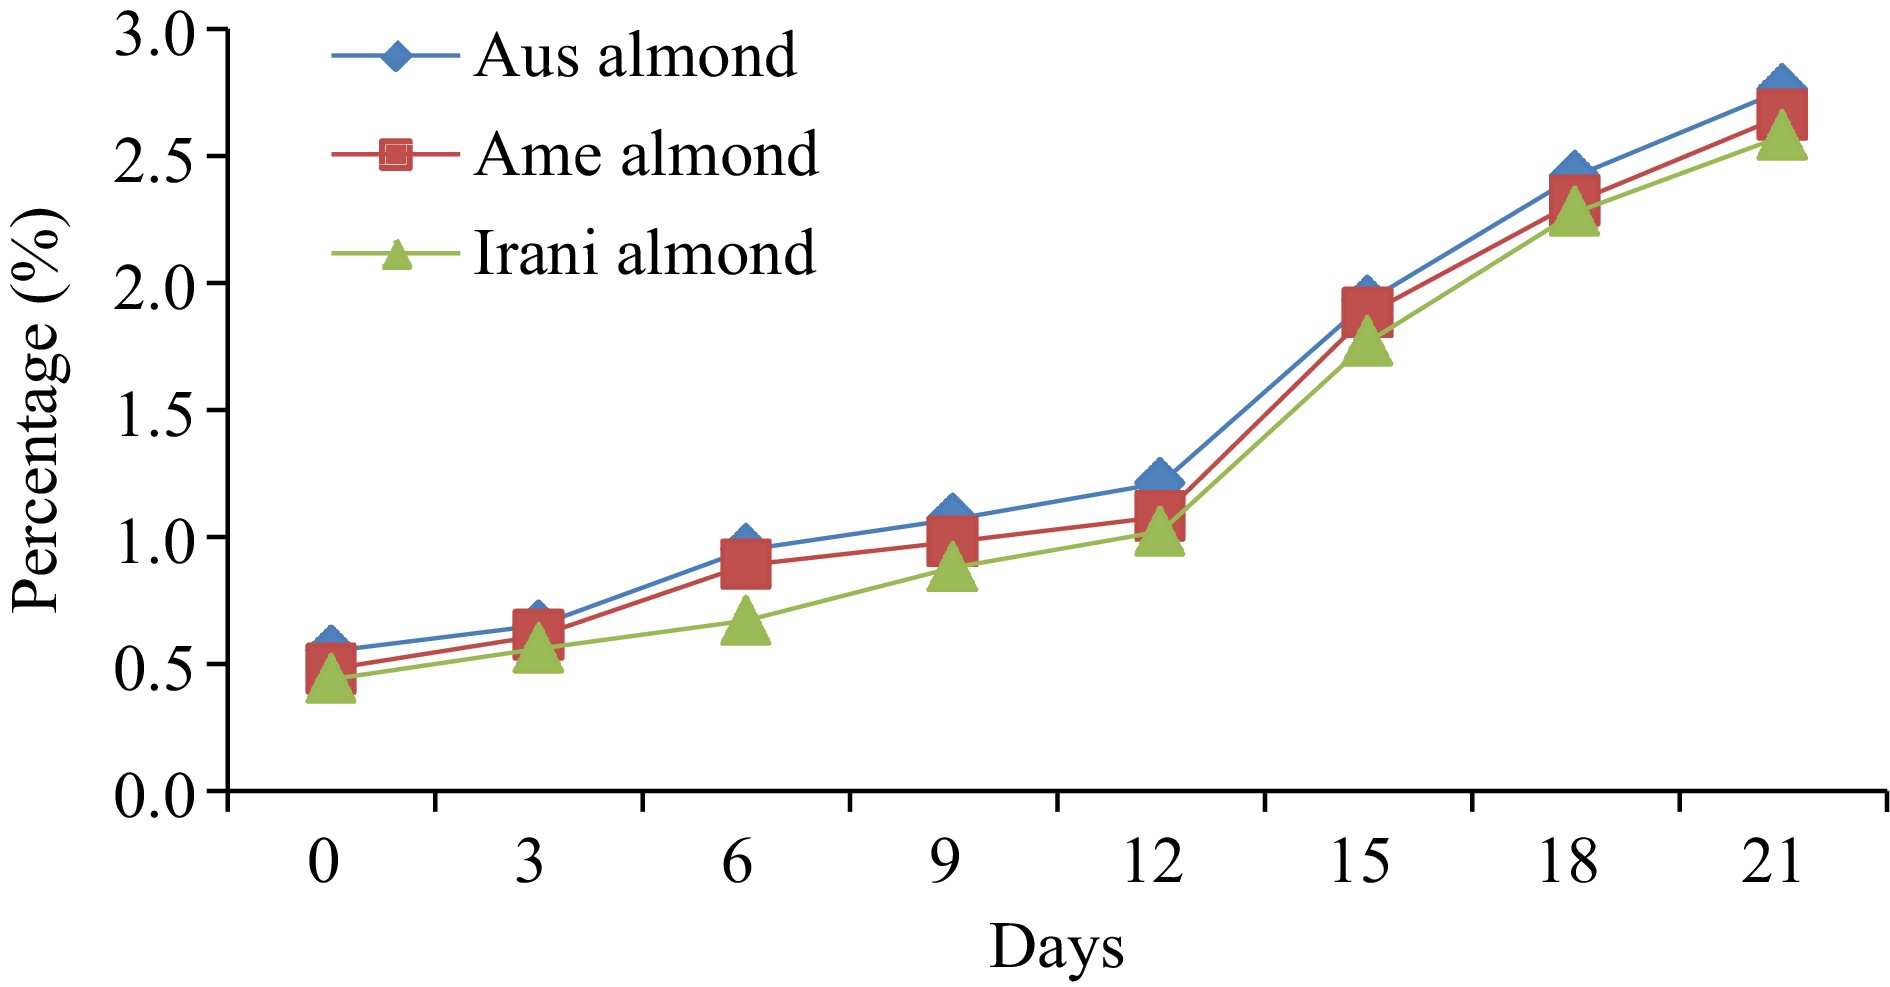
Prior to starting the oxidation of almond oil samples, the FFA values of fresh Australian, American, and Iranian almond oil were noted and found to be approximately 0.55%, 0.48%, and 0.44%, respectively. During the oxidation process at 60oC, FFA values increased linearly with the range of 0.44%−2.76%, as represented in Fig. 1. A significant difference in FFA values was observed with increasing storage time, indicating the effect of time on FFA formation, as presented in (Table 1). However, Barku et al.[19] revealed that the storage stability of almond oil lasted up to 2 months, under different temperatures showed faster deterioration of oils. When the oils were exposed to daylight, the FFA content increased to 0.58%, while storage in darkness resulted in less increase to 0.49% FFA.
Table 1. Comparative results of (FFA, PV, p-AV, TOTOX) during 21 d forced oxidation of kernels oil (almond).
Parameters Samples
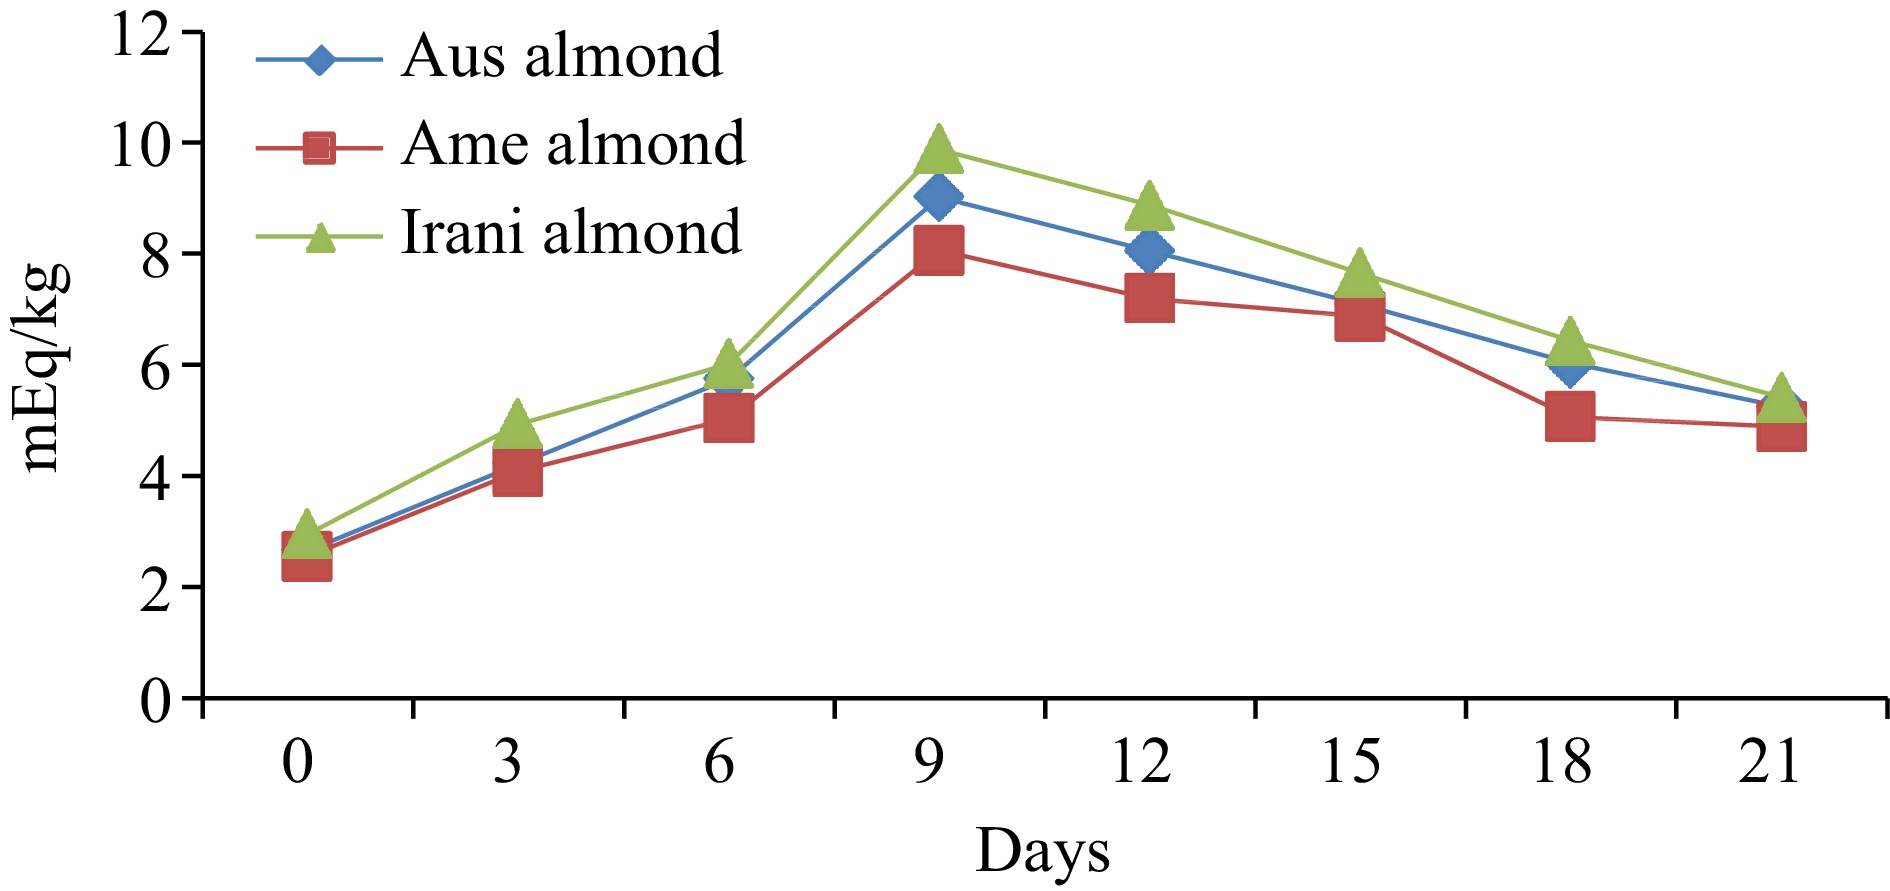
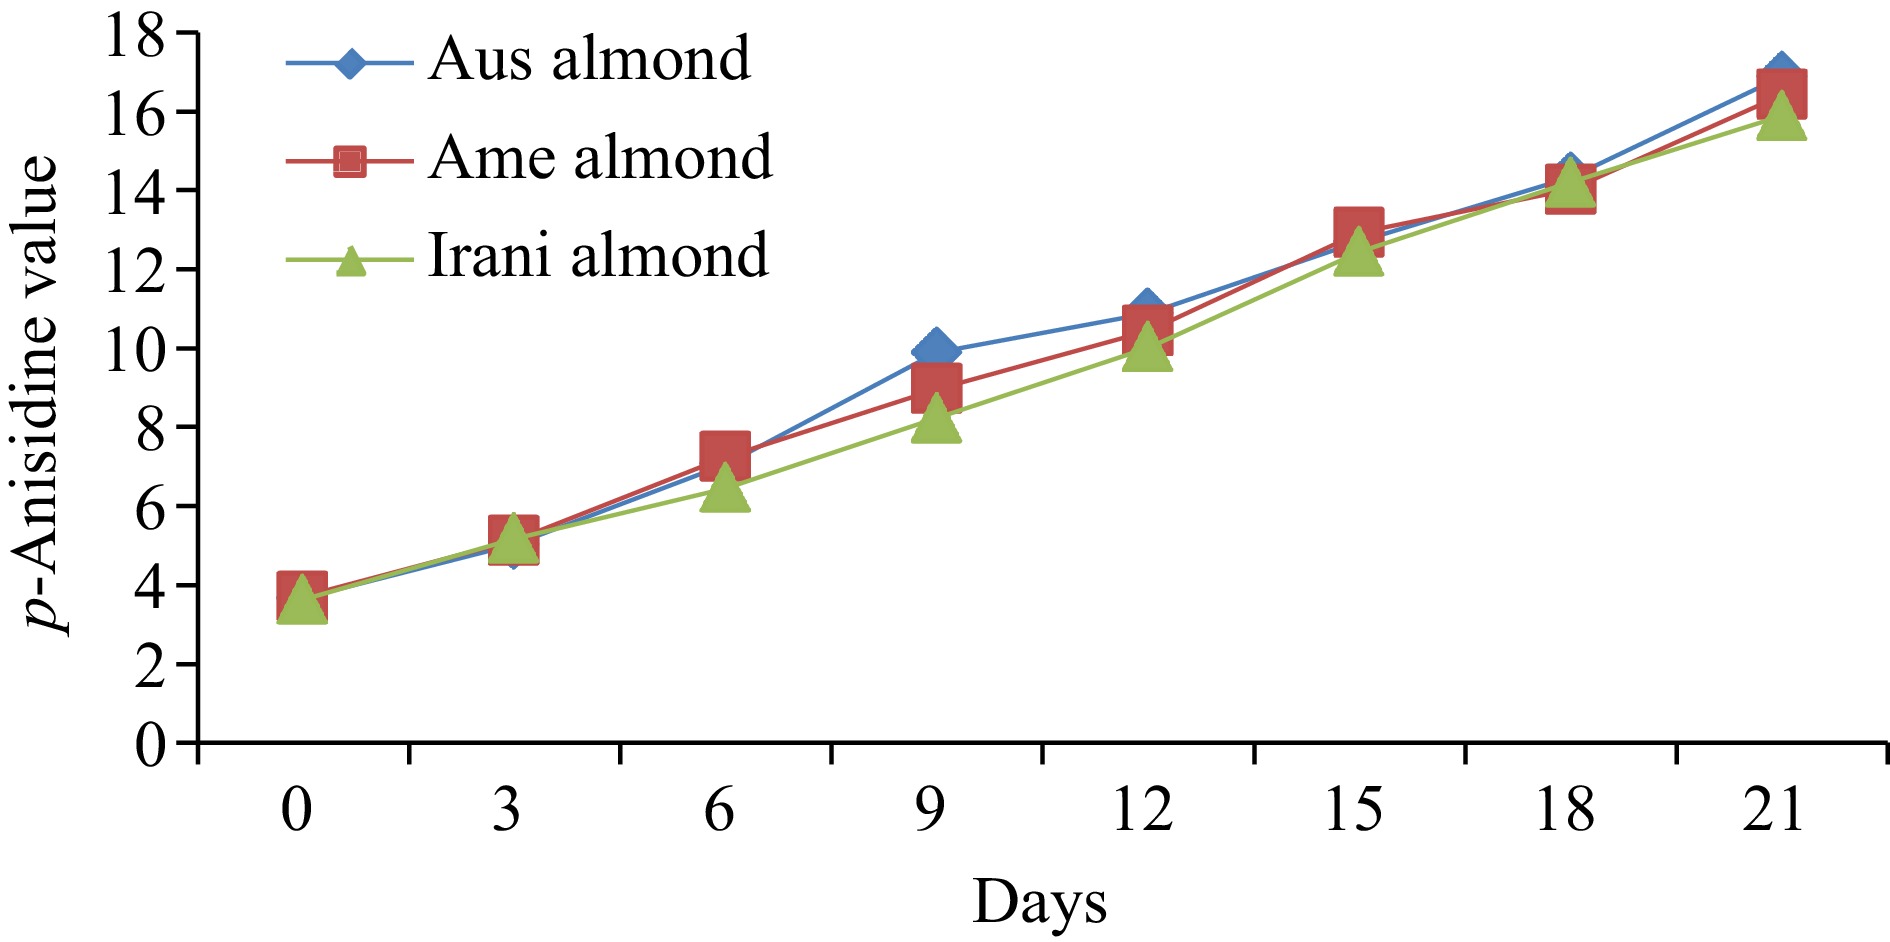
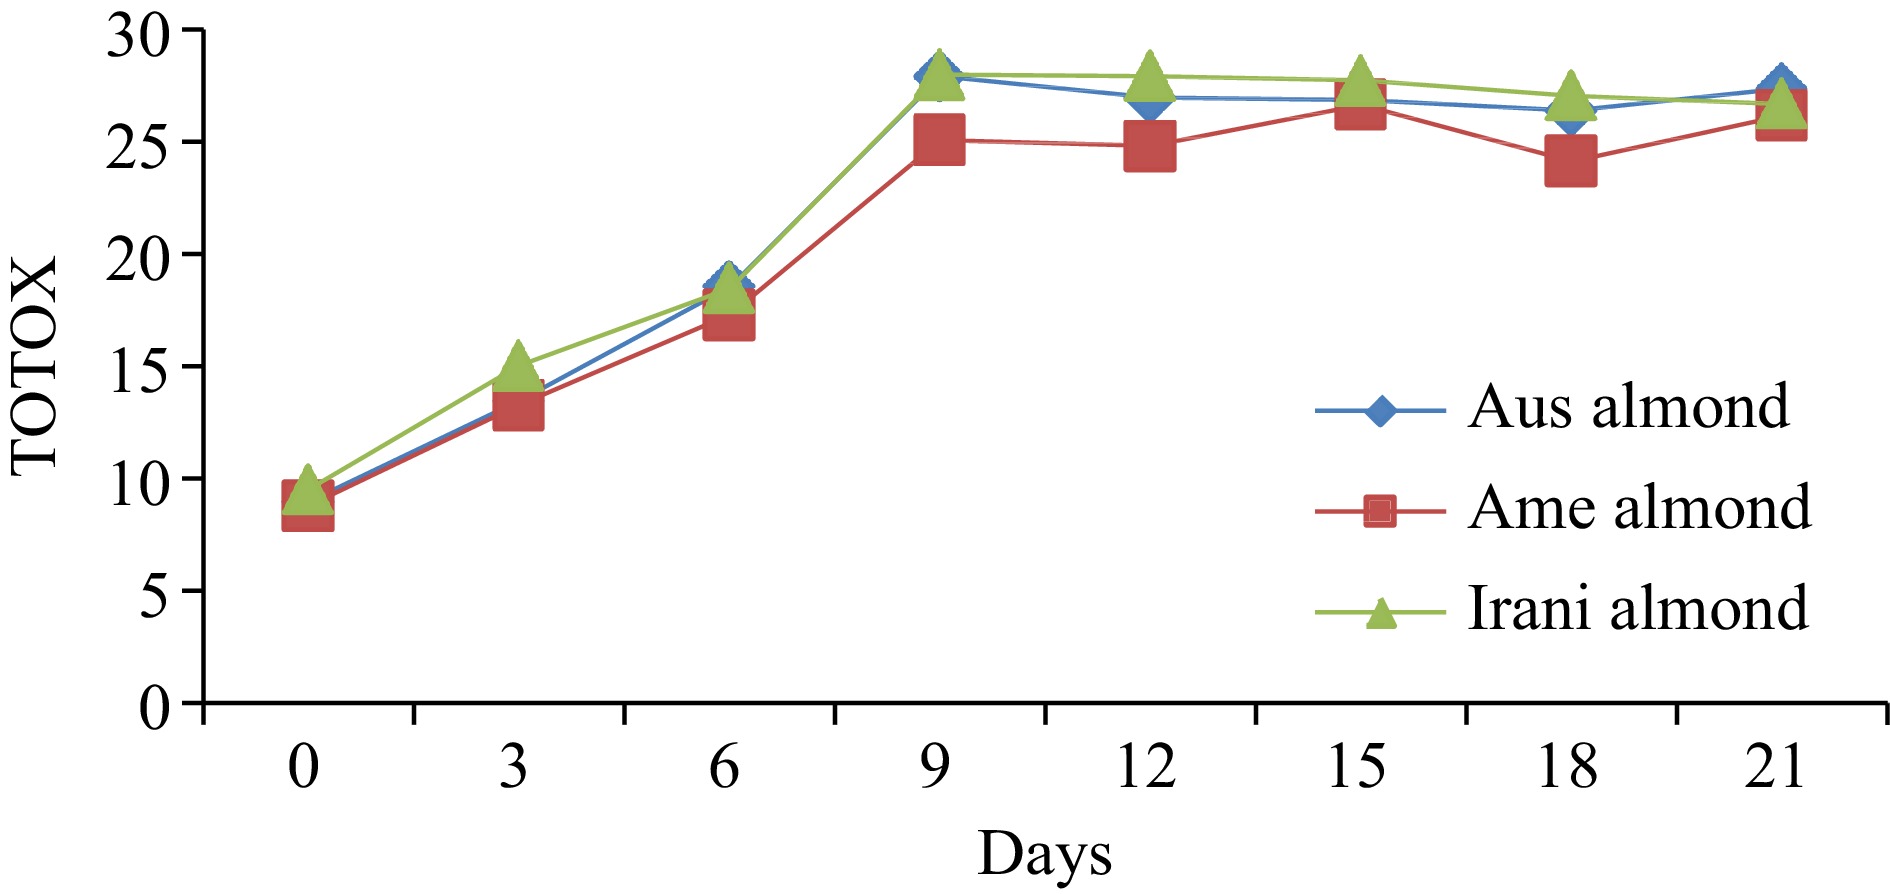
Almond oilDays of oxidation (60 °C) 0 3 6 9 12 15 18 21 FFA (%) Australian 0.55 ± 0.02h 0.65 ± 0.03g 0.95 ± 0.04f 1.07 ± 0.04e 1.21 ± 0.05d 1.93 ± 0.08c 2.42 ± 0.09b 2.76 ± 0.11a American 0.48 ± 0.02h 0.61 ± 0.03g 0.89 ± 0.04f 0.98 ± 0.05e 1.08 ± 0.04d 1.88 ± 0.05c 2.32 ± 0.07b 2.66 ± 0.08a Iranian 0.44 ± 0.02h 0.56 ± 0.03g 0.67 ± 0.03f 0.88 ± 0.04e 1.02 ± 0.05d 1.77 ± 0.08c 2.28 ± 0.09b 2.58 ± 0.10a PV (meq·kg−1) Australian 2.66 ± 0.12h 4.22 ± 0.16g 5.75 ± 0.24e 9.02 ± 0.37a 8.05 ± 0.36b 7.09 ± 0.25c 6.03 ± 0.21d 5.25 ± 0.17f American 2.55 ± 0.11h 4.08 ± 0.17g 5.03 ± 0.21e 8.06 ± 0.31a 7.19 ± 0.29b 6.87 ± 0.21c 5.06 ± 0.23d 4.88 ± 0.15f Iranian 2.95 ± 0.13h 4.93 ± 0.19g 6.02 ± 0.26e 9.88 ± 0.36a 8.87 ± 0.35b 7.65 ± 0.27c 6.43 ± 0.28d 5.41 ± 0.17f p-anisidine (p-AV) Australian 3.67 ± 0.13h 5.03 ± 0.19g 7.06 ± 0.31f 9.89 ± 0.34e 10.88 ± 0.39d 12.71 ± 0.42c 14.33 ± 0.61b 16.88 ± 0.71a American 3.71 ± 0.14h 5.13 ± 0.21g 7.24 ± 0.31f 8.97 ± 0.32e 10.44 ± 0.28d 12.93 ± 0.31c 14.02 ± 0.59b 16.43 ± 0.66a Iranian 3.63 ± 0.12h 5.18 ± 0.22g 6.45 ± 0.27f 8.23 ± 0.31e 10.02 ± 0.42d 12.44 ± 0.47c 14.21 ± 0.35b 15.89 ± 0.44a TOTOX Australian 8.99 ± 0.27h 13.47 ± 0.51g 18.56 ± 0.76f 27.93 ± 0.91a 26.98 ± 1.28c 26.89 ± 1.03d 26.39 ± 1.06e 27.38 ± 1.14b American 8.81 ± 0.31h 13.29 ± 0.44g 17.30 ± 0.62f 25.09 ± 0.89c 24.82 ± 0.95d 26.67 ± 1.31a 24.14 ± 1.02e 26.19 ± 1.07b Iranian 9.53 ± 0.25h 15.04 ± 0.54g 18.49 ± 0.72f 27.99 ± 0.94a 27.94 ± 1.02b 27.74 ± 1.16c 27.07 ± 1.04d 26.71 ± 0.98e The values provided in the table are the mean values of triplicate analysis with standard deviation. Means followed by different superscripts in the same column differ significantly (Tukey's test at 0.05 p-level the population are significantly different). Peroxide value (PV)
-
The effect of oxidative conditions on PV changes for three different varieties of almonds during oxidation at 60 °C is shown in Fig. 2. The initial PV (day 0) was observed at 2.66, 2.55, 2.95 meq·kg−1 for Australian, American and Iranian almonds, respectively. The PV constantly increased during the first 9 d of oxidation and then continued to increase at a lower rate until the end of the oxidation assay. After 21 d of storage, the PV ranged between 4.88−9.88 meq·kg−1 oil, and the maximum PV observed were 9.02, 8.06, and 9.88 meq·kg−1 for Australian American, and Iranian almond oil (Table 1). It has been observed that an increase in temperature can cause a reduction in PV due to the decomposition of hydroperoxides. The formation and accumulation of hydroperoxides in oil are dependent on factors such as temperature, time, and the structure of the unsaturated fatty acid. As PV is influenced by the volatility of hydroperoxides, it cannot be used solely as a reliable indicator of the extent of oxidation of oils and fats[20]. Fresh oils typically have a PV of less than 10 meq·kg−1, low PV indicates low levels of oxidative rancidity and suggests the presence of strong or high levels of antioxidants[21]. Therefore, various regulatory bodies have established industry limits for PV, which vary, depending on the oil type and formulation. For example, several regulatory bodies set a PV limit of 10 meq·kg−1. The Agriculture and Consumer Protection Department (CODEX) and FAOSTAT have set limits of 10 meq·kg−1 oil for refined vegetable oils, 15 meq·kg−1 oil for virgin and cold-pressed vegetable oils, and 20 meq·kg−1 oil for extra-virgin olive oils[22, 23].
p-Anisidine value (p-AV)
-
To determine the amount of secondary oxidation products in oil samples, p-AV was measured for fresh Australian, American, and Iranian almond oil and the results were found at 3.67, 3.71, and 3.63, respectively. After storing the samples at 60 °C for up to 21 d, it was observed that a linear increase in the p-AV was noted as presented in Fig. 3. However, the p-AV in Australian, American, and Iranian almond oils ranged from 3.67−16.88, 3.71−16.43, and 3.63−15.89, correspondingly, as listed in Table 1. Ideally, the p-AV should be less than 10 for good-quality oil. However, in our study, all samples showed a significant increase in the p-AV due to exposure to oxygen.
Total oxidation value (TOTOX)
-
The amount of primary and secondary oxidized constituents in fats and oils can be determined by the TOTOX value. The TOTOX value of fresh Australian almond oil was noted at 8.99; American almond oil at 8.81, and Iranian almond oil at 9.53. However, under oxidation at 60 °C treatment of the samples, a trend of oxidation was observed. As shown in Fig. 4, the TOTOX value increased from day 0 to the 9th day, while a slightly decreasing trend was seen after the 12th day of storage up to the 21st day. The maximum TOTOX value of 27.93, 26.67, and 27.99 was observed in Australian, American and Iranian almond oil, respectively. The comparative results of different varieties of almond oil are presented in Table 1, which is relatively similar to those reported in the literature. Cao et al.,[24] studied the four vegetable oils to determine their indicators of lipid oxidation under the conditions of accelerated oxidation for 35 d at 62 °C and observed TOTOX values in the range of 8.12 to 27.80.
FT-IR characterization
-
A study of oxidized almond kernel oil (Australian, American and Iranian) was carried out on different days of forced oxidation at 60 °C by FT-IR. A great deal of information about the oxidative status of oils can be obtained by studying the frequency and absorbance values of several bands of their infrared spectra[25]. Figure 5 shows the FT-IR spectra of Australian, American, and Iranian almond kernel oil obtained at 0, 3, 6, 9, 12, 15, 18, and 21 d under oxidative conditions. Visual examination of spectra revealed that there are slight appreciable differences between their spectral features apart from slight changes in the absorbance of some bands as well as some shifts in the exact position of the bands. This finding suggests that the oil composition affects the exact position of the bands and also affects the shifts in the infrared spectra when the proportion of fatty acids is modified.
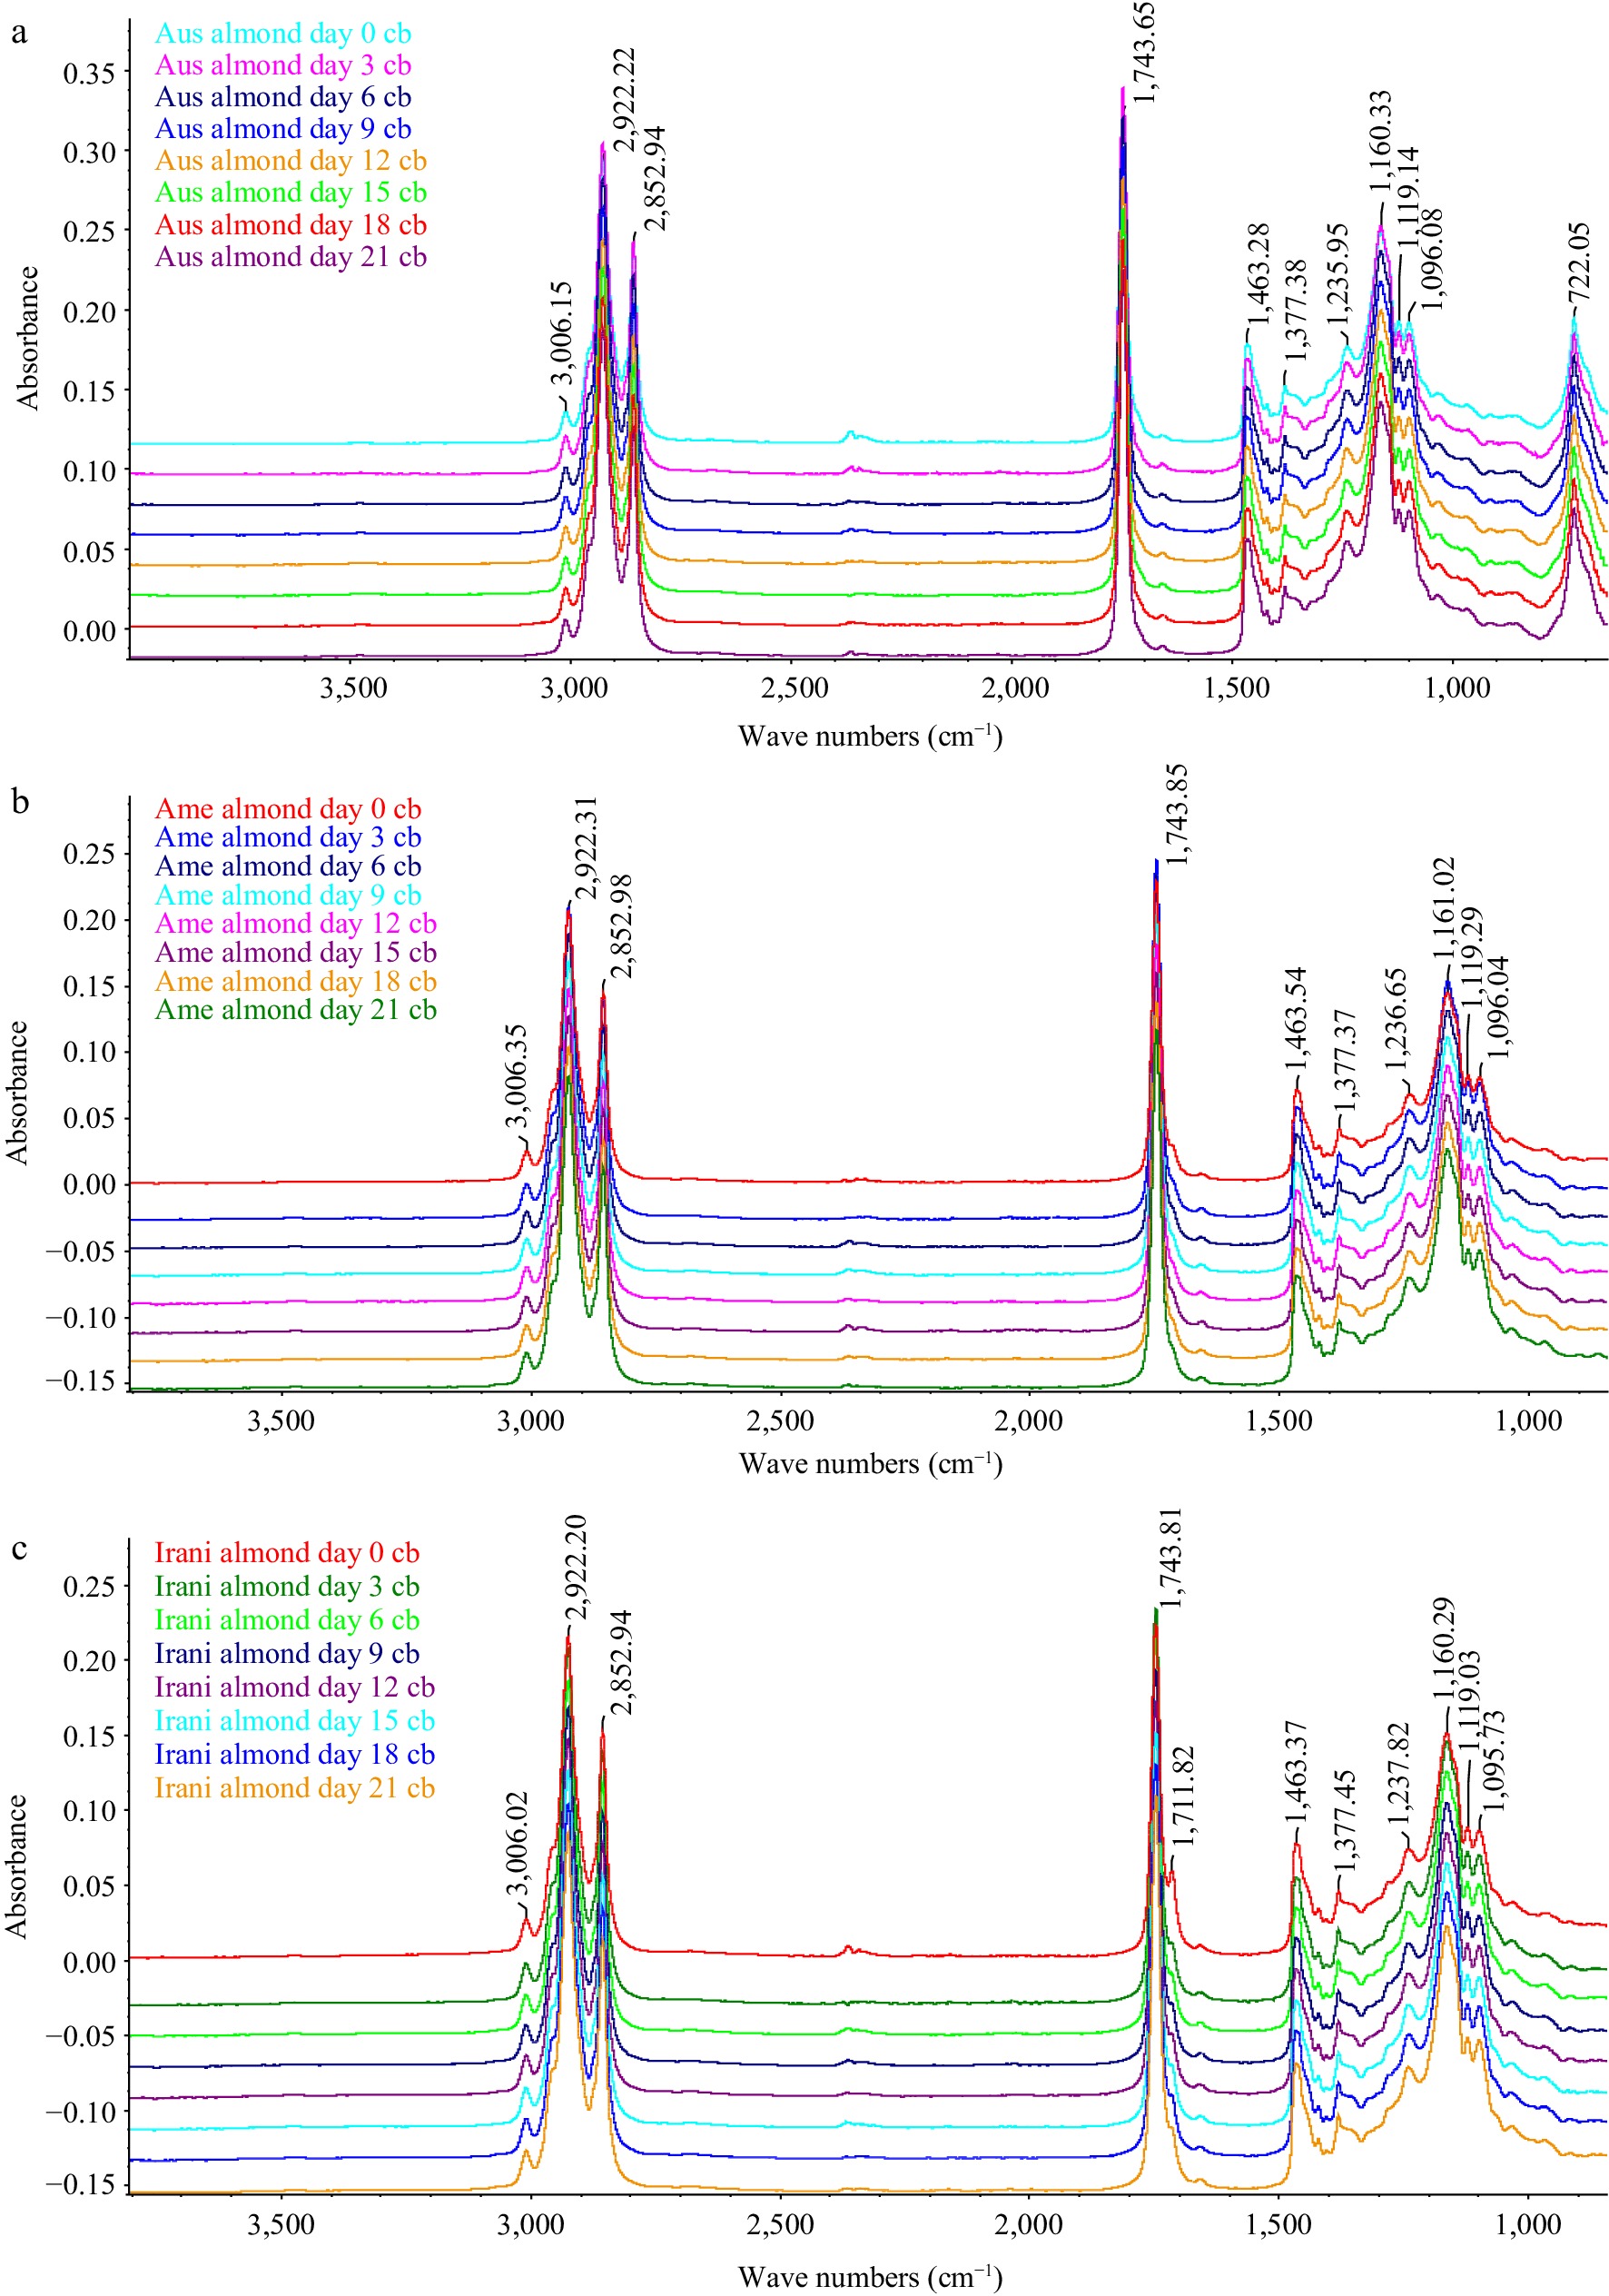
Figure 5.
FT-IR group spectra (a) Australian, (b) American and (c) Iranian almond kernel oil samples at different days.
(1) 3,700–3,150 cm−1: This area stayed unaltered for the initial 9 d that the sample was under degradation conditions. After this time, the profile of this region started to change. Besides, the frequency of this absorption band decreased gradually as the procedure progressed from (3,474 to 3,283 cm−1). This decrease in frequency value was due to the cover with the first band (3,474 cm−1) because of the suggestion of the glyceride ester carbonyl assimilation and new retentions brought about by hydroperoxides or primary oxidation items produced in the oxidation procedure[26].
(2) 3,010–2,999 cm−1: The absorbance of the band at around 3,090 cm−1 because of the stretching vibration of CH groups cis-olefinic stayed unaltered for around 9 d while the sample was under oxidative conditions. Oils with absorbance values lower than the first ones for this band were in progressive phases of oxidation. Although the oxidative treatment was occurring, a double bond of unsaturated fatty acids undergoes isomerization from cis to trans[27, 28].
(3) 1,800–1,600 cm−1: The band which showed up at around 1,743 cm−1 was (because of the ester carbonyl functional group of the triacylglycerides)[29]. This band undergoes an asymmetric change all through the oxidative treatment. Having remained essentially unaltered for the initial 9 d of the oxidative treatment, its frequency value started to decrease from around (1,743 to 1,682 cm−1) at various rates relying upon the oil. This change could be related to the presence of saturated aldehydes functional groups or of secondary oxidation items causing a retention band at 1,655 cm−1 which covers the band for the ester functional group. Because of this cover, the width of this band expanded while the oxidative treatment is sophisticated.
(4) 1,200–900 cm−1: The absorbance of the band initially at 966 cm−1, associated with (bending vibrations of CH functional groups of isolated trans-olefins), increased at different rates depending on the oil. This band provided us with information about the gradual cis to trans isomerization throughout the oxidative treatment[29]. It can be concluded from the FTIR analysis that the specific alterations in the chemical composition of the almond oils occurred due to temperature-induced stress.
Fatty acid composition
-
The study of the fatty acid composition of Australian, American and Iranian almond kernels oil showed a varying concentration of the ensemble of saturated fatty acids (SFA) (palmitic and stearic), intermediate for the polyunsaturated fatty acids (PUFA) (linoleic), and high for MUFAs, especially oleic acid (Table 2 & Fig. 6). The most abundant fatty acid in the almond oil range was observed as oleic acid (72.76%–78.08%) followed by linoleic acid (14.40%–19.05%). There were also smaller amounts of palmitic (4.86%–5.56%), stearic (1.40%–2.10%), and palmitoleic (0.20%–0.29%) acids in all three samples during the oxidation period. The highest concentration of palmitic acid was found in Iranian almond oil and the lowest was found in Australian almond oil. However, palmitoleic acid was found higher in Iranian almond oil and lower in Australian almond oil. The concentration of stearic acid was observed higher in Australian almond oil and lower in American almond oil. Oleic acid was the major unsaturated fatty acid in almond oil. Figure 7 represents the variation in fatty acid during the oxidation period. The highest concentration of oleic acid was found in Iranian almond oil and the lowest was found in Australian almond oil. Among PUFA, linoleic acid was dominant in all three varieties. Linoleic acid was found higher in Australian almond oil and lower in Iranian almond oil.
Table 2. Fatty acid composition of (Australian, American and Iranian) almond kernel oil during forced oxidation of 21 d.
Samples Fatty
acidsDays of oxidation (60 °C) 0 3 6 9 12 15 18 21 Australian almond oil C16:0 5.306 ± 0.21b 5.000 ± 0.19h 5.160 ± 0.21f 4.860 ± 0.19a 5.277 ± 0.23c 5.161 ± 0.18e 5.140 ± 0.22g 5.220 ± 0.23d C16:1 0.269 ± 0.01b 0.210 ± 0.01g 0.290 ± 0.02a 0.200 ± 0.01h 0.212 ± 0.02f 0.240 ± 0.02d 0.230 ± 0.02e 0.241 ± 0.02c C18:0 2.152 ± 0.09a 2.010 ± 0.08g 2.100 ± 0.06b 2.080 ± 0.06d 2.099 ± 0.05c 2.070 ± 0.06e 2.050 ± 0.05f 2.000 ± 0.05h C18:1 72.765 ± 2.76h 74.020 ± 3.23f 73.940 ± 2.84g 74.473 ± 3.03e 74.985 ± 3.14a 74.750 ± 3.19b 74.690 ± 2.96c 74.620 ± 3.02d C18:2 19.508 ± 0.68a 18.760 ± 0.67b 18.510 ± 0.56c 18.388 ± 0.61d 17.426 ± 0.56h 17.780 ± 0.55g 17.890 ± 0.51g 17.920 ± 0.54e American almond oil C16:0 5.223 ± 0.21g 5.480 ± 0.23e 5.501 ± 0.24c 5.419 ± 0.20d 5.569 ± 0.21a 5.509 ± 0.20b 5.080 ± 0.18h 5.320 ± 0.19f C16:1 0.256 ± 0.01d 0.251 ± 0.02e 0.260 ± 0.02c 0.210 ± 0.01h 0.230 ± 0.02g 0.280 ± 0.02a 0.270 ± 0.02b 0.250 ± 0.01f C18:0 1.894 ± 0.05a 1.490 ± 0.05f 1.480 ± 0.05g 1.640 ± 0.07c 1.530 ± 0.07d 1.400 ± 0.06h 1.710 ± 0.08b 1.520 ± 0.07e C18:1 74.775 ± 2.62g 74.690 ± 2.83h 75.138 ± 3.12f 75.142 ± 3.05e 75.532 ± 2.91b 75.312 ± 3.23d 75.480 ± 3.04c 75.730 ± 3.12a C18:2 17.852 ± 0.69b 18.090 ± 0.71a 17.622 ± 0.68c 17.588 ± 0.59d 17.138 ± 0.57h 17.498 ± 0.48e 17.460 ± 0.60f 17.180 ± 0.59g Iranian almond oil C16:0 5.181 ± 0.19g 5.130 ± 0.23h 5.510 ± 0.23b 5.331 ± 0.21e 5.309 ± 0.20f 5.470 ± 0.24c 5.531 ± 0.25a 5.349 ± 0.22d C16:1 0.240 ± 0.01f 0.280 ± 0.02c 0.290 ± 0.02b 0.260 ± 0.01e 0.261 ± 0.01d 0.220 ± 0.01g 0.291 ± 0.02a 0.210 ± 0.02h C18:0 2.074 ± 0.08a 1.860 ± 0.12d 1.710 ± 0.11g 1.880 ± 0.09c 1.760 ± 0.09f 1.820 ± 0.08e 1.660 ± 0.07h 1.950 ± 0.11b C18:1 74.891 ± 3.01h 76.670 ± 3.42g 77.050 ± 3.55f 77.218 ± 3.61e 77.322 ± 3.53c 77.410 ± 3.46b 77.248 ± 3.08d 78.082 ± 3.14a C18:2 17.614 ± 0.59a 16.060 ± 0.48b 15.440 ± 0.46c 15.312 ± 0.47e 15.348 ± 0.39d 15.080 ± 0.41f 15.272 ± 0.51g 14.409 ± 0.38h The values provided in the table are the mean values of triplicate analysis with standard deviation. Means followed by different superscripts in the same column differ significantly (Tukey’s test at 0.05 p-Level the population are significantly different). 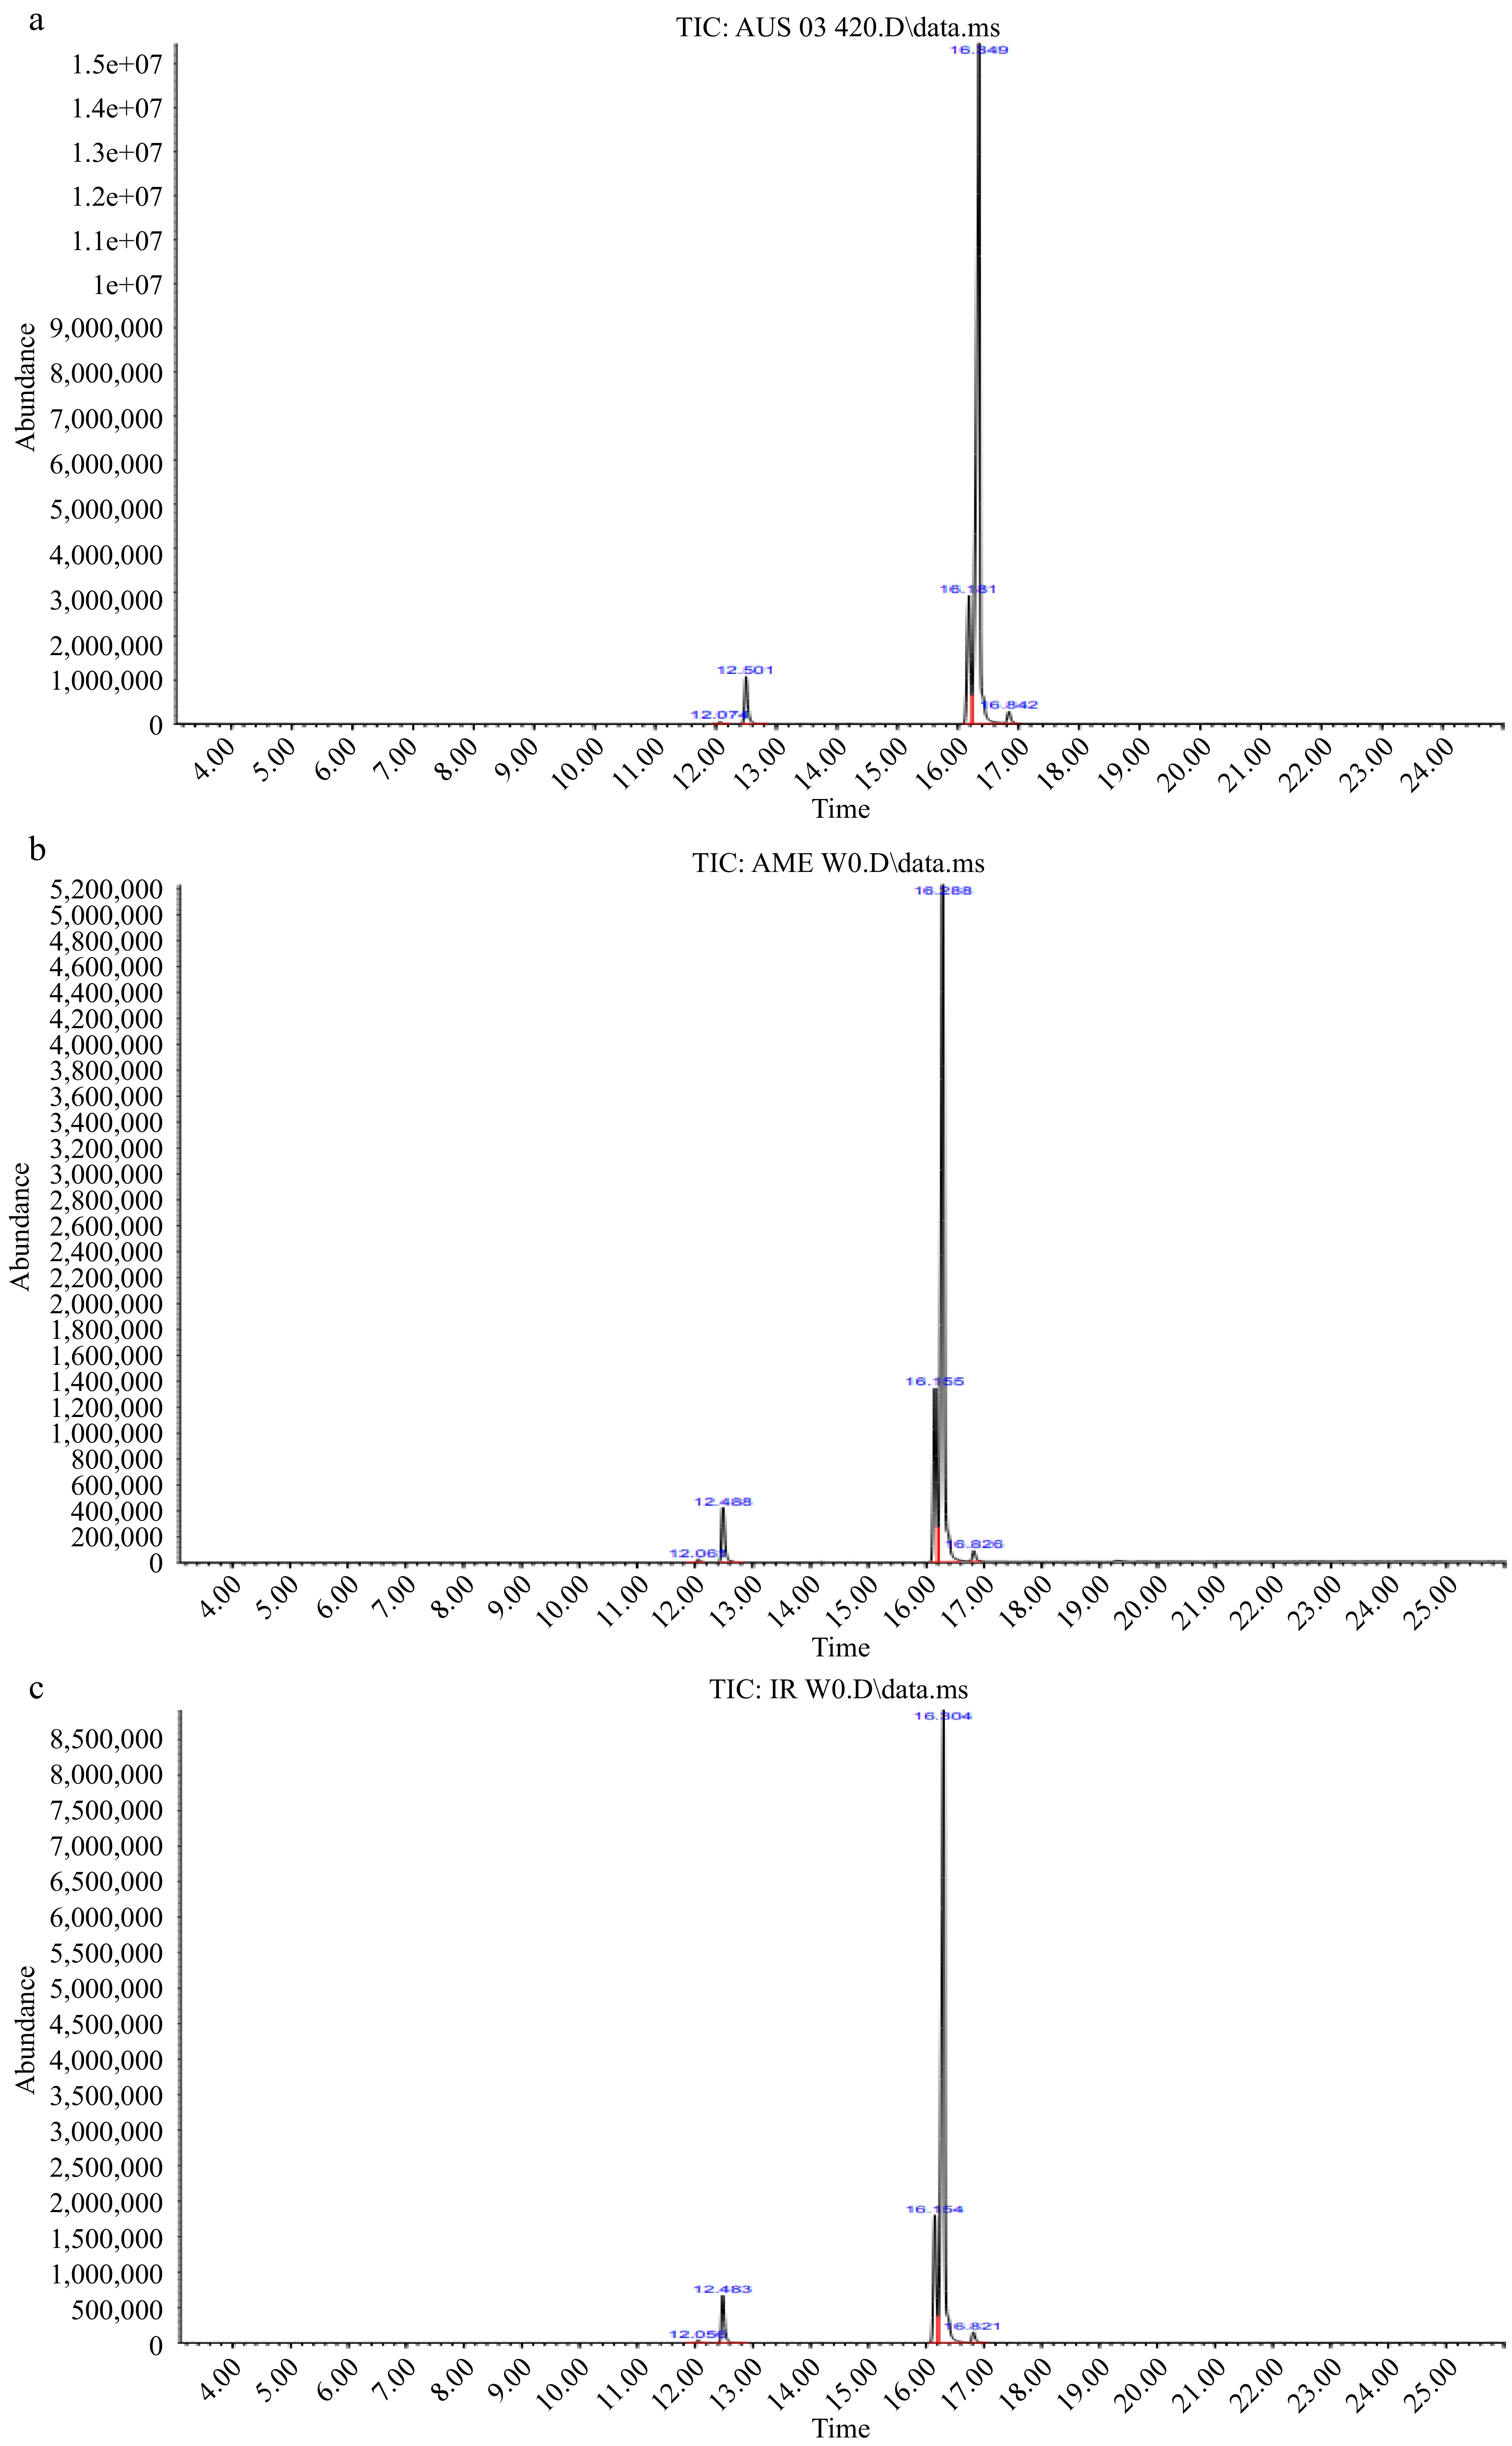
Figure 6.
Representative GC-MS chromatograms of fresh almond kernel oils (a) Australian, (b) American and (c) Iranian.
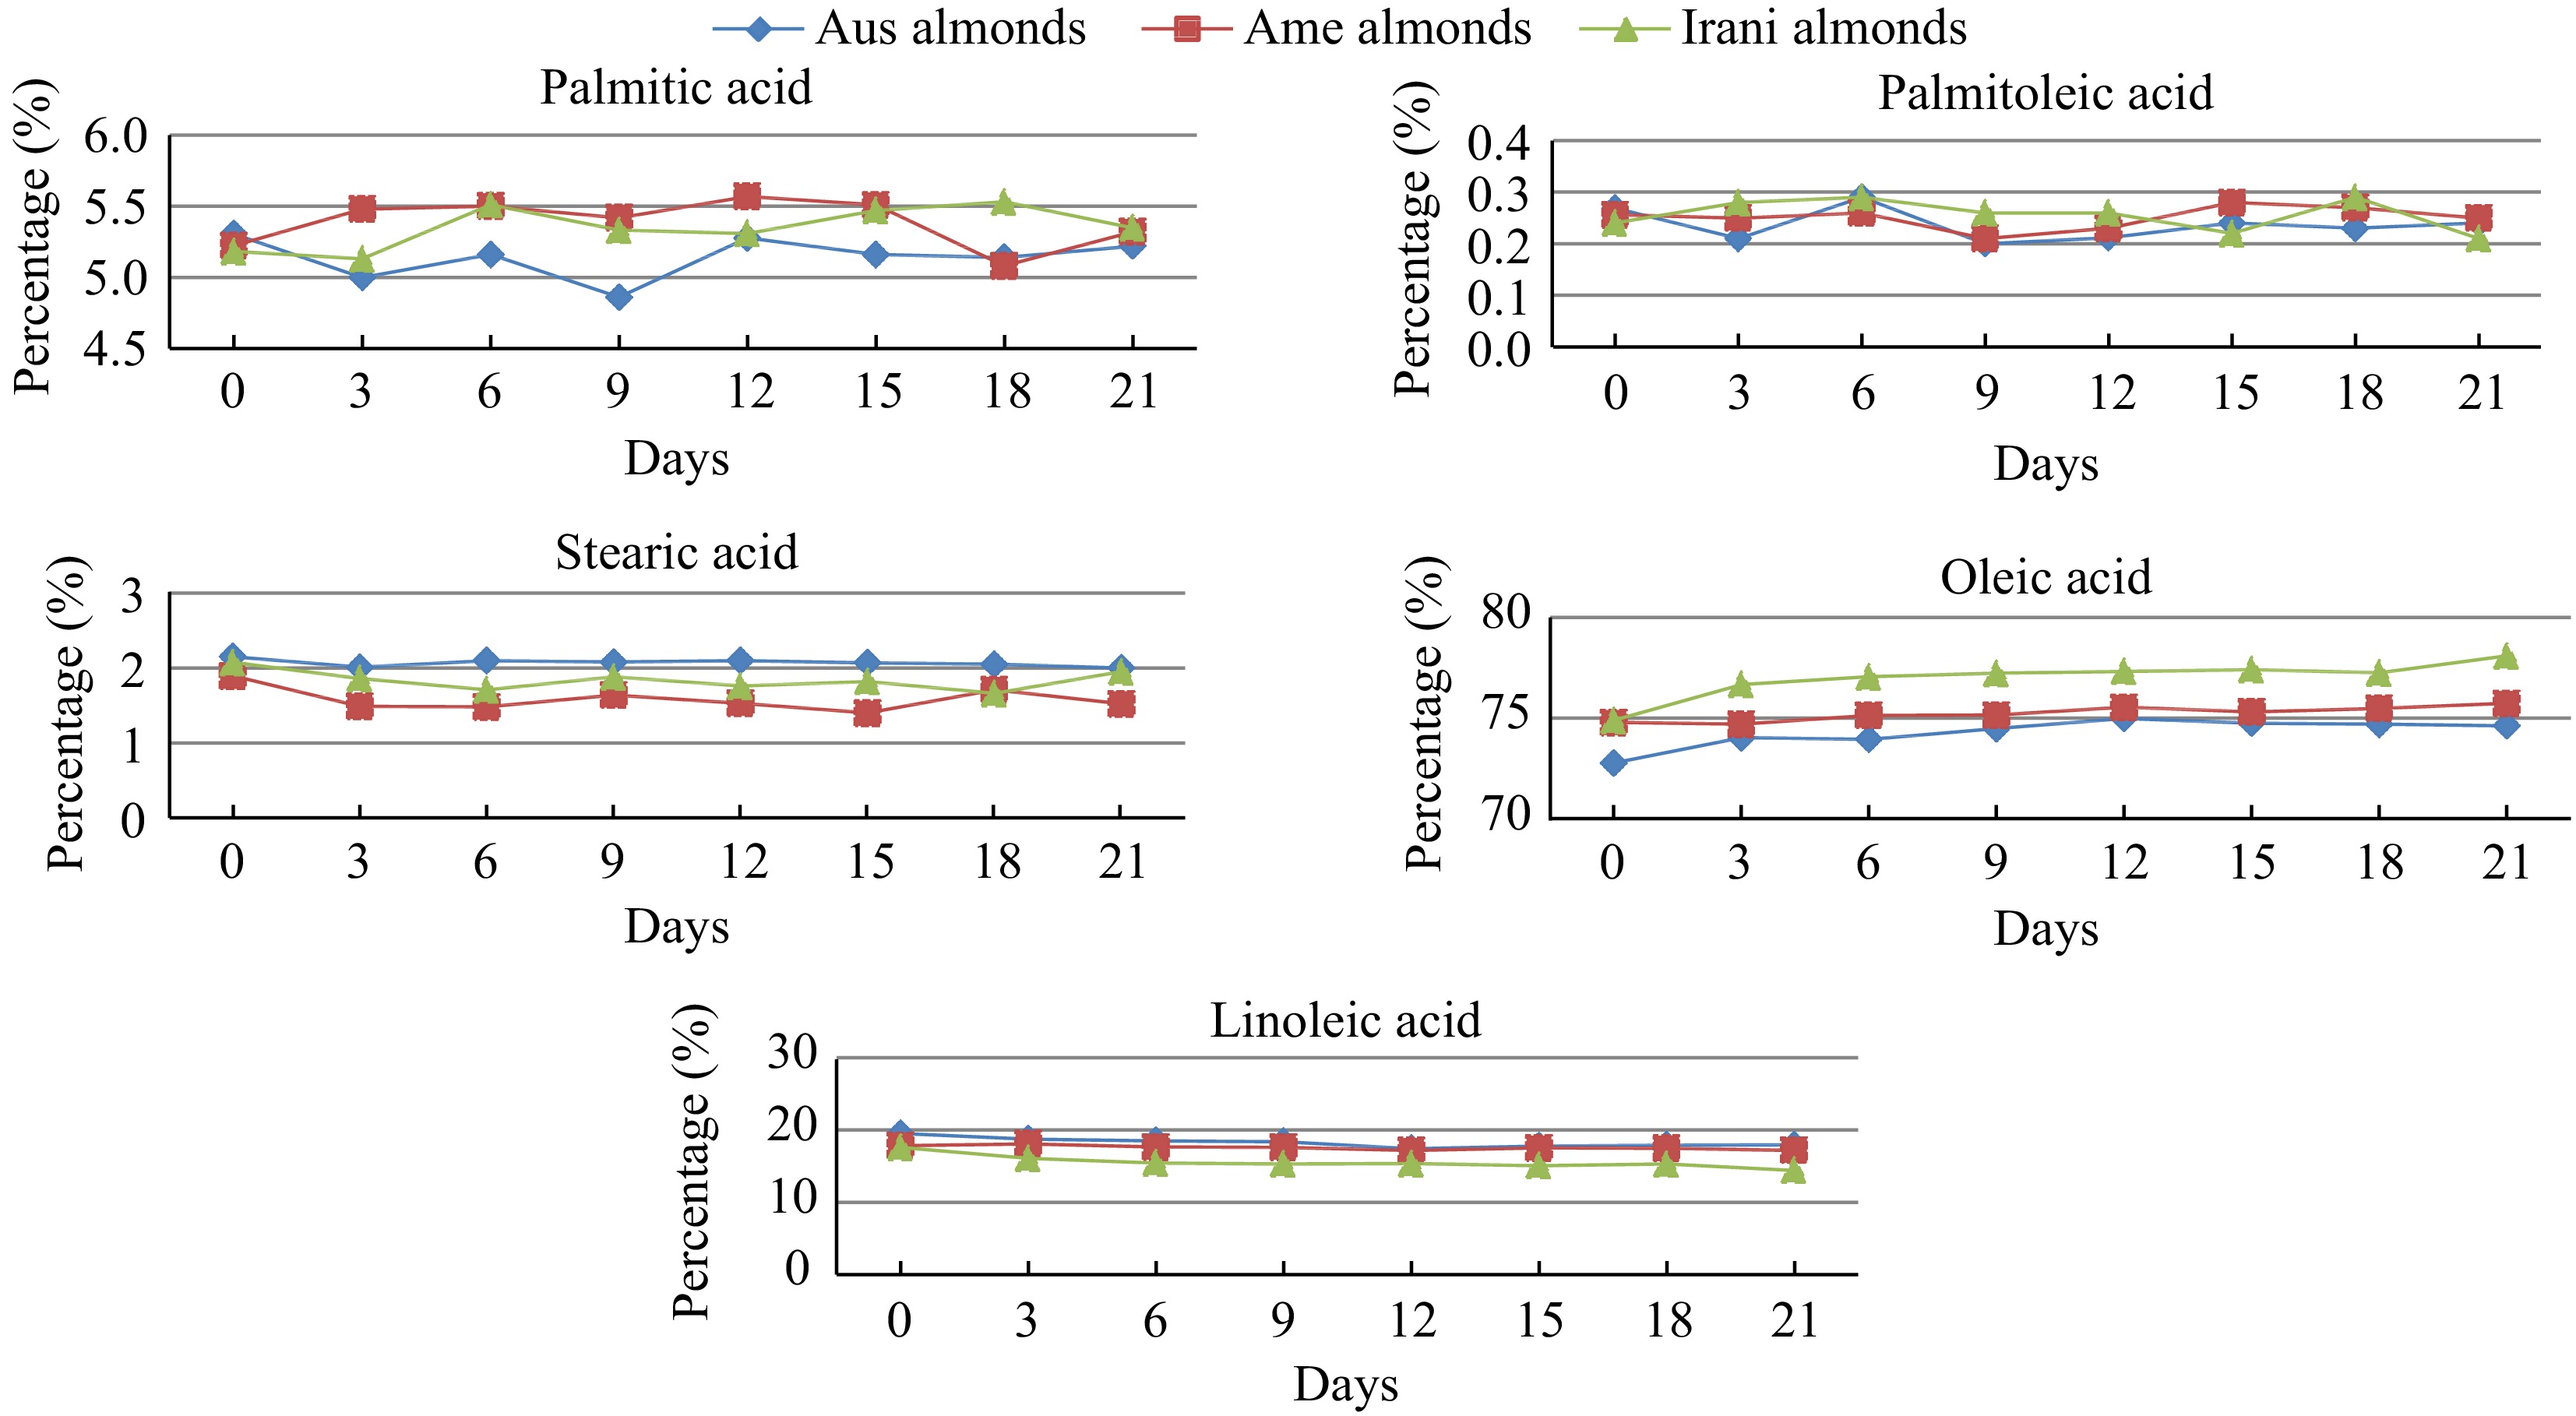
Figure 7.
Changes in the fatty acid profile (palmitic, palmitoleic, stearic, oleic, and linoleic acid) of Australian, American, and Iranian almonds during forced oxidation at 60 °C.
However, according to Kodad et al.[30], the five major fatty acids in almonds oil were observed 5.2%−7.1% palmitic acid, 0.3%−0.8% palmitoleic acid, 1.1%−2.8% stearic acid, 63.2%−78.6% oleic acid and 12.1%−27.1% linoleic acid. Similarly, Askin et al.[31] described only five saturated/unsaturated fatty acids such as C16:0, C16:1, C18:0, C18:1, and C18:2 in almond oil. The most abundant fatty acid in the almond oil range was observed as oleic acid (50.41%–81.20%) followed by linoleic acid (6.21%–37.13%). There were also smaller amounts of palmitic (5.46%–15.78%), stearic (0.80%–3.83%), and palmitoleic (0.36%–2.52%) acids observed, respectively. Results of this study on the oleic acid levels in Australian, American, and Iranian almond oil are in good agreement with those reported by Maguire et al.[32] (72.2%) for commercial almonds. Zhang et al.[33] and Venkathacalam & Sathe[34] reported oleic acid levels of 68.9−71.9, and 76.0%, respectively. Nanos et al.[35] reported oleic acid levels in the range of 72%–82%, and Zacheo et al.[36] reported oleic acid levels of up to 77.5% for some almond varieties.
-
The effect of storage at elevated temperatures on the quality and stability of different almond oils has been studied. The findings highlight the significant impact of temperature on the overall quality and shelf life of these oils. The results showed a significant increase in PV and FFA, p-AV, and TOTOX of the almond oil that occurred during storage. As the oxidation process progresses, several changes occur in almond oil's FT-IR spectrum. The primary changes to the spectra showed up in the following regions: 3,700−3,150, 3,010−2,999, 1,800−1,600, and 1,200−900 cm−1. This finding suggests that the oil composition affects the exact position of the bands and also affects the shifts in the infrared spectra when the proportion of fatty acids is modified. However, only the above regions were generated for certain oil oxidation products. The present study gives valuable data about the quality of Australian, American, and Iranian almonds oil as these oils contain a high measure of oleic acid which decreases the measure of bad cholesterol (LDL) and builds the measure of good cholesterol (HDL). Moreover, the results of this study have important implications for the food, cosmetics, and pharmaceutical industries.
-
The author would like to express gratitude to Dr. M. A. Kazi Institute of Chemistry and National Centre of Excellence in Analytical Chemistry (NCEAC), University of Sindh, Jamshoro, for providing chemicals and intrumental facilities.
-
The authors confirm contribution to the paper as follows: study conception and design: Sidhu AR, Naz S, Mahesar SA; draft manuscript preparation: Sidhu AR, Naz S, Mahesar SA, Kandhro AA, Khaskheli AR, and Ali Z; analysis and interpretation of results: Memon HD and Shoaib H; data collection: Mahesar HR. All authors reviewed the results and approved the final version of the manuscript.
-
All data generated or analyzed during this study are included in this published article and its supplementary information files.
-
The authors declare that they have no conflict of interest.
- Copyright: © 2023 by the author(s). Published by Maximum Academic Press on behalf of Nanjing Agricultural University. This article is an open access article distributed under Creative Commons Attribution License (CC BY 4.0), visit https://creativecommons.org/licenses/by/4.0/.
-
About this article
Cite this article
Sidhu AR, Naz S, Mahesar SA, Kandhro AA, Khaskheli AR, et al. 2023. Effect of storage at elevated temperature on the quality and stability of different almond oils: a comprehensive study. Food Materials Research 3:30 doi: 10.48130/FMR-2023-0030
Effect of storage at elevated temperature on the quality and stability of different almond oils: a comprehensive study
- Received: 16 July 2023
- Accepted: 06 September 2023
- Published online: 06 November 2023
Abstract: This study aimed to investigate the chemical changes and oxidative stability of almond oil varieties (Australian, American, and Iranian) during storage at 60 °C for 21 d. The physicochemical properties of oil were analyzed at various time intervals to determine its stability. The peroxide value, free fatty acid, p-anisidine, TOTOX, fatty acid composition, and effect on functional groups were evaluated to assess the quality of the almond oil during storage. The results showed a significant increase in PV and FFA, p-AV, totox of the almond oil during storage, indicating that oxidative degradation had occurred. During the oxidation process, some changes were observed in the following spectral regions: 3,700–3,150, 3,010–2,999, 1,800–1,600, and 1,200–900 cm−1. Whereas, the fatty acid composition of the almond oil remained relatively stable during storage, except for a small variation in oleic acid. Comparatively, American and Iranian almond oils showed better stability than the Australian almond variety. The findings of this study provide important insights into the oxidative stability of different almond varieties during storage and can aid in the development of strategies to prevent or mitigate oxidation in almond oil. The findings of this study could have significant implications for the food, cosmetics, and pharmaceutical industry, particularly in the formulation and production of products that use almond oil as an ingredient.


