-

Figure 1.
Characteristics of GBTS array. (a) Distribution of cSNPs on each chromosome. Color indicates the number of cSNPs within 1 Mbp window size. (b) Coverage length of markers compared with reference genome (VCost. v3). (c) Annotation of the location of the cSNPs. (d) Number and proportion of MAF for all cSNPs.
-

Figure 2.
The characteristics of flower sex. (a) Flower types among the individuals in the mapping population. (b) Distributions of flower types among the F1 hybrids in 2015 and 2019.
-

Figure 3.
Genetic map of hybrid population crosses from Vitis vinifera 'Cabernet Sauvignon' × Vitis pseudoreticulata 'Huadong1058'. LG1 to LG19 represents 19 linkage groups respectively, and each bar represents a SNP marker. The ruler on the left is the genetic distance (cM).
-

Figure 4.
Mapping of sex determination locus. (a) Interval mapping of sex determination locus on chr2. (b) Multiple-QTL mapping of sex determination locus on chr2. (c) The overlap region of IM and MQM on chromosome 2, and the markers on the peak. The boundaries of locus were determined by the markers closest to the threshold (LOD = 30) on the flanks.
-

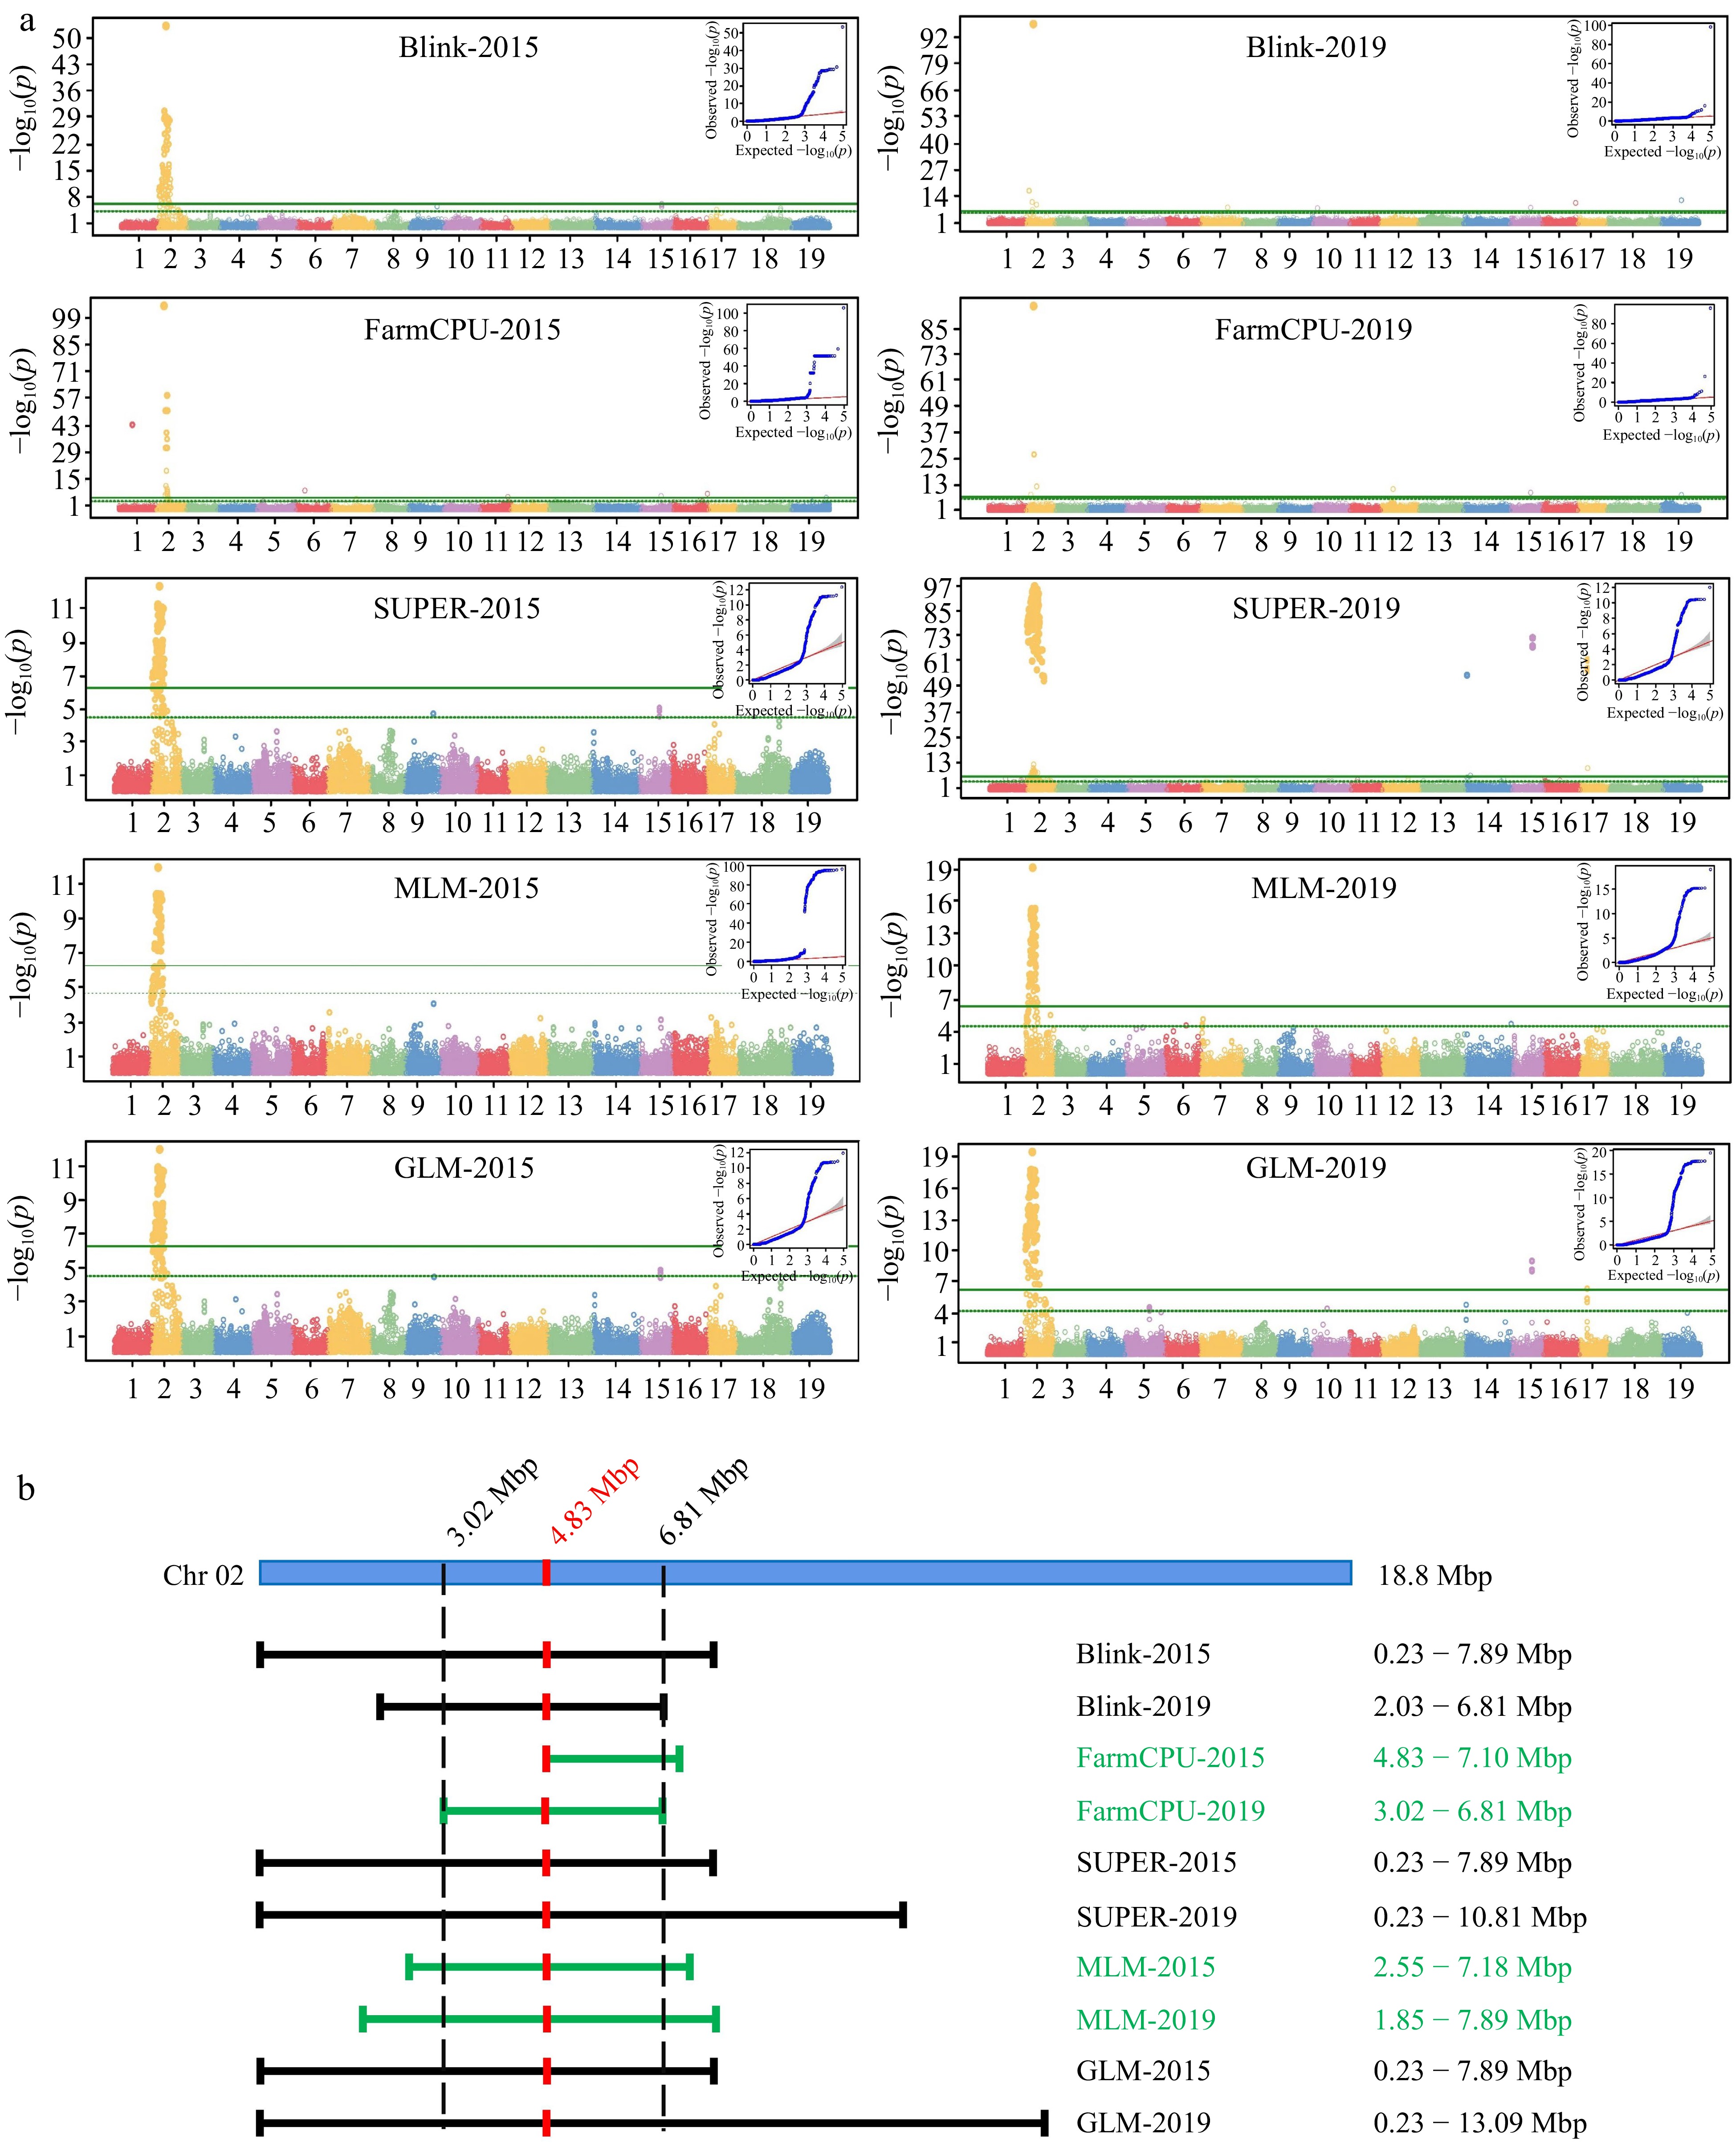
Figure 5.
GWAS Analysis of floral sex and linkage locus. (a) Manhattan plots and QQ plots of GWAS analysis based on five model (Blink, FarmCPU, SUPER, MLM and GLM). The vertical axis of the Manhattan map is the −log10(p) of each marker based on the analysis of different models. (b) Interval of sex determination locus on Chr2.
-

Figure 6.
Model of sex identification marker combination on chromosome 2. 'A', 'T', 'C' and 'G' represent four nucleotide type respectively, 'X' represents any nucleotide type. Two dashed lines of each sex type represent the two sister chromatids of chromosome 2.
-
Chr. SNP no. mSNP no. Distance
(bp)Average SNP
interval (bp)mSNP/
SNP1 1,198 5,357 24,200,107 20,200 4.47 2 1,015 4,619 18,860,487 18,582 4.55 3 944 4,408 20,668,111 21,894 4.67 4 1,175 5,347 24,682,346 21,006 4.55 5 1,134 5,229 25,554,074 22,534 4.61 6 1,038 4,838 22,638,265 21,810 4.66 7 1,328 5,447 27,330,303 20,580 4.10 8 754 3,067 22,542,685 29,897 4.07 9 735 3,464 22,840,396 31,075 4.71 10 1,230 5,487 23,441,644 19,058 4.46 11 958 4,390 20,025,463 20,903 4.58 12 1,156 6,032 24,240,562 20,969 5.22 13 1,313 6,880 29,056,180 22,130 5.24 14 1,262 6,200 30,244,820 23,966 4.91 15 878 4,276 20,254,536 23,069 4.87 16 1,048 5,447 23,491,226 22,415 5.20 17 1,013 4,808 18,650,226 18,411 4.75 18 1,408 6,587 34,516,940 24,515 4.68 19 1,010 5,570 24,686,874 24,442 5.51 Total 20,597 97,453 457,925,245 22,233 4.73 Table 1.
Characteristics of SNPs distributed on 19 grape chromosomes.
-
Marker types Cabernet Sauvignon Huadong
1058Marker number Percentage (%) aa × bb aa bb 10,022 36.25 ab × cc ab cc 84 0.30 cc × ab cc ab 65 0.24 ab × cd ab cd 0 0.00 ef × eg ef eg 86 0.31 hk × hk hk hk 883 3.19 lm × ll lm ll 12,225 44.22 nn × np nn np 4,282 15.49 Total − − 27,647 100.00 Table 2.
Marker types distribution.
Figures
(6)
Tables
(2)