-
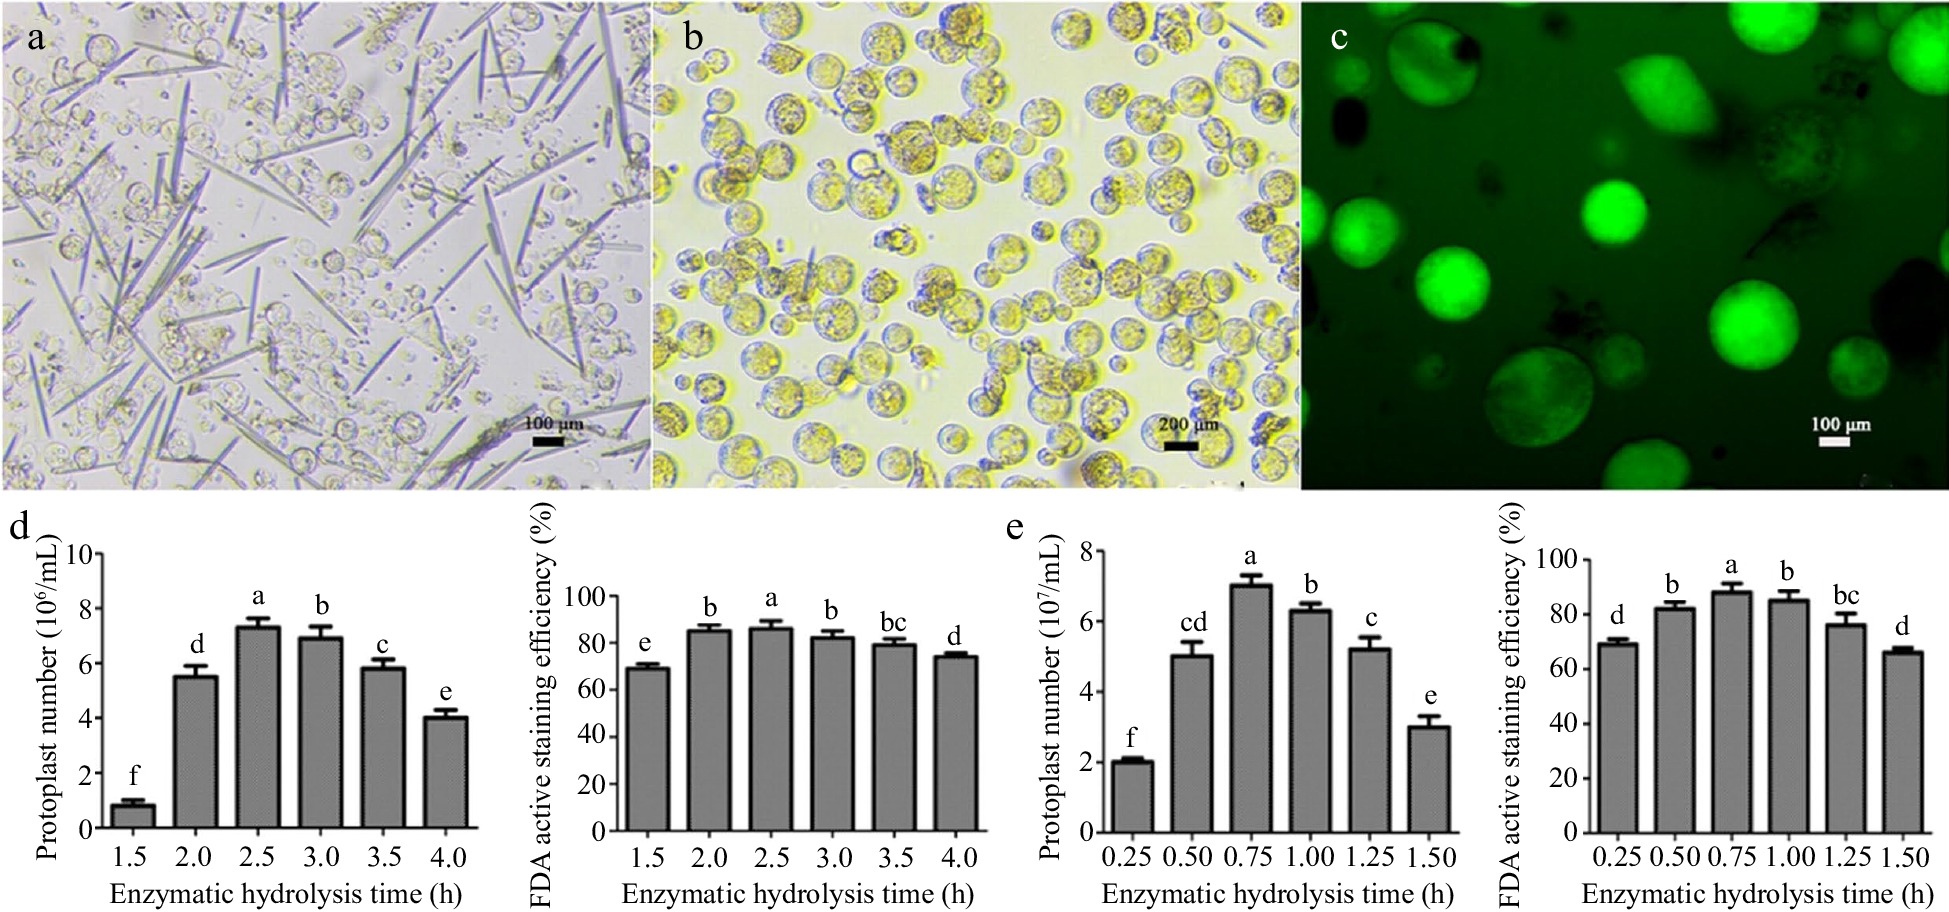
Figure 1.
Isolation of coconut protoplasts, determination of FDA activity, and effects of enzymatic hydrolysis time on the number and activity of protoplasts. (a) Young leaves of coconut, (b) coconut liquid endosperm, (c) FDA staining of protoplasts, (d) leaf enzymatic hydrolysis time, (e) enzymatic hydrolysis time of endosperm. Different lowercase letters indicate significant differences (p < 0.05).
-
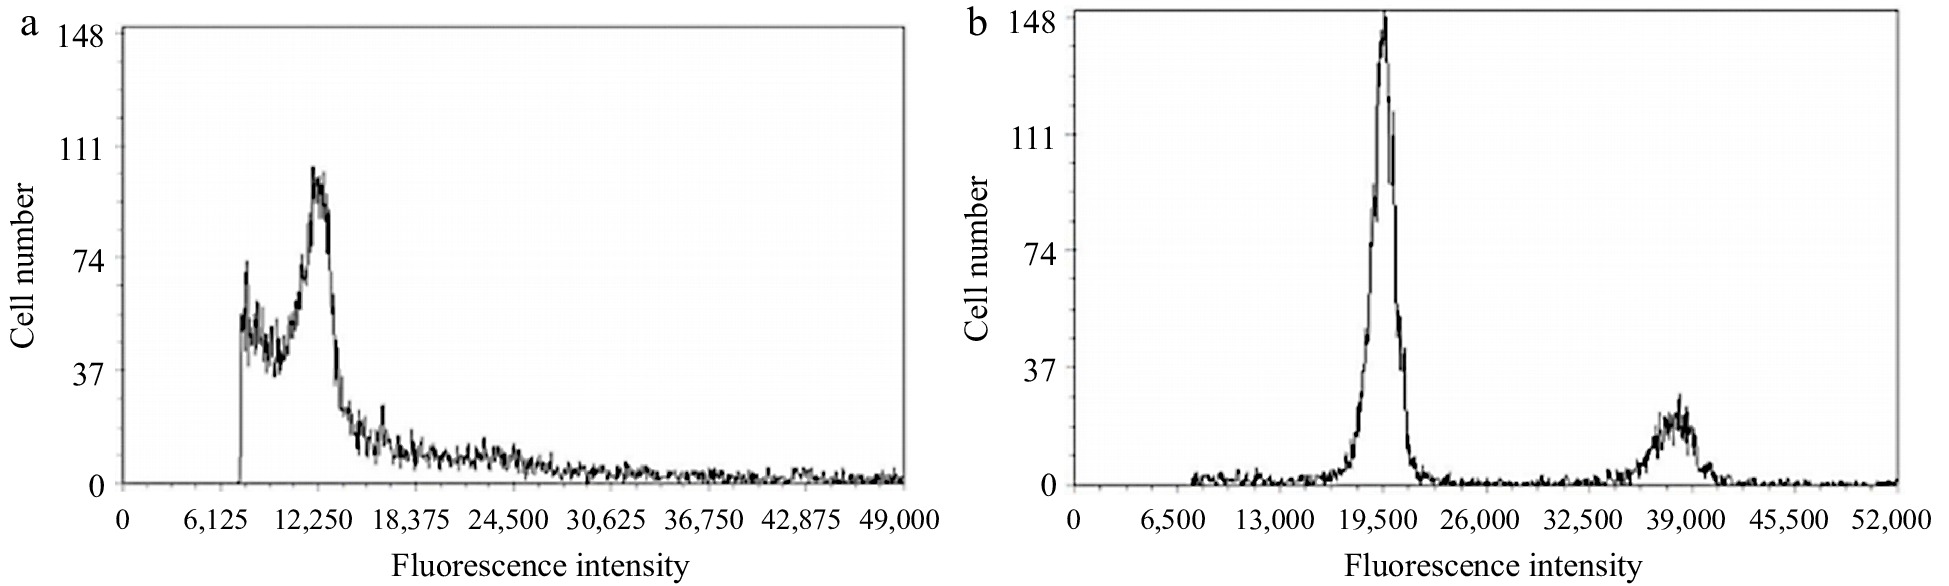
Figure 2.
Ploidy analysis of coconut leaf and liquid endosperm protoplast cells. (a) Leaf protoplasts, (b) endosperm protoplast.
-
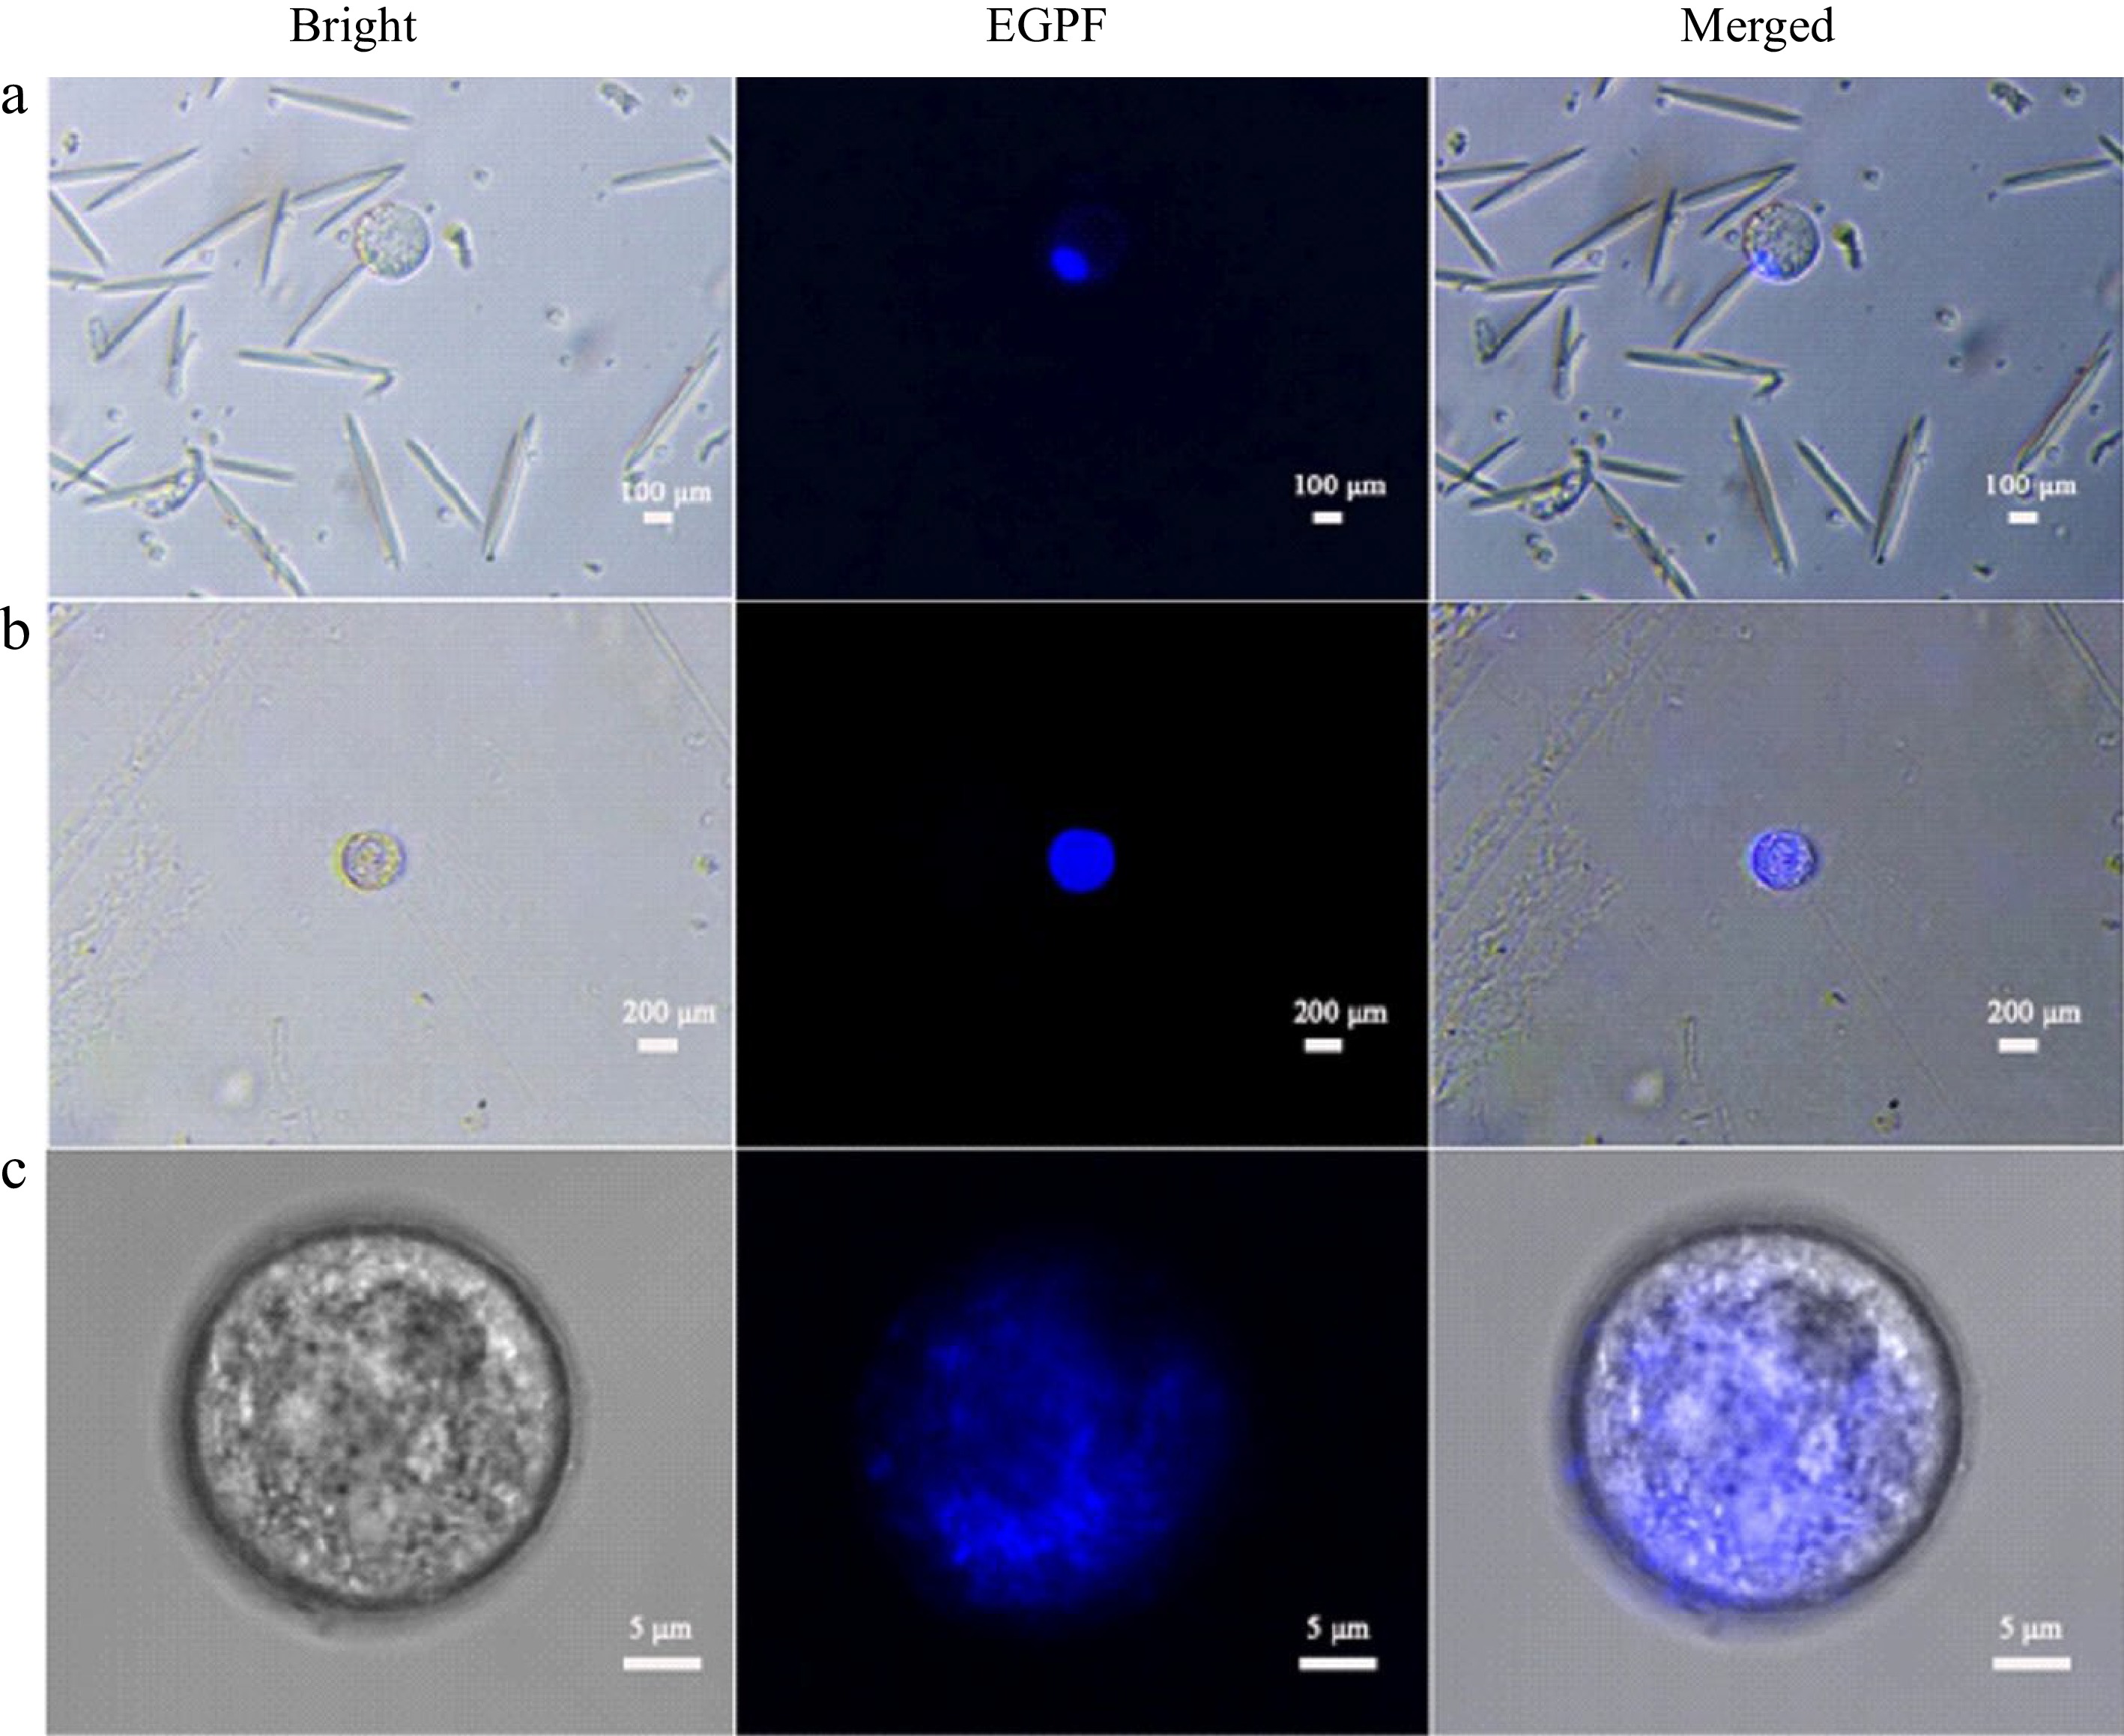
Figure 3.
DAPI stained coconut protoplast. (a) Leaf protoplasts, (b) endosperm protoplast, (c) endosperm protoplasts under confocal microscopy.
-
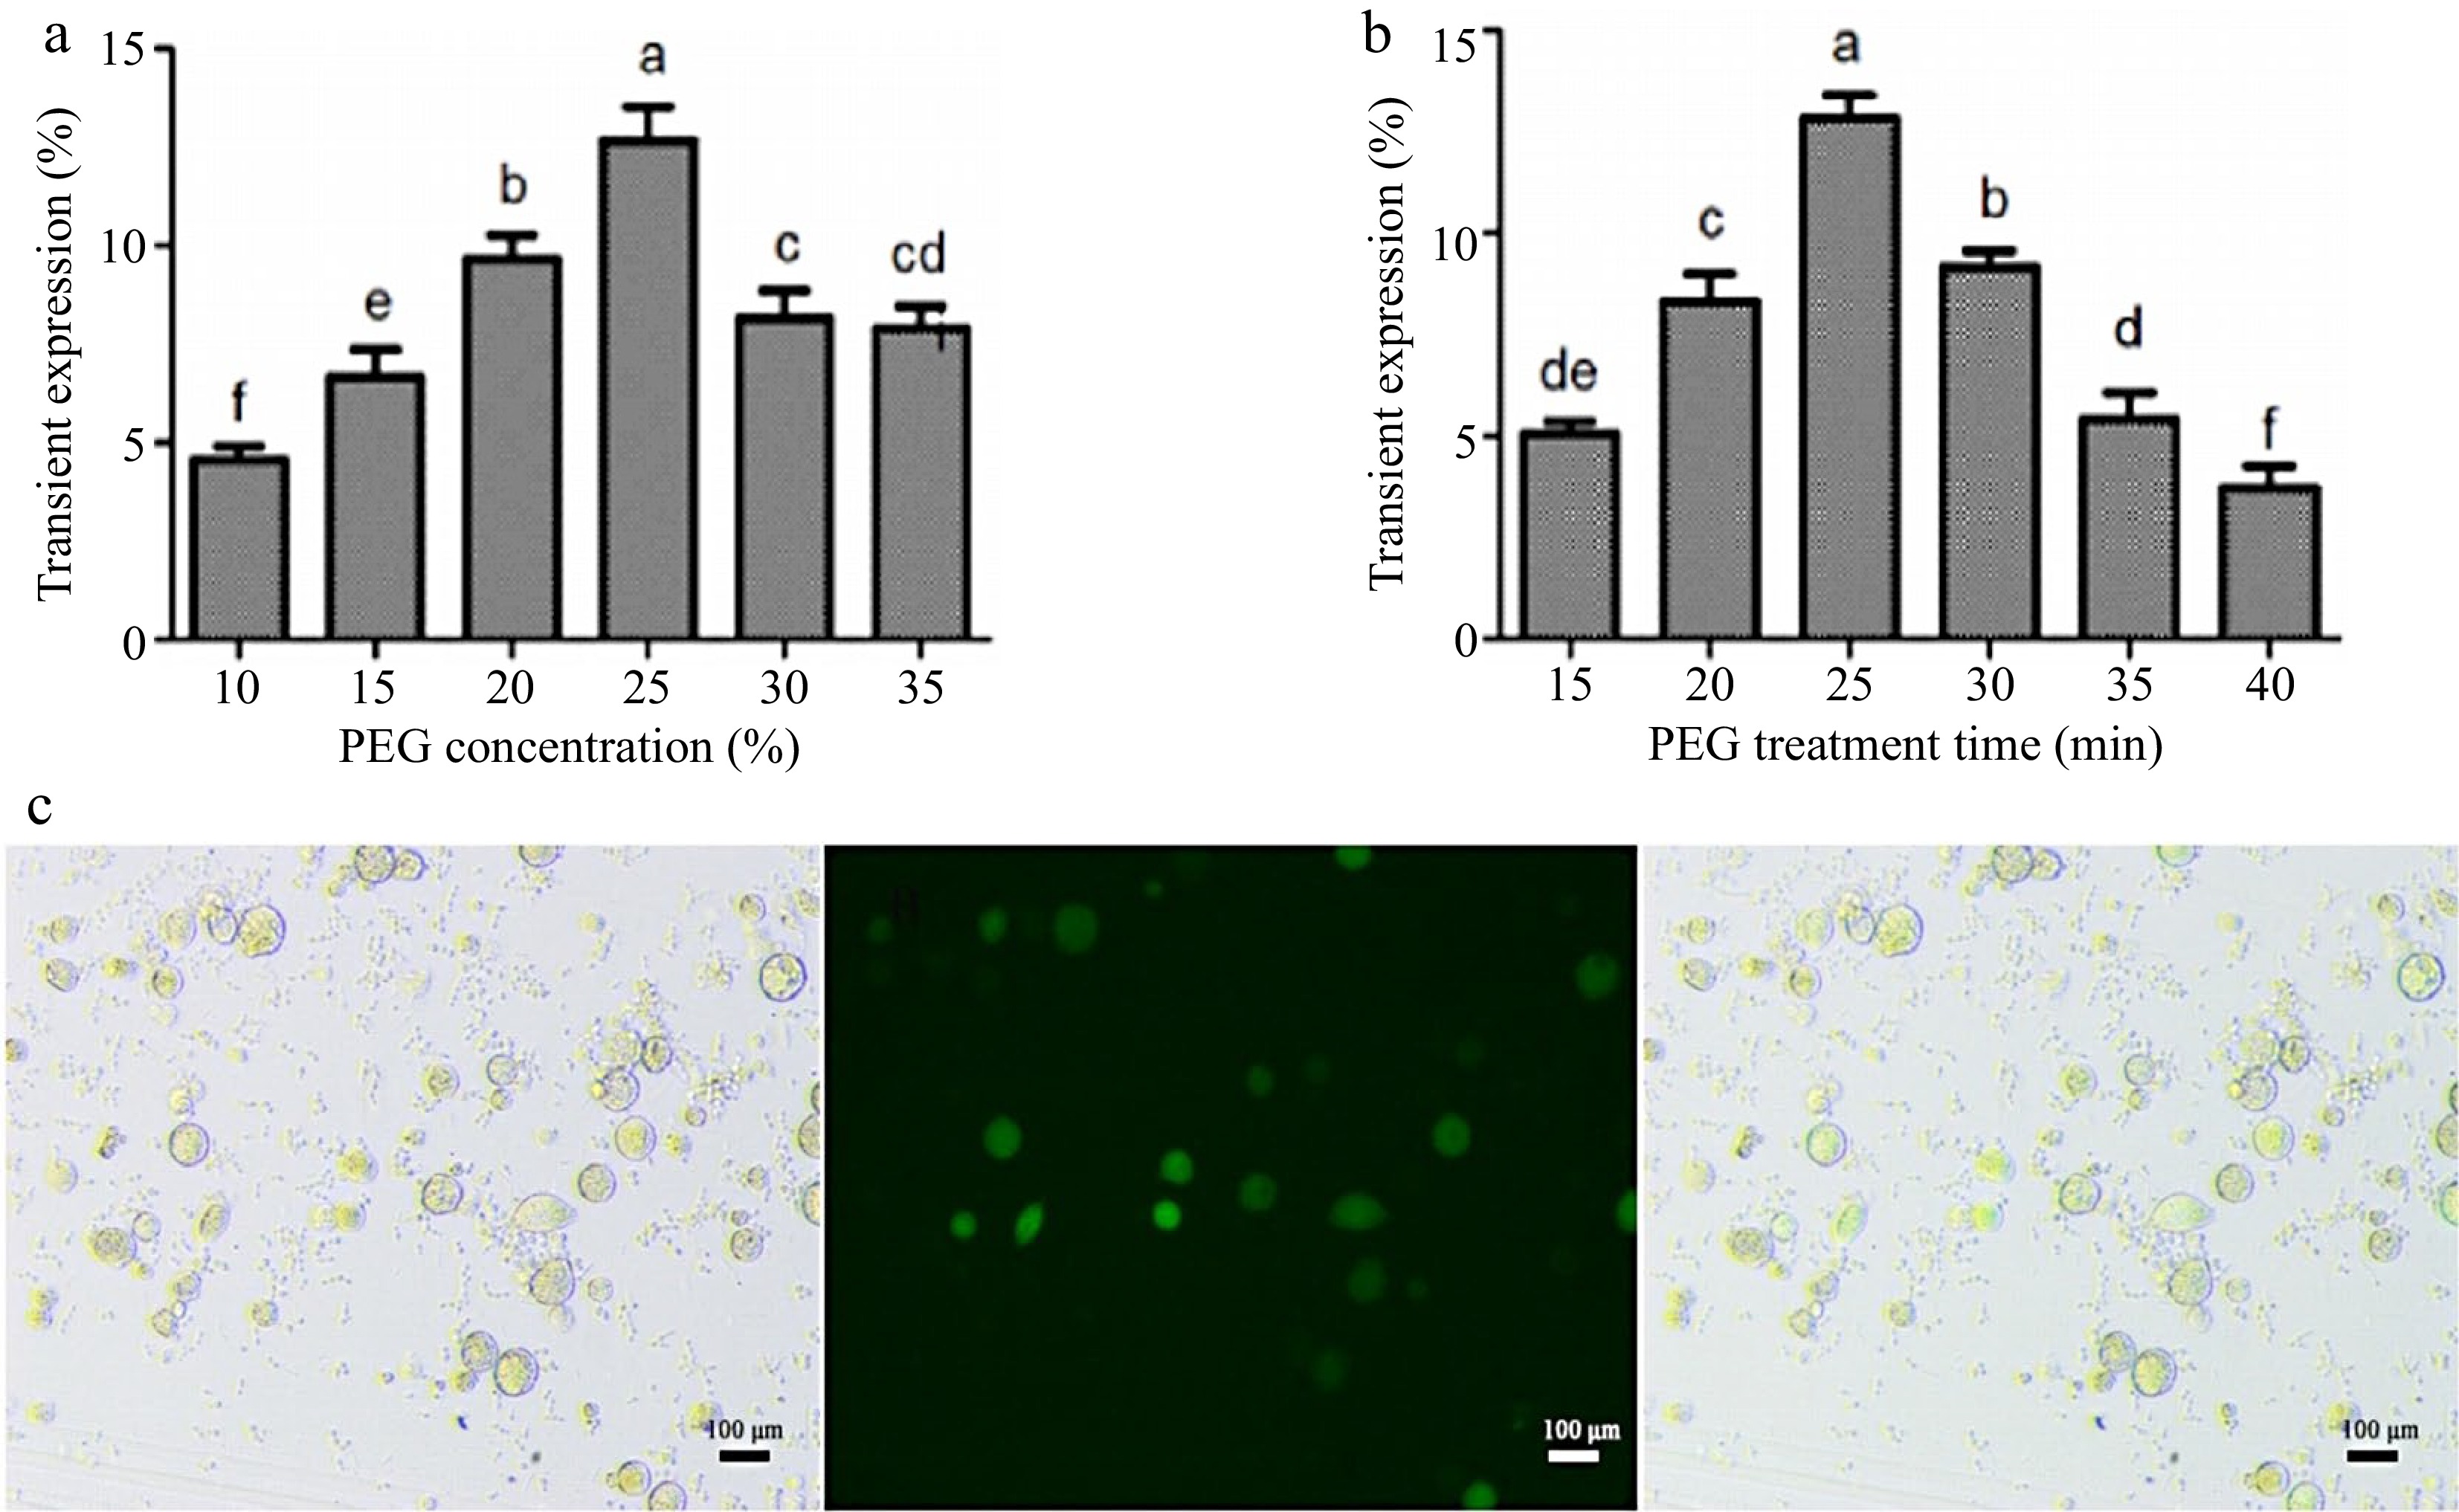
Figure 4.
Optimization of the instantaneous transformation system for coconut endosperm protoplasts. (a) PEG final concentration treatment, (b) PEG incubation time, (c) effect diagram of endosperm protoplast transformation. Different lowercase letters indicate significant differences (p < 0.05).
-
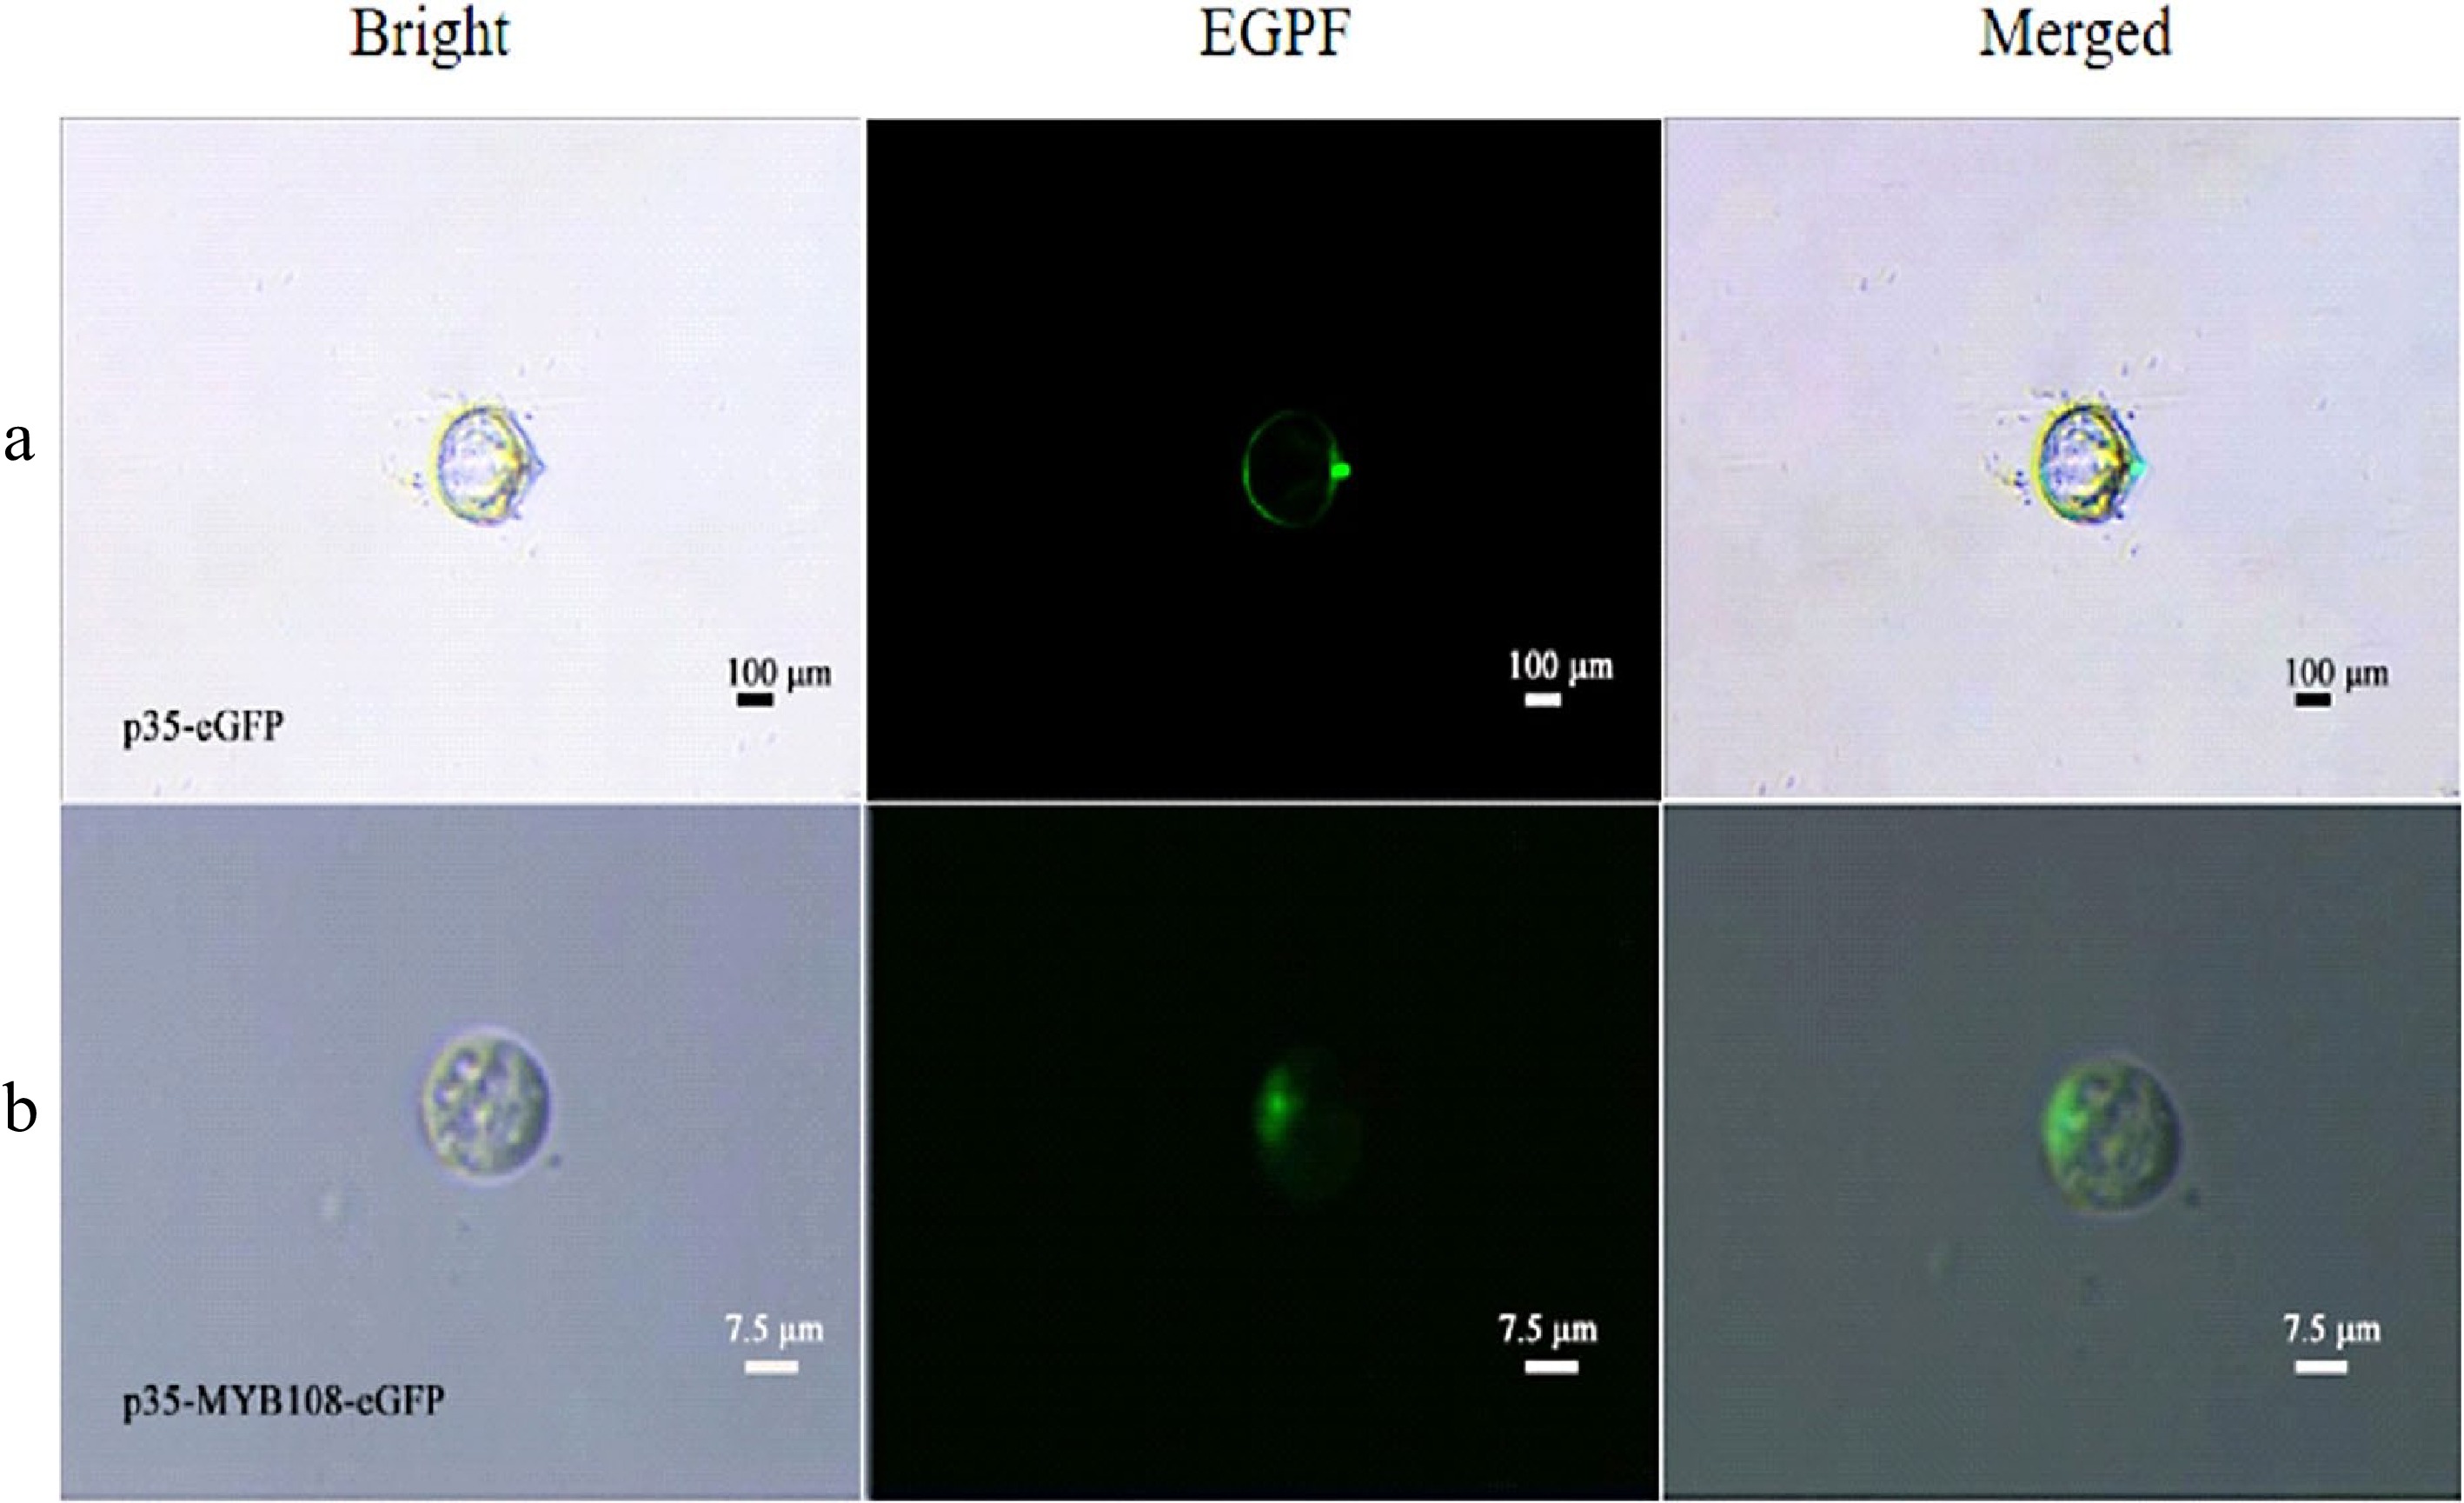
Figure 5.
Coconut leaf protoplasts. (a) p35-eGFP fluorescence localization, (b) subcellular localization of p35-MYB108-eGFP in leaf protoplasts.
-
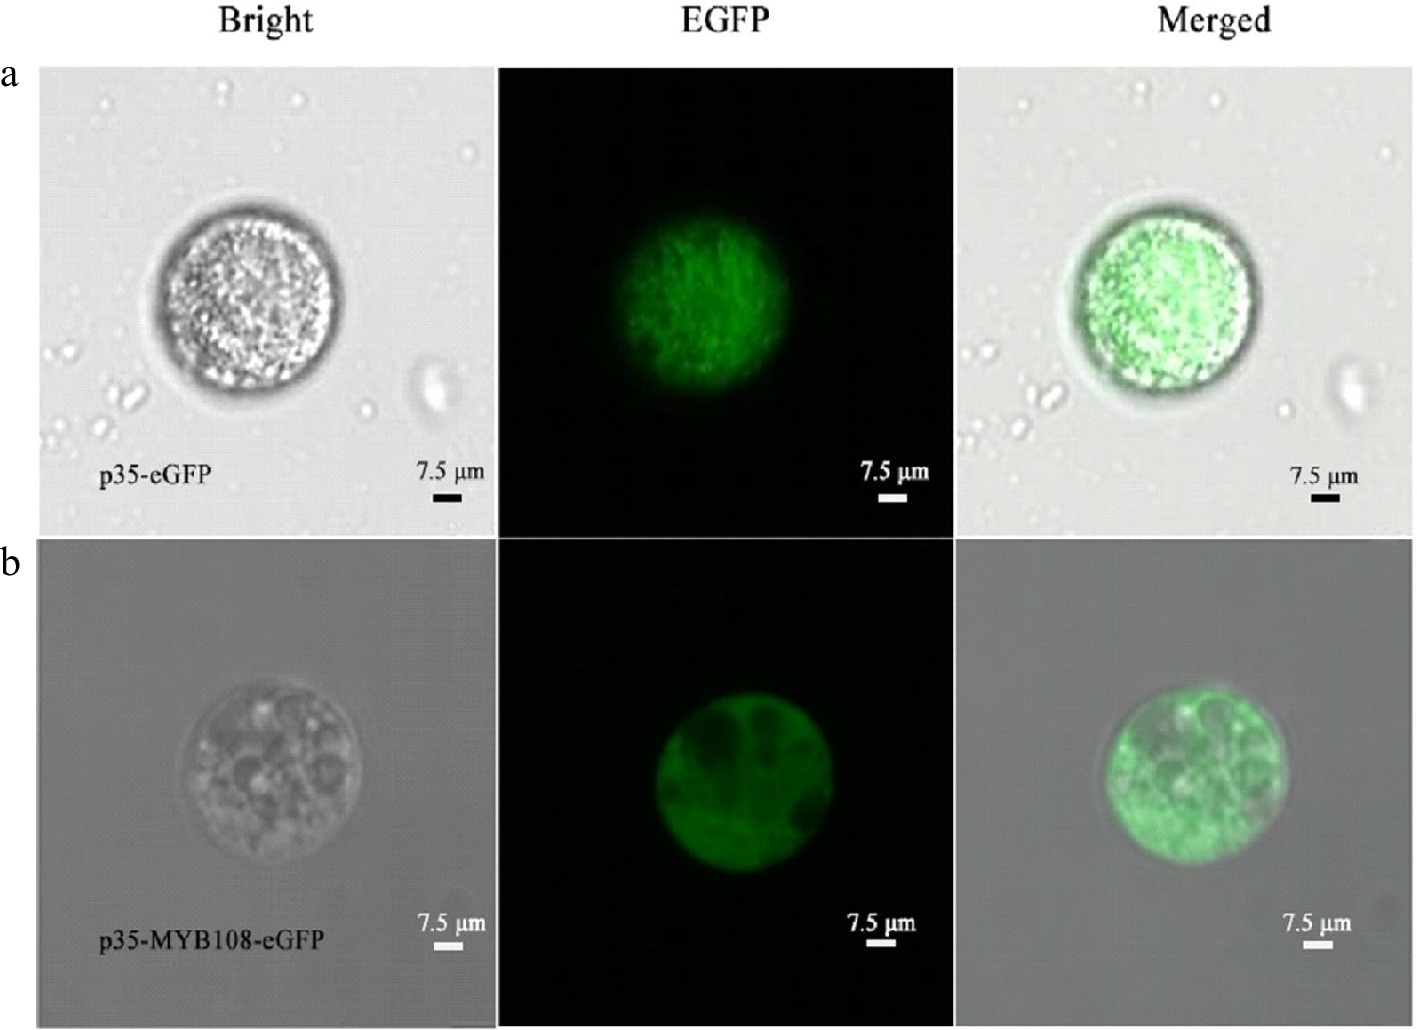
Figure 6.
Coconut liquid endosperm protoplasts. (a) p35-eGFP fluorescence localization, (b) subcellular localization of p35-MYB108-eGFP in endosperm protoplasts.
-
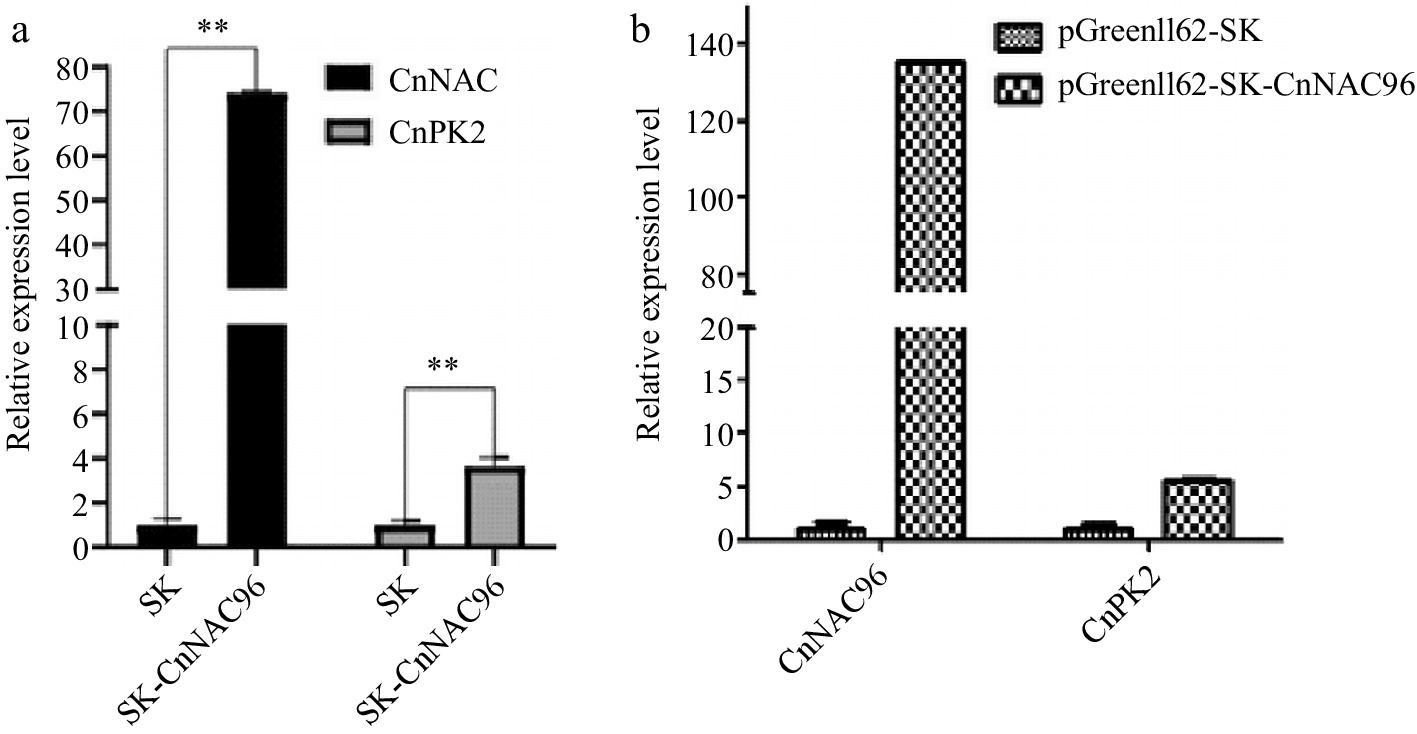
Figure 7.
RT-qPCR analysis of CnNAC96 and CnPK2 in coconut protoplast.
Figures
(7)
Tables
(0)