-

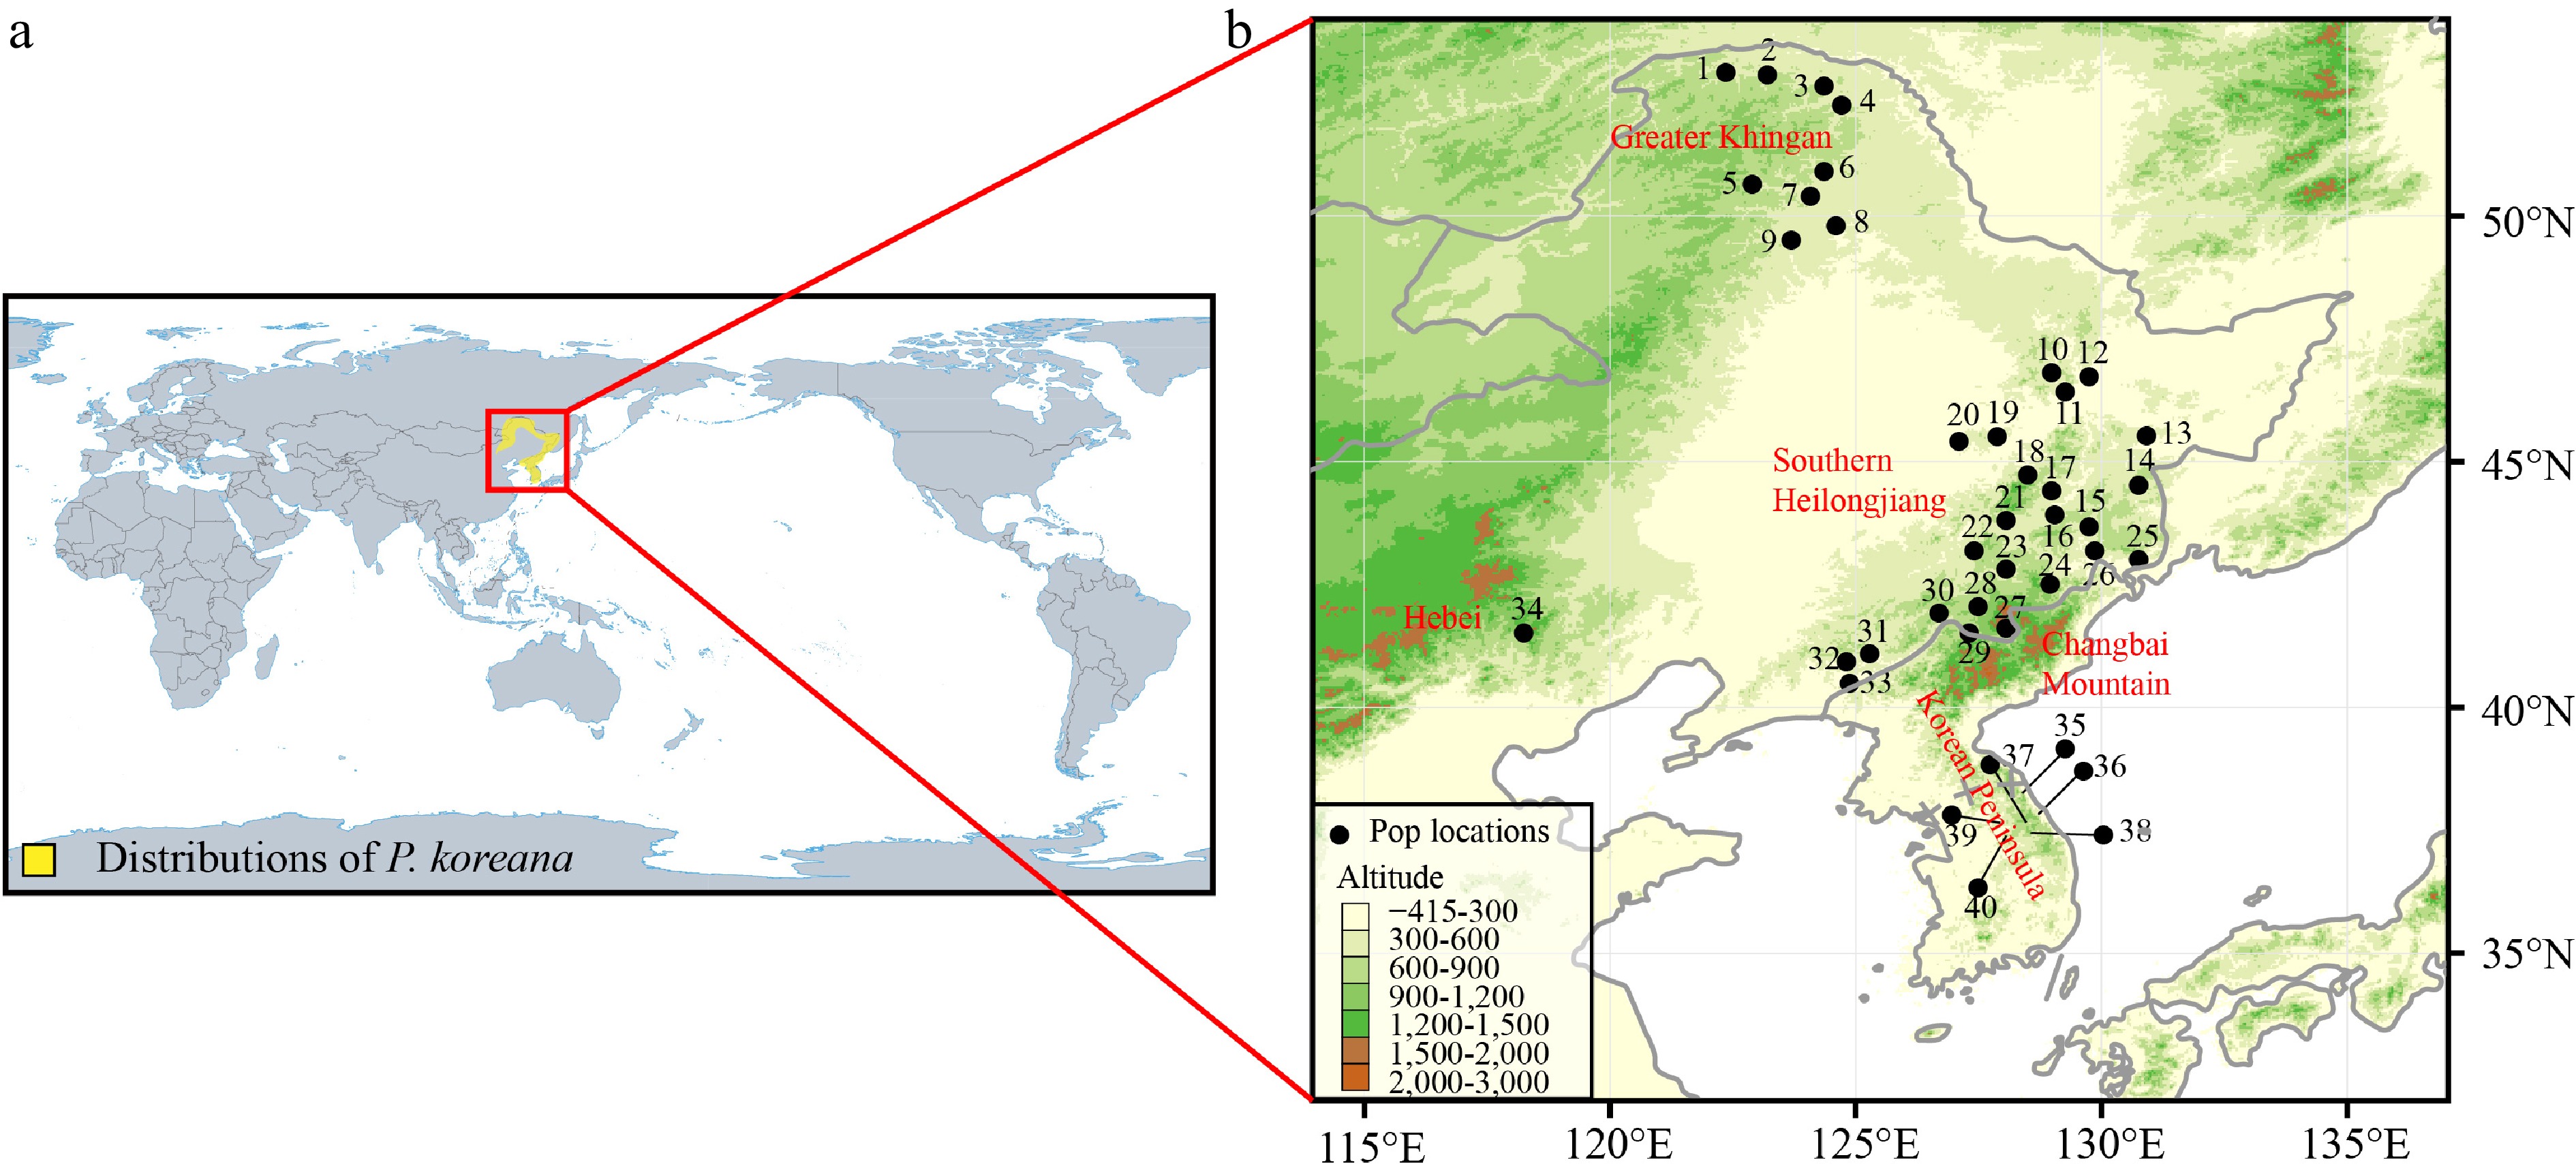
Figure 1.
(a) The main distribution range of Populus koreana. (b) Map of the 40 sampled P. koreana populations. Supplemental Table S1 contains the code and coordinates of each population.
-

Figure 2.
Using 11 nSSR loci and DIYABC2.0, a schematic representation of the seven demographic scenarios for P. koreana was examined, along with model parameters.
-

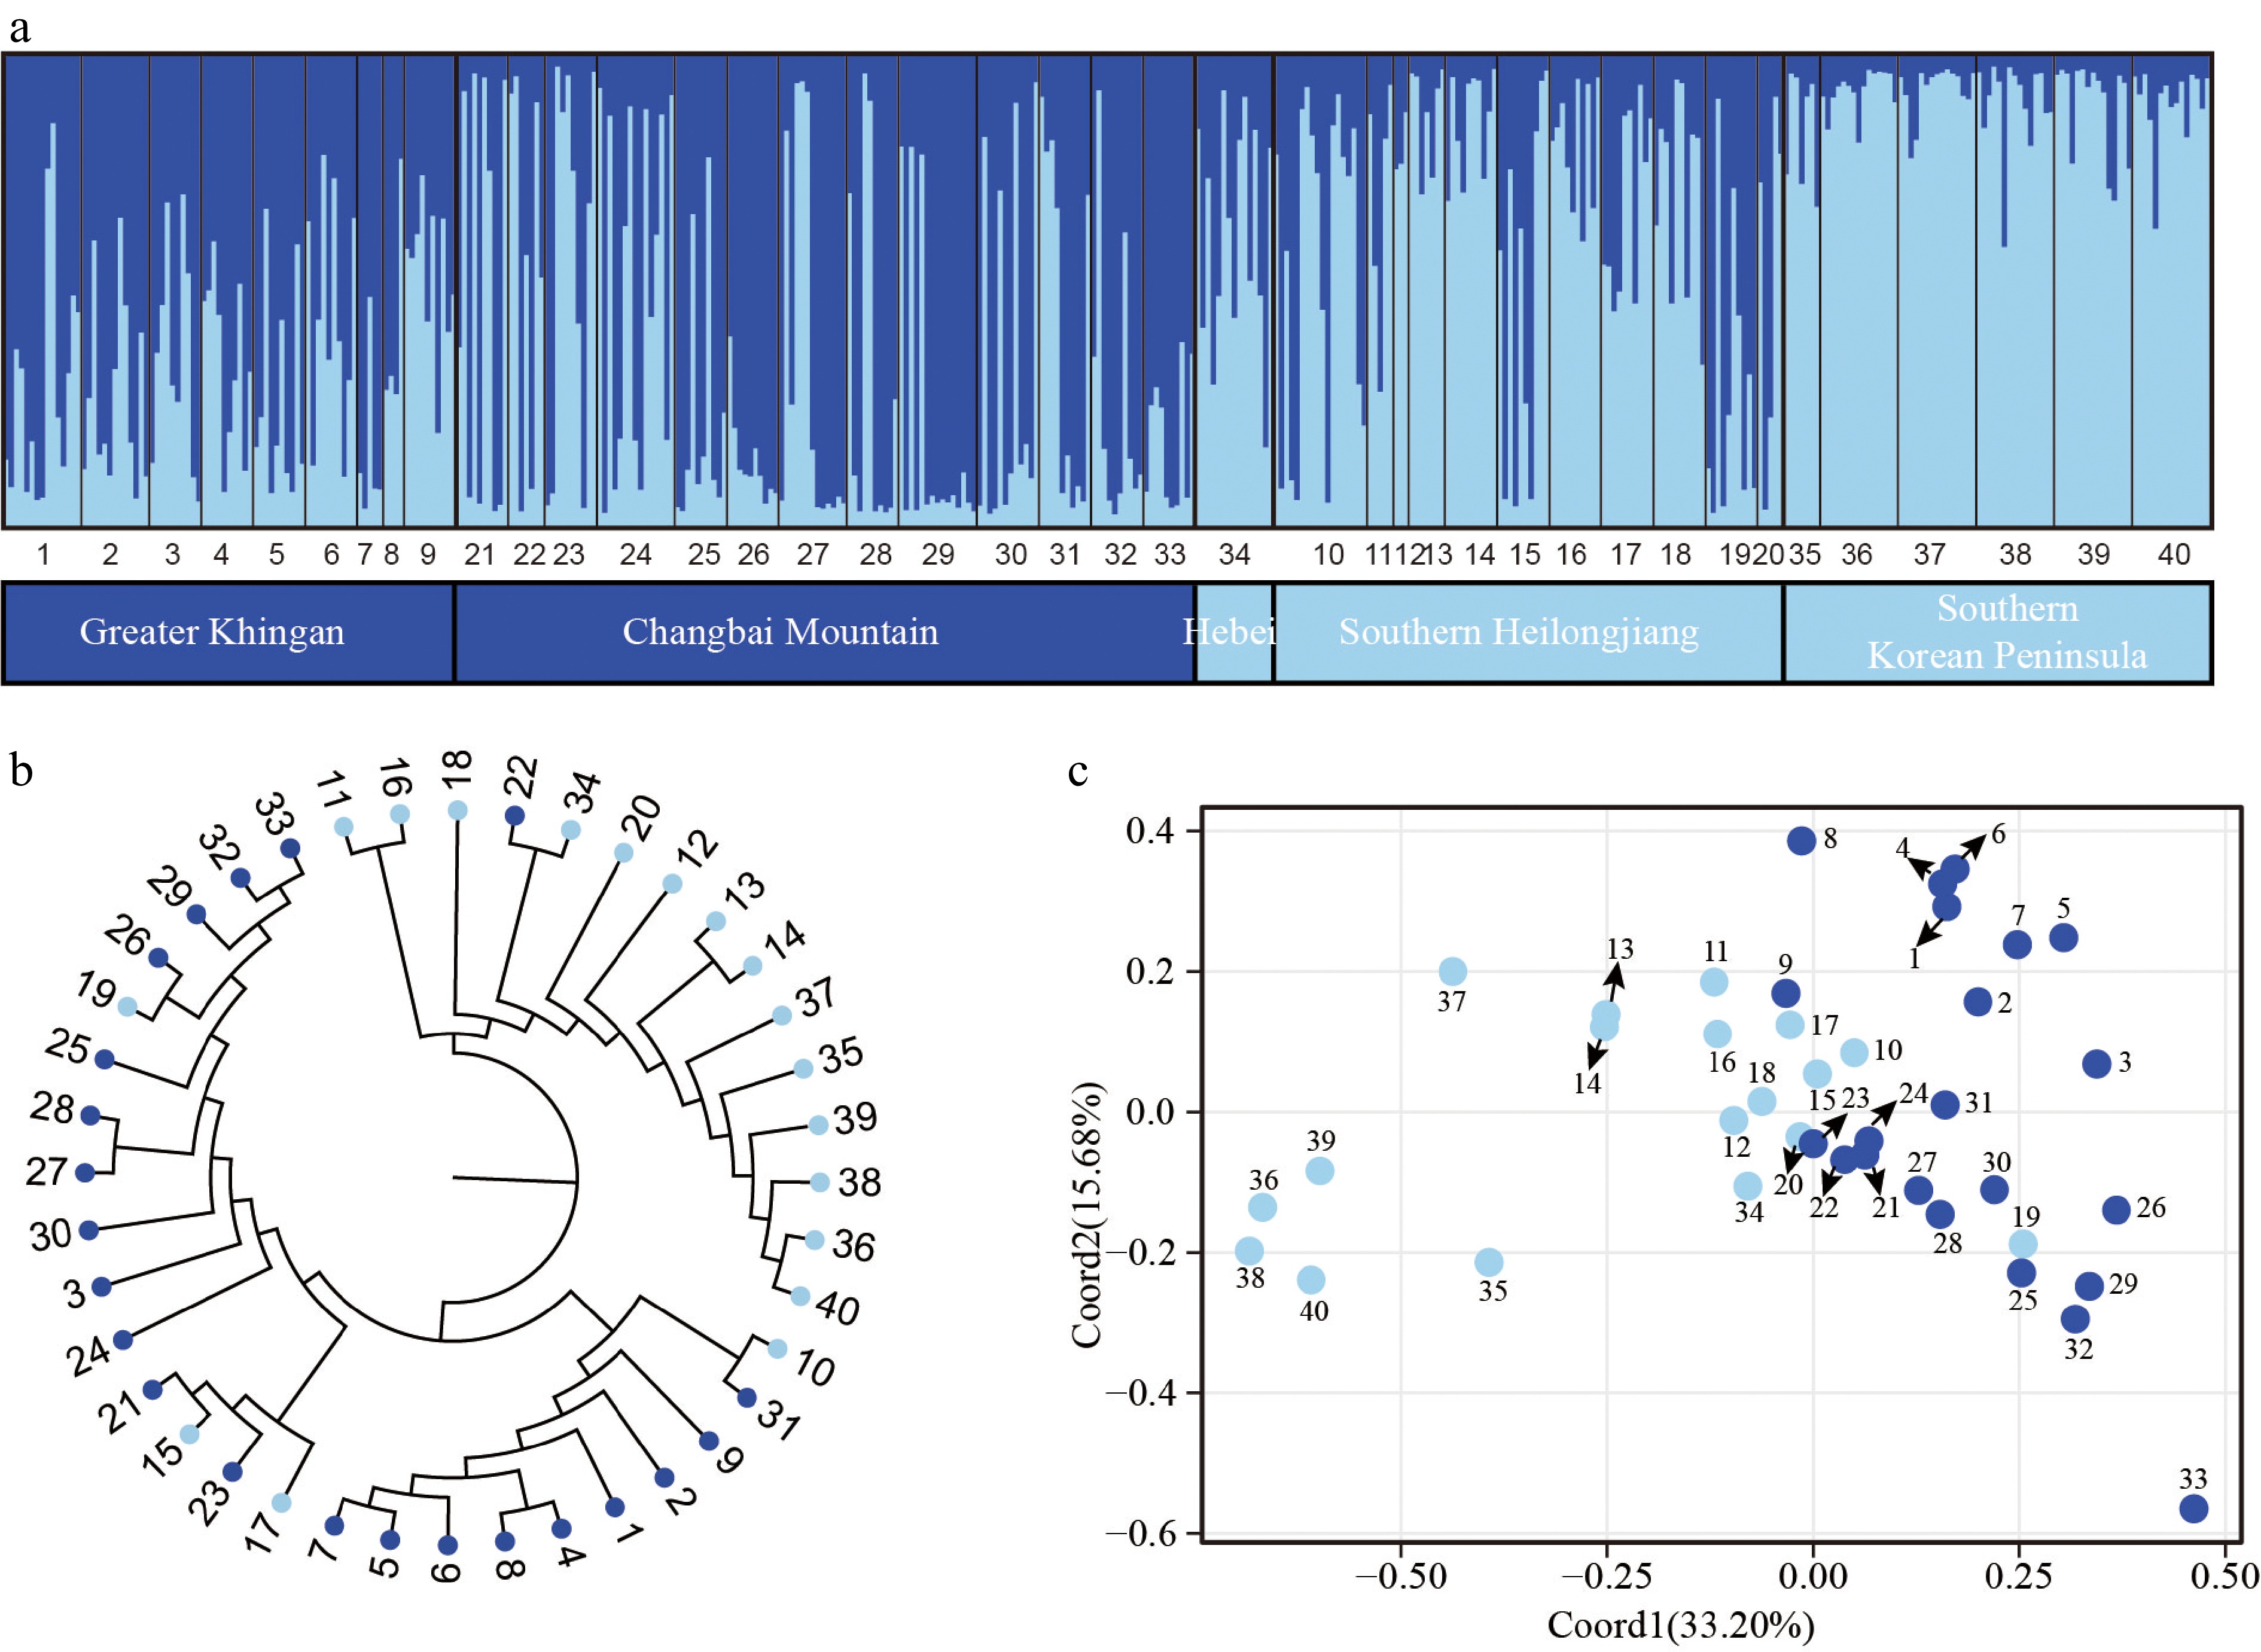
Figure 3.
Population genetic structure of P. koreana based on 11 nSSRs (n = 424). (a) The histogram illustrates the outcomes of the STRUCTURE assignment test with a value of K = 2. The representation of each individual is denoted by a vertical bar, which signifies the cumulative assignment probabilities to the two groups. The utilization of black lines serves the purpose of demarcating distinct populations. (b) The construction of a phylogenetic tree representing all populations of P. koreana based on DA. The genetic clusters found by STRUCTURE analysis are demarcated by branch colors. Please refer to Supplemental Table S1 for the corresponding population codes. (c) Principal coordinate analysis (PCoA) was conducted on a dataset consisting of 40 populations. The results revealed that Coord1 accounted for 33.20% of the variation, while Coord2 explained 15.68% of the variance.
-

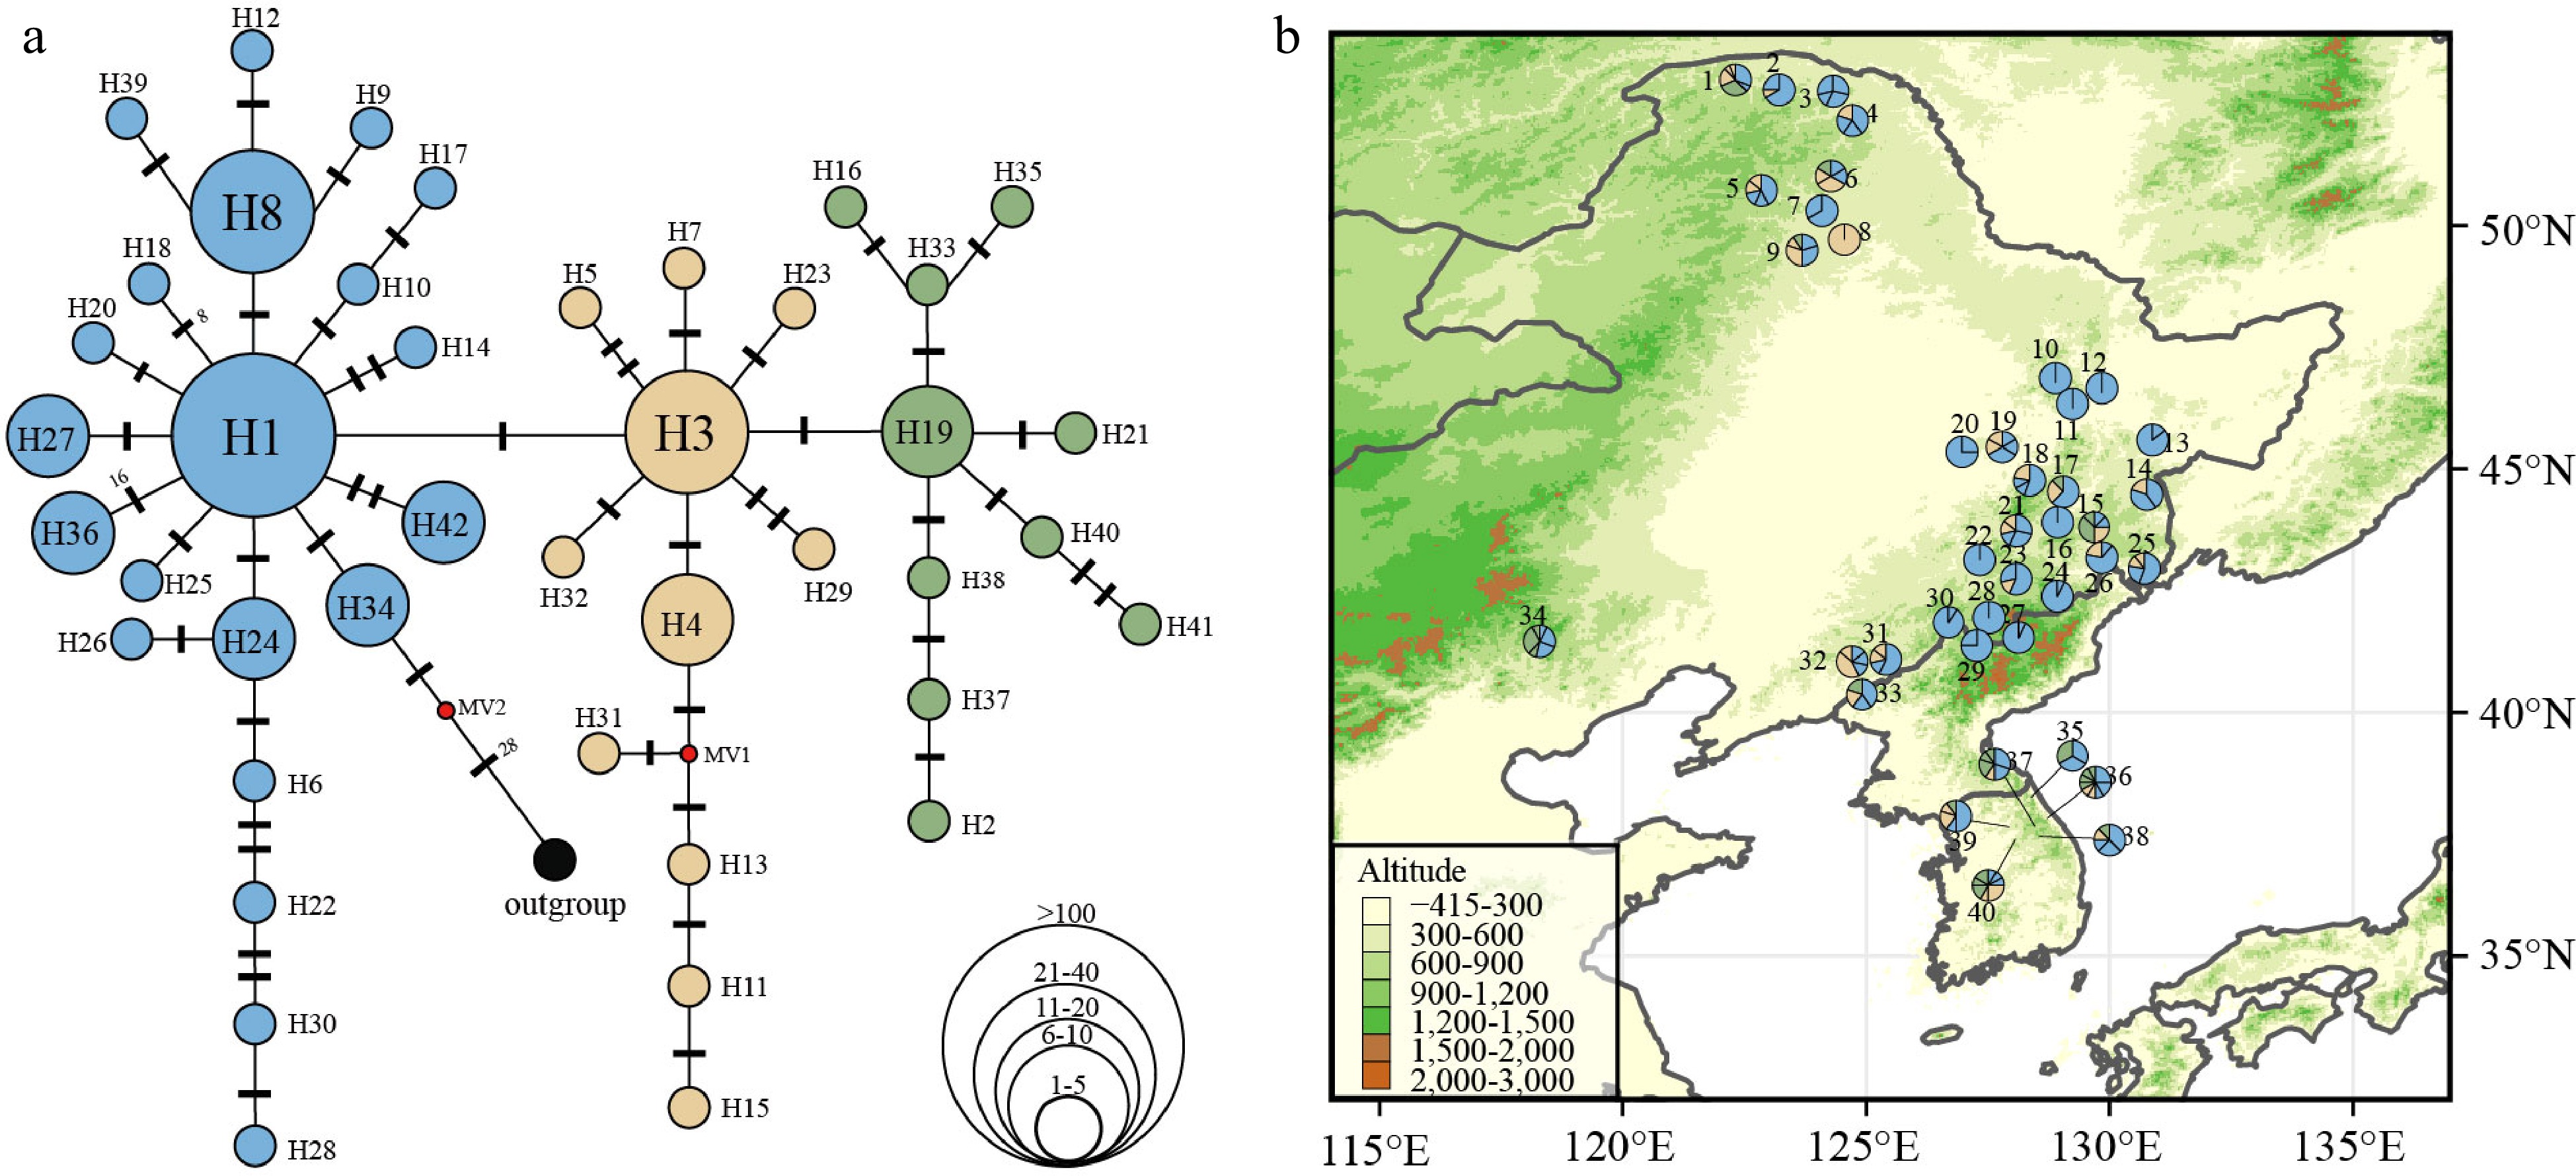
Figure 4.
(a) Chloroplast haplotype network of 42 haplotypes discovered in 40 P. koreana populations (n = 398). The size of the circles represents the relative frequency of each haplotype, while the presence of red dots signifies the absence of certain haplotypes. Bars indicate the number of mutations between haplotypes. (b) Haplotype frequency distribution in 40 P. koreana populations, colors correspond to the haplotype colors in (a).
-

Figure 5.
Ecological niche modeling outputs of P. koreana (a)−(e) under (a) LIG, (b) LGM, (c) MH, (d) present and (e) future conditions, respectively. Warmer colors indicate higher probabilities of occurrence, and orange and yellow indicate medium and low probabilities, respectively.
Figures
(5)
Tables
(0)