-
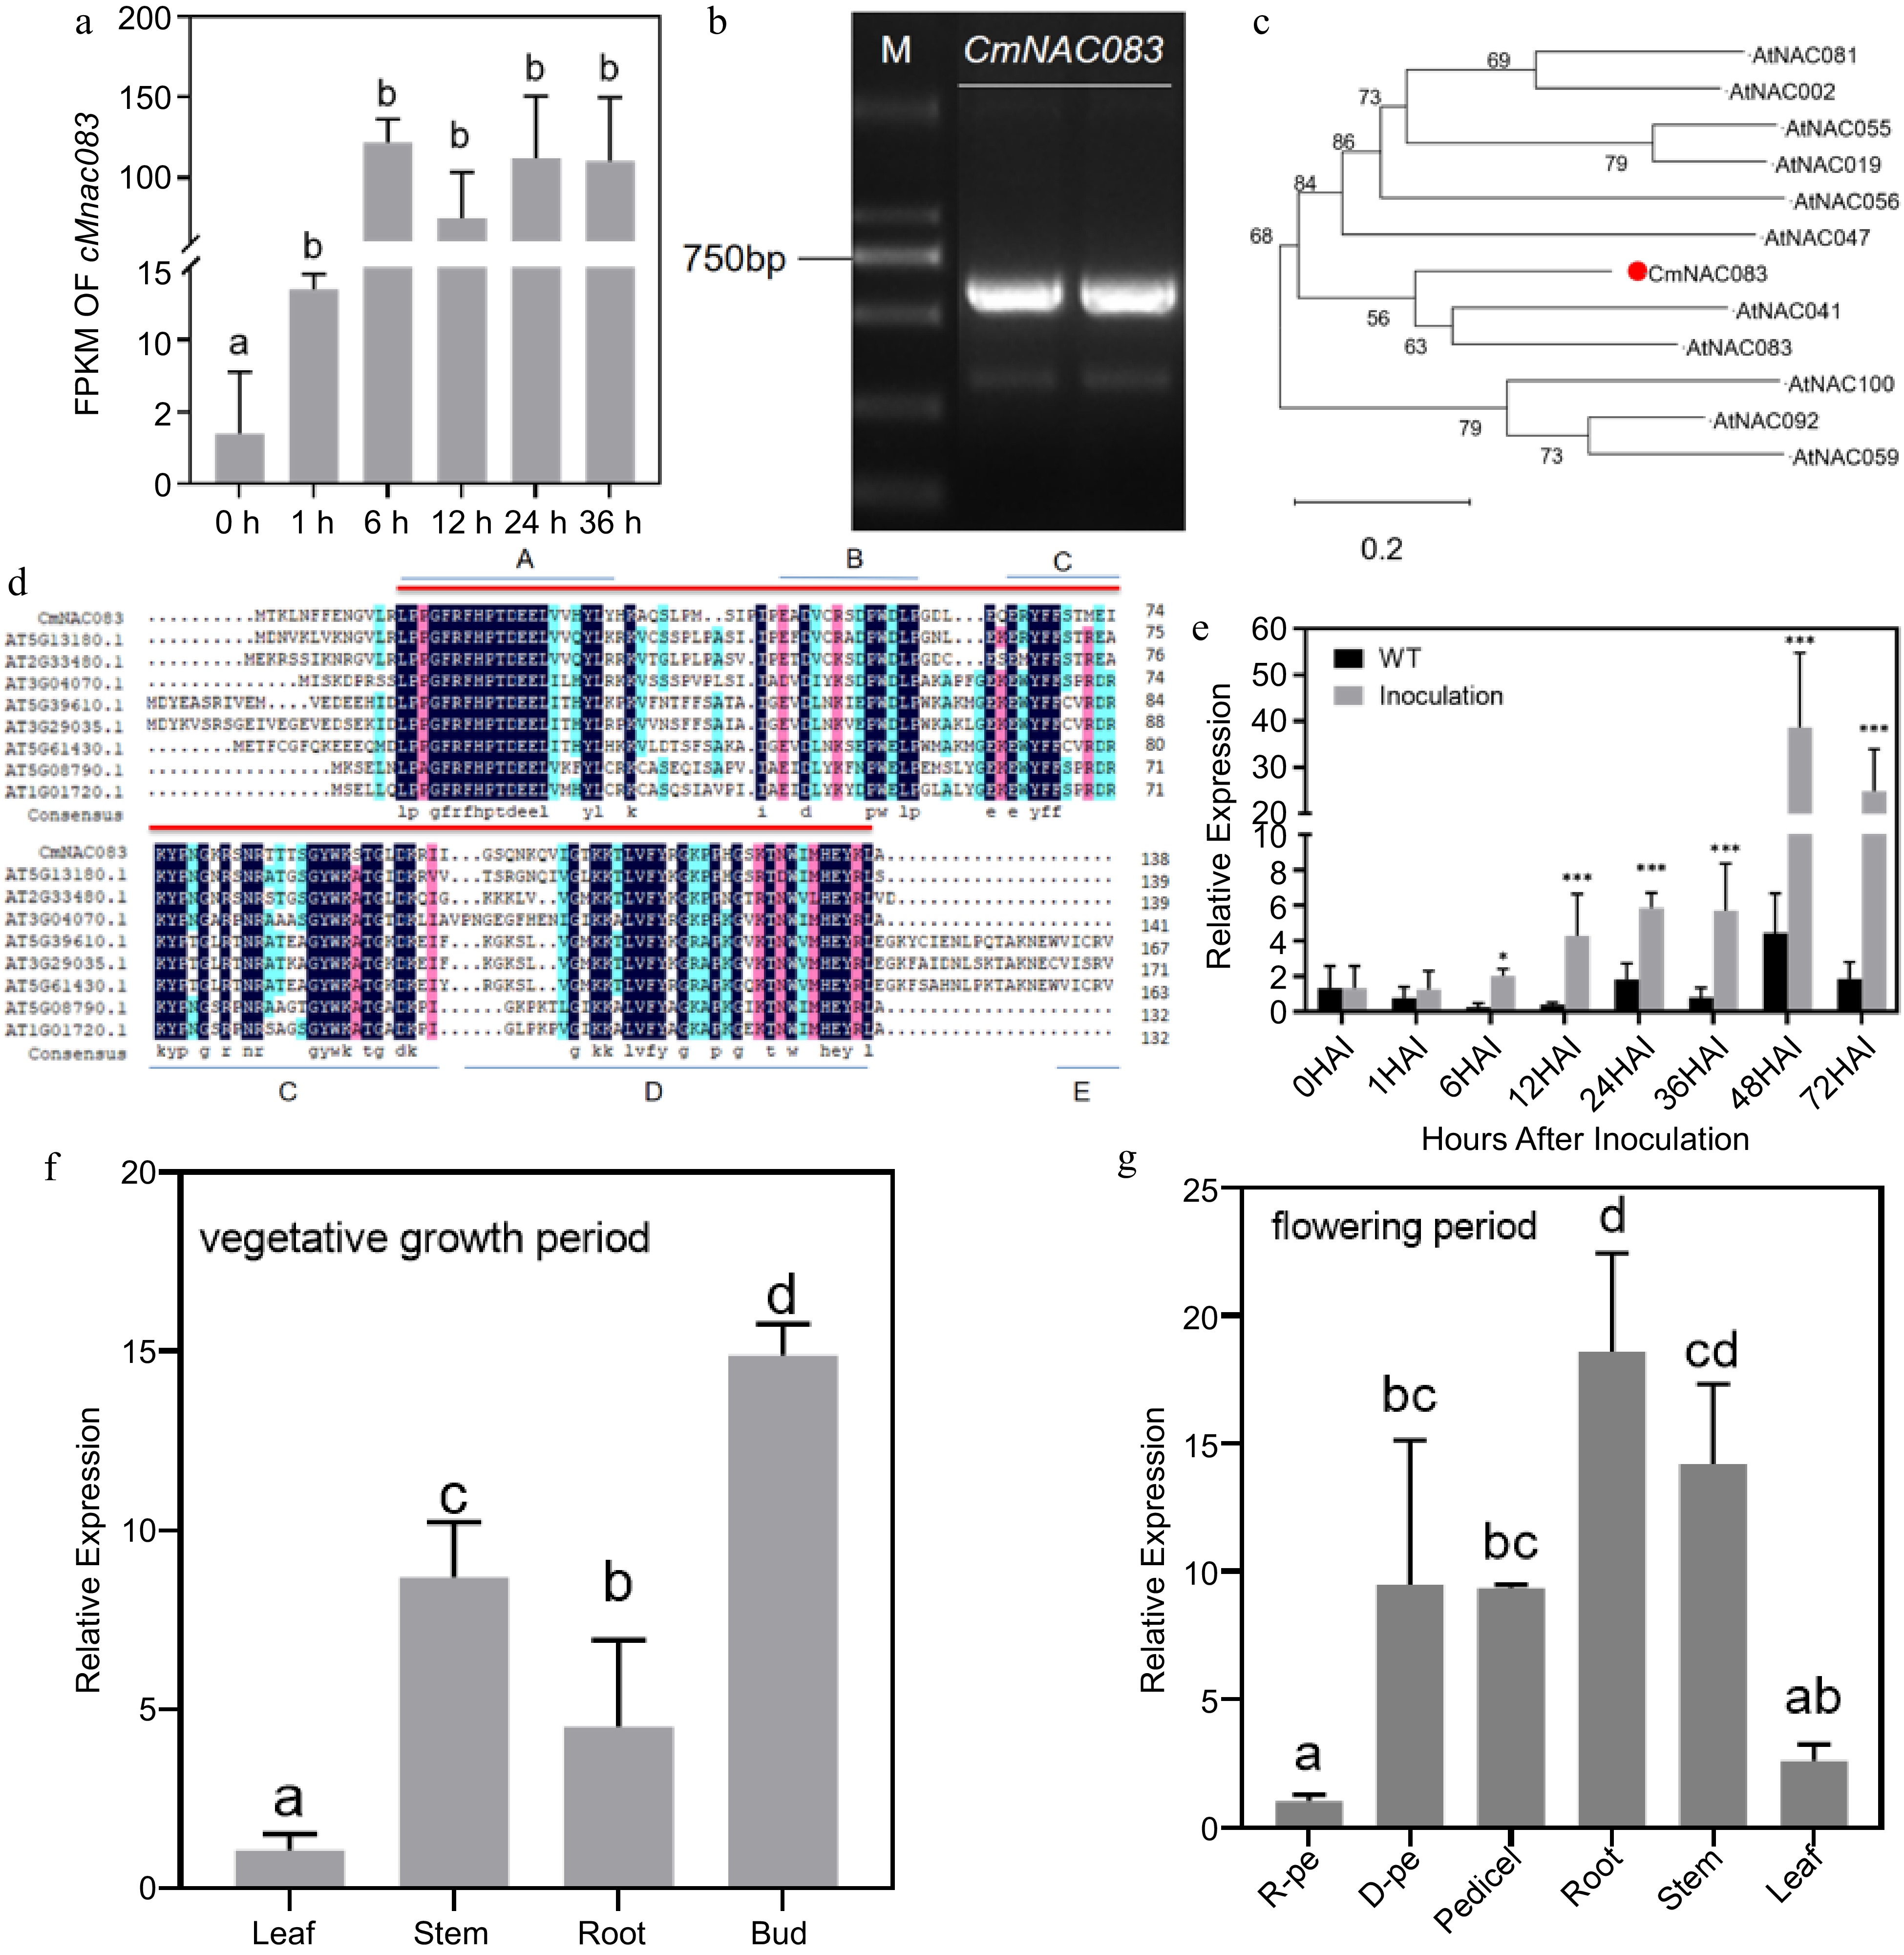
Figure 1.
Cloning and expression analysis of CmNAC083. (a) Analysis of the fragments per kilobase of script per million fragments mapped of CmNAC083 at 0, 1, 6, 12, 24, and 36 h after inoculation with Alternaria alternata. (b) The results of electrophoresis of polymerase chain reaction products of the CmNAC083 clone Note: M: DL2000. (c) The phylogenetic analysis of CmNAC083 amino acid and Arabidopsis NAC family amino acid sequences. (d) Comparison of CmNAC083 amino acid sequence with the homologous protein in Arabidopsis. (e) CmNAC083 gene expression during A. alternata infection at different times. Wild-type not inoculated. The statistical analyses were performed using Student's test (* p < 0.05, *** p < 0.001). (f) CmNAC083 gene expression in different tissues during the vegetative growth period. (g) CmNAC083 gene expression in different tissues (R-pe, ray florets petals; D-pe, and disc florets petals) during the flowering period. Data are presented as the mean ± standard error of the mean from the three biological replications. Statistical analyses were performed using Duncan's test. Different lowercase letters represent a significant difference between treatments at (p < 0.05).
-
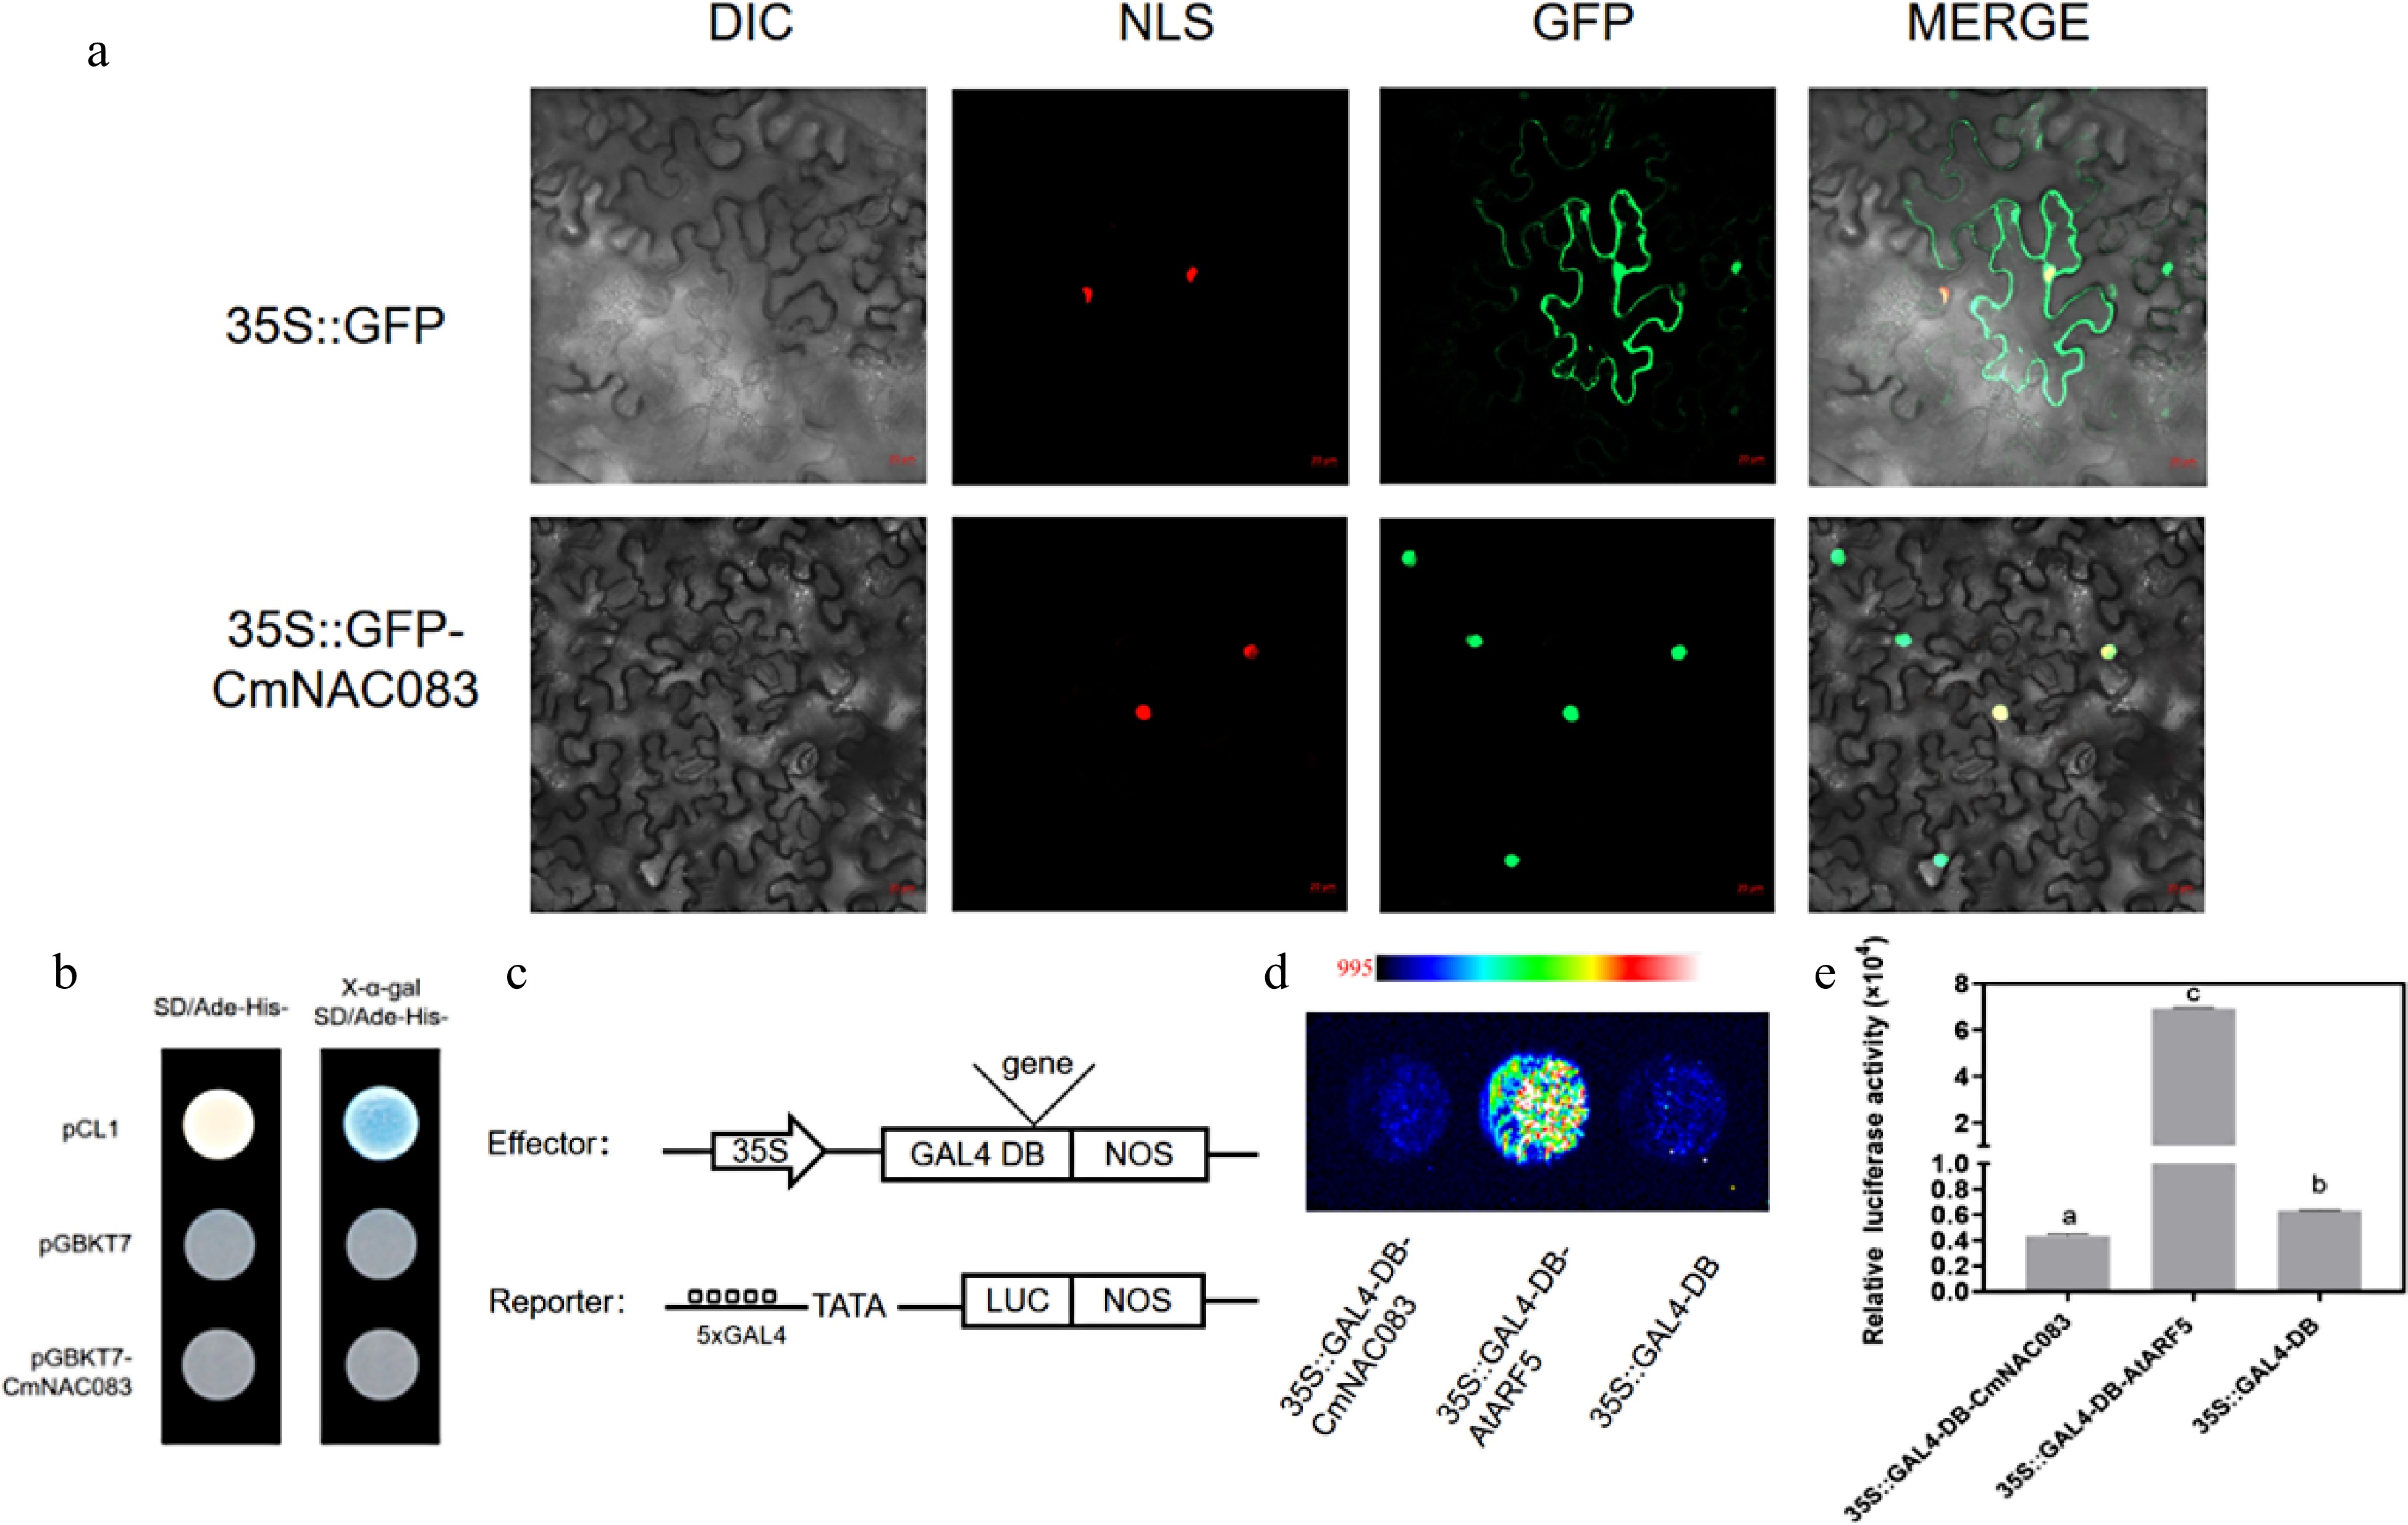
Figure 2.
CmNAC083 subcellular localization and transactivation analysis. (a) The subcellular localization of CmNAC083 in Nicotiana benthamiana cells. DIC, bright-field image; NLS, nuclear localization signal exhibited by the red fluorescent protein; GFP, green fluorescent protein; merged, overlay images. Scale bars = 20 µm. (b) CmNACO83 transcriptional activation analysis in yeast cells. Positive control: pCL1; negative control: pGBKT7. (c) Simple structure diagrams of the effector and reporter in the protoplast transfection experiment. (d) Fluorescence images of protoplasts after the addition of 20 mM fluorescein sodium. The gradual increase in fluorescence signal from blue to red. Positive control: ARF5; negative control: GAL4-DB. (e) Quantitation of luciferase intensity of each sample. Positive control: ARF5; negative control: GAL4-DB. Data are presented as the mean± standard error of the mean (n = 3). Significant differences were determined using Student's test at (*** p < 0.001).
-
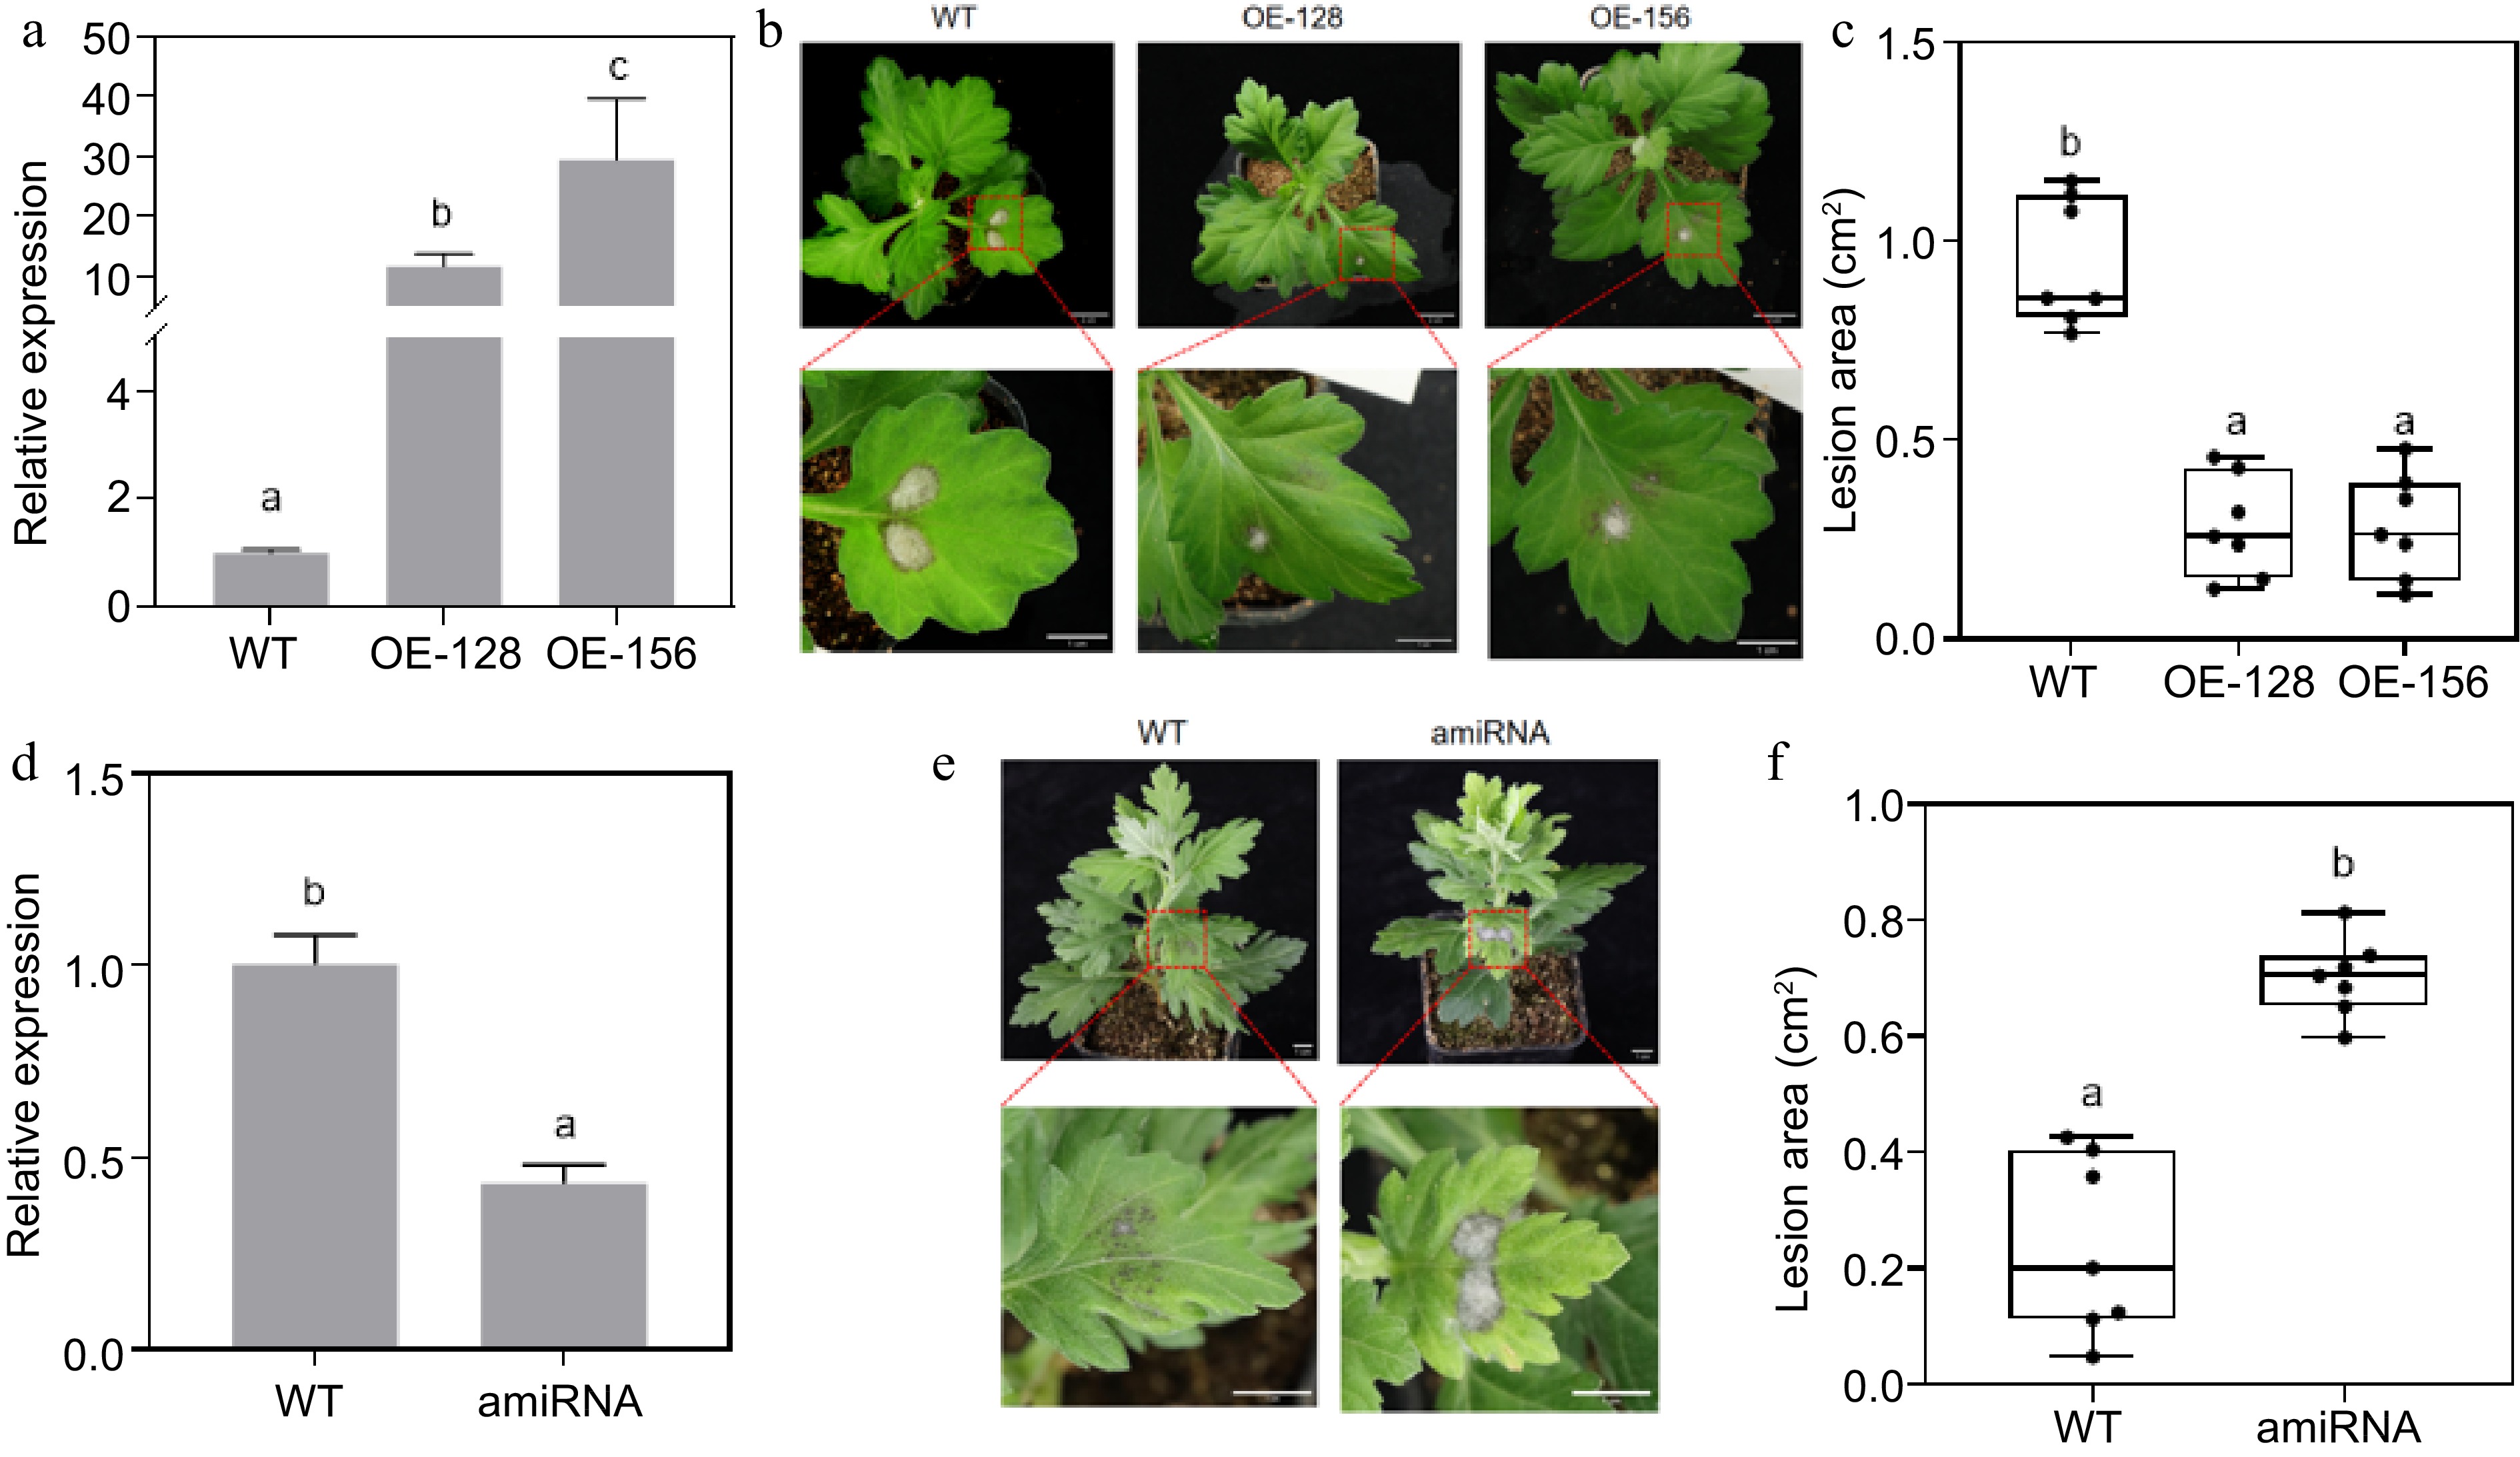
Figure 3.
Resistance analysis of CmNAC083 overexpression and transient silencing lines. (a) Identification of CmNAC083 overexpression transgenic lines at the RNA level. (b) Plant phenotype observation of transgenic lines and wild-type (WT) plants (1 month). Overall and drawings scale bars were = 2 cm and = 1 cm, respectively. (c) Area of diseased spots of the WT and transgenic lines inoculated with Alternaria alternata. (d) Identification of CmNAC083 instantaneous silencing transgenic lines at the RNA level. (e) Plant phenotype observation of WT-CaLCuV and instantaneous silencing transgenic lines (2 months). Scale bars = 1 cm. (f) Area of diseased spots of the WT-CaLCuV and instantaneous silencing transgenic lines inoculated with A. alternata. WT: WT-CaLCuV; amiRNA: WT-CaLCuV- CmNAC083. Data represent the mean ± standard error of the mean from three biological replications. Statistical analyses were performed using Duncan's test, and different lowercase letters represent a significant difference between treatments at (p < 0.05).
-
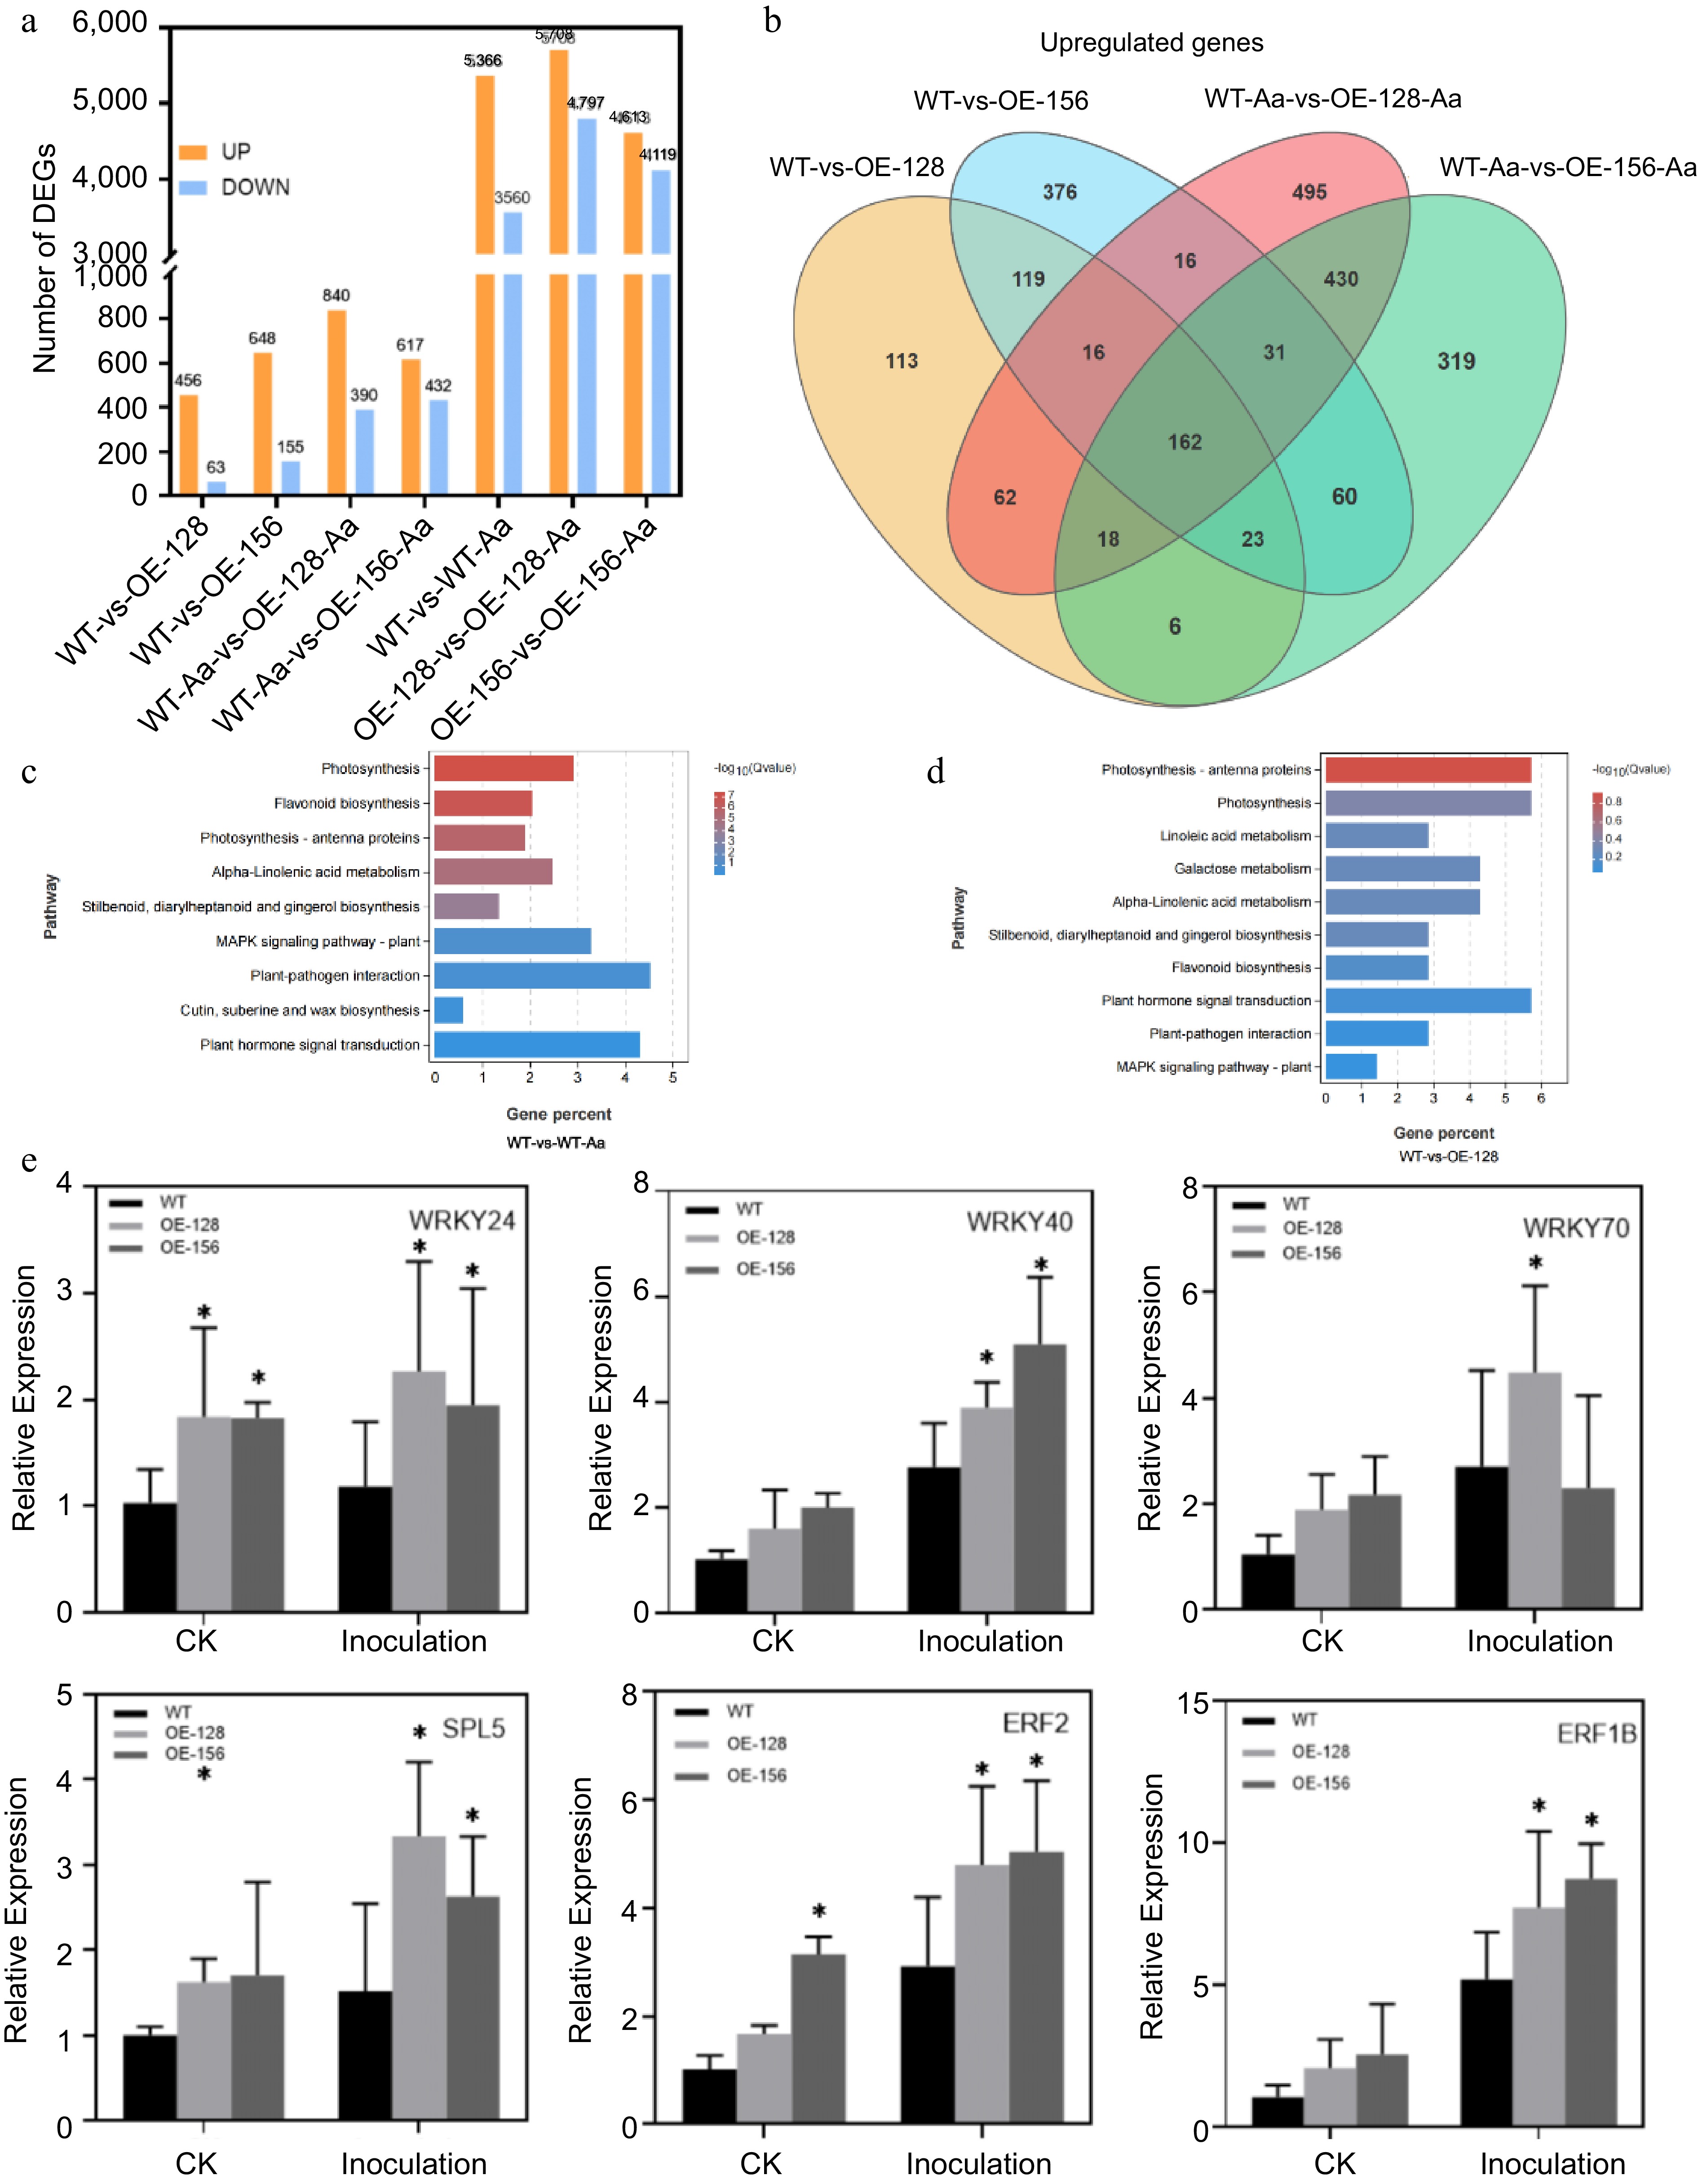
Figure 4.
Analysis of CmNAC083 transcriptome sequencing data. (a) The number of upregulated or downregulated genes in seven different comparison groups. (b) The Venn map reveals the overlap of differentially expressed genes among WT-vs-OE-128, WT-vs-OE-156, WT-Aa-vs-OE-128-Aa, and WT-Aa-vs-OE-156-Aa. (c) Kyoto Encyclopedia of Genes and Genomes (KEGG) pathway analysis of the differentially expressed genes in two comparisons (WT-vs-WT-Aa, WT-vs-OE-128) of the WT and overexpression transgenic lines under contrast and inoculation. (e) Verification of six differentially expressed transcription factor genes between WT and overexpression strains. Data are presented as the mean ± standard error of the mean from the three biological replications. Statistical analyses were performed using Duncan's test. Different lowercase letters represent a significant difference at (p < 0.05).
-
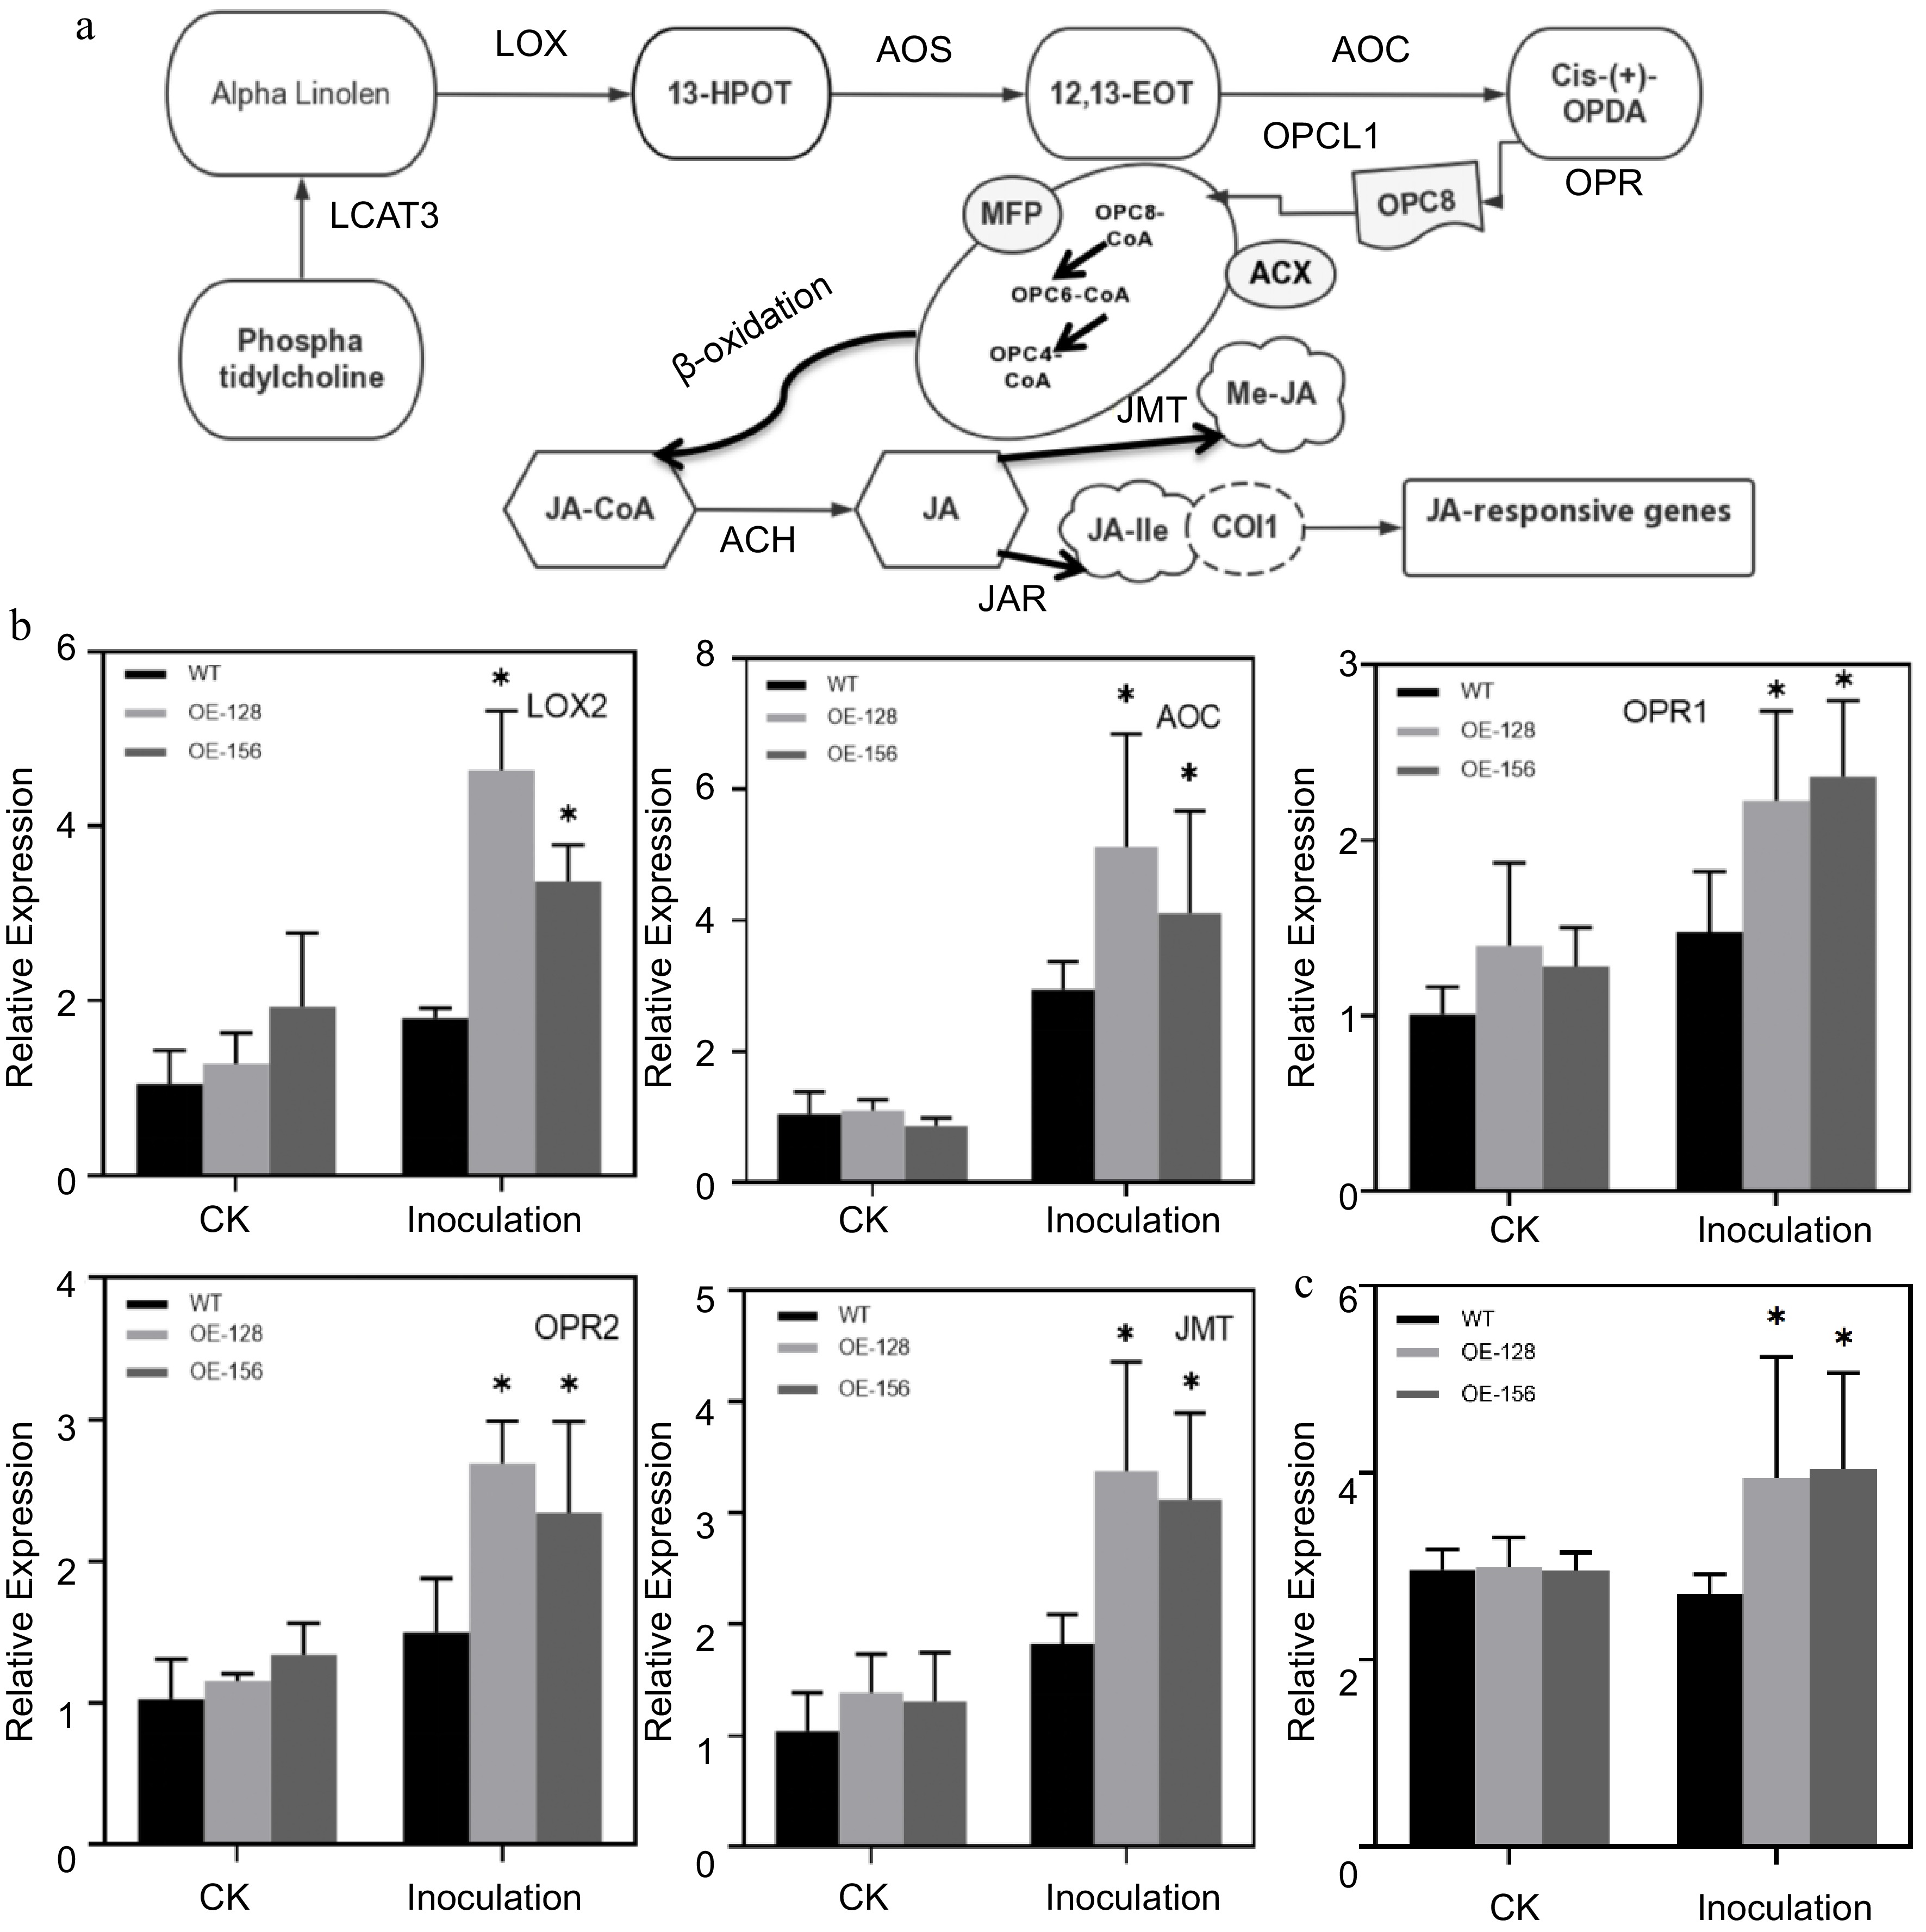
Figure 5.
Analysis of the involvement of JA signaling pathway in Alternaria alternata infection. (a) Simplified diagram of the JA signaling pathway. (b) Quantitative analysis of the JA Signaling pathway genes between WT and overexpression strains. Data are presented as the mean ± standard error of the mean from the three biological replications. Statistical analyses were performed using Duncan's test. Different lowercase letters represent a significant difference between treatments at (p < 0.05). (c) Determination of endogenous JA content after inoculating with A. alternata.
-
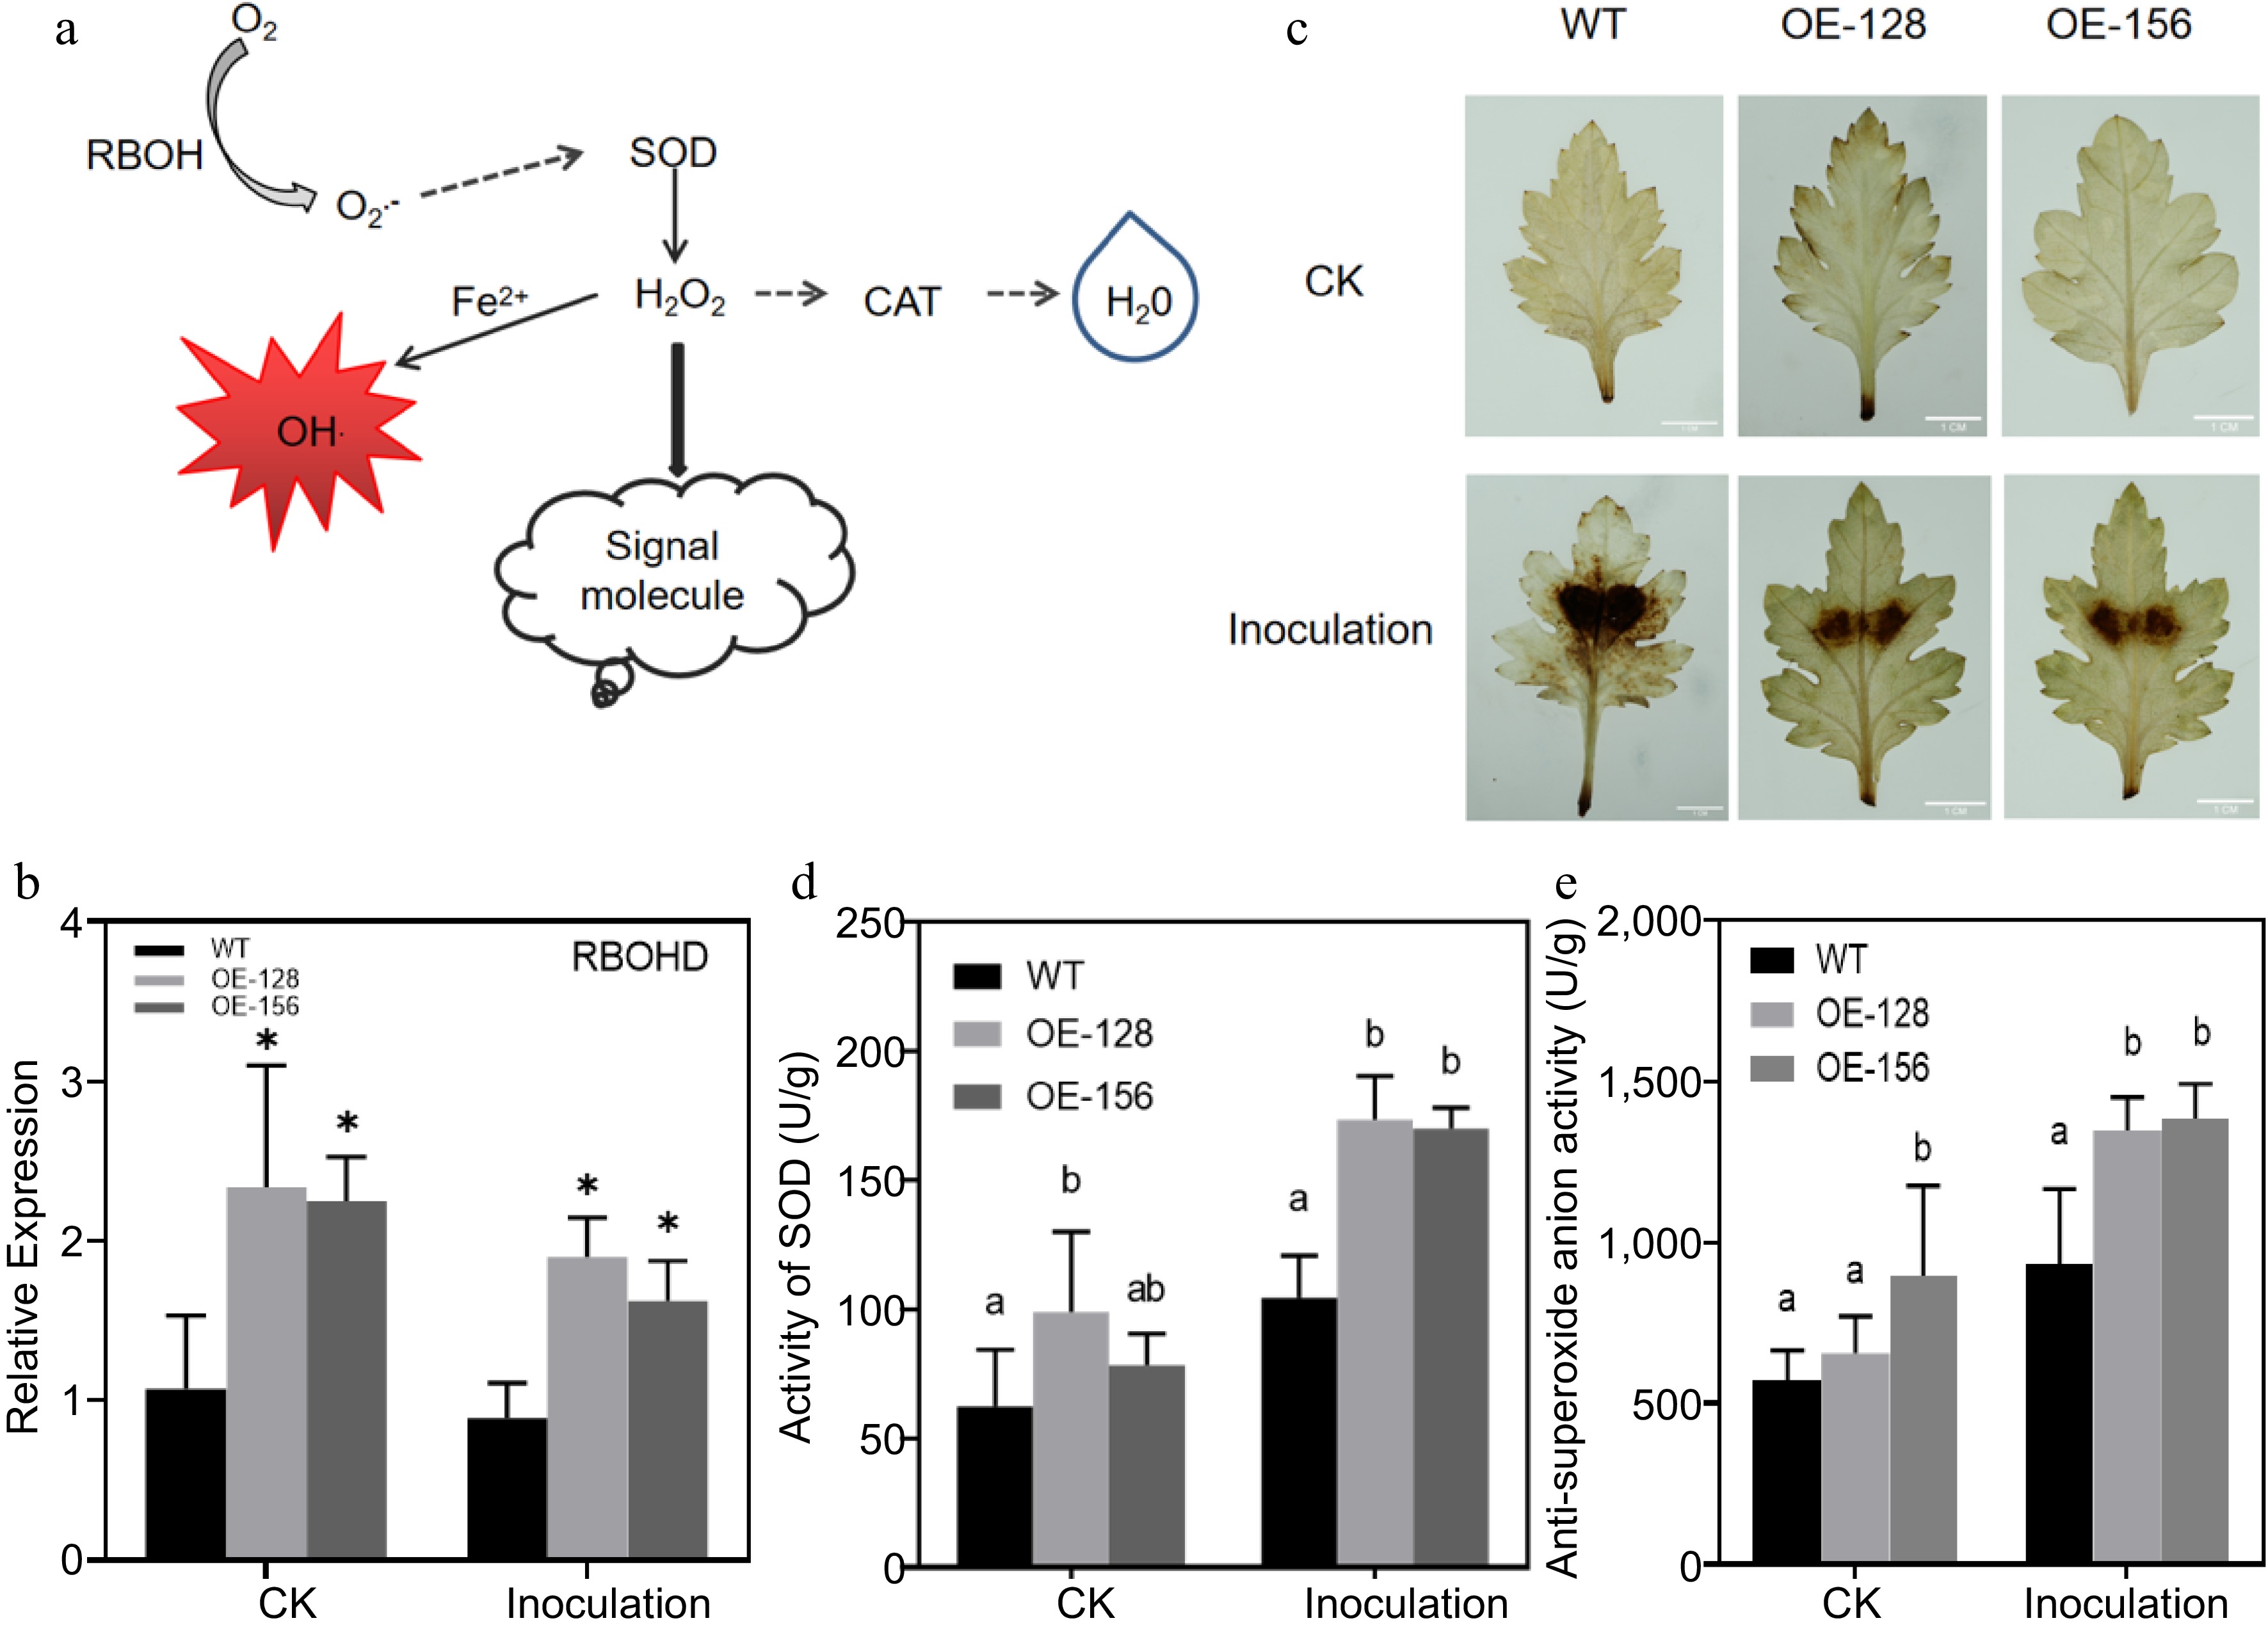
Figure 6.
Analysis of the role of the ROS signaling pathway in Alternaria alternata infection. (a) Simplified diagram of the ROS signal pathway. (b) Quantitative analysis of CmRBOHD between the wild-type (WT) and overexpression strains. (c) Diaminobenzidine staining for the transgenic and WT plants inoculated with A. alternata. (d) Determination of the superoxide dismutase activity in transgenic and WT plants inoculated with A. alternata. (e) Determination of anti-superoxide anion activity for the transgenic and WT plants inoculated with A. alternata. Values represent the mean ± standard error of the mean from three biological replications. Statistical analyses were performed using Duncan's test. Different lowercase letters represent a significant difference between treatments at (p < 0.05).
Figures
(6)
Tables
(0)