-
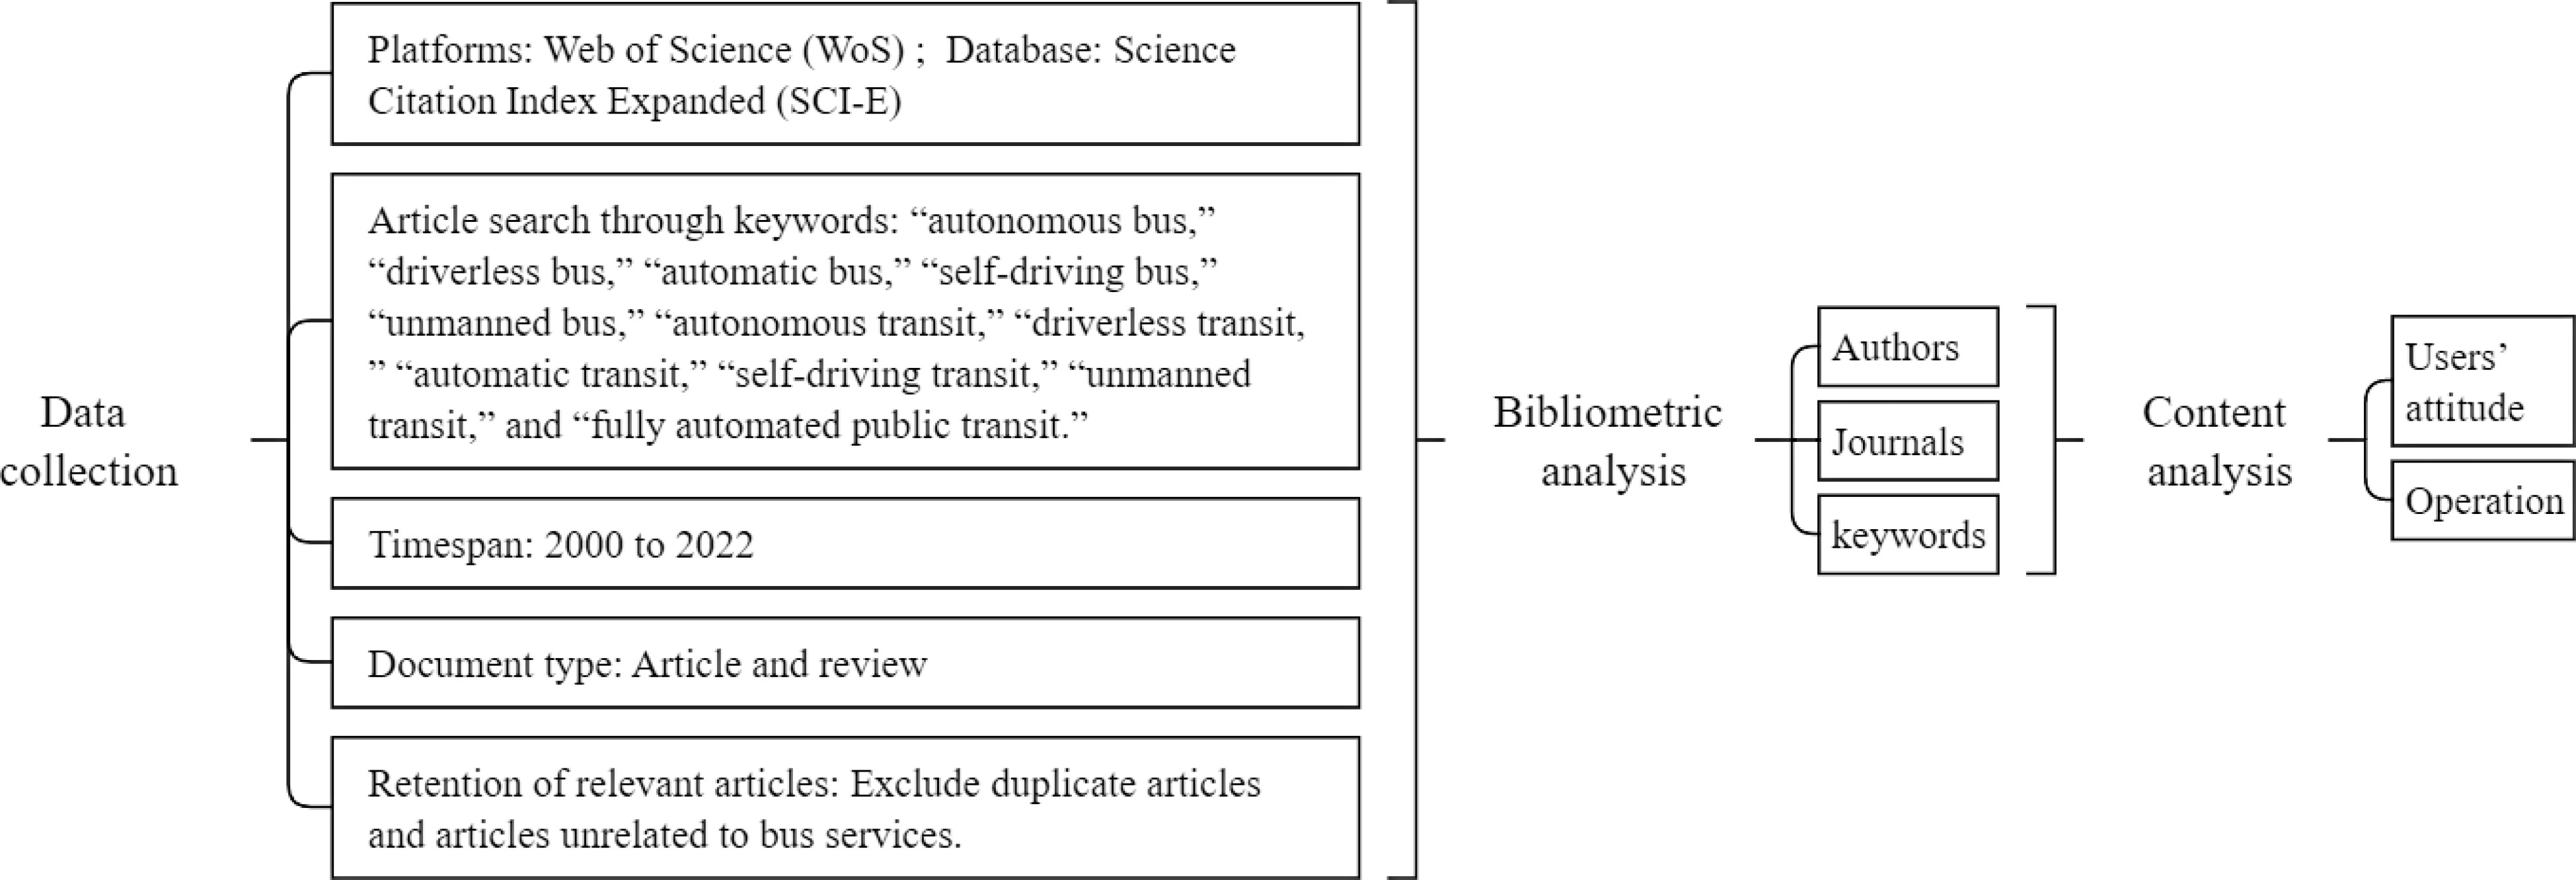
Figure 1.
Flowchart of the literature review.
-
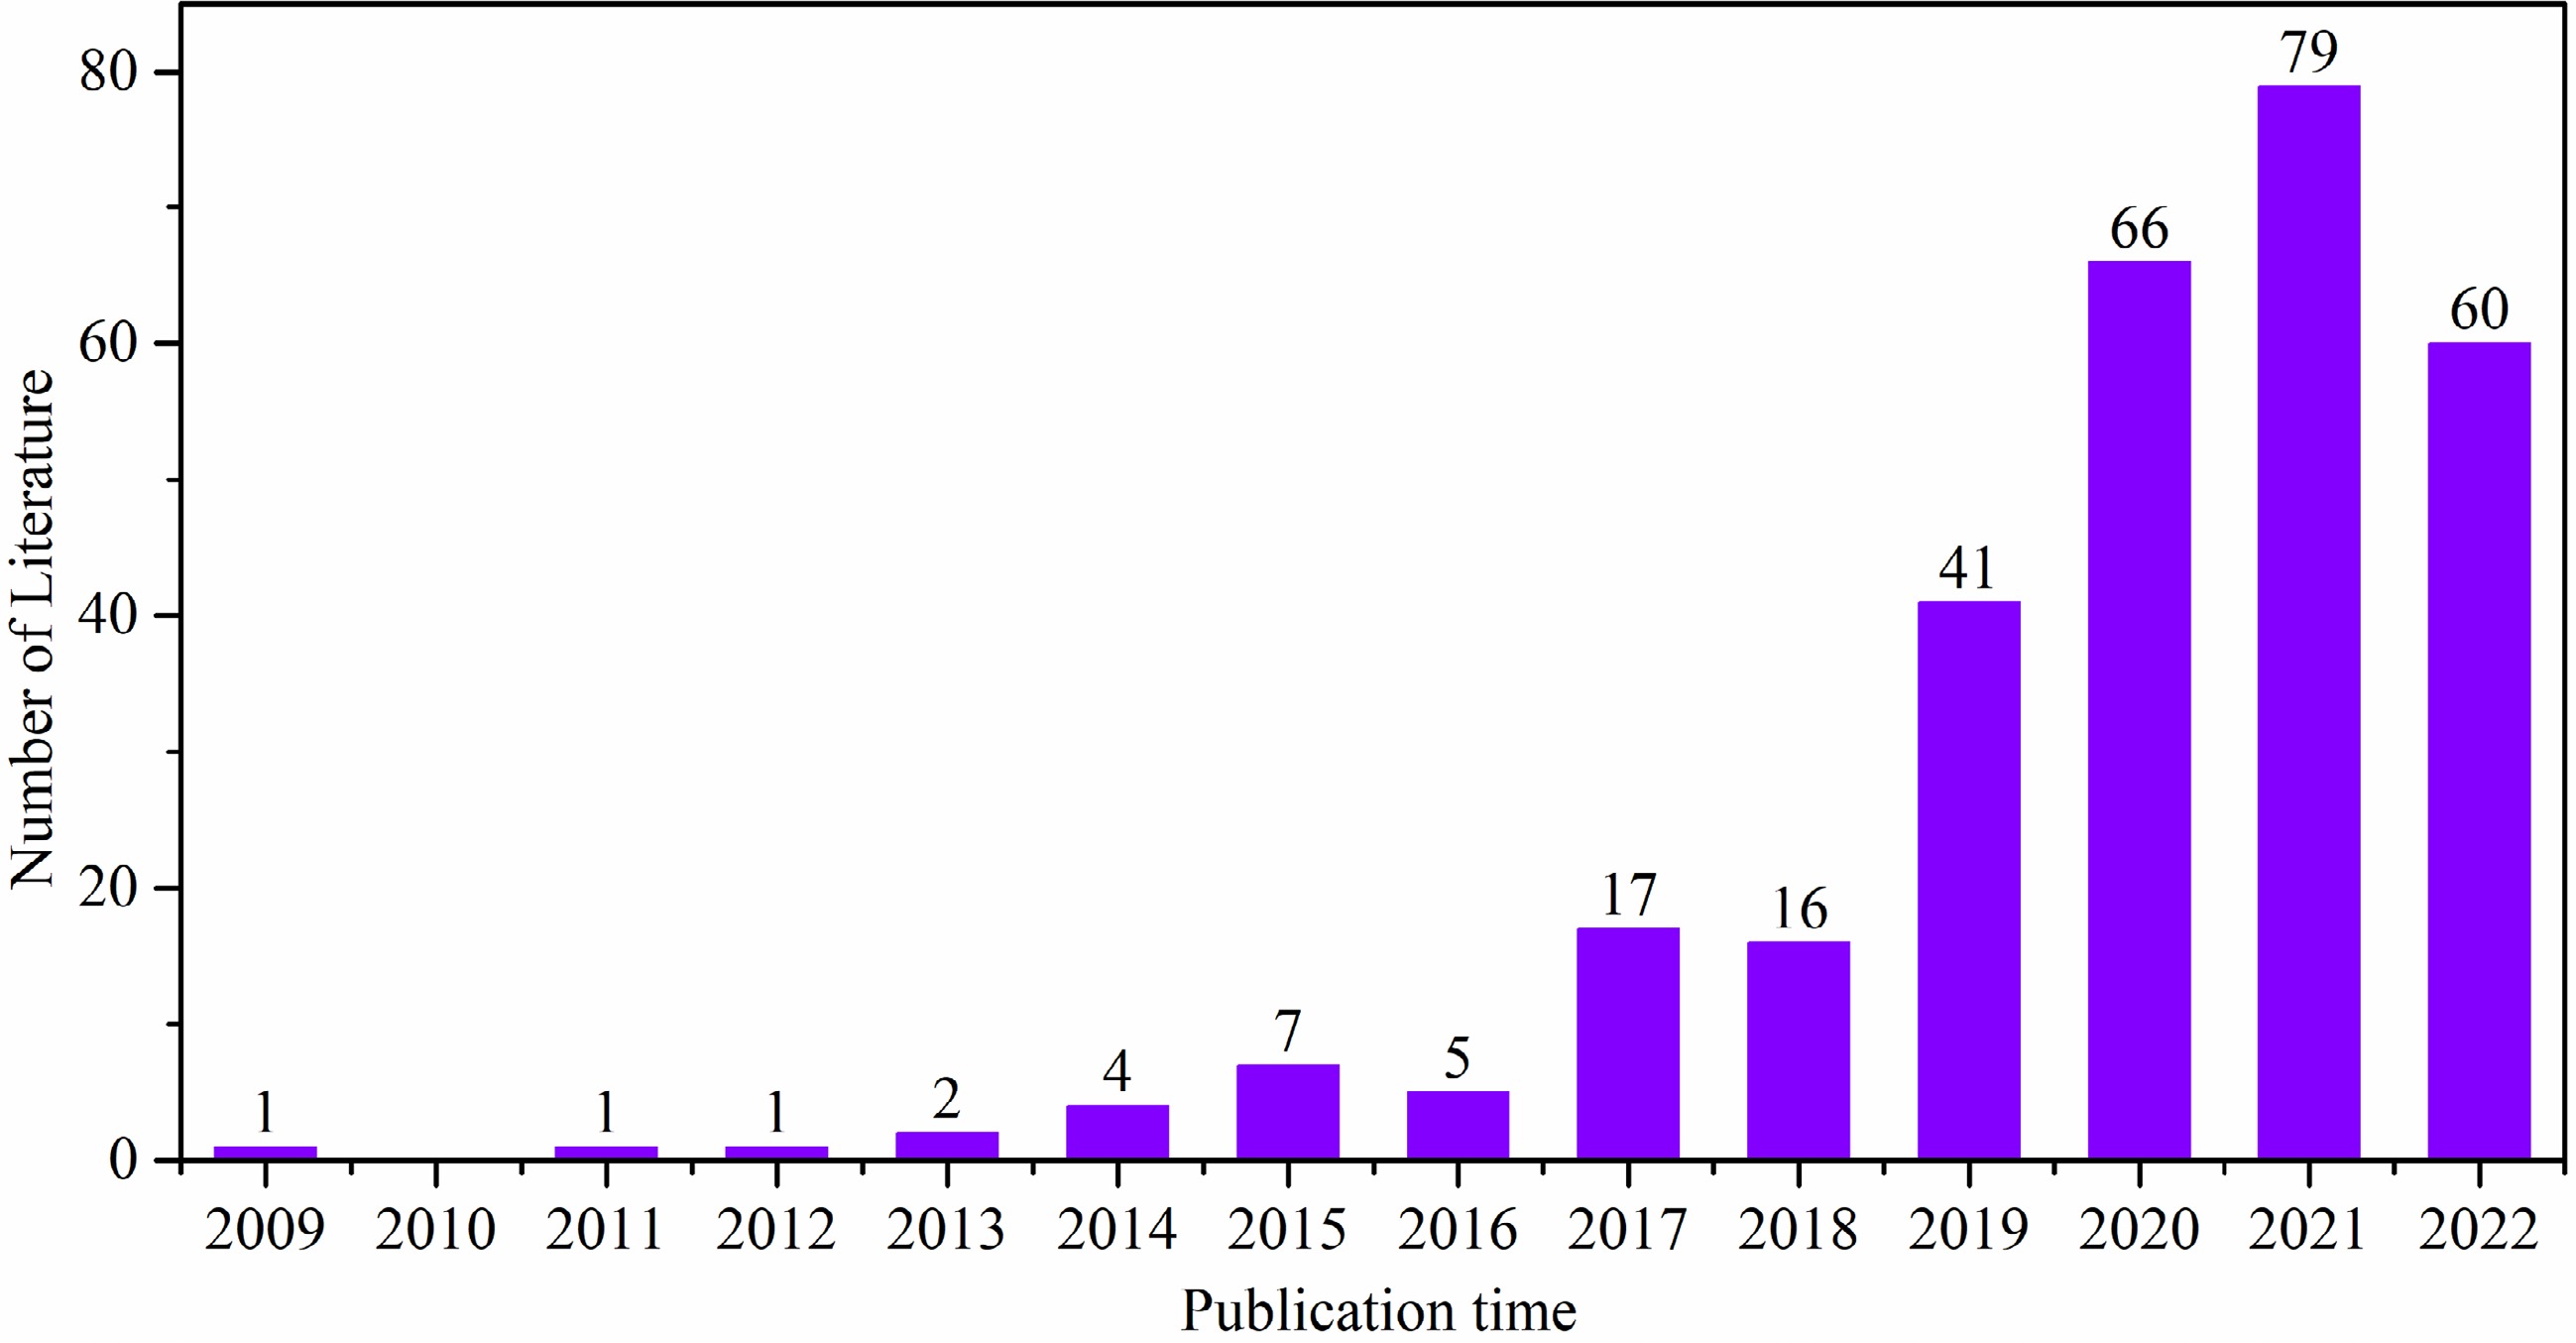
Figure 2.
Overview of obtained bibliographic reference data.
-
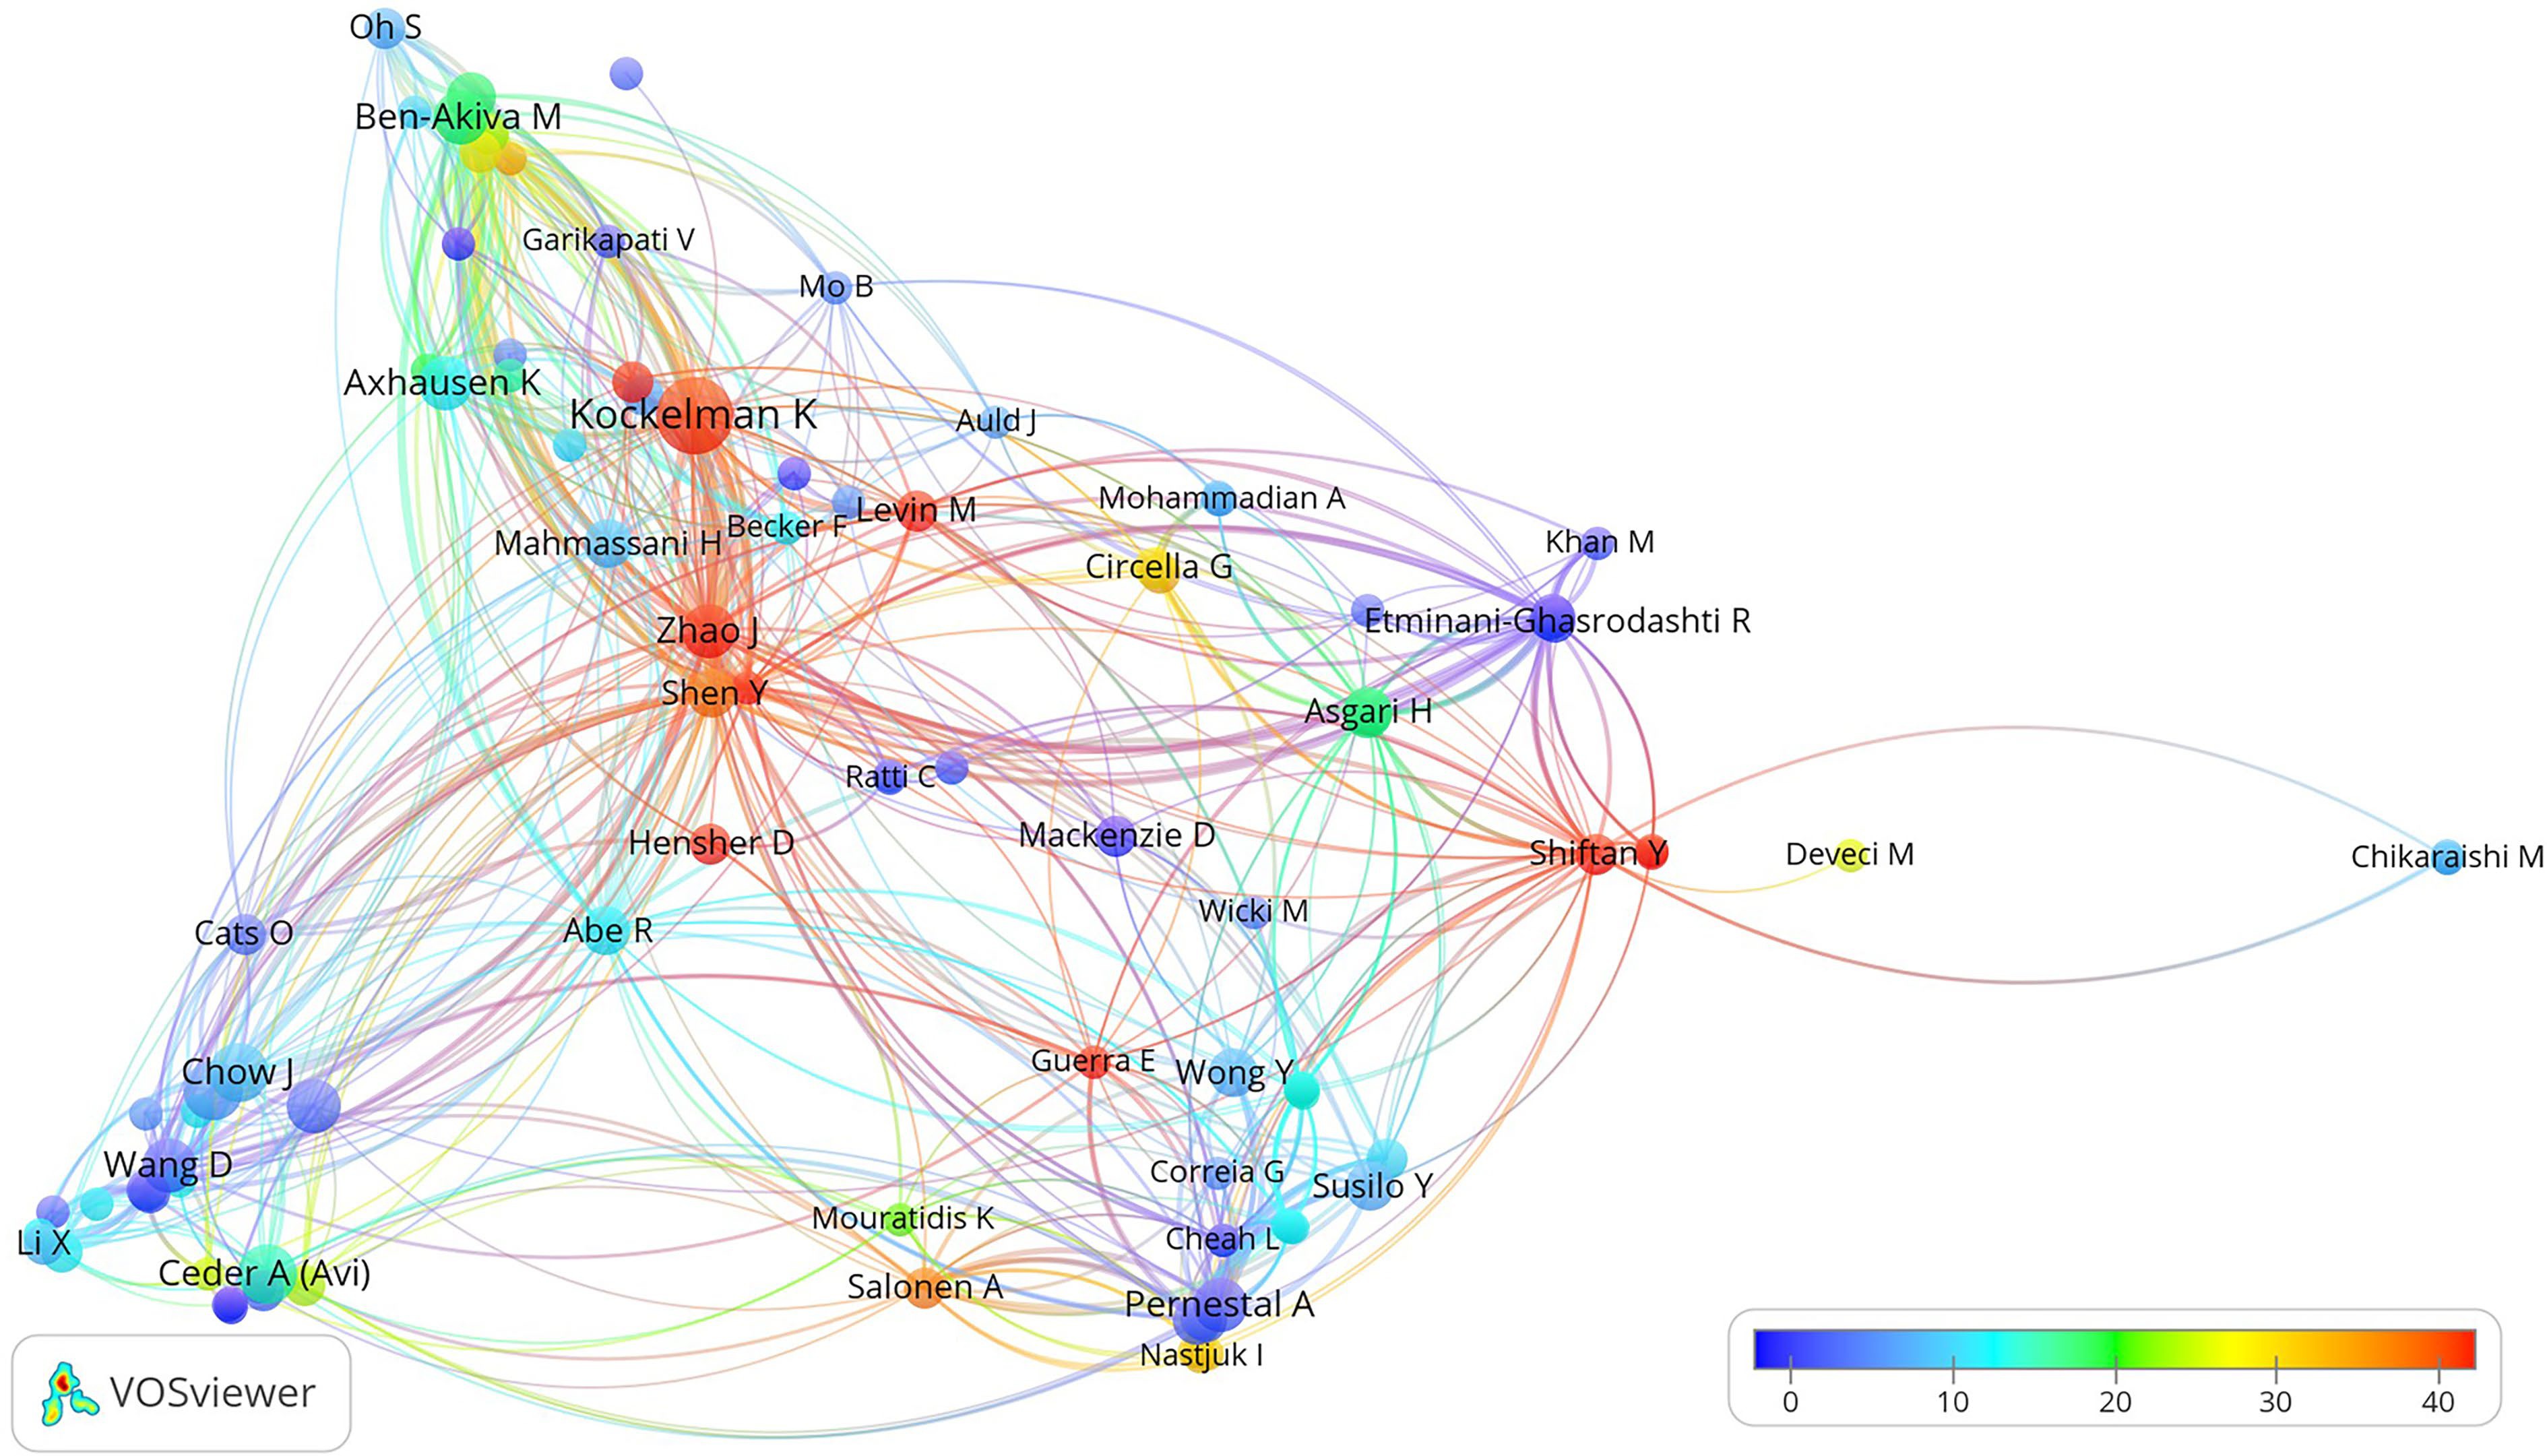
Figure 3.
Relationship among various authors.
-
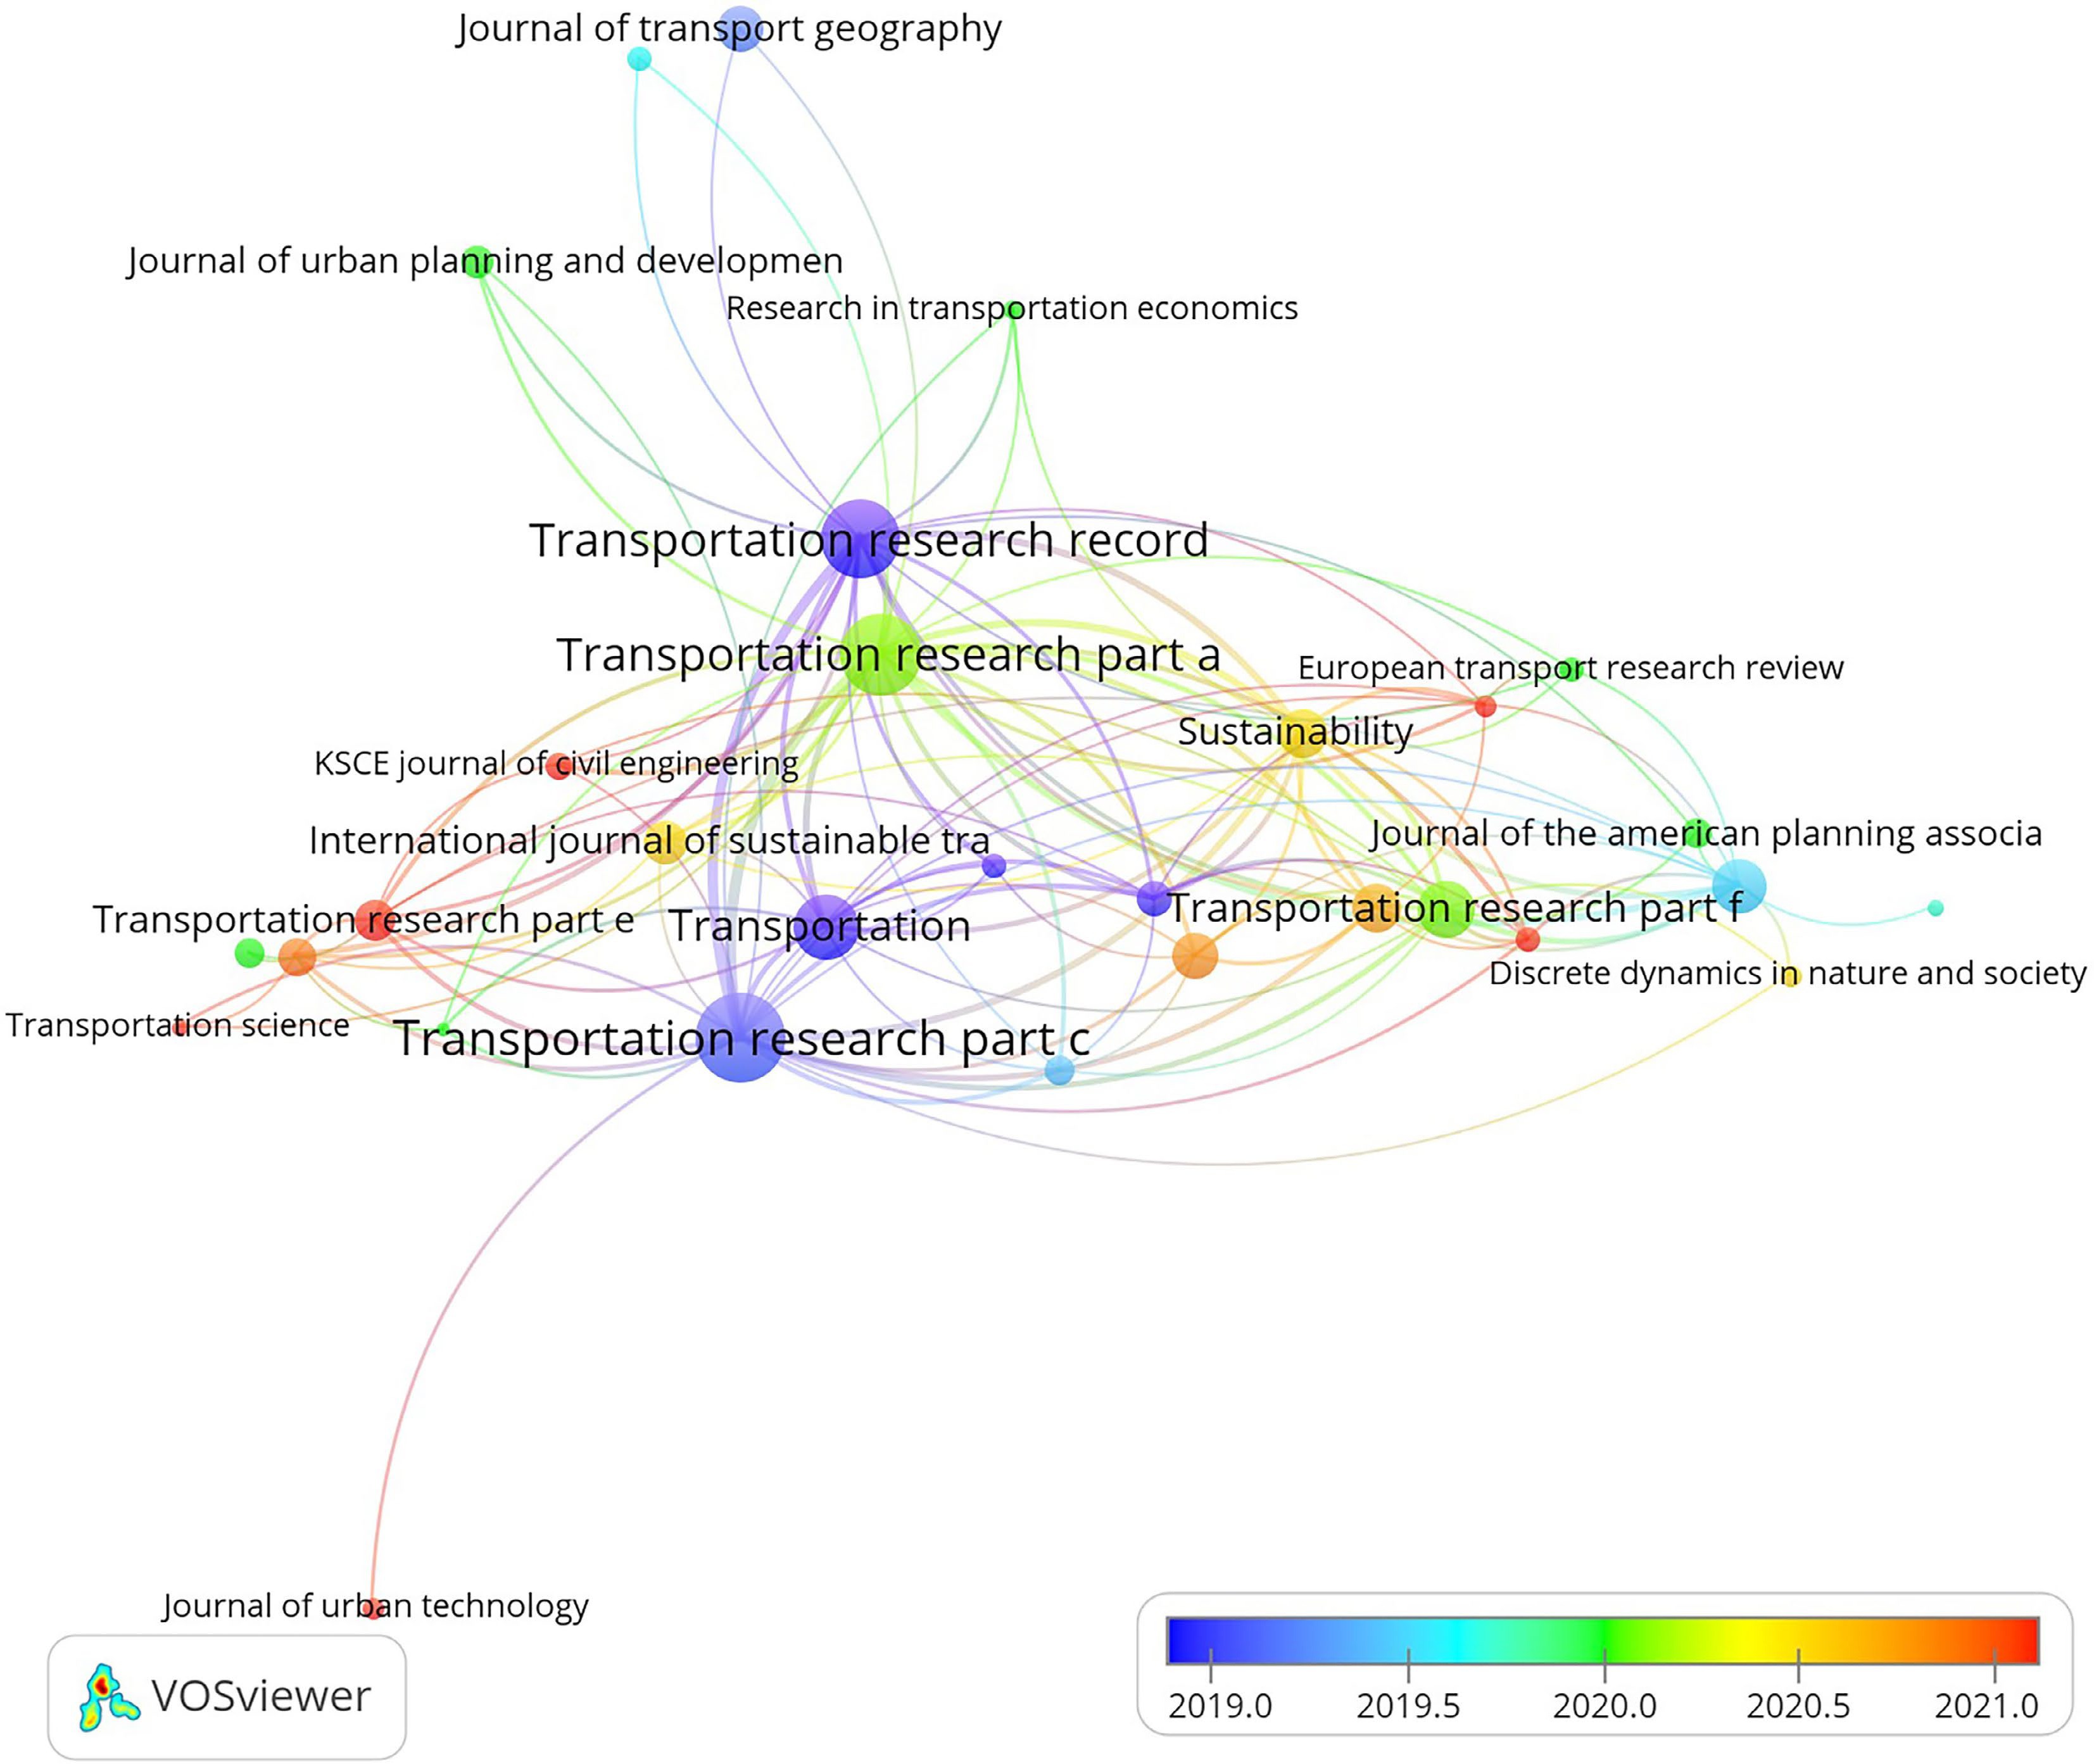
Figure 4.
Connection among various source journals.
-
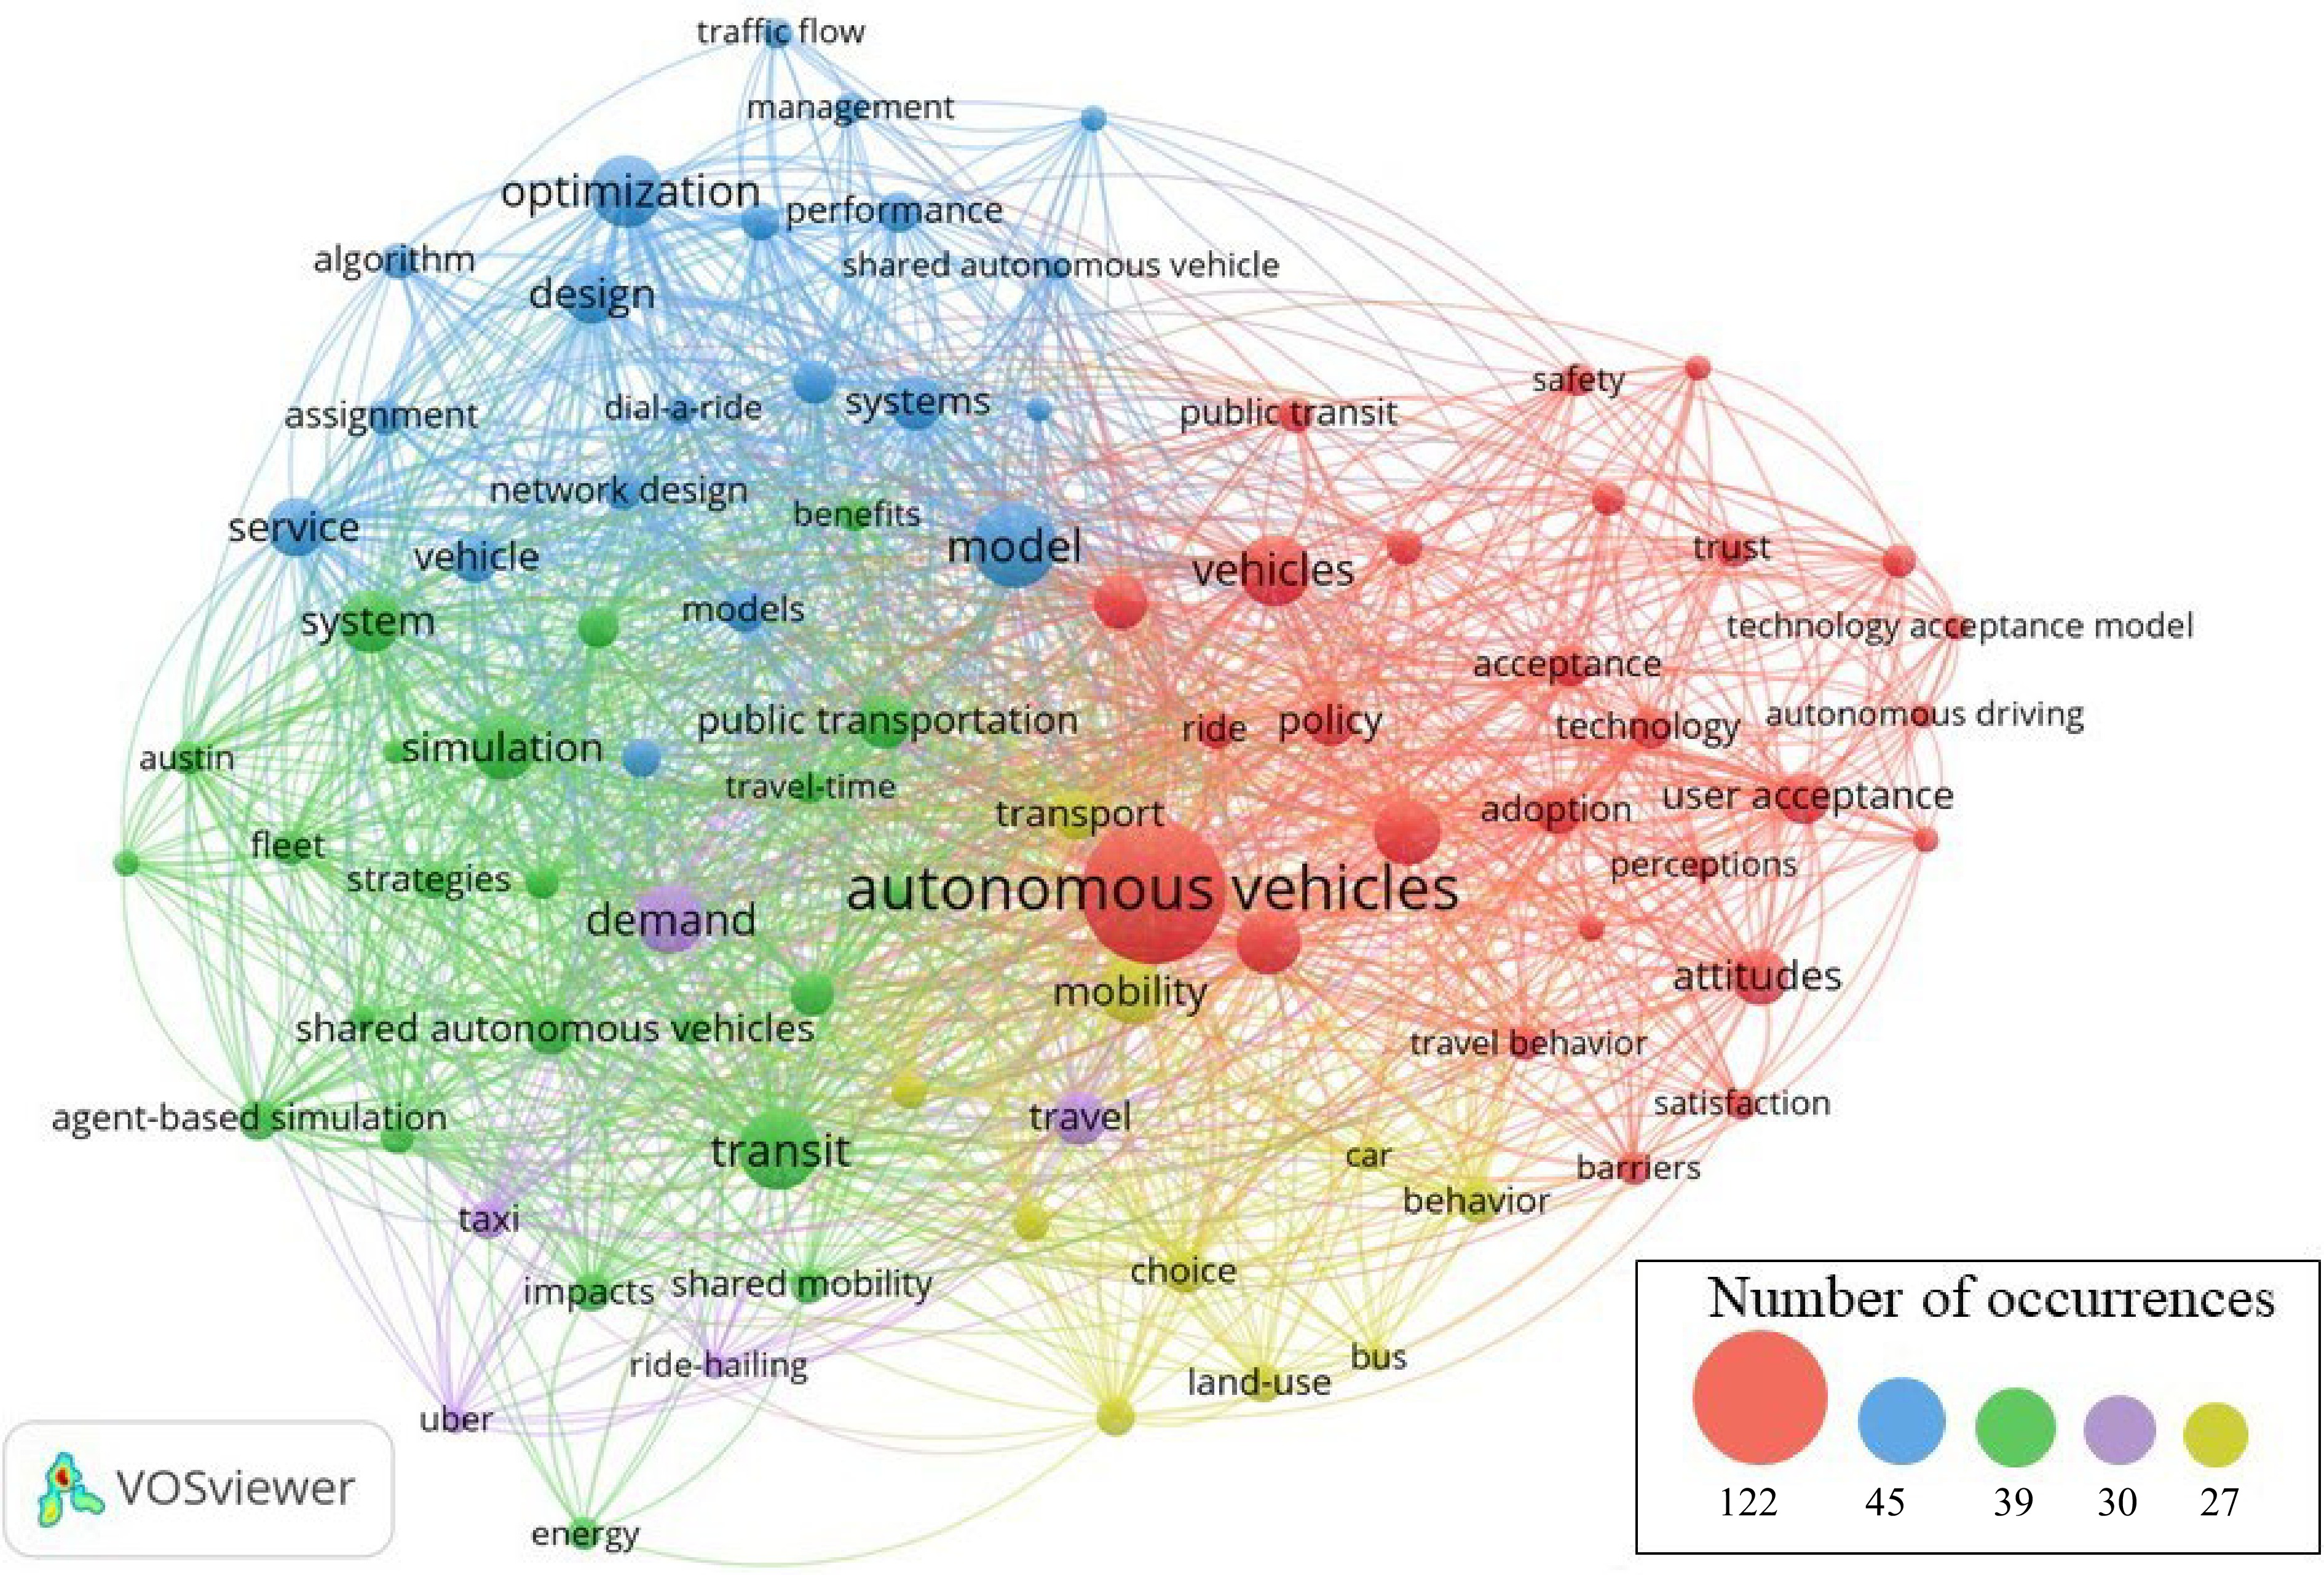
Figure 5.
Co-occurrence of keywords.
-
Rank Author Documents Author Citations 1 Kockelman K. 10 Shiftan Y. 416 2 Ceder A. (Avi) 6 Kockelman K. 389 3 Chow J. 6 Hensher A. 247 4 Jenelius E. 6 Zhao J. 225 5 Axhausen K. 5 Guerra E. 219 6 Ben-Akiva M. 5 Shen Y. 146 7 Pernestal A. 5 Zhang H. 139 8 Rau A. 5 Levin M. 136 9 Wang Z. 5 Acheampong R. 130 10 Zhao J. 5 Cugurullo F. 130 Table 1.
Top-10 authors ranked by total documents and citations.
-
Rank Journal Documents Journal Citations 1 Transportation Research Record 41 Transportation 67.6 2 Transportation Research Part A 32 Journal of Transport Geography 31.0 3 Transportation Research Part C 30 Transportation Research Part C 29.4 4 Sustainability 21 Transportation Research Part A 22.2 5 Journal of Advanced Transportation 12 Transportation Research Part F 21.4 6 Transportation Research Part F 10 Transport Policy 20.9 7 Transport Policy 10 Journal of Urban Planning and Development 20.0 8 Transportation Research Part D-Transport and Environment 9 International Journal of Sustainable Transportation 18.8 9 Cities 8 Transportation Research Record 15.8 10 Research in Transportation Business and Management 7 Transportation Research Part D 14.8 Table 2.
Top-10 journals ranked by total documents and average citations.
-
Category Representative studies Data source Analysis approach Acceptance Alessandrini et al. (2016)[6] Questionnaire interview Copula-based logit Herrenkind et al.(2019)[19] Online questionnaire Structural equation model Roche-Cerasi (2019)[14] Questionnaire interview Descriptive statistics Papadima et al. (2020)[7] Online questionnaire Conjoint analysis Bernhard et al. (2020)[9] Questionnaire interview Descriptive statistics Performance Abe (2019)[4] National trip survey in Japan Descriptive statistics Sun et al. (2020)[12] Questionnaire interview Mixed logit Zhai et al. (2020)[20] Travel demand from Zhejiang Agent-based simulation Badia and Jenelius (2021)[21] Virtual operation data Continuum approximation Kim et al. (2022)[11] 3-year business license data Generalized linear mixed-effect regression Perception Salonen (2018)[13] Questionnaire interview Descriptive statistics Dong et al. (2019)[22] Online questionnaire Mixed logit Kassens-Noor et al. (2020)[15] Questionnaire interview Logistic regression Rosell and Allen (2020)[8] Questionnaire interview Structural equation model Preference Weschke et al. (2021)[23] Questionnaire interview Mixed logit model Mouratidis and Serrano (2021)[24] Questionnaire interview Descriptive statistics Piatkowski (2021)[25] Questionnaire interview Ordered logistic regression Guo et al. (2021)[26] Questionnaire interview Mixed logit model Yan et al. (2022)[10] Questionnaire interview Structural equation model Zhao et al. (2022)[27] Questionnaire interview Structural equation model Guo et al. (2022)[28] Questionnaire interview Structural equation model Table 3.
Summary of literature related to users' attitudes.
-
Vehicle category Operation Objectives Solution approach Representative studies Autonomous bus Timetable Time-space graphical techniques Cao et al. (2019)[29] Timetable and vehicle schedule GA combined with binary variable iteration Cao & Ceder (2019)[30] Timetable Mixed-integer linear program Gkiotsalitis et al. (2022)[31] Emission and energy Simulation model Zhang et al. (2020)[32] Route and recharge
scheduleConstrained program Wang et al. (2021)[33] Dedicated lanes Mixed-integer nonlinear program Zhang et al. (2022)[34] Network Multi-objective optimization Hatzenbühler et al. (2022)[35] Autonomous and
conventional busSchedule and capacity Mixed-integer nonlinear program Dai et al. (2020)[36] Fleet Mixed-integer stochastic program Tian et al. (2021)[37] Deployment Dynamic assignment and simulation model Hatzenbühler et al. (2020)[38] Deployment Bi-level optimization Tian et al. (2022)[39] Semi- and fully-
autonomous busGeneralized cost Mixed-integer nonlinear program Zhang et al. (2019)[40] Modular autonomous bus Fleet Graphical method Liu et al. (2020)[41] Transfer Two-stage model Wu et al. (2021)[42] Vehicle schedule Three-dimensional macroscopic fundamental diagram Dakic et al. (2021)[43] Station location Mixed-integer nonlinear program Tian et al. (2022)[44] Table 4.
Summary of literature related to operations.
Figures
(5)
Tables
(4)