REVIEW   Open Access    

Autonomous bus services: current research status and future recommendations

More Information
  • Implementing autonomous bus services in several cities has garnered substantial research attention worldwide. However, the benefits and challenges of this emerging mode remain insufficiently understood. Consequently, VOSviewer was employed for a bibliometric analysis involving 300 publications, investigating the associations among authors, journals, and keywords. Subsequently, we comprehensively reviewed the current state of research on two topics and proposed future recommendations. Results indicate that the first document related to autonomous bus services was published in 2009. Most user attitude -related research data are obtained via questionnaires and analyzed using statistical techniques. Autonomous bus services are expected to benefit passengers regarding travel time, cost, safety, etc., while passenger preferences are inconsistent. However, integrating the service into existing bus systems requires careful consideration of the schedule sequences. Notably, modular autonomous bus services present a new opportunity for the further optimization of bus services. In future studies, standardized data acquisition procedures should be developed to achieve comparable results. Regarding traveler choice behavior, the effect of specific autonomous bus service policies over time and the heterogeneity due to cultural or social contexts across regions should be assessed. To further promote autonomous bus services, based on fluctuating travel demands, the effects of vehicle capacity, speed, and cost of fleet composition should be evaluated comprehensively to optimize the bus network and schedule sequence. Owing to the protracted nature of the transition from conventional to fully autonomous buses, one should prioritize semi-autonomous bus services. Another essential future research direction is to integrate modular autonomous bus assembly or disassembly strategies with different fine-grained operation optimization techniques in various scenarios.
  • Scale insects (Hemiptera: Coccomorpha) with hypogeic habits are considered of high phytosanitary relevance for coffee crops (Rubiaceae: Coffea spp.) in Colombia[1]. A total of 65 species of scale insects associated with coffee roots have been recorded in Colombia[24]. The most species-rich family is the Pseudococcidae with 28 species distributed in nine genera: Dysmicoccus Ferris, 1950 (13 spp.), followed by Pseudococcus Westwood, 1840 (four spp.), Phenacoccus Cockerell, 1893 (three spp.), Planococcus Ferris, 1950, and Spilococcus Ferris, 1950 (two spp. each), and Chorizococcus McKenzie, 1960, Distichlicoccus Ferris, 1950, Ferrisia Fullaway, 1923, and Paraputo Laing, 1929 (one sp. each). For the family Rhizoecidae, 19 species have been recorded in six genera, namely, Rhizoecus Kunckel d'Herculais, 1878 (13 spp.), Pseudorhizoecus Green, 1933 (two spp.), and Capitisetella Hambleton, 1977, Coccidella Hambleton, 1946, Geococcus Green, 1902, and Ripersiella Tinsley, 1899 (one sp. each). Other minor families include Coccidae and Ortheziidae (five spp. in each family), Xenococcidae (three spp.), and Putoidae and Diaspididae (two spp. in each family) and Margarodidae (one sp.). For this study all previous records were re-analysed with the purpose of providing an accurate list of species

    The taxonomic identification of scale insects by a morphological approach is particularly difficult, mainly for two reasons. First, they are small insects (usually < 5 mm) that require the preparation of slide-mounted specimens. Second, the taxonomic keys needed for morphological identifications are primarily designed for adult female specimens[5]. Differing from other insect orders (e.g., Coleoptera, Diptera and Hymenoptera), female scale insects lack well-defined tagmata, as well as sclerites, sutures, or discernible areas. Characters of taxonomic value in scale insects include cuticular processes, such as pores, ducts and, setae[5]. Recognizing these cuticular structures on such small bodies poses a difficult task for non-expert entomologists. To facilitate accessible identification, this manuscript offers an illustrated taxonomic key to scale insect species associated with coffee roots in Colombia and is aimed at users with basic knowledge of scale insect morphology.

    A careful revision of the specimens studied by Caballero et al.[2], preserved in the Scale Insect Collection at the Entomological Museum 'Universidad Nacional Agronomía Bogota' UNAB (Bogotá, Colombia), was carried out to exclude species that are doubtfully recorded from coffee roots in Colombia. This re-assessment allowed the compilation of an accurate list of species that could be included in the taxonomic key. Additional species and information from Caballero[3] and Caballero et al.[4] also were used for construction of the key. List of species recorded for Colombia and c ollection data of specimens analized are in Supplemmental Table S1 and S2 respectivately.

    The illustrated taxonomic key (Table 1) is based on the external morphology of the adult female with a dichotomous structure. Each couplet after the first one is numbered followed by the number of the preceding couplet in parenthesis, e.g. 12(7) means that couplet 12 is derived from couplet 7; the numbers at the end of the couplet indicate the next couplet in order to arrive at the species name that best matches the character states selected by the user. It is illustrated in most of the steps using microphotographs. Acquisition and analysis of images were done with a Lumenera 1-5C camera and the software Image Pro Insight 8.0. Designs were performed with Affinity Photo V 2.1 and Affinity Designer V 2.1 software. The taxonomic keys were structured with some adaptations of published taxonomic keys[615]. The general morphological terminology follows Kondo & Watson[5] with specific terminology for Coccidae[6,16], Margarodidae[17], Ortheziidae[7], Diaspididae[18], Pseudococcidae, Putoidae[8,9], and Rhizoecidae[10,11]. The abdominal segmentation is given as SabdI for abdominal segment 1 to SabdVIII for abdominal segment 8. All microphotographs are of adult female scale insects or their taxonomically important morphological structures.

    Table 1.  Illustrated taxonomic key.
    No.DetailsRef.
    1Abdominal spiracles present (Fig. 1a)2
    Abdominal spiracles absent (Fig. 1b)7
    Fig. 1 Abdominal spiracles (sp) on margin (a) present on Eurhizococcus colombianus, (b) absent on Distichlicoccus takumasai.
    2(1)Anal aperture without pores and setae (Fig. 2a); legs shorter than half of the transversal diameter of body (Fig. 2b); eyespots and mouthparts absentEurhizococcus colombianus

    Jakubski, 1965
    Anal aperture forming a well-developed anal ring with pores and setae (Fig. 2c); legs longer than transversal diameter of body; eyespots and mouthparts present (Fig. 2d)
    3
    Fig. 2 Eurhizococcus colombianus: (a) Anal aperture without pores and setae in the border, (b) section of mid body showing the length of hind leg (lel) and transversal body line (btl). Insignorthezia insignis: (c) Anal aperture with pores (po) and setae (st), (d) section of head with protruding eyespot (es) and labium (lb).
    3(2)Antennae each with eight segments (Fig. 3a)4
    Antennae each with fewer than five segments (Fig. 3b)5
    Fig. 3 (a) Eight-segmented antenna. (b) Four-segmented antenna.
    4(3)Transversal bands of spines absent in ventral region surrounded by an ovisac band (Fig. 4a); dorsal interantennal area without sclerosis (Fig. 4b)Insignorthezia insignis (Browne, 1887)
    Transversal bands of spine plates present in ventral region surrounded by an ovisac band (Fig. 4c); longitudinal sclerosis on dorsum in interantennal area (Fig. 4d)Praelongorthezia praelonga (Douglas, 1891)
    Fig. 4 Insignorthezia insignis: (a) Abdomen without transversal clusters of wax plates, (b) Dorsal interantennal area without sclerosis. Praelongorthezia praelonga: (c) Abdomen with transversal clusters of wax plates marked by dash lines, (d) dorsal interantennal area with a longitudinal sclerotic plate (ep).
    5(3)Antennae each with three segments (Fig. 5a)Newsteadia andreae Caballero, 2021
    Antennae each with four segments (Fig. 5b)6
    Fig. 5 (a) Three-segmented antenna of Newsteadia andreae. Note the presence of pseudosegmentation which gives the appearance of additional segments in the last antennal segment. (b) Four-segmented antenna of Mixorthezia minima.
    6(5)Dorsal area anterior to anal ring with simple pores on protuberances (Fig. 6a); ventral areas surrounding each coxa with a row of wax plate spines (Fig. 6b)Mixorthezia minima Koczné Benedicty & Kozár, 2004
    Dorsal area anterior to anal ring without simple pores or protuberances (Fig. 6c); ventral areas posterior to each coxa without wax plate spines (Fig. 6d)Mixorthezia neotropicalis (Silvestri, 1924)
    Fig. 6 Mixorthezia minima: (a) Dorsum of area anterior to anal ring with close-up of simple pores on protuberances (dash box); (b) ventral area posterior to each coxa with a row of wax plate spines (dash box). Mixorthezia neotropicalis: (c) Close-up of dorsum of area anterior to anal ring lacking simple pores on protuberances (dash box); (d) ventral area posterior to each coxa without associated wax plate spines.
    7(1)Anal plates present (Fig. 7a)8
    Anal plates absent (Fig. 7b)12
    Fig. 7 (a) Anal apparatus of Saissetia coffeae with anal plates (ap) covering the anal aperture (aa). (b) Anal apparatus of Pseudococcus sp. with anal aperture lacking anal plates.
    8(7)Antennae and legs with length similar to or shorter than spiracles (Fig. 8a)9
    Antennae and legs with length at least twice as long as spiracles (Fig. 8b)11
    Fig. 8 (a) Antenna (an) and foreleg (lg) (green lines), and anterior spiracle (sp) (yellow line) of Toumeyella coffeae showing their relative length. Note the similar size of the limbs and spiracle. (b) Antenna (an) and leg (lg) (green lines), and anterior spiracle (sp) (yellow line) of Coccus viridis showing their relative length. Note the relatively smaller size of the spiracle.
    9(8)Ventral tubular macroducts present (Fig. 9)Toumeyella coffeae
    Kondo, 2013
    Ventral tubular macroducts absent10
    Fig. 9 Ventral tubular macroducts (dash box) and close-up of macroducts (photo on right side).
    10(9)Orbicular pores (Fig. 10a) and cribriform platelets present (Fig. 10b); dorsal setae absent; opercular pores absentCryptostigma urichi (Cockerell, 1894)
    Orbicular pores and cribriform platelets absent; dorsal setae present (Fig. 10c); numerous opercular pores present throughout mid areas of dorsum (Fig. 10d)Akermes colombiensis Kondo & Williams, 2004
    Fig. 10 Cryptostigma urichi: (a) Orbicular pore and (b) close-up of a cribriform platelet. Akermes colombiensis: (c) Close-up of a dorsal body setae (dash box) and (d) close-up of opercular pores (arrows).
    11(8)Band of ventral tubular ducts in lateral and submarginal regions absent, ventral tubular ducts of one type; anal plates without discal setae (Fig. 11a); dorsal body setae capitate or clavate (Fig. 11b); perivulvar pores with seven or eight loculi, rarely with 10 loculi (Fig. 11c)Coccus viridis
    (Green, 1889)
    Band of ventral tubular ducts in lateral and submarginal regions present, submarginal region with two types of tubular ducts (Fig. 11d); anal plates with discal setae (Fig. 11e); dorsal body setae spine-like, apically pointed (Fig. 11f); perivulvar pores mostly with 10 loculi (Fig. 11g)Saissetia coffeae
    (Walker, 1852)
    Fig. 11 Coccus viridis: (a) Anal plates without discal setae; (b) dorsal body setae capitate (top) or clavate (below); (c) multilocular disc pores mostly with eight loculi. Saissetia coffeae: (d) Ventral submarginal region with two types of tubular ducts; (e) each anal plate with a discal seta; (f) dorsal body setae acute; (g) multilocular disc pores with mostly 10 loculi.
    12(7)Cerarii present on body margin, at least a pair on each anal lobe (Fig. 12a)13
    Cerarii absent on body margin (Fig. 12b)38
    Fig. 12 Abdominal body margin of (a) Pseudococcus sp. with three cerarii (dash box) and (b) Rhizoecus sp. (dash box) without cerarii.
    13(12)Enlarged oral collar tubular ducts composed of a sclerotized area surrounding the border and a set of flagellated setae (Ferrisia-type oral collar tubular ducts) (Fig. 13a)Ferrisia uzinuri
    Kaydan & Gullan, 2012
    Oral collar tubular ducts simple, not as above (Fig. 13b) or absent14
    Fig. 13 (a) Ferrisia-type oral collar tubular ducts with aperture of tubular duct (ad) surrounded by a sclerotized area (sa) and associated flagellate setae (fs). (b) Oral collar tubular ducts simple (arrows).
    14(12)Antenna with nine segments (Fig. 14a)15
    Antenna with eight segments (Fig. 14b) or fewer (Fig. 14c)19
    Fig. 14 Antenna with (a) nine segments, (b) eight segments and (c) seven segments.
    15(14)Cerarii with more than five conical setae (Fig. 15a); hind trochanter with six sensilla, three on each surface (Fig. 15b)16
    Cerarii with two lanceolate setae (Fig. 15c); hind trochanter with four sensilla, two on each surface (Fig. 15d)17
    Fig. 15 Puto barberi: (a) upper and lateral view of a cerarius, (b) close-up of the surface of trochanter with three sensilla (arrows). Phenacoccus sisalanus: (c) cerarius, (d) trochanter with two sensilla (arrows) on single surface.
    16(15)Cerarii with tubular ducts (Fig. 16a)Puto antioquensis
    (Murillo, 1931)
    Cerarii without tubular ducts (Fig. 16b)Puto barberi
    (Cockerell, 1895)
    Fig. 16 (a) Cerarius associated with tubular ducts (arrows). (b) Cerarius without tubular ducts.
    17(15)Oral collar tubular ducts absentPhenacoccus sisalanus Granara de Willink, 2007
    Oral collar tubular ducts present, at least on venter (Fig. 17)18
    Fig. 17 Ventral surface with oral collar tubular ducts (dash circles).
    18(17)Oral collar tubular ducts restricted to venterPhenacoccus solani
    Ferris, 1918
    Oral collar tubular ducts present on dorsum and venterPhenacoccus parvus Morrison, 1924
    19(14)Oral rim tubular ducts present (Fig. 18)20
    Oral rim tubular ducts absent26
    Fig. 18 Oral rim tubular ducts in upper view (dash circles) and close-up of lateral view.
    20(19)Oral rim tubular ducts present on venter onlyPseudococcus landoi (Balachowsky, 1959)
    Oral rim tubular ducts present on both dorsum and venter21
    21(20)Cerarii restricted to anal lobes (Fig. 19a)Chorizococcus caribaeus Williams & Granara de Willink, 1992
    Cerarii present, at least on the last five abdominal segments (Fig. 19b)22
    Fig. 19 Location of cerarii (dash boxes) on abdominal margin with close-up of cerarius (a) restricted to anal lobes (dash boxes) and (b) cerarii present on the last five abdominal segments.
    22(21)Circulus absent (Fig. 20a)23
    Circulus present (Fig. 20b)24
    Fig. 20 Ventral mid area of abdominal segments III and IV (dash box) of (a) Distichlicoccus takumasai without circulus and (b) Pseudococcus jackbeardsleyi with circulus.
    23(22)Multilocular disc pores present on venter of SabdIV and posterior segments (Fig. 21a); hind coxa with translucent pores and hind femur without translucent pores (Fig. 21b)Spilococcus pressus
    Ferris, 1950
    Multilocular disc pores absent, if some present, not more than three around vulvar opening (i.e. venter of SabdVII or SabdVIII); hind coxa without translucent pores (Fig. 21c) and hind femur with translucent pores (Fig. 21d)Distichlicoccus takumasai Caballero, 2021
    Fig. 21 Spilococcus pressus: (a) Ventral section of abdomen with multilocular disc pores (arrows); (b) hind leg with close-up of coxa with translucent pores (arrows). Distichlicoccus takumasai: (c) Hind coxa without translucent pores; (d) hind femur with translucent pores (arrows).
    24(22)Eyes without discoidal pores nor sclerotized surrounding area (Fig. 22a); circulus with transversal diameter 40 to
    60 µm (Fig. 22b)
    Pseudococcus luciae Caballero, 2021
    Eyes with discoidal pores and sclerotized surrounding area (Fig. 22c); circulus diameter 100 to 200 µm (Fig. 22d)26
    25(24)Oral rim tubular ducts on dorsal abdominal segments numbering three to eight; area between posterior ostiole and cerarius of SabdVII without oral rim tubular ducts (Fig. 23a)Pseudococcus elisae Borchsenius, 1947
    Oral rim tubular ducts on dorsal abdominal segments numbering 14 to 27; area between posterior ostiole and cerarius of SabdVII with an oral rim tubular duct (Fig. 23b)Pseudococcus jackbeardsleyi Gimpel & Miller, 1996
    Fig. 22 Pseudococcus luciae: (a) Eyespot without surrounding sclerotized area nor associated pores; (b) circulus ca. 58 µm wide. Pseudococcus jackbeardsleyi: (a) Eyespot with sclerotized area (sa) and associated pores (po); (d) circulus ca. 154 µm wide.
    Fig. 23 (a) Dorsal margin of abdominal segments VI to VIII, between cerarius of anal lobe (C1), cerarius of SabdVII (C2) and posterior ostiole (os) without oral rim tubular ducts. (b) Dorsal margin of abdominal segments VI to VIII, between cerarius of anal lobe (C1), cerarius of SabdVII (C2) and posterior ostiole (os) with an oral rim tubular duct and/or cerarius adjacent to SabdVII.
    26(19)Oral collar tubular ducts (Fig. 24) on both dorsum and venter27
    Oral collar tubular ducts restricted to venter28
    Fig. 24 Oral collar tubular duct in lateral view.
    27(26)Hind coxa with translucent pores (Fig. 25a); anal lobe with sclerotized bar, not on a sclerotized area (Fig. 25b); multilocular disc pores present posterior to fore coxaPlanococcus citri-minor complex
    Hind coxa without translucent pores (Fig. 25c); anal lobe without sclerotized bar, on a sclerotized area (Fig. 25d); multilocular disc pores absent posterior to fore coxaDysmicoccus quercicolus (Ferris, 1918)
    28(27)Oral collar tubular ducts absent on venter of both head and thorax.29
    Oral collar tubular ducts present on either head or thorax, but not on both areas (Fig. 26)30
    Fig. 25 Planococcus citri-minor complex: (a) Hind coxa with translucent pores (dash box) and (b) anal lobe with a sclerotization forming a bar (ab). Dysmicoccus quercicolus: (c) Hind coxa without translucent pores and (d) anal lobe with irregular broad sclerotized area (sa).
    Fig. 26 Marginal area of Dysmicoccus grassii, lateral to posterior spiracle (ps), with close-up of oral collar tubular ducts (oc) (left side).
    29(28)Translucent pores present on hind coxa, trochanter, femur and tibia (Fig. 27a); marginal clusters of oral collar tubular ducts on venter of SabdVI and SabdVIIDysmicoccus caribensis Granara de Willink, 2009
    Translucent pores restricted to hind femur and tibia (Fig. 27b); marginal clusters of oral collar tubular ducts present on venter of SabdIV to SabdVIIParaputo nasai
    Caballero, 2021
    Fig. 27 (a) Hind leg of Dysmicoccus caribensis with translucent pores on coxa (cx), trochanter (tr) and femur (fm), and tibia (tb). (b) Hind leg of Paraputo nasai with translucent pores restricted to femur (fm) and tibia (tb).
    30(28)Hind coxa with translucent pores (Fig. 28a)Dysmicoccus sylvarum
    Williams & Granara de Willink, 1992
    Hind coxa without translucent pores (Fig. 28b)31
    Fig. 28 (a) Translucent pores on hind coxa. (b) Translucent pores absent on hind coxa.
    31(30)Hind trochanter with translucent pores (Fig. 29a)Dysmicoccus varius
    Granara de Willink, 2009
    Hind trochanter without translucent pores (Fig. 29b)32
    Fig. 29 Translucent pores (a) on hind trochanter, (b) absent from hind trochanter.
    32(31)Oral collar tubular ducts present on margin of thorax (Fig. 30)33
    Oral collar tubular ducts absent from margin of thorax34
    Fig. 30 Prothorax margin of Dysmicoccus grassii with close-up of oral collar tubular ducts.
    33(32)Multilocular disc pores absent on SabdV; dorsal area immediately anterior to anal ring with tuft of flagellate setae; longest flagellate seta as long as diameter of anal ring (Fig. 31a), and discoidal pores larger than trilocular pores (Fig. 31b)Dysmicoccus radicis
    (Green, 1933)
    Multilocular disc pores present on SabdV; dorsal area immediately anterior to anal ring without a tuft of flagellate setae; flagellate setae much shorter than diameter of anal ring (Fig. 31c) and discoidal pores smaller than trilocular pores (Fig. 31d)Dysmicoccus grassii (Leonardi, 1913)
    34(32)Oral collar tubular ducts absent in interantennal area35
    Oral collar tubular ducts present in interantennal area (Fig. 32)36
    35(34)Translucent pores on hind leg restricted to tibia (Fig. 33a)Dysmicoccus perotensis
    Granara de Willink, 2009
    Translucent pores on hind leg present on tibia and femur (Fig. 33b)Dysmicoccus joannesiae-neobrevipes complex
    Fig. 31 Dysmicoccus radicis: (a) Area anterior to anal ring with a cluster of flagellate setae (fs) and anal ring (ar) showing the diameter of the different pores (dash box); (b) discoidal pores (dp) and trilocular pores (tp). Dysmicoccus grassii: (c) Area anterior to anal ring with scattered short flagellate setae (fs) contrasted with anal ring (ar) diameter (dash box); (d) discoidal pores (dp) and trilocular pores (tp) with similar diameter.
    Fig. 32 Interantennal area (dash box) of Dysmicoccus brevipes with close-up of oral collar tubular ducts.
    Fig. 33 (a) Hind leg of Dysmicoccus perotensis with close-up of femur and tibia with translucent pores on tibia only (arrows). (b) Hind leg of Dysmicoccus joannesiae-neobrevipes complex with close-up of femur and tibia with translucent pores (arrows).
    36(34)Hind coxa with translucent pores (see Fig. 28a)Dysmicoccus mackenziei
    Beardsleyi, 1965
    Hind coxa without translucent pores (see Fig. 28b)37
    37(36)Dorsal SabdVIII setae forming a tuft-like group, each seta conspicuously longer than remaining dorsal abdominal setae (Fig. 34a) and setal length similar to anal ring diameter (60–80 µm long)Dysmicoccus brevipes (Cockerell, 1893)
    Dorsal SabdVIII setae evenly distributed, each setae as long as remaining dorsal abdominal setae (Fig. 34b) and length less than half diameter of anal ringDysmicoccus texensis-neobrevipes complex
    38(12)Tritubular ducts absent39
    Tritubular ducts present (Fig. 35a-b)46
    Fig. 34 (a) Abdomen of Dysmicoccus brevipes with dorsal setae on SabdVIII (lfs) longer than setae on anterior segments (sfs). (b) Abdomen of Dysmicoccus texensis-neobrevipes complex with dorsal setae (ufs) along the abdominal segments of uniform length and scattered distribution.
    Fig. 35 (a) Tritubular duct in upper (left) and lateral view (right) with the border of the cuticular ring attached to tubules. (b) Tritubular duct with the border of the cuticular ring widely separated from tubules (arrows).
    39(38)Anal lobes strongly protruded, bulbiform (Fig. 36a) jutting out from margin for a distance equivalent to diameter of anal ring40
    Anal lobes shallow, if protruded, their length never more than half of diameter of anal ring (Fig. 36b)42
    Fig. 36 (a) Abdomen of Neochavesia caldasiae with anal lobes (al) protruding beyond the anal aperture (aa). (b) Abdomen of Ripersiella sp. with anal lobes (al) at the same level as the anal aperture (aa).
    40(39)Anal aperture located at the same level as the base of anal lobes (Fig. 37a); antennae located on ventral margin of headNeochavesia caldasiae (Balachowsky, 1957)
    Anal aperture located anterior to bases of anal lobes (Fig. 37b); antennae located on dorsum of head41
    Fig. 37 (a) Abdomen of Neochavesia caldasiae with anal aperture (aa) positioned between the anal lobes (al), at the same level as the bases of anal lobes (dash line). (b) Abdomen of Neochavesia eversi with anal aperture (aa) situated anterior to the bases of the anal lobes (al) (dash line).
    41(40)Antennae each with five segments, situated on a membranous base (Fig. 38a); length of hind claw less than length of hind tarsus (Fig. 38b)Neochavesia trinidadensis (Beardsley, 1970)
    Antennae each with four segments, situated on a sclerotized base (Fig. 38c); hind claw longer than hind tarsus (Fig. 38d)Neochavesia eversi (Beardsley, 1970)
    Fig. 38 (a) Antenna with four segments and a membranous base (mb). (b) Hind tarsus (green line) longer than the hind claw (red line). (c) Antenna with four segments and a sclerotized base (sb). (d) Hind tarsus (green line) shorter than hind claw (red line).
    42(39)Body setae capitate, at least on one surface (Fig. 39a)43
    Body setae never capitate (Fig. 39b)44
    Fig. 39 (a) Capitate setae. (b) Flagellate setae.
    43(42)Anal aperture without associated cells (Fig. 40a); three-segmented antennae (Fig. 40b); ventral setae in median
    and submedian regions capitate
    Capitisitella migrans
    (Green, 1933)
    Anal aperture surrounded by cells (Fig. 40c); six-segmented antennae (Fig. 40d); ventral setae in medial and submedial regions flagellateWilliamsrhizoecus coffeae
    Caballero & Ramos, 2018
    44(42)Three-segmented antennae (Fig. 41a); circulus present (Fig. 41b)Pseudorhizoecus bari
    Caballero & Ramos, 2018
    Five-segmented antennae (Fig. 41c); circulus absent45
    Fig. 40 Capitisitella migrans: (a) Anal aperture of surrounded only by setae; (b) antenna composed of three segments. Williamsrhizoecus coffeae: (c) Anal aperture of surrounded by setae and cells (flesh); (d) antenna composed of six segments.
    Fig. 41 Pseudorhizoecus bari: (a) Antenna composed of three segments and (b) circulus. (c) Antenna of Pseudorhizoecus proximus composed of five segments.
    45(44)Multilocular disc pores absent; anal aperture ornamented with small protuberances and two to five short setae, each seta never longer than 1/3 diameter of anal aperture, without cells (Fig. 42a)Pseudorhizoecus proximus
    Green, 1933
    Multilocular disc pores present (Fig. 42b); anal aperture not ornamented with small protruberances, ring with well-developed cells and six long setae, each seta as long as diameter of anal ring (Fig. 42c)Ripersiella andensis (Hambleton,
    1946)
    Fig. 42 (a) Anal aperture of Pseudorhizoecus proximus surrounded by protuberances (pr) and a few short setae (st). Ripersiella andensis: (b) Ventral section of abdomen with multilocular disc pores (mp); (c) anal aperture with a ring of cells and six long setae (se).
    46(38)Anal lobes strongly protruded, conical, each one with a stout spine at apex (Fig. 43a)Geococcus coffeae
    Green, 1933
    Anal lobes flat or barely protruded, without spines at apex (Fig. 43b)47
    47(46)Venter of abdomen with clusters of trilocular pores in medial region (Fig. 44a)Coccidella ecuadorina Konczné Benedicty & Foldi, 2004
    Venter of abdomen with trilocular pores evenly dispersed, never forming clusters in medial region (Fig. 44b)48
    Fig. 43 (a) Abdomen of Geococcus coffeae with protruding anal lobe (al) with a stout spine at the apex (sp). (b) Abdomen of Rhizoecus sp. with anal lobe (al) flat, with numerous flagellate setae (fs) at the apex.
    Fig. 44 (a) Ventral surface of Coccidella ecuadorina with clusters of trilocular pores (tc) (dash box) on medial region of abdomen. (b) Ventral surface of Rhizoecus sp. with trilocular pores (tr) scattered on venter of abdomen.
    48(47)Antennae with six well-developed segments (Fig. 45a)51
    Antennae with five well-developed segments (Fig. 45b), apical segment sometimes partially divided (Fig. 45c)49
    Fig. 45 (a) Six-segmented antenna. (b) Five-segmented antenna. (c) Five-segmented antenna with partially divided apical segment (pd). Note: antennal segments numbered in Roman numerals.
    49(48)Antennae length more than 140 µm (Fig. 46a); tritubular ducts of similar diameter to trilocular pores (± 2 µm variation) (Fig. 46b); tritubular ducts with space between ductules and edge as wide as the ductules (Fig. 46c); slender ductule, width/length ratio 1:6Rhizoecus coffeae
    Laing, 1925
    Antennae length less than 130 µm (Fig. 46d); tritubular ducts of diameter nearly twice diameter of trilocular pores (Fig. 46e); tritubular ducts with reduced space or without space between ductules and edge (Fig. 46f); stout ductule, width/length ratio 1:350
    50(49)Tubular ducts present (Fig. 47a); each anal lobe with around 28 dorsal setae of similar length, greater than 30 µm (Fig. 47b, al); and dorsal marginal clusters of setae on SabdVII 20–30 µm long (Fig. 47b, SabdVII)Rhizoecus setosus (Hambleton, 1946)
    Tubular ducts absent; each anal lobe with around 14 dorsal setae, with length less than 15 µm (Fig. 47c, al); dorsal marginal clusters of setae on SabdVII with length less 15 µm (Fig. 47c, SabdVII)Rhizoecus compotor
    Williams & Granara de Willink, 1992
    Fig. 46 (a) Antenna ca. 207 µm long. (b) Tritubular ducts (td) and trilocular pores (tp) with similar diameter. (c) Close-up of a tritubular duct indicating the space between the cuticular ring (mg) and the ductule (dt). (d) Antenna ca. 105 µm long. (e) Each tritubular duct (td) twice the diameter of a trilocular pore (tp). (f) Close-up of tritubular duct without a space between the cuticular ring (mg) and the ductule (dt).
    Fig. 47 Rhizoecus setosus: (a) Tubular ducts (td); (b) anal lobe (al) and abdominal segment (SabdVII) with marginal clusters of setae longer than 30 µm. (c) Abdomen of Rhizoecus compotor with marginal cluster of setae shorter than 20 µm on anal lobe (al) and abdominal segment (SabdVII).
    51(48)Fore tibia with at least one of two internal preapical setae spine-like (Fig. 48a-b)52
    Fore tibia with both internal preapical setae flagellate (Fig. 48c)56
    Fig. 48 Fore legs with preapical setae on tibia (ft): (a) one flagellate (fs) and one spine seta (ss), (b) with a pair of spine setae (ss), (c) with a pair of flagellate setae (fs).
    52(51)Fore tibia with one internal preapical spine-like setae and other seta flagellate (Fig. 48a); anal ring composed of spine-like setae (Fig. 49a); circulus absentRhizoecus spinipes (Hambleton, 1946)
    Fore tibia with both internal preapical setae spine-like (Fig. 48b); anal ring composed of flagellate-like setae (Fig. 49b); at least, one circulus present (Fig. 49c)53
    Fig. 49 (a) Anal ring (ar) of Rhizoecus spinipes with spine-like setae (ss). (b) Anal ring (ar) of Rhizoecus arabicus with flagellate setae (fs). (c) Circulus of Rhizoecus cacticans.
    53(52)Claw digitules setose and short, length less than half length of claw (Fig. 50a)54
    Claw digitules capitate and long, as long as claw (Fig. 50b)55
    Fig. 50 Claw with claw digitule: (a) setose (sd), (b) flagellate (fd).
    54(53)Anal ring with external row composed of 35 cells or more (Fig. 51a, ext); anal ring with external and internal rows separated by a space as wide as a cell of the external row (Fig. 51a, spc); anal ring cells without spicules (Fig. 51a, sp)Rhizoecus variabilis Hambleton, 1978
    Anal ring with external row composed of less than 30 cells (Fig. 51b, ext); anal ring with external and internal rows separated by a narrow space, as wide as half (or less) a cell of the external row (Fig. 51b, spc); anal ring cells with spicules (Fig. 51b, sp)Rhizoecus arabicus Hambleton, 1976
    Fig. 51 (a) Anal ring of Rhizoecus variabilis with external row (ext) of anal ring consisting of over 35 cells; external row separated from the internal row (int) by a similar width as the diameter of a cell (spc). (b) Anal ring of Rhizoecus arabicus with external row (ext) of anal ring with less than 30 cells; external row separated from the internal row (int) by a width less than half the diameter of a cell (spc); cells of the external row with spicules (sp).
    55(53)More than 80 tritubular ducts; circulus with basal diameter at least five times greater than apical diameter (Fig. 52a); stick-like genital chamber, parallel borders and all of similar width and structure, length across about two abdominal segments (169–175 µm long) (Fig. 52b)Rhizoecus atlanticus (Hambleton, 1946)
    Less than 50 tritubular ducts; circulus with basal diameter less than three times the apical diameter (Fig. 52c); genital chamber with basal third two times wider than anterior two-thirds, length across one abdominal segment (43–52 µm long) (Fig. 52d)Rhizoecus cacticans (Hambleton, 1946)
    Fig. 52 Rhizoecus atlanticus: (a) Circulus with diameter at base five times the apical diameter, (b) genital chamber tubular shape, length ca. 150 µm long. Rhizoecus cacticans: (c) Circulus with diameter at base about two times the apical diameter, (d) genital chamber with proximal section basiform and distal section tubular, with arms, length ca. 45 µm long.
    56(51)Multilocular disc pores absent on dorsumRhizoecus mayanus (Hambleton, 1946)
    Multilocular disc pores present on dorsum57
    57(56)Marginal prothoracic setae length greater than 50 µm (Fig. 53a); marginal SabdVII setae length greater than 45 µm (Fig 53b)Rhizoecus colombiensis Ramos-Portilla & Caballero, 2016
    Marginal prothoracic setae length less than 25 µm (Fig. 53c); marginal SabdVII setae length less than 30 µm (Fig. 53d)58
    Fig. 53 Rhizoecus colombiensis: (a) Body margin with a long seta (pts) (> 40 µm), longer than remaining setae in prothorax; (b) margin of abdominal segment VII (SabdVII) (st). with a long seta (pts) (> 40 µm), longer than remaining setae in abdomen. Rhizoecus americanus: (c) Margin of prothorax (pts) with setae of uniform length, shorter than 30 µm; (d) margin of abdominal segment VII (SabdVII) with setae (st) shorter than 30 µm.
    58(57)Tritubular ducts of two sizesRhizoecus caladii
    Green, 1933
    Tritubular ducts of three sizesRhizoecus americanus (Hambleton, 1946)
     | Show Table
    DownLoad: CSV

    The following illustrated taxonomic key (Table 1) is a tool for the identification of adult female scale insects (Hemiptera : Sternorrhyncha : Coccomorpha) associated with coffee roots in Colombia, which includes 59 species from seven families (see Supplemental Table S1).

    The taxonomic key includes 59 species associated with coffee roots. Hemiberlesia sp., Odonaspis sp., Rhizoecus stangei McKenzie, 1962, Spilococcus mamillariae (Bouche, 1844), Planococcus citri (Risso, 1813) and Planococcus minor (Maskell, 1897) were excluded from the key. In the case of the two armoured scale insects, the specimens were found in Berlese funnel samples associated with coffee roots[2], however, there is no evidence of these species feeding on the roots and there are no previous records of association of Hemiberlesia nor Odonaspis species with coffee roots.

    Previous records of single specimens of R. stangei and S. mamillariae by Caballero et al.[2] were determined as misidentifications of Rhizoecus caladii Green, 1933 and Spilococcus pressus Ferris, 1950, respectively. Spilococcus mamillariae is considered as an oligophagous species, but mainly associated with Cactaceae plants and feeding on the aerial parts of plants[19,20]. There are no records of S. mamillariae being found on any plant species of the family Rubiaceae, and hence we have removed this species from the list of species associated with coffee roots. The species R. stangei, which has been recorded only from Mexico and lacks information on its host plant[21] has apparently not been found since its original description[8].

    Planococcus citri and Pl. minor were listed also by Caballero et al.[2] as literature records. the morphological identification of P. citri and P. minor needs to be complemented with molecular and geographical analysis to be more accurate[22]. Therefore, the present key considers only identification to the Planococcus citri-minor complex.

    Furthermore, many specimens of Dysmicoccus collected from coffee roots in Colombia have morphological character states that overlap with Dysmicoccus neobrevipes Beardsley, 1959, Dysmicoccus joannesiae (Costa Lima, 1939) and Dysmicoccus texensis (Tinsley, 1900). The first case is a mix of character states of D. texensis and D. neobrevipes. The number of setae in the abdominal cerarii and the size of oral collar tubular ducts are the most important characters used to differentiate the adult females of Dysmicoccus species[8,23]. Adult females of D. texensis have a consistent pattern of only two setae in all thoracic and abdominal cerarii, along with a uniform size of oral collar tubular ducts (OC). On the other hand, D. neobrevipes varies in the number of setae in the cerarii, ranging from two to seven, accompanied by two distinct sizes of OC. These character states are generally constant among specimens found on the aerial parts of plants. However, among the specimens examined here, while the anal lobe cerarii consistently have two setae on the specimens of D. texensis found on the roots, the remaining cerarii display a variable number of setae, notably ranging from two to five, particularly within the abdominal cerarii. Furthermore, the OC of these specimens all are the same size. Regarding the differences in number of setae in the cerarii, Granara de Willink[23] underlined the need of more comprehensive studies to definitively separate these species.

    The second case involves D. joannesiae and D. neobrevipes. These species exhibit similarities in the number of setae on each cerarius (ranging from two to seven setae per cerarius) and differences in the number of clusters of OC along the abdominal margin; D. joannesiae has more than 25 clusters of OC and D. neobrevipes has fewer than 10 clusters of OC[8]. Granara de Willink also separated these two species by the presence of OC on the thorax and head[23] (present in D. neobrevipes and absent in D. joannesiae). Within the specimens of putative D. neobrevipes studied here, a few had clusters of OC numbering 15 to 20 along the abdominal margin and OC on the thorax and head. The primary challenge with addressing this dilemma lies in the fact that D. joannesiae has only been reported on Joannesia princeps Vell., 1798 (Euphorbiaceae) in Brazil and on Annona muricata (Annonaceae) intercepted in London from Saint Lucia[8,24]. Moreover, there has been no additional morphological variations recorded in the new records of D. joannesiae since its initial description in 1932 by Costa Lima. Therefore, the character states defining D. joannesiae are based on six type specimens. Based on these arguments, the following taxonomic key considers two species complex groups, namely the Dysmicoccus texensis-neobrevipes complex and the D. joannesiae-neobrevipes complex.

    Following article 31.1.2 of the International Commission of Nomenclature (ICZN), herein we make a change in nomenclature for Distichlicoccus takumasae Caballero, 2021. The ending -ae for takumasae is incorrect because the species was dedicated to Dr. Takumasa Kondo (a male coccidologist), and thus the correct ending is -i, hence the species epithet is herein amended to 'takumasai'. The corrected name is Distichlicoccus takumasai Caballero, 2021.

    After reviewing the species of scale insects associated with coffee roots in Colombia, we have compiled a list of 59 species (Supplemental Table S1). Although this study did not focus on the effect of habit (aerial vs underground) or host plant on the morphology of scale insects, we detected significant morphological variation within facultative hypogeal species. Until further studies allow an understanding of the overlap of character states between D. texensisD. neobrevipes and D. joannesiaeD. neobrevipes, we suggest considering these species as a morphological complex for hypogeal specimens. Further ecomorphological studies should be conducted to determine whether the morphology of a species may differ when feeding on the aerial parts compared when feeding on the underground parts of a host and to try to elucidate what factors trigger those changes, especially in species associated with coffee plants. As for the species complex, further collecting, morphological, and molecular studies should help elucidate these taxonomic problems.

    During the literature review performed for this study, we realized that most of the records of species are limited to mentioning the host but not the plant part on which collections were made, however, it is suspected that most species are normally collected from the aerial parts of the plant host. Although this taxonomic key is limited to root-associated species recorded in Colombia, this key could be useful for identifying scale insects associated with coffee in other tropical regions, extending also to species collected from the aerial parts of the hosts.

    The authors confirm contributions to the paper as follows: study conception and design: Caballero A, Kondo T; data collection: Caballero A, Kondo T; analysis and interpretation of results: Caballero A, Kondo T; draft manuscript preparation: Caballero A, Kondo T. Both authors reviewed the results and approved the final version of the manuscript.

    The data (microscopy slides of specimens) that support the findings of this study are available in the Scale insect repository of the entomological museum Universidad Nacional Agronomia Bogota – UNAB, Facultad de Ciencias Agrarias, Colombia. All data generated or analyzed during this study are included in this published article and its supplementary information files.

    The authors thank Dr. Andrea Ramos-Portilla for clarifying some aspects of the morphological variations of Rhizoecus species and Dr. Penny Gullan (Australian National University, Canberra, Australia) for reviewing an earlier version of the manuscript. Many thanks to Erika Valentina Vergara (AGROSAVIA) and Dr. Francisco Serna (Universidad Nacional de Colombia) for their help to access the Museum UNAB. Special thanks to Dr Giuseppina Pellizzari (University of Padova, Italy) for advice on scientific nomenclature. This study was financed by Colciencias (Programa Nacional de Ciencias Básicas [National Program on Basic Sciences]), code 110165843233, contract FP44842-004-2015), by the entomological museum UNAB (Facultad Ciencias Agrarias, Universidad Nacional de Colombia, sede Bogotá) and by Federación Nacional de Cafeteros.

  • The authors declare that they have no conflict of interest.

  • [1]

    Levin MW, Boyles SD. 2015. Effects of autonomous vehicle ownership on trip, mode, and route choice. Transportation Research Record: Journal of the Transportation Research Board 2493(1):29−38

    doi: 10.3141/2493-04

    CrossRef   Google Scholar

    [2]

    Tsugawa S. 2011. Automated driving systems: common ground of automobiles and robots. International Journal of Humanoid Robotics 8(1):1−12

    doi: 10.1142/S0219843611002319

    CrossRef   Google Scholar

    [3]

    Shi E, Gasser TM, Seeck A, Auerswald R. 2020. The principles of operation framework: a comprehensive classification concept for automated driving functions. SAE International Journal of Connected and Automated Vehicles 3(1):27−37

    doi: 10.4271/12-03-01-0003

    CrossRef   Google Scholar

    [4]

    Abe R. 2019. Introducing autonomous buses and taxis: Quantifying the potential benefits in Japanese transportation systems. Transportation Research Part A: Policy and Practice 126:94−113

    doi: 10.1016/j.tra.2019.06.003

    CrossRef   Google Scholar

    [5]

    Lutin JM. 2018. Not if, but when: autonomous driving and the future of transit. Journal of Public Transportation 21(1):92−103

    doi: 10.5038/2375-0901.21.1.10

    CrossRef   Google Scholar

    [6]

    Alessandrini A, Site PD, Gatta V, Marcucci E, Zhang Q, et al. 2016. Investigating users' attitudes towards conventional and automated buses in twelve European cities. International Journal of Transport Economics 43(4):413−36

    doi: 10.19272/201606704001

    CrossRef   Google Scholar

    [7]

    Papadima G, Genitsaris E, Karagiotas I, Naniopoulos A, Nalmpantis D. 2020. Investigation of acceptance of driverless buses in the city of Trikala and optimization of the service using Conjoint Analysis. Utilities Policy 62:100994

    doi: 10.1016/j.jup.2019.100994

    CrossRef   Google Scholar

    [8]

    Rosell J, Allen J. 2020. Test-riding the driverless bus: Determinants of satisfaction and reuse intention in eight test-track locations. Transportation Research Part A: Policy and Practice 140:166−89

    doi: 10.1016/j.tra.2020.08.013

    CrossRef   Google Scholar

    [9]

    Bernhard C, Oberfeld D, Hoffmann C, Weismüller D, Hecht H. 2020. User acceptance of automated public transport. Transportation Research Part F: Traffic Psychology and Behaviour 70:109−23

    doi: 10.1016/j.trf.2020.02.008

    CrossRef   Google Scholar

    [10]

    Yan Y, Zhong S, Tian J, Li T. 2022. Continuance intention of autonomous buses: An empirical analysis based on passenger experience. Transport Policy 126:85−95

    doi: 10.1016/j.tranpol.2022.07.010

    CrossRef   Google Scholar

    [11]

    Kim K, Yang W, Brewer S. 2022. Analyzing change in business activity before, during, and after autonomous shuttle bus service in the old Las Vegas downtown area. Journal of Urban Planning and Development 148(1):04021065

    doi: 10.1061/(ASCE)UP.1943-5444.0000788

    CrossRef   Google Scholar

    [12]

    Sun S, Wong YD, Rau A. 2020. Economic assessment of a Dynamic Autonomous Road Transit system for Singapore. Research in Transportation Economics 83:100843

    doi: 10.1016/j.retrec.2020.100843

    CrossRef   Google Scholar

    [13]

    Salonen AO. 2018. Passenger's subjective traffic safety, in-vehicle security and emergency management in the driverless shuttle bus in Finland. Transport Policy 61:106−10

    doi: 10.1016/j.tranpol.2017.10.011

    CrossRef   Google Scholar

    [14]

    Roche-Cerasi I. 2019. Public acceptance of driverless shuttles in Norway. Transportation Research Part F: Traffic Psychology and Behaviour 66:162−83

    doi: 10.1016/j.trf.2019.09.002

    CrossRef   Google Scholar

    [15]

    Kassens-Noor E, Kotval-Karamchandani Z, Cai M. 2020. Willingness to ride and perceptions of autonomous public transit. Transportation Research Part A: Policy and Practice 138:92−104

    doi: 10.1016/j.tra.2020.05.010

    CrossRef   Google Scholar

    [16]

    Benmimoun A, Lowson M, Marques A, Giustiniani G, Parent M. 2009. Demonstration of advanced transport applications in CityMobil project. Transportation Research Record: Journal of the Transportation Research Board 2110(1):9−17

    doi: 10.3141/2110-02

    CrossRef   Google Scholar

    [17]

    Shen J, Liu K, Ma C, Zhao Y, Shi C. 2022. Bibliometric analysis and system review of vehicle routing optimization for emergency material distribution. Journal of Traffic and Transportation Engineering 9(6):893−911

    doi: 10.1016/j.jtte.2022.10.001

    CrossRef   Google Scholar

    [18]

    van Eck NJ, Waltman L. 2010. Software survey: VOSviewer, a computer program for bibliometric mapping. Scientometrics 84(2):523−38

    doi: 10.1007/s11192-009-0146-3

    CrossRef   Google Scholar

    [19]

    Herrenkind B, Brendel AB, Nastjuk I, Greve M, Kolbe LM. 2019. Investigating end-user acceptance of autonomous electric buses to accelerate diffusion. Transportation Research Part D: Transport and Environment 74:255−76

    doi: 10.1016/j.trd.2019.08.003

    CrossRef   Google Scholar

    [20]

    Zhai Z, Yang Y, Shen Y, Ji Y, Du Y. 2020. Assessing the impacts of autonomous bus-on-demand based on agent-based simulation: a case study of Fuyang, Zhejiang, China. Journal of Advanced Transportation 2020:7981791

    doi: 10.1155/2020/7981791

    CrossRef   Google Scholar

    [21]

    Badia H, Jenelius E. 2021. Design and operation of feeder systems in the era of automated and electric buses. Transportation Research Part A: Policy and Practice 152:146−72

    doi: 10.1016/j.tra.2021.07.015

    CrossRef   Google Scholar

    [22]

    Dong X, Discenna M, Guerra E. 2019. Transit user perceptions of driverless buses. Transportation 46(1):35−50

    doi: 10.1007/s11116-017-9786-y

    CrossRef   Google Scholar

    [23]

    Weschke J, Bahamonde-Birke FJ, Gade K, Kazagli E. 2021. Asking the Wizard-of-Oz: How experiencing autonomous buses affects preferences towards their use for feeder trips in public transport. Transportation Research Part C: Emerging Technologies 133:103454

    doi: 10.1016/j.trc.2021.103454

    CrossRef   Google Scholar

    [24]

    Mouratidis K, Cobeña Serrano V. 2021. Autonomous buses: Intentions to use, passenger experiences, and suggestions for improvement. Transportation Research Part F: Traffic Psychology and Behaviour 76:321−35

    doi: 10.1016/j.trf.2020.12.007

    CrossRef   Google Scholar

    [25]

    Piatkowski DP. 2021. Autonomous shuttles: What do users expect and how will they use them? The Journal of Urban Technology 28(3−4):97−115

    doi: 10.1080/10630732.2021.1896345

    CrossRef   Google Scholar

    [26]

    Guo J, Susilo Y, Antoniou C, Pernestål A. 2021. When and why do people choose automated buses over conventional buses? Results of a context-dependent stated choice experiment Sustainable Cities and Society 69:102842

    doi: 10.1016/j.scs.2021.102842

    CrossRef   Google Scholar

    [27]

    Zhao X, Susilo YO, Pernestål A. 2022. The dynamic and long-term changes of automated bus service adoption. Transportation Research Part A: Policy and Practice 155:450−63

    doi: 10.1016/j.tra.2021.10.021

    CrossRef   Google Scholar

    [28]

    Guo J, Susilo Y, Antoniou C, Pernestål A. 2022. Word of mouth and behavioural intentions of the automated bus service. Cities 126:103668

    doi: 10.1016/j.cities.2022.103668

    CrossRef   Google Scholar

    [29]

    Cao Z, Ceder AA, Zhang S. 2019. Real-time schedule adjustments for autonomous public transport vehicles. Transportation Research Part C: Emerging Technologies 109:60−78

    doi: 10.1016/j.trc.2019.10.004

    CrossRef   Google Scholar

    [30]

    Cao Z, Avi Ceder A. 2019. Autonomous shuttle bus service timetabling and vehicle scheduling using skip-stop tactic. Transportation Research Part C: Emerging Technologies 102:370−95

    doi: 10.1016/j.trc.2019.03.018

    CrossRef   Google Scholar

    [31]

    Gkiotsalitis K, Schmidt M, van der Hurk E. 2022. Subline frequency setting for autonomous minibusses under demand uncertainty. Transportation Research Part C: Emerging Technologies 135:103492

    doi: 10.1016/j.trc.2021.103492

    CrossRef   Google Scholar

    [32]

    Zhang Y, Chen X, Yu L. 2020. Evaluating the emission and energy impacts of automated buses on urban expressways. Transportation Research Record: Journal of the Transportation Research Board 2674(12):515−29

    doi: 10.1177/0361198120954437

    CrossRef   Google Scholar

    [33]

    Wang L, Ma W, Wang L, Ren Y, Yu C. 2021. Enabling in-depot automated routing and recharging scheduling for automated electric bus transit systems. Journal of Advanced Transportation 2021:5531063

    doi: 10.1155/2021/5531063

    CrossRef   Google Scholar

    [34]

    Zhang L, Qian G, Song Z, Wang D. 2023. Deploying dedicated lanes for connected and autonomous buses in urban transportation networks. Transportmetrica A: Transport Science 19:2005181

    doi: 10.1080/23249935.2021.2005181

    CrossRef   Google Scholar

    [35]

    Hatzenbühler J, Cats O, Jenelius E. 2022. Network design for line-based autonomous bus services. Transportation 49(2):467−502

    doi: 10.1007/s11116-021-10183-7

    CrossRef   Google Scholar

    [36]

    Dai Z, Liu X C, Chen X, Ma X. 2020. Joint optimization of scheduling and capacity for mixed traffic with autonomous and human-driven buses: A dynamic programming approach. Transportation Research Part C: Emerging Technologies 114:598−619

    doi: 10.1016/j.trc.2020.03.001

    CrossRef   Google Scholar

    [37]

    Tian Q, Lin YH, Wang DZW. 2021. Autonomous and conventional bus fleet optimization for fixed-route operations considering demand uncertainty. Transportation 48:2735−63

    doi: 10.1007/s11116-020-10146-4

    CrossRef   Google Scholar

    [38]

    Hatzenbühler J, Cats O, Jenelius E. 2020. Transitioning towards the deployment of line-based autonomous buses: Consequences for service frequency and vehicle capacity. Transportation Research Part A: Policy and Practice 138:491−507

    doi: 10.1016/j.tra.2020.06.019

    CrossRef   Google Scholar

    [39]

    Tian Q, Wang DZW, Lin YH. 2022. Optimal deployment of autonomous buses into a transit service network. Transportation Research Part E: Logistics and Transportation Review 165:102865

    doi: 10.1016/j.tre.2022.102865

    CrossRef   Google Scholar

    [40]

    Zhang W, Jenelius E, Badia H. 2019. Efficiency of semi-autonomous and fully autonomous bus services in trunk-and-branches networks. Journal of Advanced Transportation 2019:7648735

    doi: 10.1155/2019/7648735

    CrossRef   Google Scholar

    [41]

    Liu T, Ceder AA, Rau A. 2020. Using Deficit Function to Determine the Minimum Fleet Size of an Autonomous Modular Public Transit System. Transportation Research Record: Journal of the Transportation Research Board 2674(11):532−41

    doi: 10.1177/0361198120945981

    CrossRef   Google Scholar

    [42]

    Wu J, Kulcsár B, Selpi, Qu X. 2021. A modular, adaptive, and autonomous transit system (MAATS): An in-motion transfer strategy and performance evaluation in urban grid transit networks. Transportation Research Part A: Policy and Practice 151:81−98

    doi: 10.1016/j.tra.2021.07.005

    CrossRef   Google Scholar

    [43]

    Dakic I, Yang K, Menendez M, Chow JYJ. 2021. On the design of an optimal flexible bus dispatching system with modular bus units: Using the three-dimensional macroscopic fundamental diagram. Transportation Research Part B: Methodological 148:38−59

    doi: 10.1016/j.trb.2021.04.005

    CrossRef   Google Scholar

    [44]

    Tian Q, Lin YH, Wang DZW, Liu Y. 2022. Planning for modular-vehicle transit service system: Model formulation and solution methods. Transportation Research Part C: Emerging Technologies 138:103627

    doi: 10.1016/j.trc.2022.103627

    CrossRef   Google Scholar

  • Cite this article

    Shen J, Liu Q, Ye Z, Jiang W, Ma C. 2023. Autonomous bus services: current research status and future recommendations. Digital Transportation and Safety 2(3):229−240 doi: 10.48130/DTS-2023-0019
    Shen J, Liu Q, Ye Z, Jiang W, Ma C. 2023. Autonomous bus services: current research status and future recommendations. Digital Transportation and Safety 2(3):229−240 doi: 10.48130/DTS-2023-0019

Figures(5)  /  Tables(4)

Article Metrics

Article views(5849) PDF downloads(1370)

Other Articles By Authors

REVIEW   Open Access    

Autonomous bus services: current research status and future recommendations

Digital Transportation and Safety  2 2023, 2(3): 229−240  |  Cite this article

Abstract: Implementing autonomous bus services in several cities has garnered substantial research attention worldwide. However, the benefits and challenges of this emerging mode remain insufficiently understood. Consequently, VOSviewer was employed for a bibliometric analysis involving 300 publications, investigating the associations among authors, journals, and keywords. Subsequently, we comprehensively reviewed the current state of research on two topics and proposed future recommendations. Results indicate that the first document related to autonomous bus services was published in 2009. Most user attitude -related research data are obtained via questionnaires and analyzed using statistical techniques. Autonomous bus services are expected to benefit passengers regarding travel time, cost, safety, etc., while passenger preferences are inconsistent. However, integrating the service into existing bus systems requires careful consideration of the schedule sequences. Notably, modular autonomous bus services present a new opportunity for the further optimization of bus services. In future studies, standardized data acquisition procedures should be developed to achieve comparable results. Regarding traveler choice behavior, the effect of specific autonomous bus service policies over time and the heterogeneity due to cultural or social contexts across regions should be assessed. To further promote autonomous bus services, based on fluctuating travel demands, the effects of vehicle capacity, speed, and cost of fleet composition should be evaluated comprehensively to optimize the bus network and schedule sequence. Owing to the protracted nature of the transition from conventional to fully autonomous buses, one should prioritize semi-autonomous bus services. Another essential future research direction is to integrate modular autonomous bus assembly or disassembly strategies with different fine-grained operation optimization techniques in various scenarios.

    • In recent decades, autonomous driving technology has progressed significantly and is gradually reshaping mobility models[1]. In general, autonomous driving involves electronic devices or robots performing sensing, decision-making, and various operational functions during the driving process in place of a human driver[2]. Based on the vehicle automation level, the Society of Automotive Engineers has suggested generally recognized categorization standards: no driving automation, driver assistance, partial driving automation, conditional driving automation, high driving automation, and full driving automation[3]. Herein, the term 'autonomous' refers to a vehicle with full driving automation. Other studies pertaining to partially autonomous vehicles are beyond the scope of this analysis.

      Common application areas of autonomous driving technologies include passenger cars, commercial trucks, buses, etc. In particular, autonomous buses are essential for improving the quality of public transportation services. By eliminating the necessity for human drivers, autonomous buses can significantly lower operational costs, while providing more flexible and convenient pick-up and drop-off services. Based on the quantification of vehicle, labor, operating, and time costs in Japan, Abe[4] predicted that employing an autonomous bus service would reduce travel costs by 6%–11%. In addition, the widespread benefits of autonomous driving technology include increased mobility, improvements in travel time and traffic safety, increased operational efficiency, and reduced adverse environmental effects[5].

      Owing to their numerous advantages, autonomous buses have been adopted in multiple countries and regions worldwide. With assistance from the European Union's Citymobil2 project, more than a dozen member states have successfully demonstrated the viability of autonomous buses on low-speed urban roads with mixed traffic environments, including France, Germany, Italy, Greece, Switzerland, Spain, Belgium, Finland, etc.[6]. Survey results regarding the pilot deployment of the CityMobil2 project in Greece indicated that residents favored the utilization of autonomous bus services[7]. In Spain, a face-to-face survey of passengers who have experienced autonomous bus services revealed that income, gender, and application scenarios can substantially affect traveler satisfaction and acceptance[8]. A field study involving 942 German passengers found that autonomous bus service safety and environmental friendliness were significant and that passengers who had traveled via autonomous buses showed a higher acceptance rate[9]. In Sweden, a longitudinal panel survey of three separate periods revealed that the variables affecting passenger usage changed dynamically over time. Service performance, such as comfort, frequency, and travel time, is a crucial aspect that affects passenger acceptance of autonomous buses. Following the implementation of the autonomous bus service in China, a survey of 576 ride-experienced passengers revealed that in-vehicle safety, service quality, and bus riding habits positively affected travelers' willingness to continue using the service[10]. Pilot application studies pertaining to autonomous bus services in the United States demonstrated their usefulness in increasing economic growth and commercial activity in cities, particularly in older and declining neighborhoods[11]. Moreover, the application of autonomous bus services in Singapore demonstrated that they can provide passengers with more efficient services and significantly reduce travel costs[12].

      However, after evaluating multiple real-world scenarios of autonomous bus deployment and operation, several researchers indicated that several significant challenges still need to be overcome before they can be more widely adopted. In Finland, an empirical study revealed that passengers, particularly female passengers, perceived much worse in-vehicle security in autonomous buses than in traditional buses[13]. Similarly, a study of 1,419 respondents in Norway revealed that more than 70% of the sample indicated negative sentiments regarding the implementation of autonomous bus services owing to safety issues[14]. Approximately one half of respondents in the United States were hesitant to ride autonomous buses owing to safety concerns and distrust toward driverless technology[15].

      The autonomous bus industry is still in the early stages of development; however, its promising future has garnered the considerable attention of academics. The deployment and operational optimization of autonomous bus services is a challenging endeavor affected by several parties, including the government, academics, industry, and passengers. Hence, the topics discussed and the methodologies used previously vary significantly, which might yield inconsistent results. Hence, to provide researchers with a complete understanding of the research progress and trends in the area, we conduct a comprehensive literature review to investigate the themes of interest, research techniques, and theoretical achievements related to autonomous bus services, which would benefit scholars investigating this topic.

      The remainder of this paper is organized as follows: the next section presents the literature data sources, search strategies, selection criteria, an overview, and bibliometric analysis tools. Subsequently, we present a bibliometric analysis using VOSviewer, which includes literature authors, co-authorship countries, source journals, and keyword co-occurrence. In the following sections, we systematically review the current research and propose future recommendations for users' attitudes and operations, respectively. Finally, the main contributions, findings, and limitations of this study are summarized.

    • The Web of Science (WoS) is a comprehensive platform comprising several literature databases and is one of the most essential research tools for academic studies. As the oldest publishing and citation resource platform, it provides access to billions of cited references across various disciplines. The platform also exhibits leading search and analysis features that enable researchers to obtain adequate citation data for bibliometric analyses. Therefore, based on the WoS, we established a search strategy and selection criteria for the citation literature data utilized in this study to investigate the relationships among various research topics pertaining to autonomous buses. Figure 1 shows a flowchart of the literature review process.
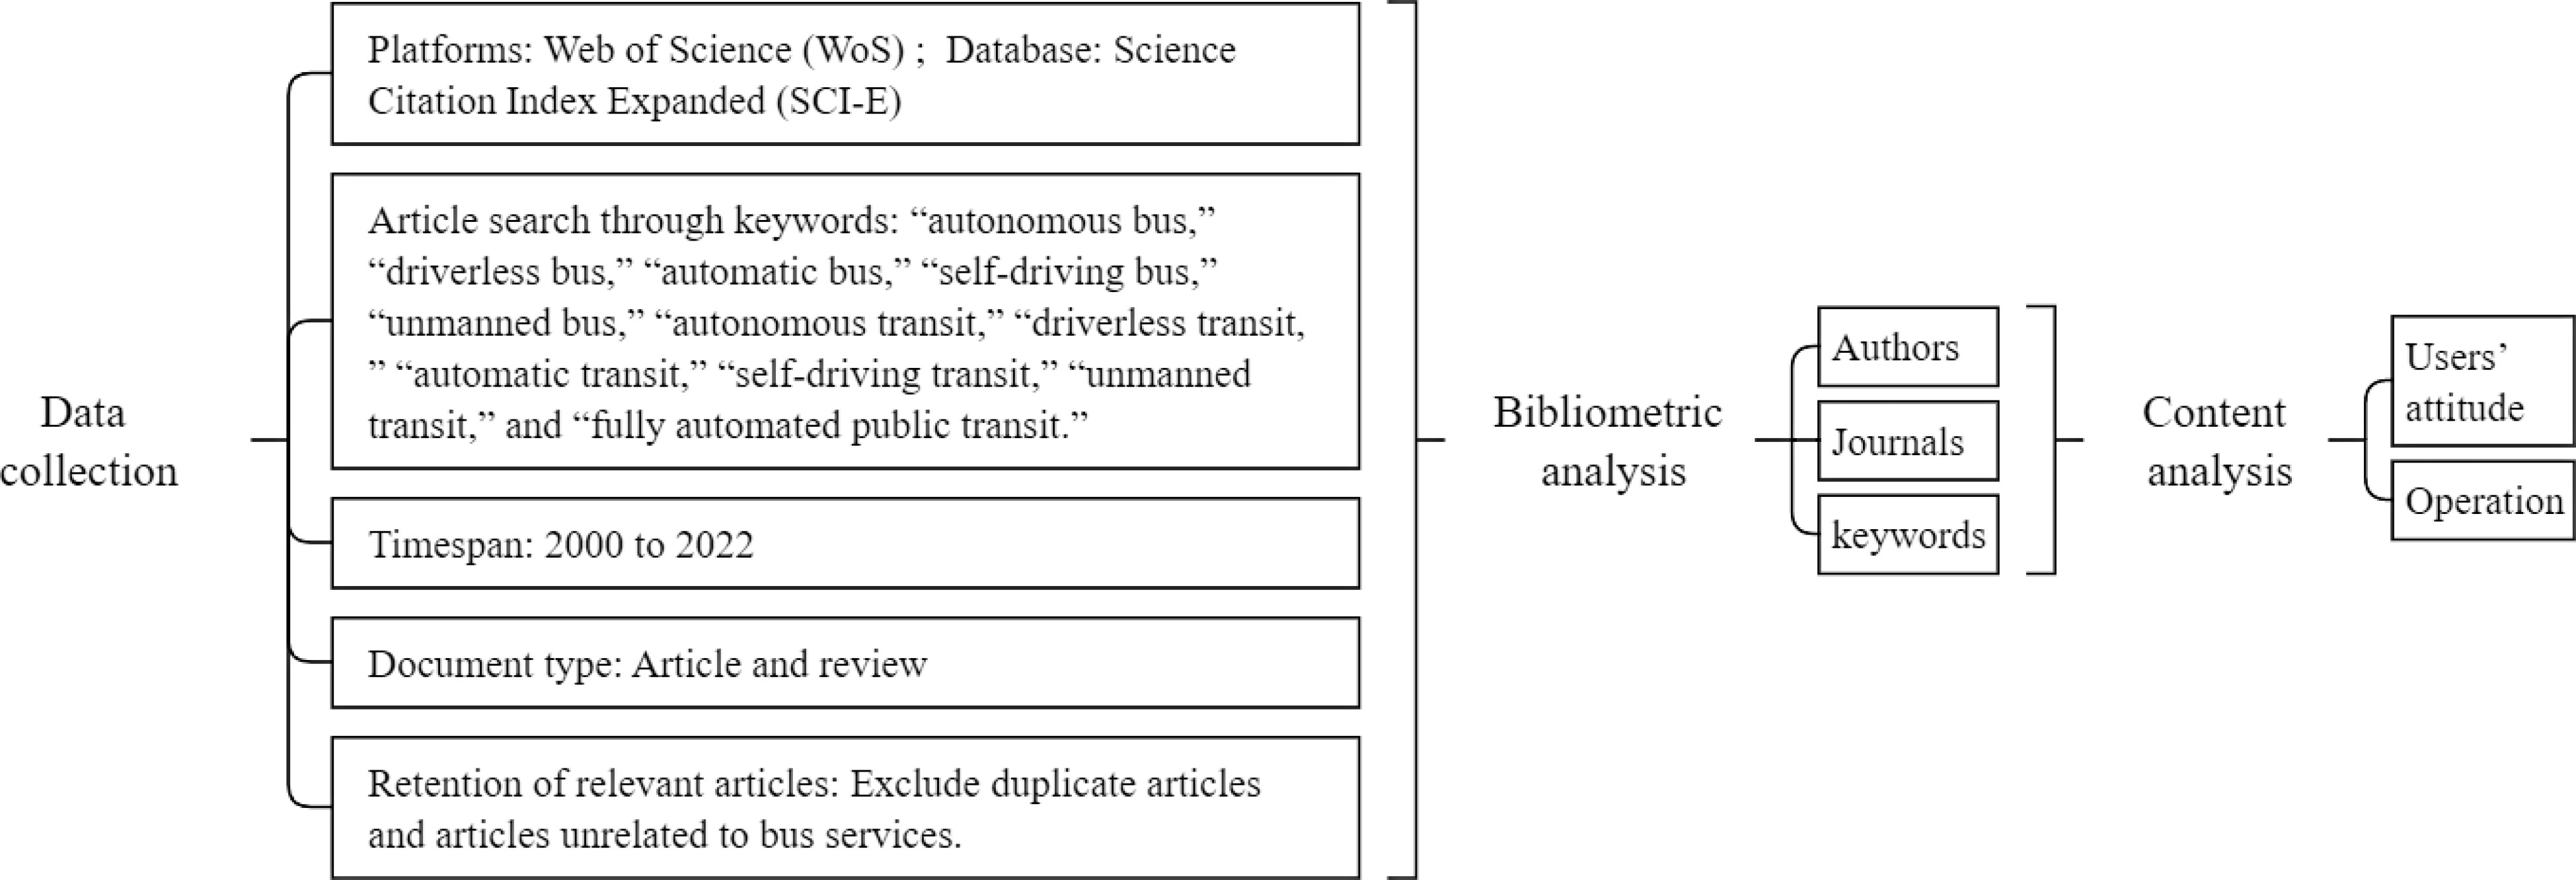
      Figure 1. 

      Flowchart of the literature review.

      Based on the current literature, the concept of autonomous buses varies based on the objectives and scenarios of a study. Therefore, based on a search conducted in the WoS, several concepts were set as keywords to acquire sufficient bibliographic records, including 'autonomous bus', 'driverless bus', 'automatic bus', 'self-driving bus', 'unmanned bus', 'autonomous transit', 'driverless transit', 'automatic transit', 'self-driving transit', 'unmanned transit', and 'fully automated public transit'. A bibliographic data search was performed in January 2023, and all related journal articles published before 2023 were obtained. This was performed to meticulously investigate the evolutionary trends of origin, progress, and present accomplishments in the field. Based on these search criteria, we acquired 300 bibliographic references from the WoS core collection dataset, as shown in Fig. 2.
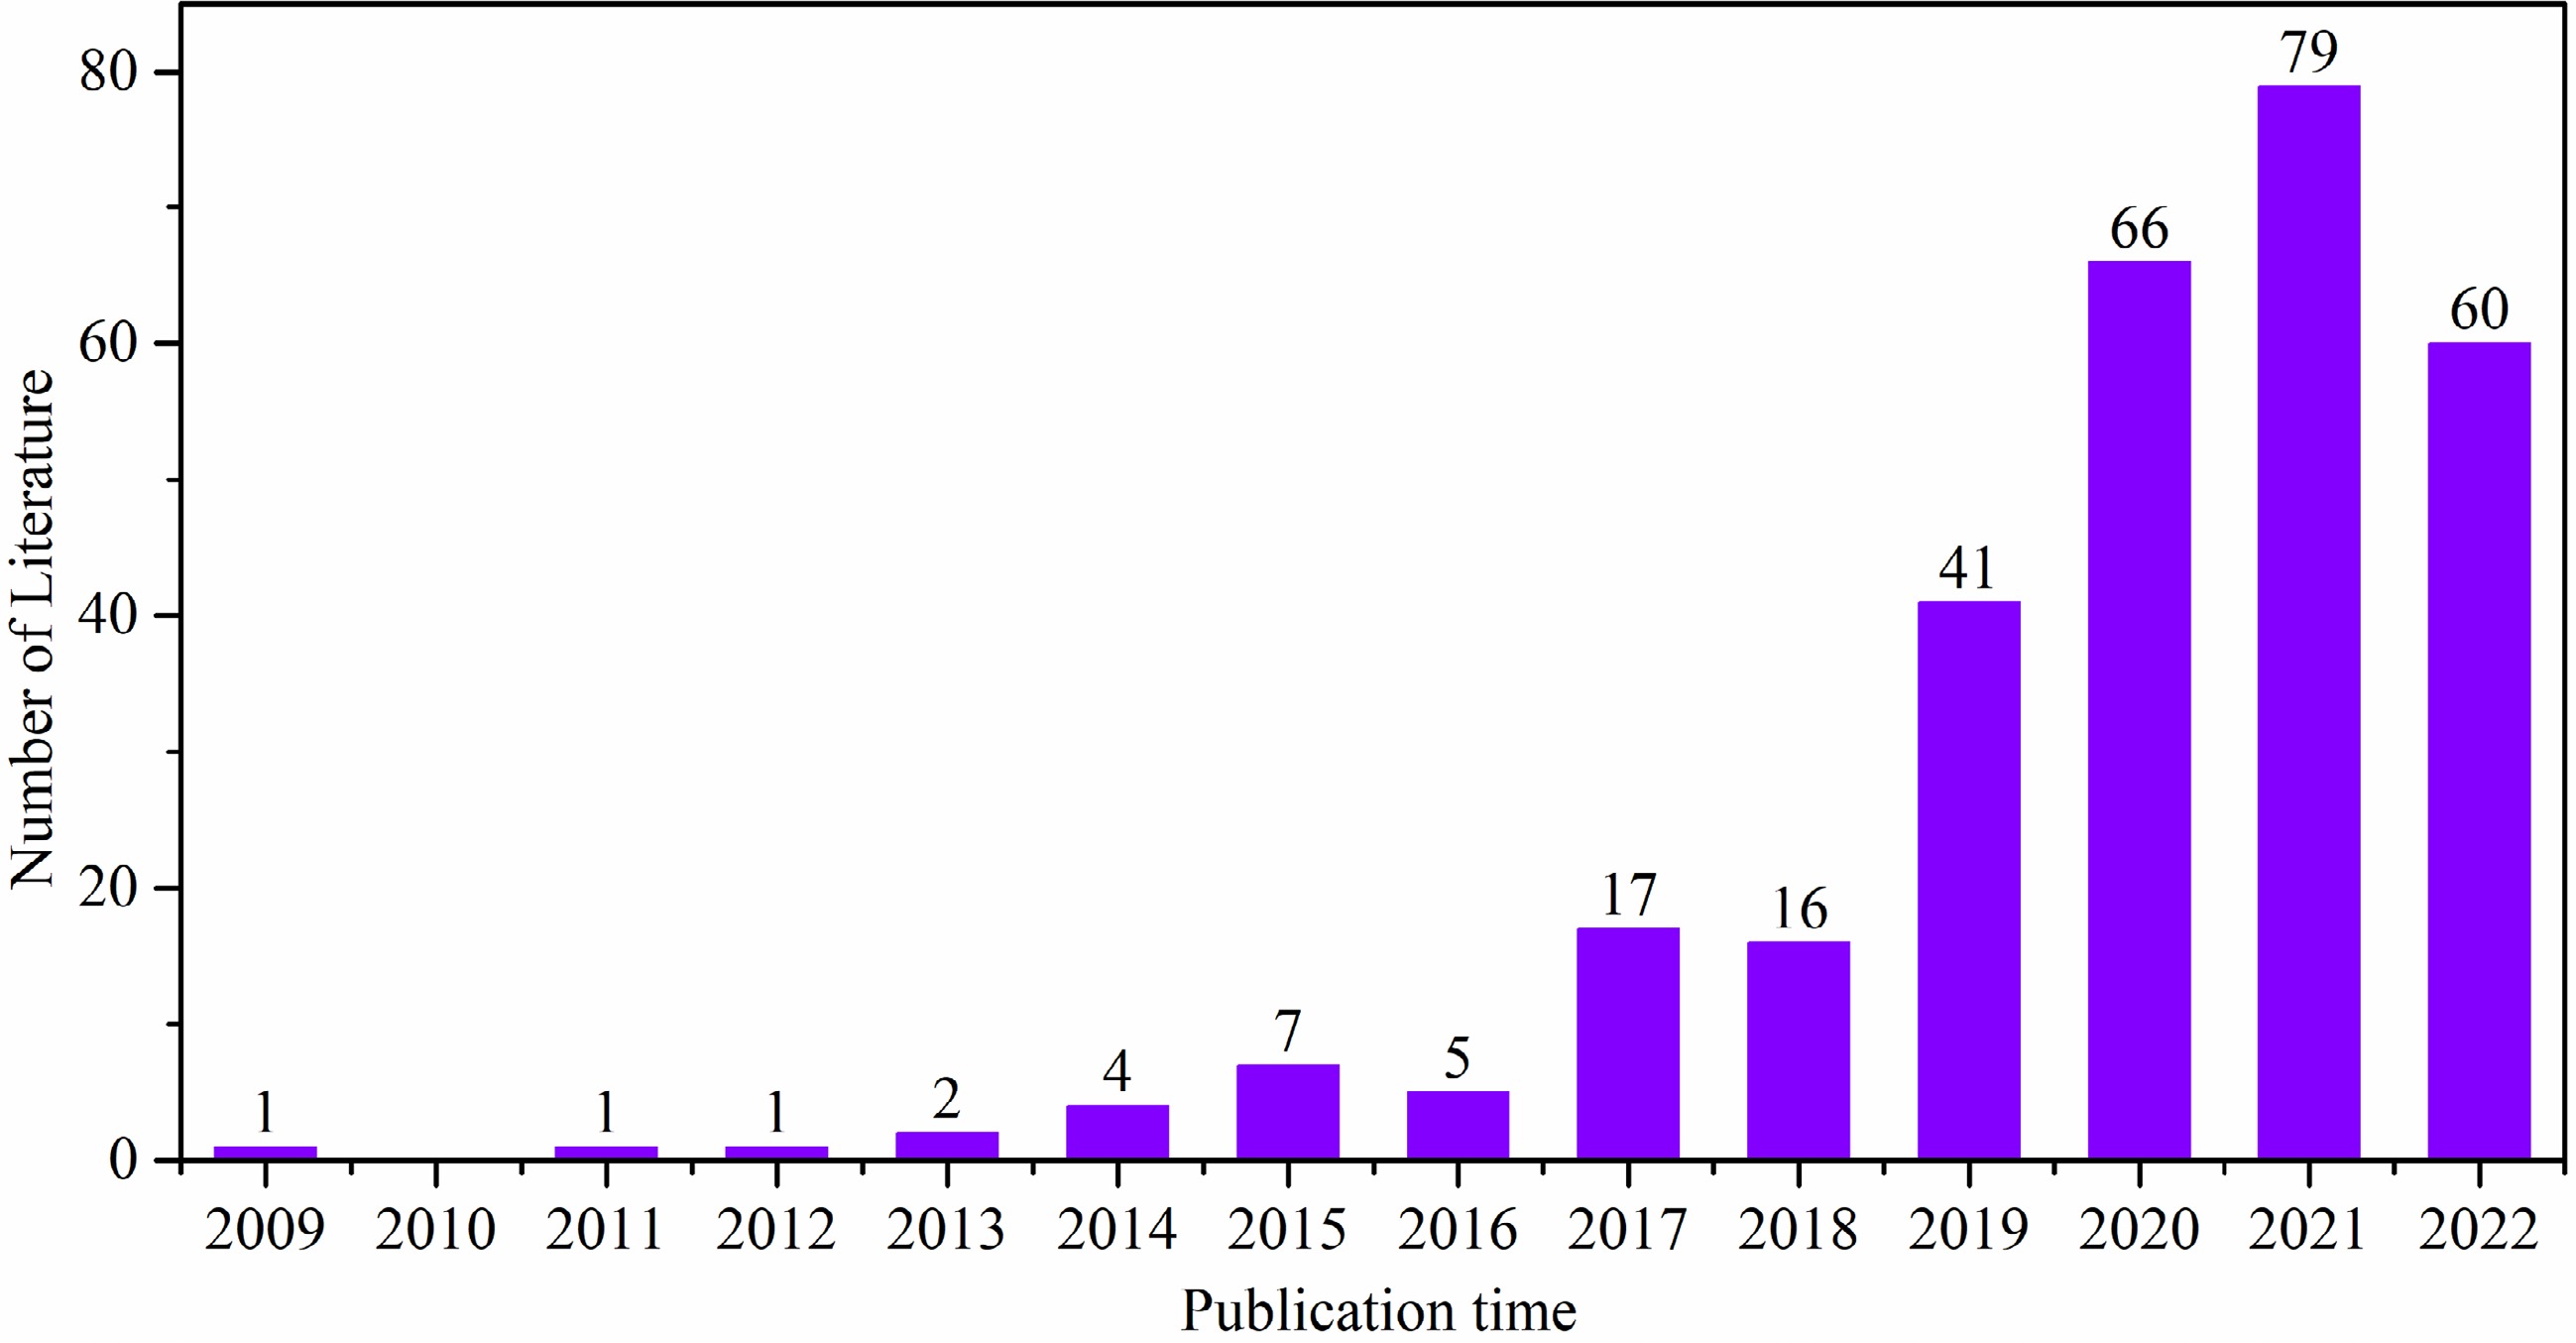
      Figure 2. 

      Overview of obtained bibliographic reference data.

      As shown in Fig. 2, the earliest research results related to autonomous buses were those obtained in 2009. Benmimoun et al.[16] presented a demonstration application for autonomous bus services in Spain as part of the CityMobil project. The project includes various demonstration activities by applying innovative and advanced mobility solutions in Europe to evaluate their efficacy in enhancing travel mobility and resolving urban traffic issues. Subsequently, a small group of academics began to investigate the challenges in this field. In 2014, as information and automation technology improved, it re-emerged as an intriguing subject, and a considerable body of literature was published. This may be because 2014 was the year in which the revolutionary CityMobil2 project was demonstrated in Italy. Notably, the number of publications in 2022 was significantly lower than in 2021, decreasing by about 25%. Considering the ongoing enthusiasm around autonomous driving research, the plausible explanation for this decline may be the delays in incorporating publications into databases.

      The bibliographic references obtained were imported into VOSviewer for bibliometric analysis. Currently, this program is regarded as one of the most used tools for visualizing and analyzing bibliometric data[17]. Using a visual network layout and effective clustering algorithms, the program can intuitively demonstrate various relationships in the literature, e.g., co-authorship, co-citation, bibliographic coupling, keyword co-occurrence, etc. Additional details regarding the bibliometric analysis algorithms employed in VOSviewer and their superiority over other typically used software programs are provided by van Eck & Waltman[18].

    • The database of authors used for the analysis comprised 842 authors from the 300 papers obtained. To analyze the authors, we set the minimum numbers of publications and citations per author to two and one, respectively. These thresholds were established such that the analysis findings of VOSviewer would be straightforward and simple to comprehend. A total of 123 among the 842 authors satisfied the thresholds, and an analysis of the findings regarding the relationships among these scholars is shown in Fig. 3.
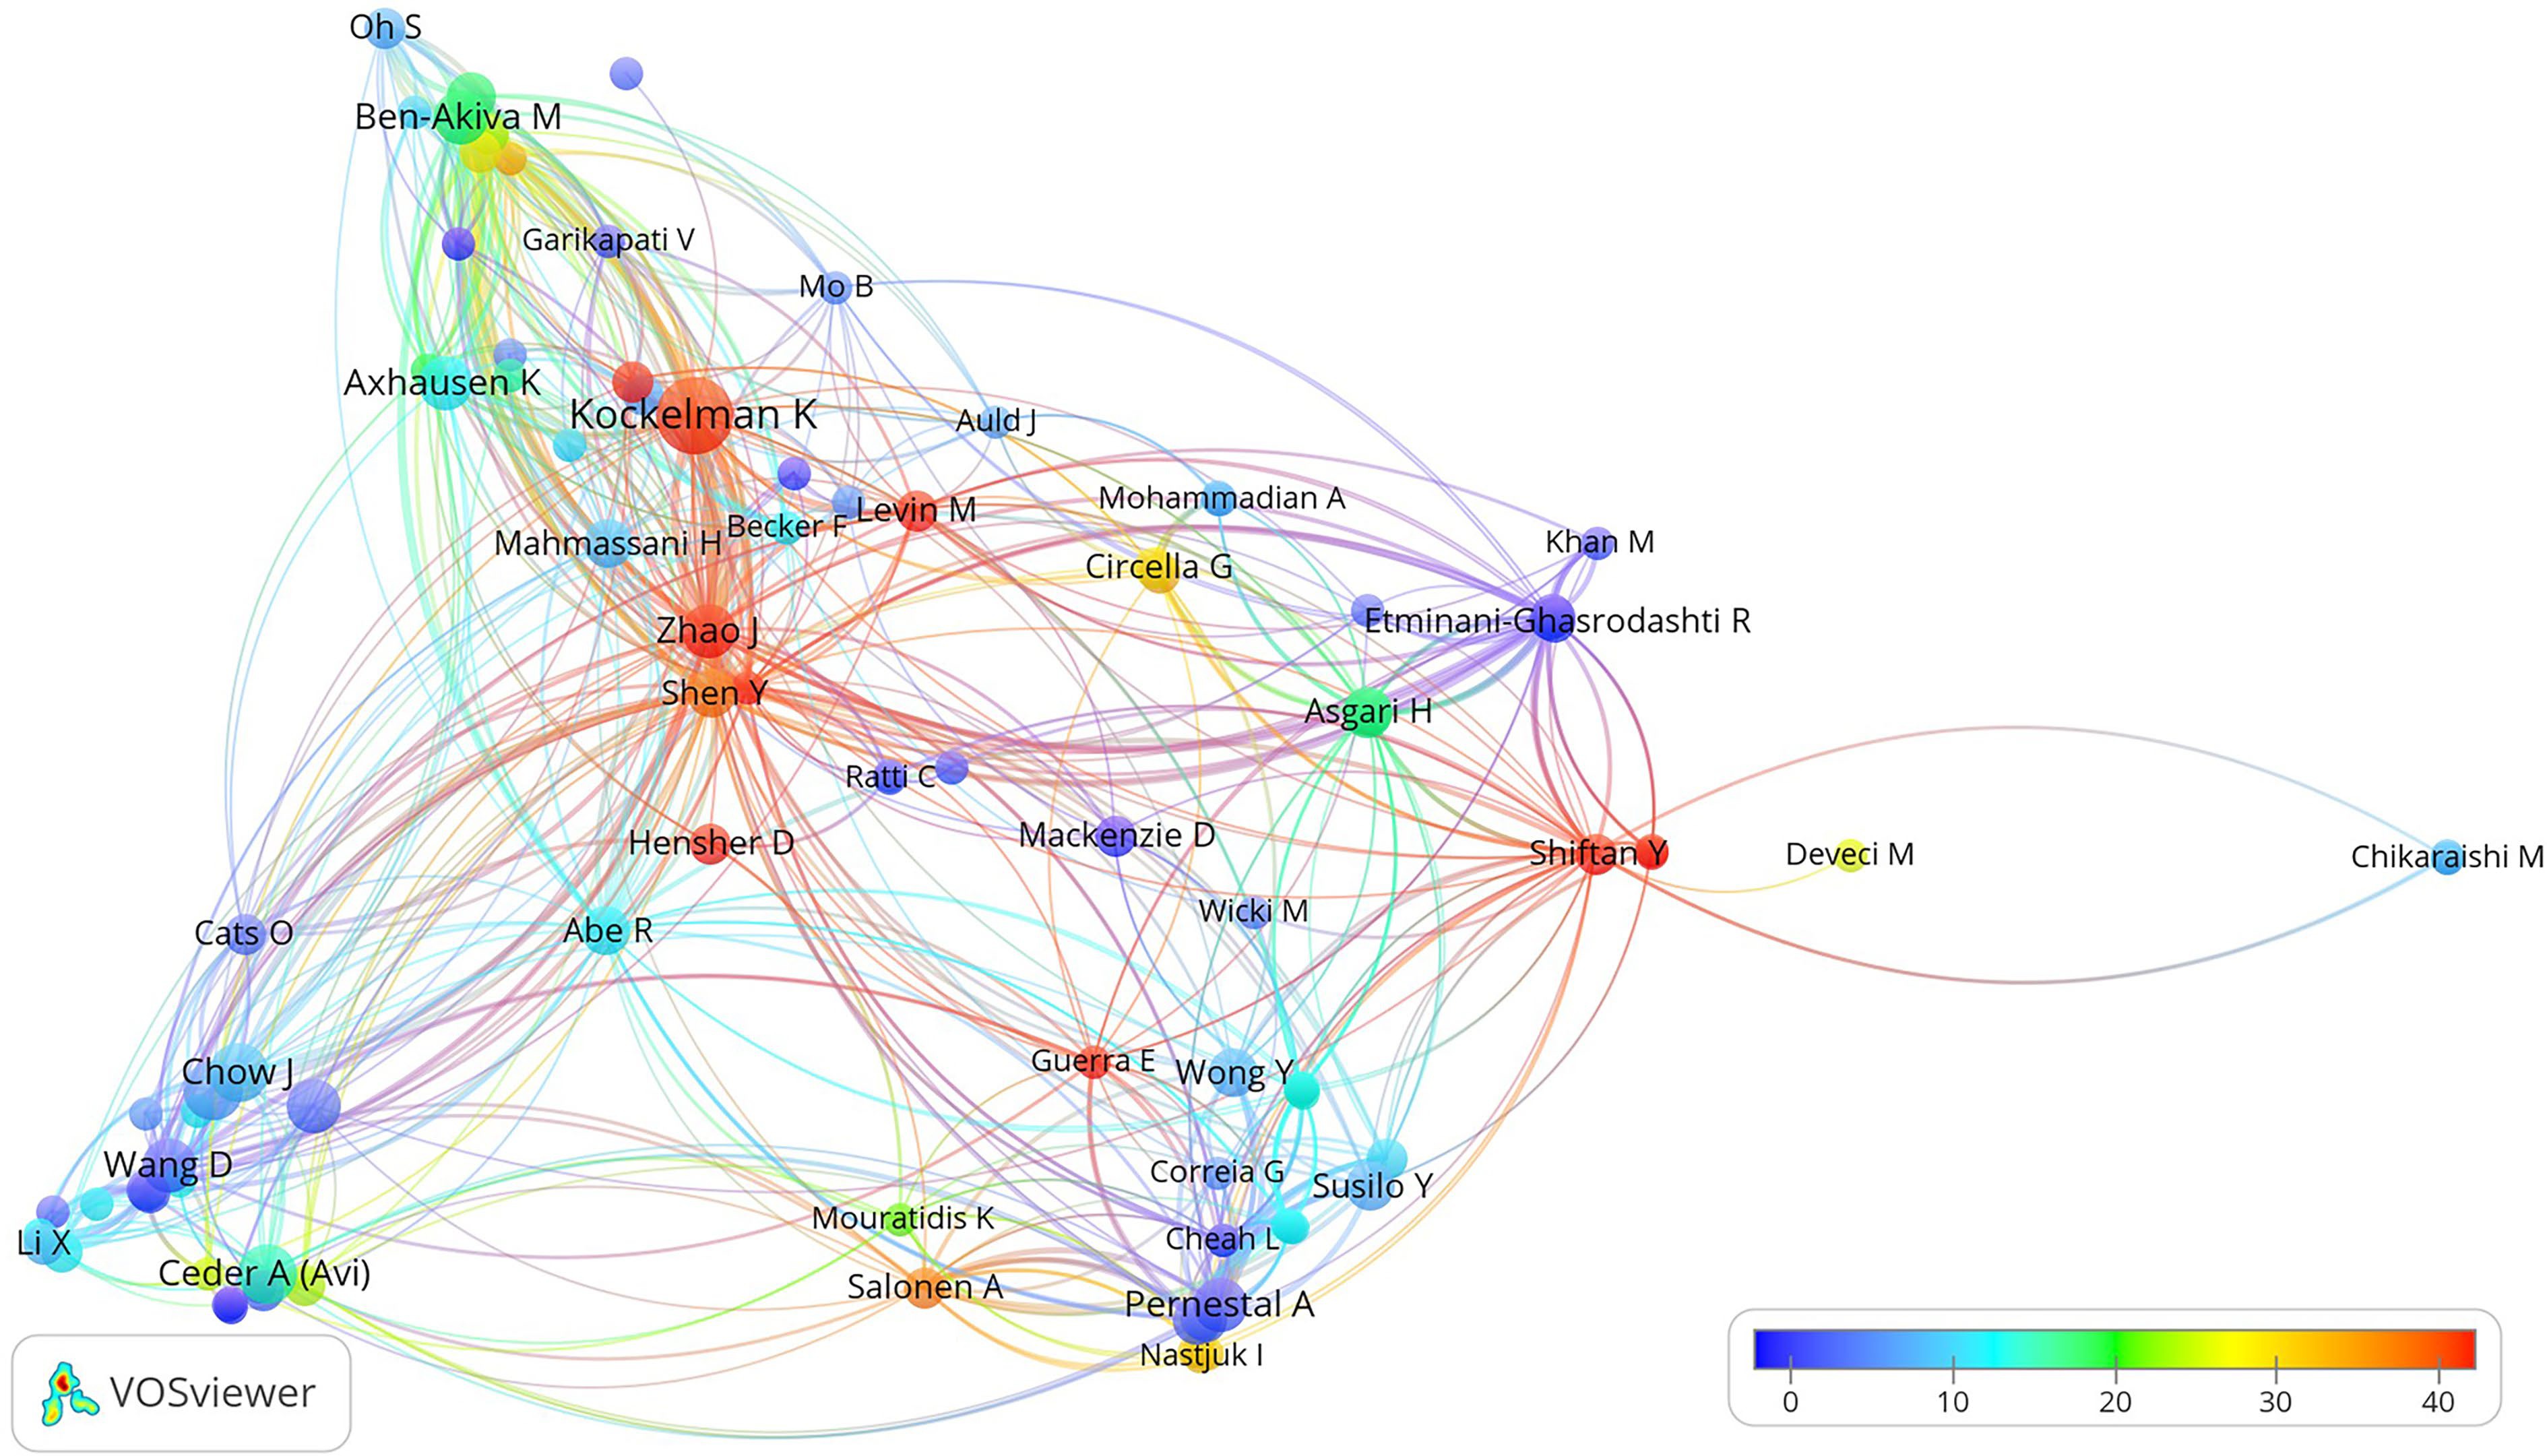
      Figure 3. 

      Relationship among various authors.

      In Fig. 3, the size of the nodes shows the number of papers published by the authors, the color of the nodes indicates the number of citations of each document, and the distance between the nodes indicates the relevance of the scholar to others. Among these authors, the top-10 authors were listed based on the total number of documents and their number of citations, as shown in Table 1.

      Table 1.  Top-10 authors ranked by total documents and citations.

      RankAuthorDocumentsAuthorCitations
      1Kockelman K.10Shiftan Y.416
      2Ceder A. (Avi)6Kockelman K.389
      3Chow J.6Hensher A.247
      4Jenelius E.6Zhao J.225
      5Axhausen K.5Guerra E.219
      6Ben-Akiva M.5Shen Y.146
      7Pernestal A.5Zhang H.139
      8Rau A.5Levin M.136
      9Wang Z.5Acheampong R.130
      10Zhao J.5Cugurullo F.130

      As shown in Table 1, Kockelman, a scholar from the University of Texas at Austin, has published 10 papers and is the author with the most publications. The three subsequent scholars published six papers each, i.e., Ceder A. (Avi) from the University of Auckland, Chow J. from New York University, and Jenelius E. from the KTH Royal Institute of Technology. Despite authoring four documents, Shiftan Y. from the Israel Institute of Technology ranked first with 416 citations. Professor Zhao J. from MIT and his associates Shen Y. and Zhang H. et al. contributed significantly to the field of autonomous bus services, with an average of over 40 citations per paper. In addition, as shown in Fig. 3, we discovered co-authorship relationships among 20 scholars.

    • Statistics regarding the origins of the papers showed that 80 journals published articles pertaining to autonomous bus services. Among them, 34 journals published at least two documents and were cited at least once; their connections are shown in Fig. 4. The size of the nodes in the figure shows the number of times each journal was cited, and the color of the nodes shows the average year in which the papers were published by the journal. Moreover, the lines between the nodes indicate mutual citations between journals, where the smaller the distance between two nodes, the higher the number of mutual citations.
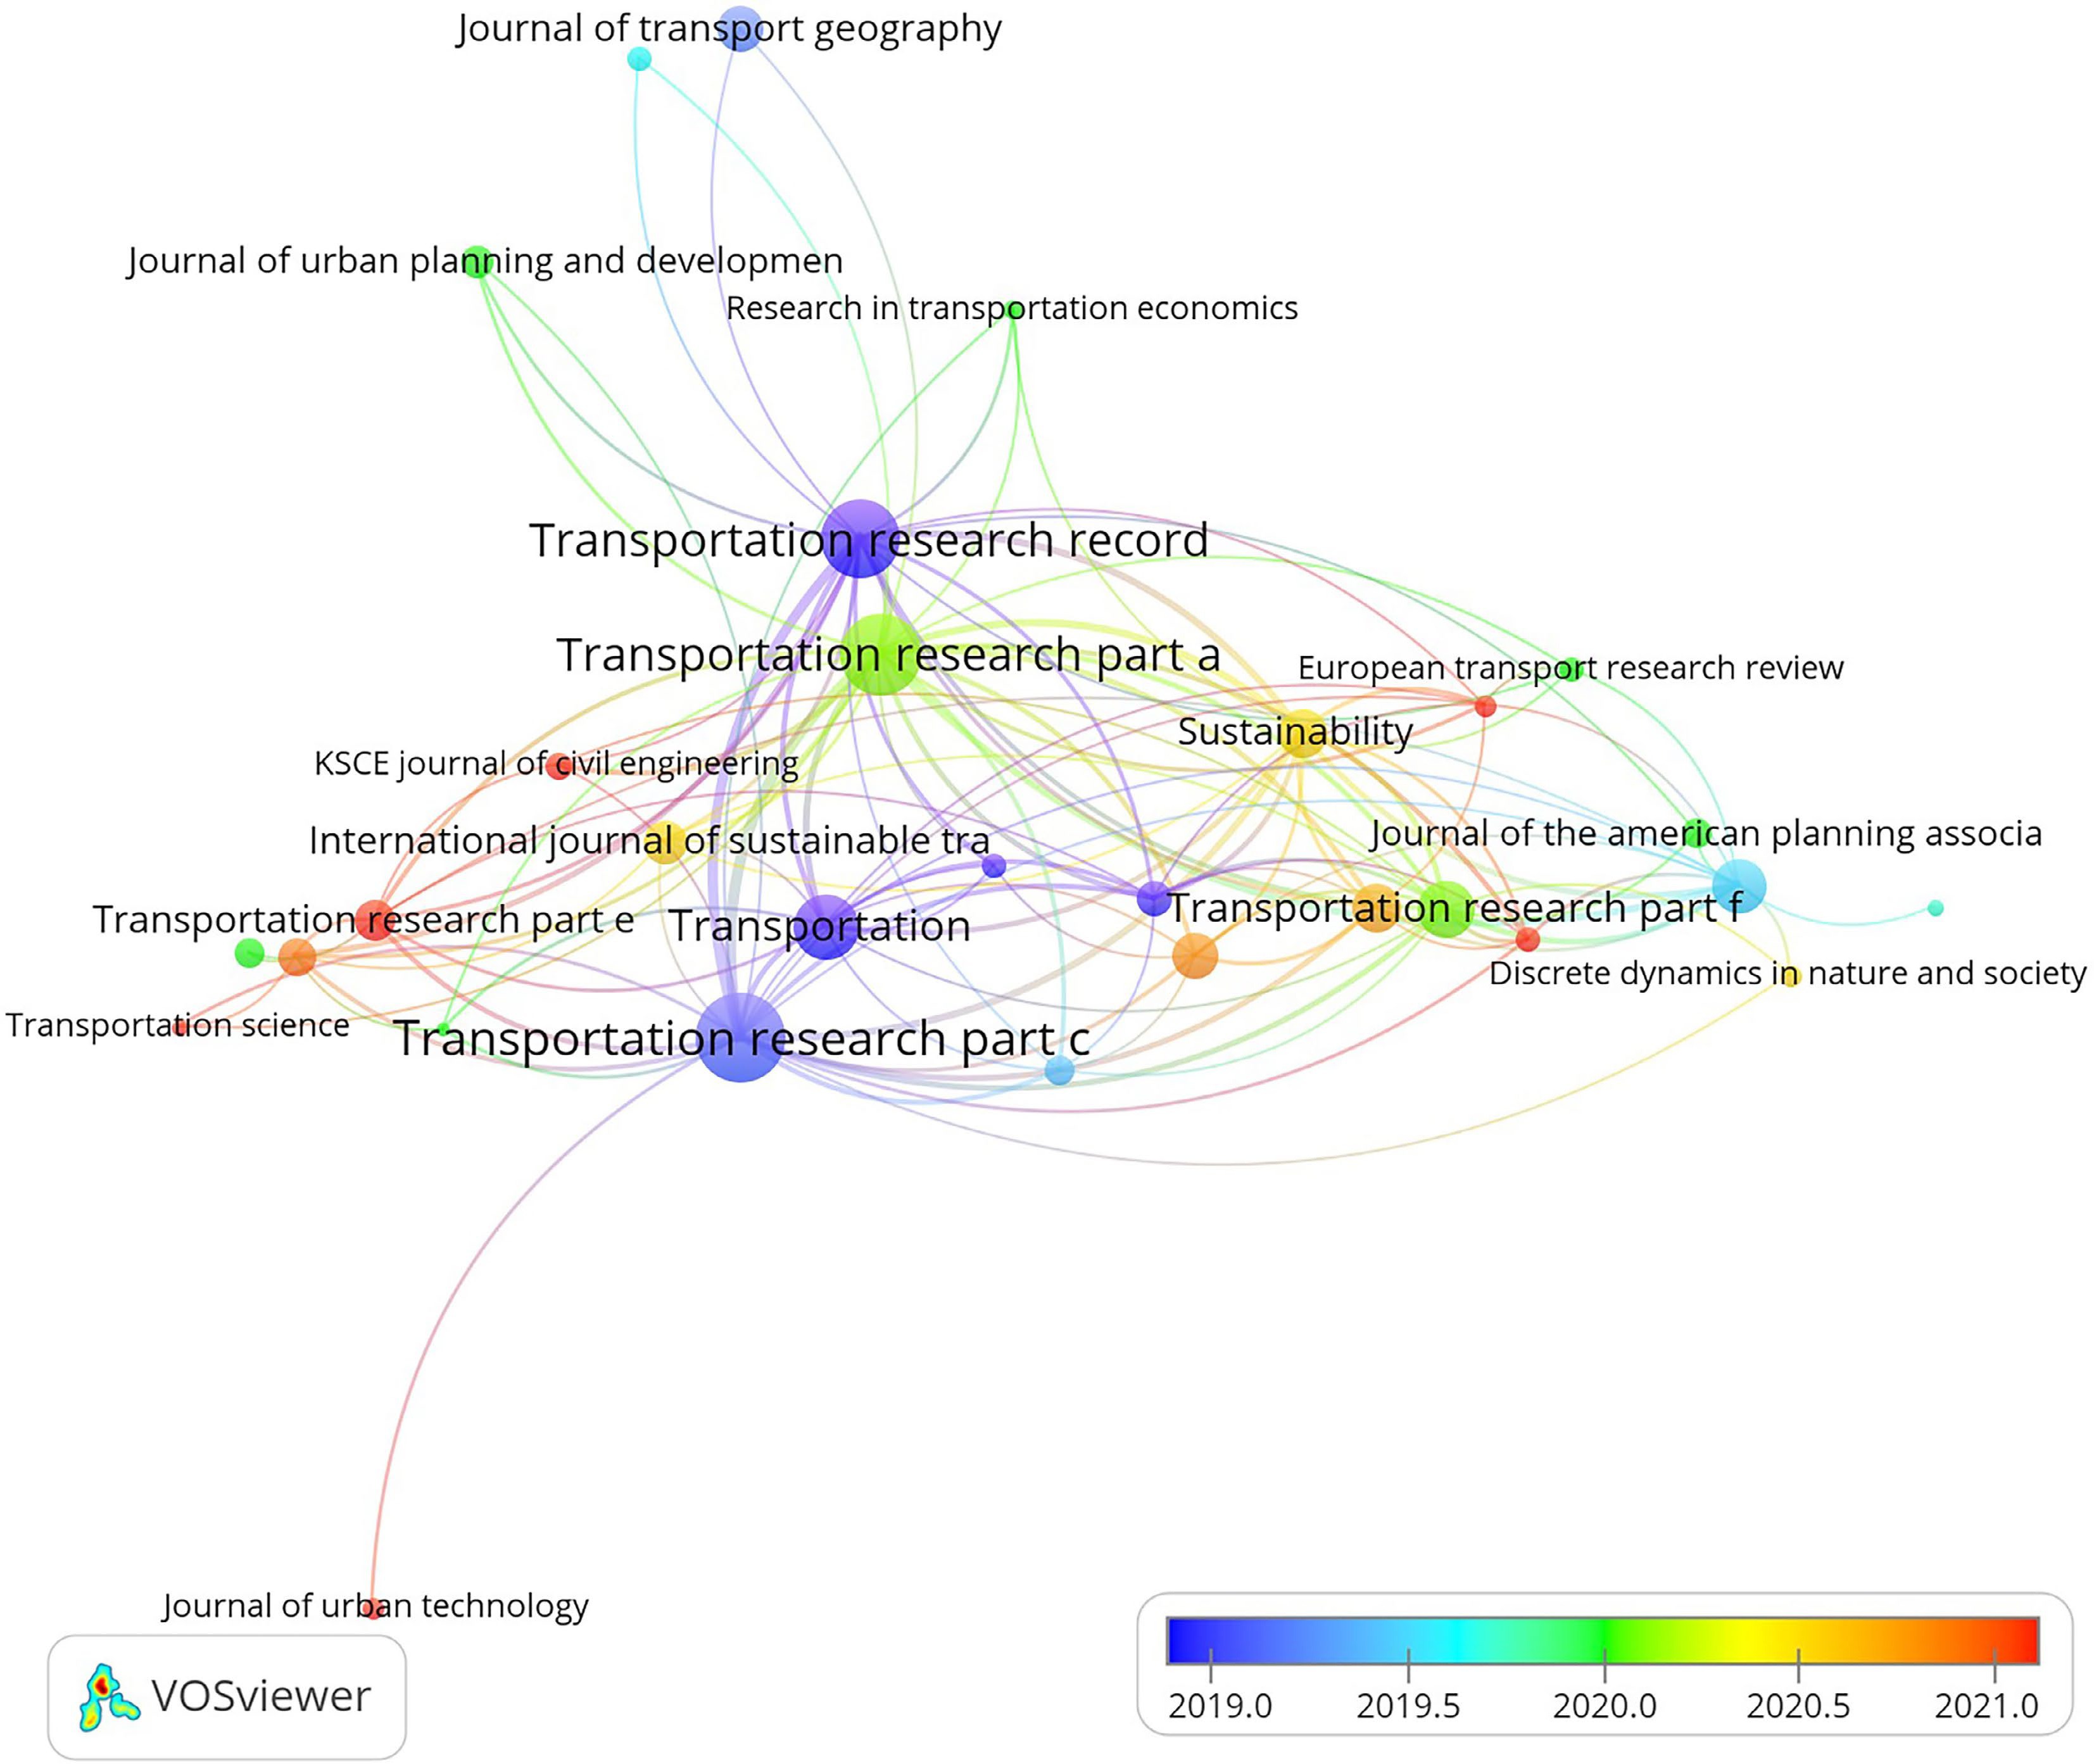
      Figure 4. 

      Connection among various source journals.

      As shown in Fig. 4, these journals are early sources of outcomes regarding autonomous bus services, e.g., Transportation Research Record, Transportation Research Part C, and Transportation. Therefore, these journals indicate a significant number of articles and citations. As shown in Table 2, Transportation Research Record, Transportation Research Part A, and Transportation Research Part C were the top-three journals, with 41, 32, and 30 papers, respectively. Moreover, the high cross-citations between Transportation Research Record and Transportation Research Part A, as well as between Transportation and Transportation Research Part A, indicate that these journals reported highly relevant outcomes. Transportation is the journal that published early outcomes in the field, although the total number of papers was not high. Notably, although only five papers were published in Transportation, the total number of citations was 338, thus rendering it the journal with the highest average citations per document. In addition, the most recent research outcomes in this field were published in Transportation Research Part E, Transportation Science, and the KSCE Journal of Civil Engineering. The scope of these journals and the increase in the number of papers published show that research pertaining to autonomous bus services has progressed from the initial stages of acceptability, feasibility, planning, and design to the more complex aspects of service optimization.

      Table 2.  Top-10 journals ranked by total documents and average citations.

      RankJournalDocumentsJournalCitations
      1Transportation Research Record41Transportation67.6
      2Transportation Research Part A32Journal of Transport Geography31.0
      3Transportation Research Part C30Transportation Research Part C29.4
      4Sustainability21Transportation Research Part A22.2
      5Journal of Advanced Transportation12Transportation Research Part F21.4
      6Transportation Research Part F10Transport Policy20.9
      7Transport Policy10Journal of Urban Planning and Development20.0
      8Transportation Research Part D-Transport and Environment9International Journal of Sustainable Transportation18.8
      9Cities8Transportation Research Record15.8
      10Research in Transportation Business and Management7Transportation Research Part D14.8
    • Co-occurrence analysis of keywords is a method to determine the relevance of keywords to each other by observing the frequency of their simultaneous appearance. A total of 1,480 keywords from the 300 documents were analyzed in this study, among which 87 appeared more than five times simultaneously. These 87 keywords formed a network (Fig. 5) that showed the simultaneous appearance of each keyword and how they were related. The size of the nodes in the figure indicates the number of times a keyword appears, and the same-colored nodes indicate that these keywords exhibit high relevance and can be classified into a cluster.
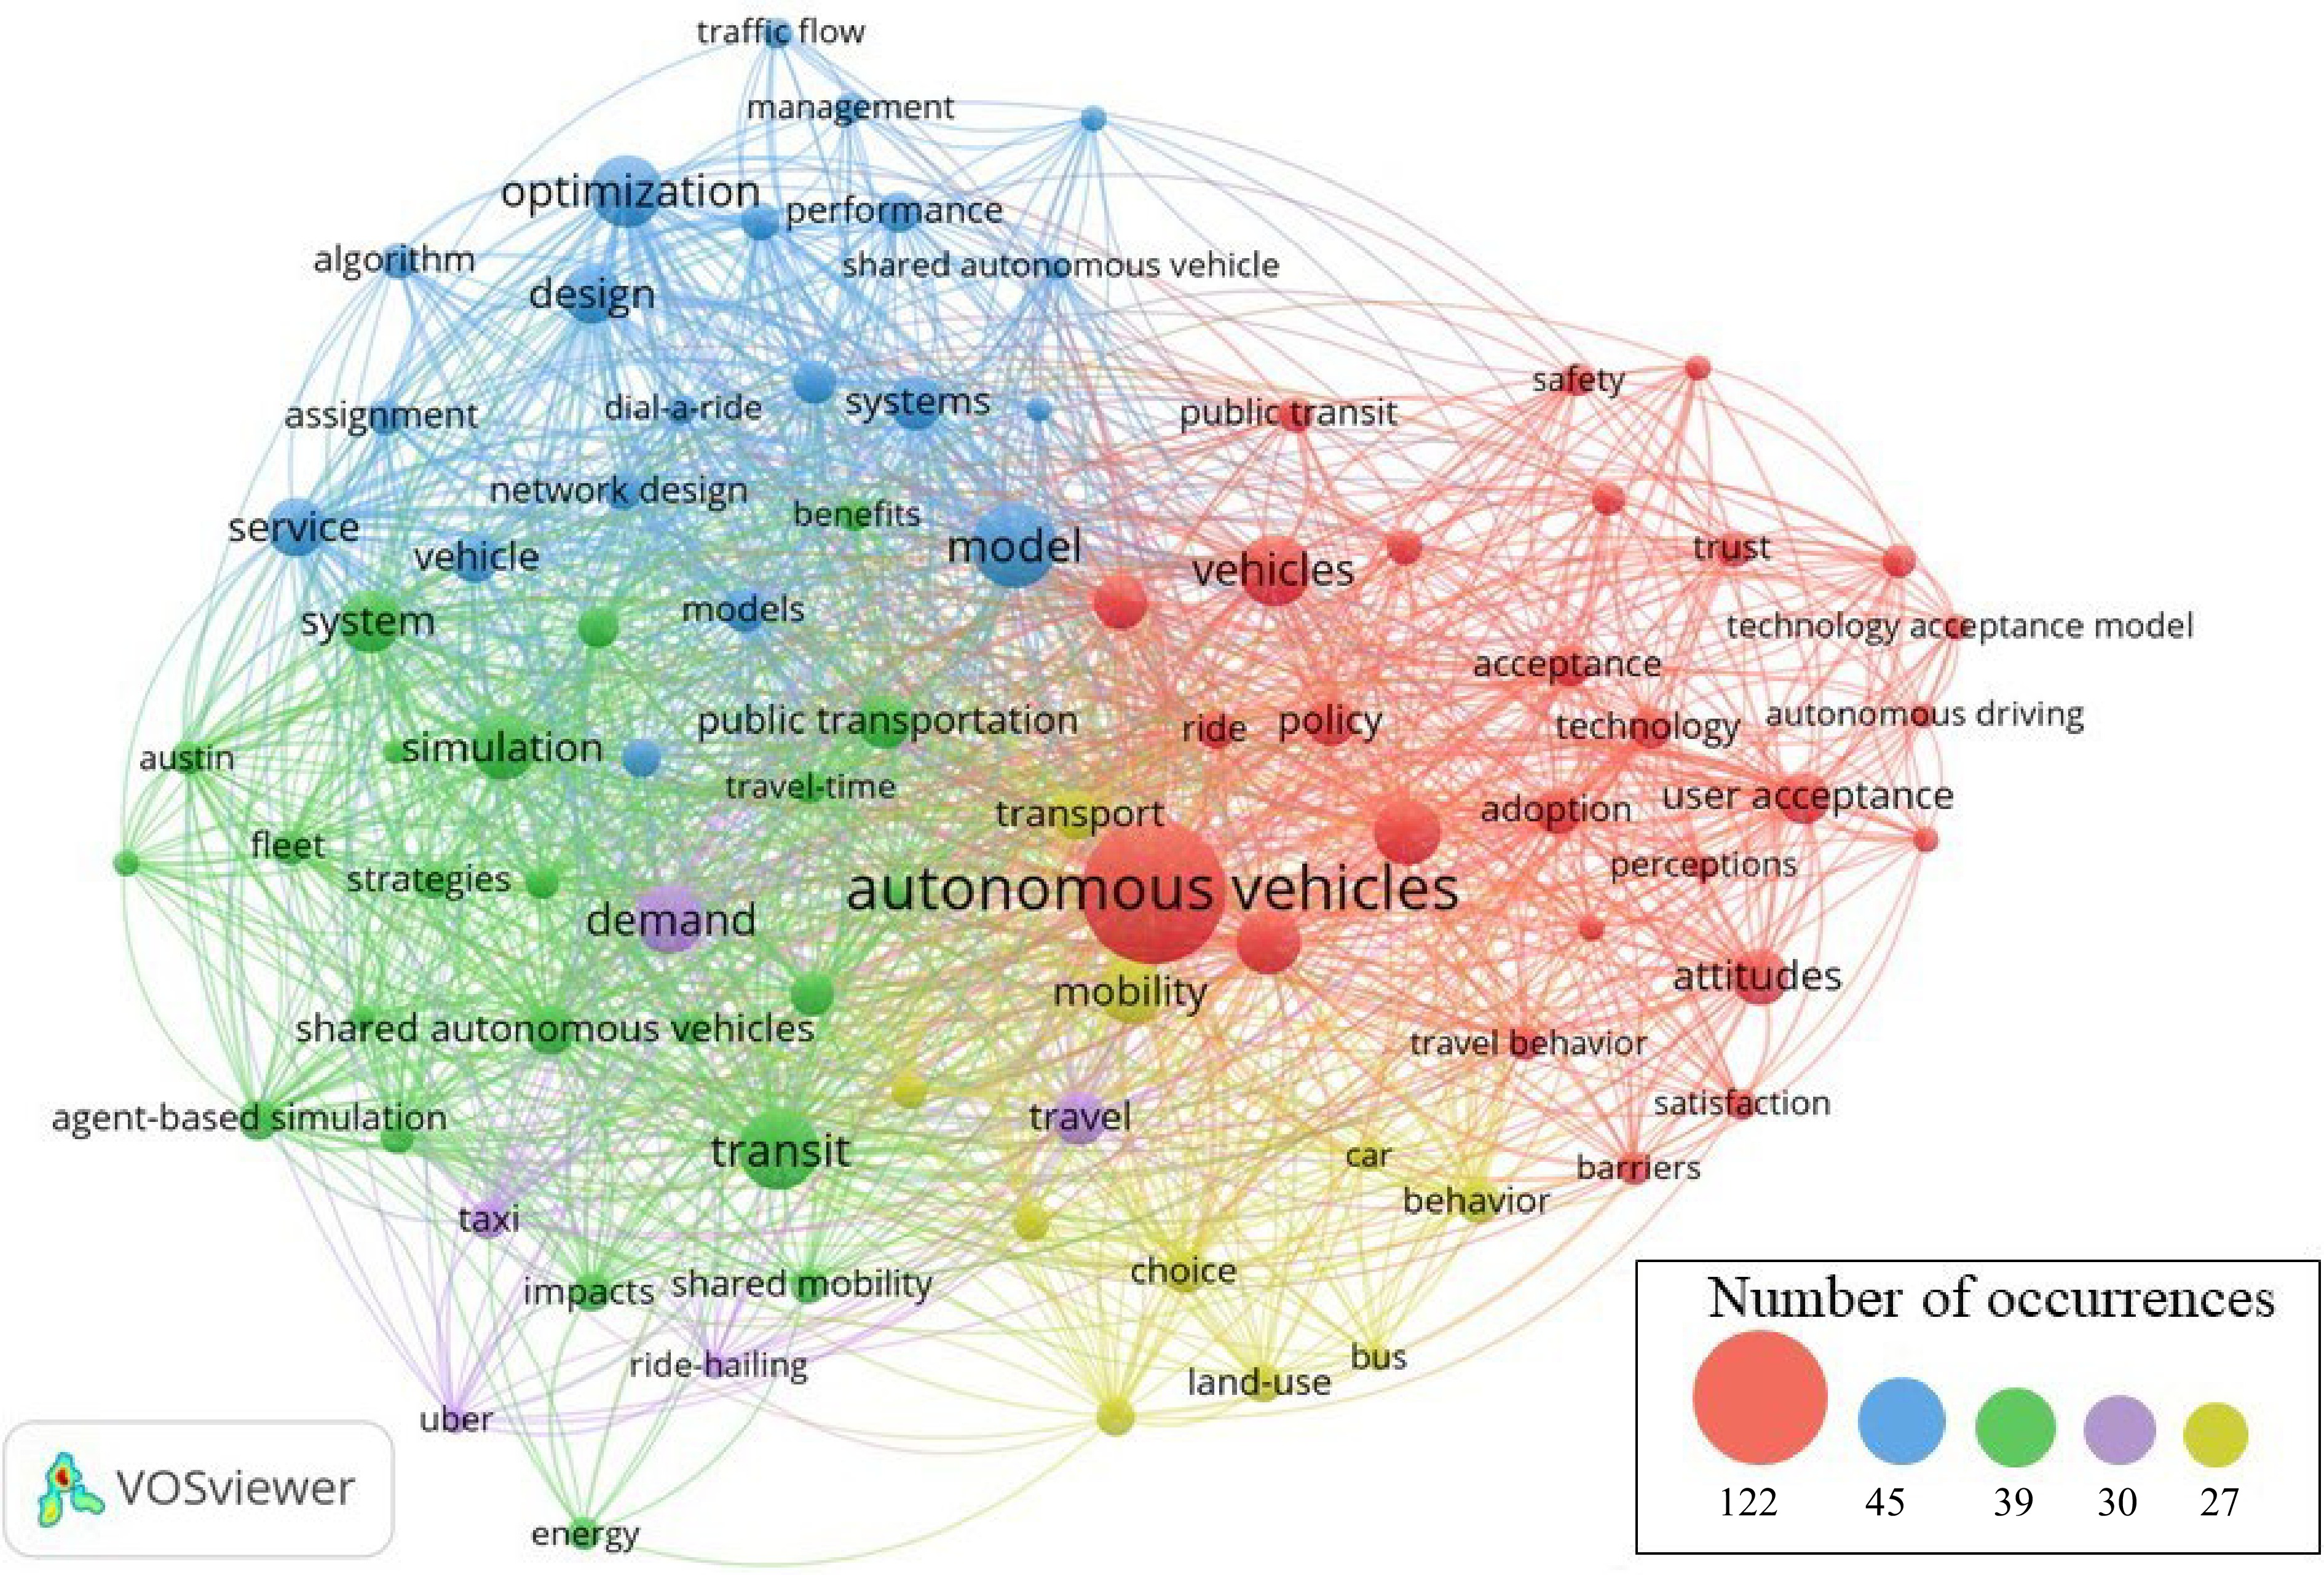
      Figure 5. 

      Co-occurrence of keywords.

      As shown in Fig. 5, the keywords related to autonomous bus services can be classified into five main categories: Cluster 1 (red) is primarily about users' attitudes, such as perception, safety, attitudes, concerns, and acceptance toward the service. Cluster 2 (blue) primarily focuses on optimization models, algorithms, and network designs for service systems. Cluster 3 (purple) pertains to the demand for the service and its effect on other services, such as taxis, Ubers, and ride hailing. Cluster 4 (green) primarily pertains to the bus fleet, travel time, and simulation model used in the system optimization analysis. Cluster 5 (yellow) focuses on the behavior of services, mobility, and the effect of land use. In the subsequent chapters, these aspects are systematically reviewed separately.

    • Owing to the numerous advantages of autonomous bus services, a pilot demonstration application was first conducted in Spain as a subproject of the CityMobil project in the EU's 6th Framework Program[16]. Subsequently, autonomous bus services were widely applied in more than a dozen countries and regions in the CityMobil2 project of the EU's 7th Framework Program. Alessandrini et al.[6] conducted a generic SP questionnaire in 12 European cities, where the program was implemented to discover the acceptance of travelers toward conventional and autonomous bus services. The findings indicated that if autonomous bus services cannot provide advantages in terms of trip time and pricing benefits compared with conventional bus services, then travelers will not perceive that they are valuable. From a safety perspective, travelers in these cities tend to be suspicious of automated transit services under mixed-traffic conditions. Herrenkind et al.[19] developed a model to analyze the acceptance of 268 German passengers toward autonomous bus services to demonstrate the advantages of the services. They discovered that a combination of personal factors, social effects, and system characteristics determined the passengers' acceptance. Based on an investigation regarding the usage of autonomous bus services in Greece, Papadima et al.[7] suggested that most residents are satisfied with the service and that price, not safety, is an essential factor in deciding whether to use the service. However, based on the findings of a survey conducted by Roche-Cerasi[14] among 1419 members of the Norwegian Automobile Federation, most individuals were concerned about the safety of autonomous bus services in mixed traffic flows and did not believe that the services offered significant advantages. Unfamiliarity with autonomous bus technology may be a primary factor affecting its acceptance by the general population. According to a field survey of 942 tourists in Germany before and after traveled on an autonomous minibus, Bernhard et al.[9] discovered that most of them were satisfied with the service and that the first-riding experience significantly affected their acceptance of the service.

      Based on quantitative travel cost data in Japan, Abe[4] discussed the effect of autonomous bus services on metropolitan transportation systems and demonstrated their potential benefits in reducing passenger travel costs and improving transit accessibility. Sun et al.[12] conducted a survey regarding autonomous bus services in Singapore, which revealed increased service efficiency and decreased total cost of ownership. Moreover, passengers' choice of bus service is significantly determined by travel time and cost, with the latter imposing greater effect. Based on actual travel demand data for Fuyang City in Zhejiang Province, China, Zhai et al.[20] developed an agent-based simulation model to evaluate the effectiveness of autonomous bus services. The results showed that the service required less road space, demonstrated more effective use of bus vehicles, adapted to changes in bus travel demand, and was financially viable. A performance assessment of fixed-route and door-to-door feeder bus services, conducted by Badia & Jenelius[21], revealed that autonomous buses significantly affected service strategies under various technological development scenarios. When autonomous bus technology is sufficiently mature, it can significantly expand the applicability of door-to-door transit services. Using business data before, during, and after the operation of an autonomous bus service in Las Vegas, Kim et al.[11] discovered that employment, education level, and residential employment opportunities significantly affected the preference toward the service and that the service can increase business activity in older, declining downtown areas.

      Salonen[13] performed a study on 197 autonomous bus passengers in the Netherlands and showed that the driving safety of autonomous buses was higher than that of regular buses, although passengers felt much less safe inside the vehicles. An analysis of 891 respondents in Philadelphia, USA by Dong et al.[22] revealed that when an employee was on board to oversee the operation or aid, most respondents were willing to ride self-driving buses; otherwise, only 13% indicated willingness. Kassens-Noor et al.[15] surveyed people in Michigan (USA) and discovered that autonomous bus services may attract more travelers. However, approximately one-half of the respondents mentioned they were unsure of reusing the service because they were concerned about safety and did not trust driverless technology. Based on a survey of 1062 respondents in Spain conducted by Rosell & Allen[8], passengers with higher socioeconomic status were more satisfied with autonomous bus services and more willing to reuse them, whereas women were less inclined to ride autonomous buses without employees.

      Weschke et al.[23] conducted a Wizard-of-Oz experiment to determine the likelihood of passengers accepting autonomous bus services. They discovered that the services improved feeder trips, whereas travelers wished to be the only ones on the bus and would rather seek services in real time than reserve ahead of travel. Mouratidis & Cobeña Serrano[24] utilized a mixed methodology comprising surveys and interviews to analyze the feedback of passengers before and after they traveled on an autonomous bus and whether they intended to use the service in the future. The findings indicated that most passengers were satisfied with the service and preferred more frequent departures, more rapid vehicle speeds, less abrupt braking, and the presence of employees in the vehicle. An analysis of survey data from Lincoln City in the United States by Piatkowski[25] revealed that autonomous bus services complemented the current bus service system and that the riders' willingness to use the services depended on their age, whether they worked downtown, and their opinion regarding the service. Guo et al.[26] developed a mixed-logit model based on stated-choice experiments in Sweden to determine how passengers select between autonomous and conventional bus services. The findings indicated no significant difference in the selection behavior of these two services under normal conditions; however, the passengers were unwilling to select the autonomous bus service owing to its quality and dependability under unsatisfactory weather conditions. By performing structural equation modeling, Yan et al.[10] analyzed 576 Chinese passengers with experience riding autonomous buses. Empirical research indicates that the presence of a driver, in-vehicle safety, service quality, and good attitude toward the bus positively affect service reuse, whereas road safety does not impose any direct effect. Utilizing survey data from three different time points, Zhao et al.[27] investigated the dynamic characteristics of passenger acceptance toward an automated bus service over time. They discovered that service comfort, frequency, and travel time were crucial in determining whether passengers would continue to use the service. Guo et al.[28] performed structural equation modeling to investigate the acceptance of Stockholm residents toward autonomous bus services on public roadways in a mixed-traffic environment. The findings indicated that the adoption of this service was primarily determined by travel demands and user requirements instead of individual behavioral intentions. The literature related to users' attitudes is summarized in Table 3.

      Table 3.  Summary of literature related to users' attitudes.

      CategoryRepresentative studiesData sourceAnalysis approach
      AcceptanceAlessandrini et al. (2016)[6]Questionnaire interviewCopula-based logit
      Herrenkind et al.(2019)[19]Online questionnaireStructural equation model
      Roche-Cerasi (2019)[14]Questionnaire interviewDescriptive statistics
      Papadima et al. (2020)[7]Online questionnaireConjoint analysis
      Bernhard et al. (2020)[9]Questionnaire interviewDescriptive statistics
      PerformanceAbe (2019)[4]National trip survey in JapanDescriptive statistics
      Sun et al. (2020)[12]Questionnaire interviewMixed logit
      Zhai et al. (2020)[20]Travel demand from ZhejiangAgent-based simulation
      Badia and Jenelius (2021)[21]Virtual operation dataContinuum approximation
      Kim et al. (2022)[11]3-year business license dataGeneralized linear mixed-effect regression
      PerceptionSalonen (2018)[13]Questionnaire interviewDescriptive statistics
      Dong et al. (2019)[22]Online questionnaireMixed logit
      Kassens-Noor et al. (2020)[15]Questionnaire interviewLogistic regression
      Rosell and Allen (2020)[8]Questionnaire interviewStructural equation model
      PreferenceWeschke et al. (2021)[23]Questionnaire interviewMixed logit model
      Mouratidis and Serrano (2021)[24]Questionnaire interviewDescriptive statistics
      Piatkowski (2021)[25]Questionnaire interviewOrdered logistic regression
      Guo et al. (2021)[26]Questionnaire interviewMixed logit model
      Yan et al. (2022)[10]Questionnaire interviewStructural equation model
      Zhao et al. (2022)[27]Questionnaire interviewStructural equation model
      Guo et al. (2022)[28]Questionnaire interviewStructural equation model
    • Considering that cities are increasingly deploying autonomous buses in their existing bus service networks, scholars have developed numerous optimization models and solution algorithms to assist authorities in devising optimal operational strategies. Cao et al.[29] developed a multi-objective model while considering schedule deviations, travel time, and energy consumption, which was solved using a multi-criteria decision analysis method based on spatiotemporal graphics techniques. Using optimal hold and speed-changing control strategies, they created autonomous bus schedules with no changes. Considering the requirements of both users and operators, Cao & Avi Ceder[30] devised the skip-stop strategy-based strategy for simultaneously optimizing the service timetable and vehicle schedule of autonomous bus services. Using the defect function graph and considering the constraints on vehicle capacity, they developed a multi-decision choice model and solved it via binary-variable iteration. The results indicated that the skip-stop strategy based on real-time passenger demand reduced the travel time and number of vehicles. Considering autonomous buses as sublines, Gkiotsalitis et al.[31] constructed a mixed-integer planning model to investigate the frequency optimization issue to minimize operation and passenger waiting times. Using the autonomous bus models in the VISSIM simulation platform, Zhang et al.[32] performed case studies to compare the reductions in emissions and energy use for managed and dedicated bus lane strategies. To combine the optimized routes and charging schedules of autonomous buses, Wang et al.[33] developed a constraint programming model with Boolean satisfiability conditions and evaluated the best routes and charger allocation schemes under various constraint scenarios. Zhang et al.[34] constructed a mixed-integer linear program to investigate the lane deployment issues for three travel modes (connected and autonomous buses, connected and autonomous passenger vehicles, and human-driven passenger vehicles) in a transportation network. They insisted that deploying dedicated lanes for autonomous buses would significantly increase the number of passengers and the total benefits to society. Hatzenbühler et al.[35] designed a multi-objective optimization and multi-agent simulation framework to investigate the network design of autonomous bus services under two strategies, i.e., user-centric and operator-centric strategies, to achieve a higher potential travel demand.

      Although the application of autonomous buses on a large scale offers considerable benefits, it cannot be accomplished immediately because of financial constraints and uncertainties in the evolution of driverless technology. Based on fluctuations in passenger demand, Dai et al.[36] constructed an integer nonlinear programming model to jointly optimize the capacity and scheduling of systems with autonomous and conventional buses. The bus capacity was varied by assembling or disassembling multiple autonomous minibuses and adjusting the operating time based on forward and backward headways to simultaneously reduce operational and passenger costs. To determine the best fleet size for autonomous buses and distribute vehicles across multiple bus lines, Tian et al.[37] constructed a mixed-integer stochastic programming model reformulated using a quadratic transform with a linear alternating algorithm. Hatzenbühler et al.[38] performed a dynamic transit allocation and developed an operation simulation model to investigate the effect of service frequency and vehicle capacity on the sequential deployment of autonomous buses in a line. Considering passenger acceptability, Tian et al.[39] established a mixed-integer nonlinear model to minimize trip costs to optimize the deployment of autonomous buses on bus lines at various phases. Zhang et al.[40] constructed a generalized operational cost model that accounted for the effects of passenger wait time, ride time, operating cost, and capital cost under various scenarios to determine the parameters that affect the service efficiency provided by autonomous buses.

      Recently, owing to advancements in information, communication, and vehicle-road collaboration technologies, several scholars have developed innovative service models using modular autonomous buses. By applying an enhanced deficit function theory, Liu et al.[41] devised a technique to precisely estimate the minimal size of modular autonomous buses required to satisfy the actual demand for public transit trips. Wu et al.[42] proposed a modular autonomous bus system with dynamic transfer strategies to satisfy time-fluctuating traffic demands and constructed a two-stage model to optimize the design of passenger transfer plans and vehicle travel trajectories. Dakic et al.[43] investigated a modular autonomous bus unit combination and scheduling optimization issues based on a three-dimensional macroscopic fundamental diagram to minimize the overall cost of the service system. Based on passenger demand at different periods, Tian et al.[44] constructed a mixed-integer nonlinear program to investigate the optimization of modular autonomous bus stop locations, stop capacities, and vehicle formations, thus demonstrating the benefits of the service in reducing the total cost to operators and passengers. The literature related to operations is summarized in Table 4.

      Table 4.  Summary of literature related to operations.

      Vehicle categoryOperation ObjectivesSolution approachRepresentative studies
      Autonomous busTimetableTime-space graphical techniquesCao et al. (2019)[29]
      Timetable and vehicle scheduleGA combined with binary variable iterationCao & Ceder (2019)[30]
      TimetableMixed-integer linear programGkiotsalitis et al. (2022)[31]
      Emission and energySimulation modelZhang et al. (2020)[32]
      Route and recharge
      schedule
      Constrained programWang et al. (2021)[33]
      Dedicated lanesMixed-integer nonlinear programZhang et al. (2022)[34]
      NetworkMulti-objective optimizationHatzenbühler et al. (2022)[35]
      Autonomous and
      conventional bus
      Schedule and capacityMixed-integer nonlinear programDai et al. (2020)[36]
      FleetMixed-integer stochastic programTian et al. (2021)[37]
      DeploymentDynamic assignment and simulation modelHatzenbühler et al. (2020)[38]
      DeploymentBi-level optimizationTian et al. (2022)[39]
      Semi- and fully-
      autonomous bus
      Generalized costMixed-integer nonlinear programZhang et al. (2019)[40]
      Modular autonomous busFleetGraphical methodLiu et al. (2020)[41]
      TransferTwo-stage modelWu et al. (2021)[42]
      Vehicle scheduleThree-dimensional macroscopic fundamental diagramDakic et al. (2021)[43]
      Station locationMixed-integer nonlinear programTian et al. (2022)[44]
    • Studies regarding users' attitudes related to autonomous bus services focus on four primary categories: acceptance, performance, perception, and preferences. Most of the data in these studies was primarily derived from questionnaires, which can be obtained via interviews or online surveys. Only a few studies utilized data derived from travel demands or operational information. Descriptive statistics were the most commonly used method to analyze the data. To quantitatively resolve the potential effects of various factors, some researchers used structural equations and mixed logit models for their analyses. Additionally, researchers developed copula-based logit models to determine the relationship between certain factors.

    • Evaluating the adoption of autonomous bus services among various passengers can provide authorities with adequate prior knowledge for developing effective management strategies. However, studies regarding the acceptance of autonomous bus services yielded inconsistent results. This may be because the questionnaire design, respondent selection, and survey process varied across case areas. Therefore, a critical direction for future research is to obtain robust and unbiased analytical conclusions by designing more comprehensive questionnaires, selecting more representative respondents, and implementing more standardized survey processes. Moreover, based on behavioral theory, the relationship between passenger perceptions and behavioral intentions can evolve over time. In future research, comprehensive longitudinal studies should be conducted to determine whether specific policies substantially affect travelers' acceptance of this unique service mode.

    • Implementing autonomous bus services presents an essential opportunity for authorities to develop more efficient and inclusive transit services. In low-density travel demand areas, autonomous bus services can further enhance the efficacy of flexible services while substantially decreasing operational costs. However, the current performance evaluation of autonomous bus services focuses on cases in specific social contexts, thus inducing substantial divergence in evaluation metrics and rendering it challenging to obtain generally accepted conclusions. Therefore, a potential improvement trend is to identify comprehensive and standardized metrics, including personal characteristics, social effect, time value, space value, and service quality, as well as to construct more advanced hybrid analytical models to provide comparable evaluation outcomes. Moreover, few studies have assessed the implementation of autonomous bus services under various subsidy policy scenarios. Another issue that requires further study is the method to achieve synergy between autonomous bus services and arterial high-capacity transit services in high-density travel demand areas.

    • The perception of autonomous bus services can aid authorities in developing and implementing targeted management strategies. However, as passengers become more experienced with the service, their perceptions may change, rendering the previous outcomes impractical. Therefore, the temporal stability of service perceptions must be investigated comprehensively to support transit agencies in dynamically adjusting management policies in response to passengers' attitudes. Moreover, the findings revealed substantial variations in the parameters affecting passenger perceptions of the quality of automated bus services across regions. This suggests that further investigations regarding the complicated relationships among service characteristics, traveler attributes, service perceptions, travel demand, and behavioral choices are required to provide a theoretical foundation for establishing targeted management strategies.

    • Most passengers desire autonomous buses to enhance travel efficiency and service comfort. Thus, further advances in automation technology are required to enable higher travel speeds and prevent unexpected abrupt braking without sacrificing safety. Moreover, contradictory outcomes have been reported from various studies about service preferences. For instance, some scholars insisted that most respondents were eager to select the service, whereas other case studies in Northern Europe showed that passengers exhibited a negative attitude toward it. This contradiction may be due to the varying demands of passengers in each region and the culture for bus services or because these studies were conducted during different periods. In the prior survey, respondents might not be familiar with autonomous technology and thus were less inclined to accept the service. However, in more recent studies, the respondents were the most cognizant of the service and preferred to select it. In future studies, the service's long-term effects on passenger preferences and their heterogeneity across different regions and social environments should be investigated.

    • Various mathematical models have been developed to determine the optimal operational strategy for autonomous bus service systems. The findings primarily focused on timetables, fleets, vehicle scheduling, and bus networks.

    • In general, autonomous buses can generate timetables based on real-time travel demands. Thus, the flexibility of autonomous bus services might mitigate the effect of fluctuating uncertainty in travel demand, thus offering passengers dependable, efficient, and attractive services and consequently decreasing the overall operating costs. The combined optimization of timetables and vehicle scheduling for autonomous buses can further reduce the resources of users and operators. However, the collaborative optimization of autonomous bus service networks and timetables is generally a multi-objective issue that should account for the effects of multiple stakeholders concurrently. The intricacy of the issue renders it challenging to obtain globally optimal solutions for multiple goals within an acceptable computation time for large-scale road network scenarios. Thus, the quality of the solution relies significantly on the allowable calculation time and typically necessitates a trade-off between the issue size and the number of optimization parameters. Future studies should focus on enhancing various optimization algorithms and increasing computing efficiency to obtain comprehensive solutions.

    • Current studies regarding autonomous bus fleets generally assume that vehicle volumes are consistent. In the future, the capacity, speed, and cost implications of multiple vehicle types should be considered. Additionally, the study of autonomous bus services from a single bus line should be expanded to that of a network with multiple stops, i.e., where passenger flows interact between more than two bus lines; furthermore, a method to synchronize the services on different lines should be devised. Notably, findings from passenger surveys indicate that in-vehicle time, waiting time, travel time, and fares are significant factors that affect the demand for public transit travel. Therefore, to construct more detailed and realistic demand models and network structures, future studies should comprehensively consider the effect of time-varying travel demand on service optimization.

    • Owing to the uncertainty in vehicle acquisition costs and driverless technology, integrating autonomous bus services into existing public transit systems may require in-depth and systematic studies of large-scale schedule strategies. If the deployment of autonomous buses is required in a large-scale zone, then the replacement sequence of conventional buses with autonomous buses over a long-term horizon must be investigated. Scholars have proposed several optimization models to support authorities in deciding schedule options for autonomous bus services in existing transit networks. When more actual operational data becomes available, the schedule program for autonomous bus services can be determined by considering more detailed influencing factors, such as passenger attitudes, operating costs, ticket structures, and financial subsidies. Moreover, most previous studies have focused on the appropriate deployment strategy for autonomous bus services in existing bus networks, i.e., the effect of the service on costs was evaluated from both operational and travel aspects based on the identified travel demand. In future studies, the advantages of this service mode may be more fully demonstrated if the vehicle schedule is simultaneously re-optimized for the features of autonomous and conventional buses.

    • Based on recent studies, autonomous bus services can significantly reduce operational costs by eliminating driver expenses. Thus, even if the acquisition cost of a vehicle is considerable, the service exhibits significant potential to benefit both passengers and operators. Moreover, the service may enhance bus service quality by enabling authorities to dynamically modify timetables based on fluctuations in travel demand, thereby reducing the average passenger wait time at stops. However, owing to the commercial speed of driverless technology, a lengthy transition process is required before autonomous bus services can be realized. Thus, considering the significance of in-vehicle safety for passengers, authorities must evaluate the possibility of semi-autonomous bus services with employees in the vehicle until driverless technology is developed completely. Hence, we should focus on issues related to semi-autonomous bus services in the transition phase, e.g., replanning the bus network and implementing reasonable vehicle allocation and staff scheduling.

    • Modular autonomous buses provide a new perspective and high flexibility in bus scheduling systems, which allows the departure frequency and allocation of vehicle resources to be improved, thus decreasing the total operating costs. The service mode enables a dynamic capacity design, i.e., rapid and automatic assembly or disassembly into buses of specific capacities depending on the fluctuating passenger demand on various routes. Thus, it can further enhance the operational efficiency of the transit system and minimize operating costs by simultaneously optimizing vehicle capacity and scheduling timetables. Despite its numerous advantages, this service mode remains at the theoretical research stage. In the future, to achieve widespread promotion and application, substantial studies will be required in many operational scenarios, such as extreme weather environments, vehicle breakdown issues, and in-vehicle safety. Realizing the dynamic connectivity of vehicle dispatch across multiple routes is another issue. Based on assembly operations, modular vehicles driving on the same road can be formed into one high-capacity bus, thereby improving capacity utilization. Similarly, through disassembly operations, the bus may be classified into multiple modular vehicles based on the passenger's destination, thus eliminating numerous transfers between bus lines and enhancing service efficiency. However, considering the highly random boarding and alighting demands in time and space, the service for picking up and dropping off passengers is complex and challenging. In particular, for road sections with insufficient space or congested traffic flow, stopping according to the designated requests of all passengers may be impossible. Thus, based on passenger origin and destination information, future studies on the joint optimization of assembly or disassembly operations with intersection management control may provide additional advantages. Therefore, this innovative service mode must be investigated comprehensively before it can be extensively applied. Moreover, in the future, extending the service to more complex regional network scenarios and combining assembly/disassembly operations with more fine-grained operations management strategies (e.g., timetable, skip stops, bus holding, and dynamic routing) is essential.

    • In the past decade, owing to the rapid development of advanced technologies such as sensing, communication, intelligence, and computation, driverless technology has become increasingly mature; consequently, numerous pilot projects for autonomous bus services worldwide have been proposed. To fully comprehend the benefits and disadvantages of this new service mode and guide future development, we conducted a bibliometric analysis and systematic evaluation of 300 publications in various domains of the WoS database using knowledge mapping analytic methodologies. The conclusions inferred from this study are as follows.

      (1) A summary of 300 documents revealed that autonomous bus services were first investigated in 2009, where a significant number of papers were published after 2014. These publications involved 842 authors, among whom Kockelman K. was the author of the most papers, and the most cited scholar was Shiftan Y.

      (2) All papers were published in 80 journals, with the early studies focusing on the service were published in Transportation Research Record, Transportation Research Part C, and Transportation, whereas the more recent ones were published in Transportation Research Part E, Transportation Science, and the KSCE Journal of Civil Engineering. Moreover, studies regarding autonomous bus services can be classified into two groups, i.e., users' attitudes and operation optimization, based on an analysis of 1480 keywords from all documents.

      (3) Acceptance, satisfaction, performance, perception, and preference were the five subfields in users' attitude-related studies. The data were obtained via questionnaires and analyzed using statistical techniques. The results of acceptance indicated that passengers anticipated autonomous bus services to deliver benefits in terms of journey time, cost, and safety under mixed traffic flow conditions. Although the performance evaluation findings of the autonomous bus service showed that the service can reduce travel costs and increase transit accessibility, contradictory outcomes were yielded regarding traveler preferences for the service. The most influential factors affecting passenger preferences were service quality (e.g., frequency of departures, riding comfort, and travel duration), in-vehicle safety, and dependability in inclement weather.

      (4) For the operational optimization of autonomous bus services, scholars have primarily focused on timetables, fleets, vehicle scheduling, and bus networks. Owing to the flexibility of autonomous bus services, dynamically modifying the timetable based on real-time travel demands can provide passengers with attractive travel services. However, owing to the uncertainties in vehicle acquisition costs and driverless technology development, integrating the service into the existing transit system requires meticulous consideration of the deployment sequence and simultaneous optimization of the bus network. Notably, modular autonomous buses can be assembled or disassembled into buses of a specific capacity, depending on passenger boarding or alighting requirements, thus providing a new perspective for the further optimization of transit services.

      The summary of the current findings pertaining to autonomous bus services from both users' attitudes and operational optimization aspects, as well as recommendations for future studies, are provided below:

      (1) Various users' attitude-related case studies yielded contradictory conclusions. To obtain comparable findings, future studies should focus on developing standardized data acquisition techniques such as questionnaire design, respondent selection, and survey processes.

      (2) Owing to the time-varying nature of the relationship between perceptions and behavioral intentions, more longitudinal studies are necessary to determine the effects of specific autonomous bus service policies on travelers in various phases. The effect of cultural and social environmental heterogeneity across regions should be evaluated in future studies.

      (3) Future operations optimization studies should evaluate the effect of various vehicle capacities, speeds, and costs on fleet composition and the expansion of autonomous bus services from specific bus lines to networks based on fluctuating travel demands. Moreover, based on actual operational data, the deployment sequence and transit network must be optimized while simultaneously considering the characteristics of autonomous and conventional buses.

      (4) Owing to the protracted nature of the transition from conventional to fully automated buses, future studies should focus on optimizing semi-autonomous bus services. Extensive studies are necessary to realize the widespread deployment of autonomous modular vehicles under various scenarios. In actual road network environments, assembly or disassembly strategies for modular autonomous buses must be integrated using different fine-grained operation optimization techniques.

      Although the WoS database is an effective literature resource platform, from which we searched for all related papers to the best of our ability, some limitations are presented in the literature review. A few essential documents from other database platforms, such as Scopus, CNKI, and Wanfang Data, were not fully considered. This does not imply the triviality of these publications; instead, performing a bibliometric analysis of literature information from different databases using current knowledge graph analysis tools is challenging. Hence, by reviewing related research from multiple database platforms and considering the evaluation characteristics over stages, future research could provide more comprehensive information regarding current achievements and targeted recommendations for autonomous bus services.

    • The authors confirm contribution to the paper as follows: draft manuscript preparation: Shen J; analysis and interpretation of results: Liu Q; data collection: Ye Z, Jiang W; study conception and design: Ma C. All authors reviewed the results and approved the final version of the manuscript.

    • The data that support the findings of this study are available in the Web of Science (WoS) repository.

      • This research was supported by the Natural Science Foundation of China (No. 51808187, No. 52062027), the Key Research and Development Project of Gansu Province (No. 22YF7GA142), Soft Science Special Project of Gansu Basic Research PIan (No.22JR4ZA035), Gansu Provincial Science and Technology Major Special Project - Enterprise Innovation Consortium Project (No. 21ZD3GA002, No. 22ZD6GA010), Lanzhou Jiaotong University Basic Research Top Talents Training Program (No. 2022JC02).

      • The authors declare that they have no conflict of interest. Jinxing Shen and Changxi Ma are the Editorial Board members of Digital Transportation and Safety who were blinded from reviewing or making decisions on the manuscript. The article was subject to the journal's standard procedures, with peer-review handled independently of these Editorial Board members and their research groups.

      • Copyright: © 2023 by the author(s). Published by Maximum Academic Press, Fayetteville, GA. This article is an open access article distributed under Creative Commons Attribution License (CC BY 4.0), visit https://creativecommons.org/licenses/by/4.0/.
    Figure (5)  Table (4) References (44)
  • About this article
    Cite this article
    Shen J, Liu Q, Ye Z, Jiang W, Ma C. 2023. Autonomous bus services: current research status and future recommendations. Digital Transportation and Safety 2(3):229−240 doi: 10.48130/DTS-2023-0019
    Shen J, Liu Q, Ye Z, Jiang W, Ma C. 2023. Autonomous bus services: current research status and future recommendations. Digital Transportation and Safety 2(3):229−240 doi: 10.48130/DTS-2023-0019

Catalog

  • About this article

/

DownLoad:  Full-Size Img  PowerPoint
Return
Return