-
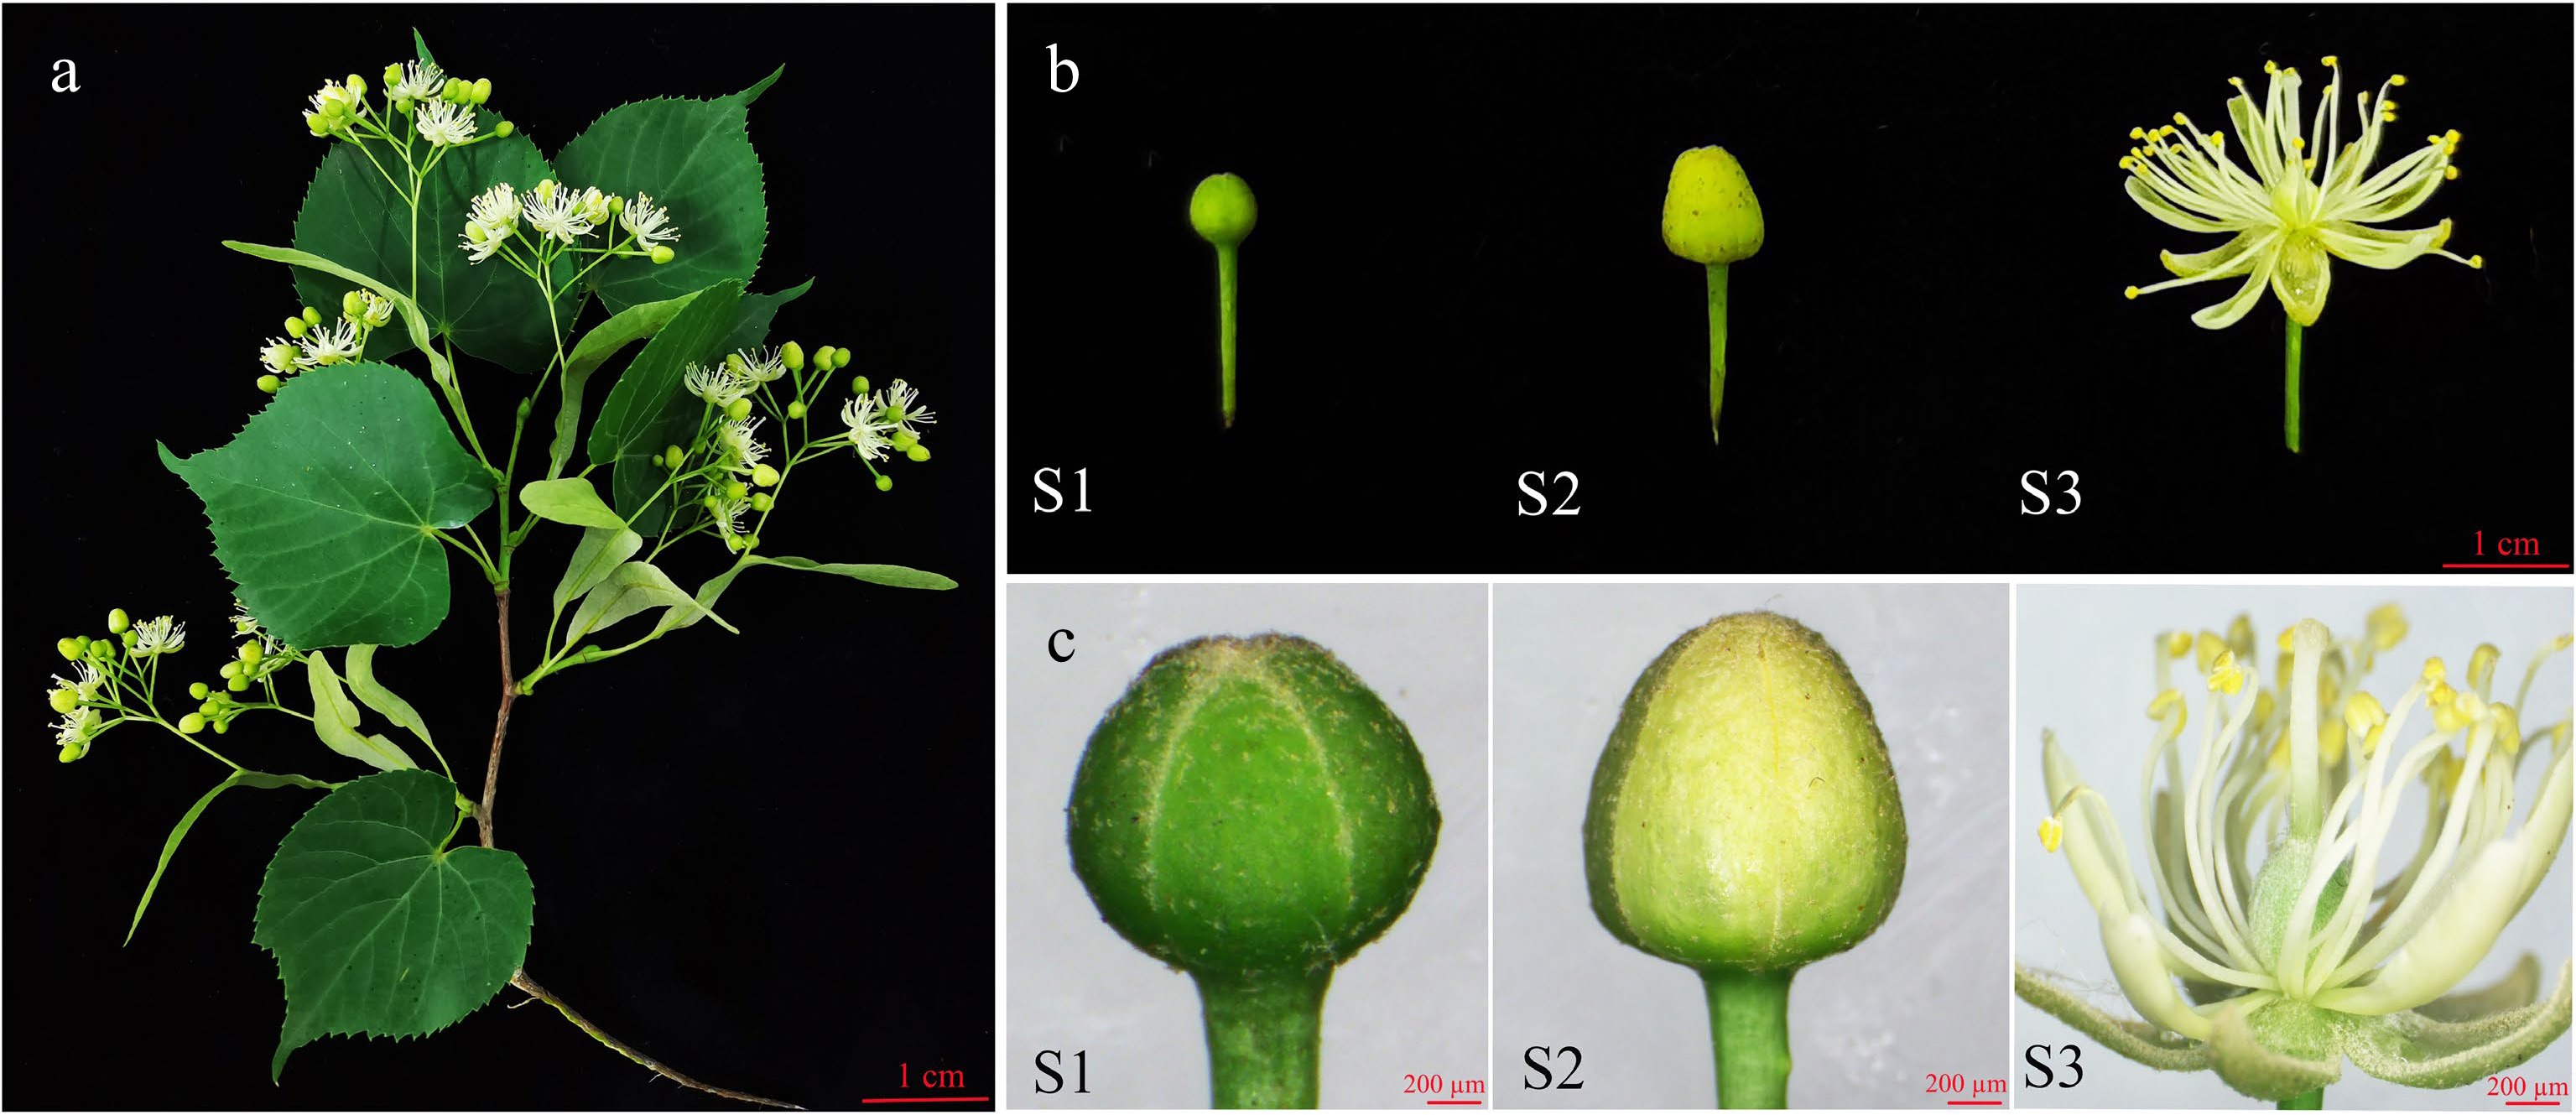
Figure 1.
Photographs of T. amurensis flowers at different developmental stages. (a) Image of a T. amurensis branch with flowers. (b) S1: early bud stage. S2: middle bud stage. S3: fully bloomed stage. (c) S1: microstructure at the early bud stage. S2: microstructure at the middle bud stage. S3: microstructure at the fully bloomed stage. The scale is 200 µm.
-
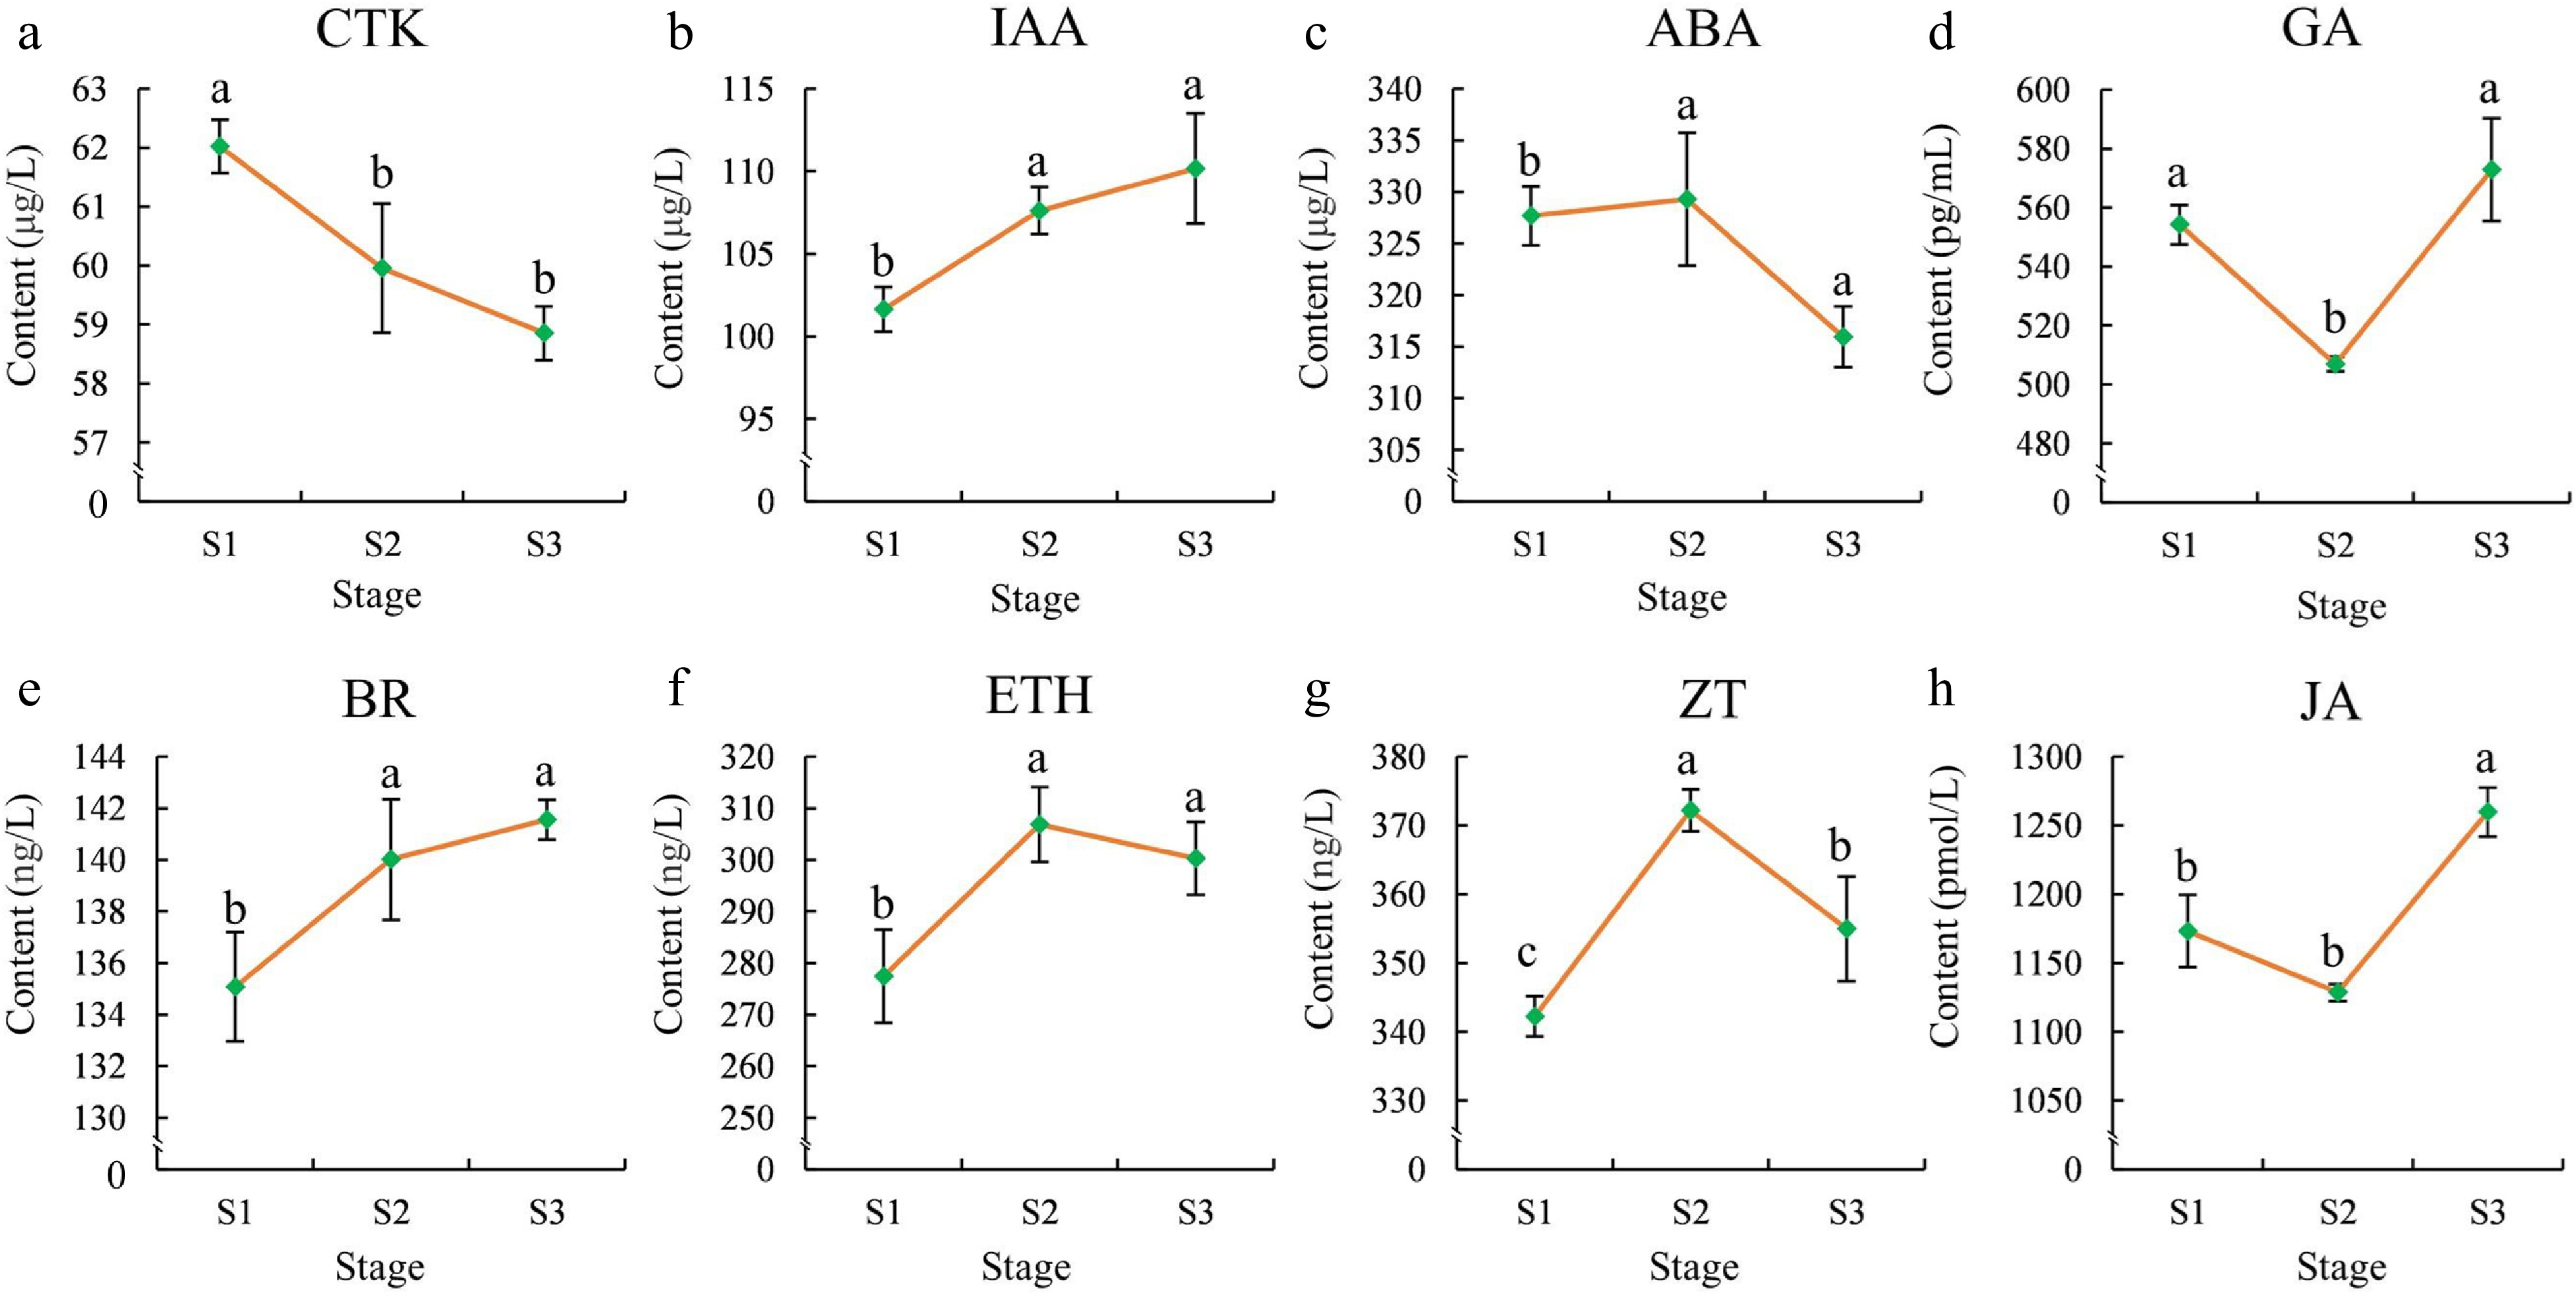
Figure 2.
Phytohormone contents in flowers at different stages. (a) CTK, (b) IAA, (c) ABA,(d) GA, (e) BR, (f) ETH, (g) ZT, (h) JA. The error bars in the plot represent the standard error, and the presence of distinct letters on the error bars indicates statistically significant differences at a significance level of p < 0.05.
-
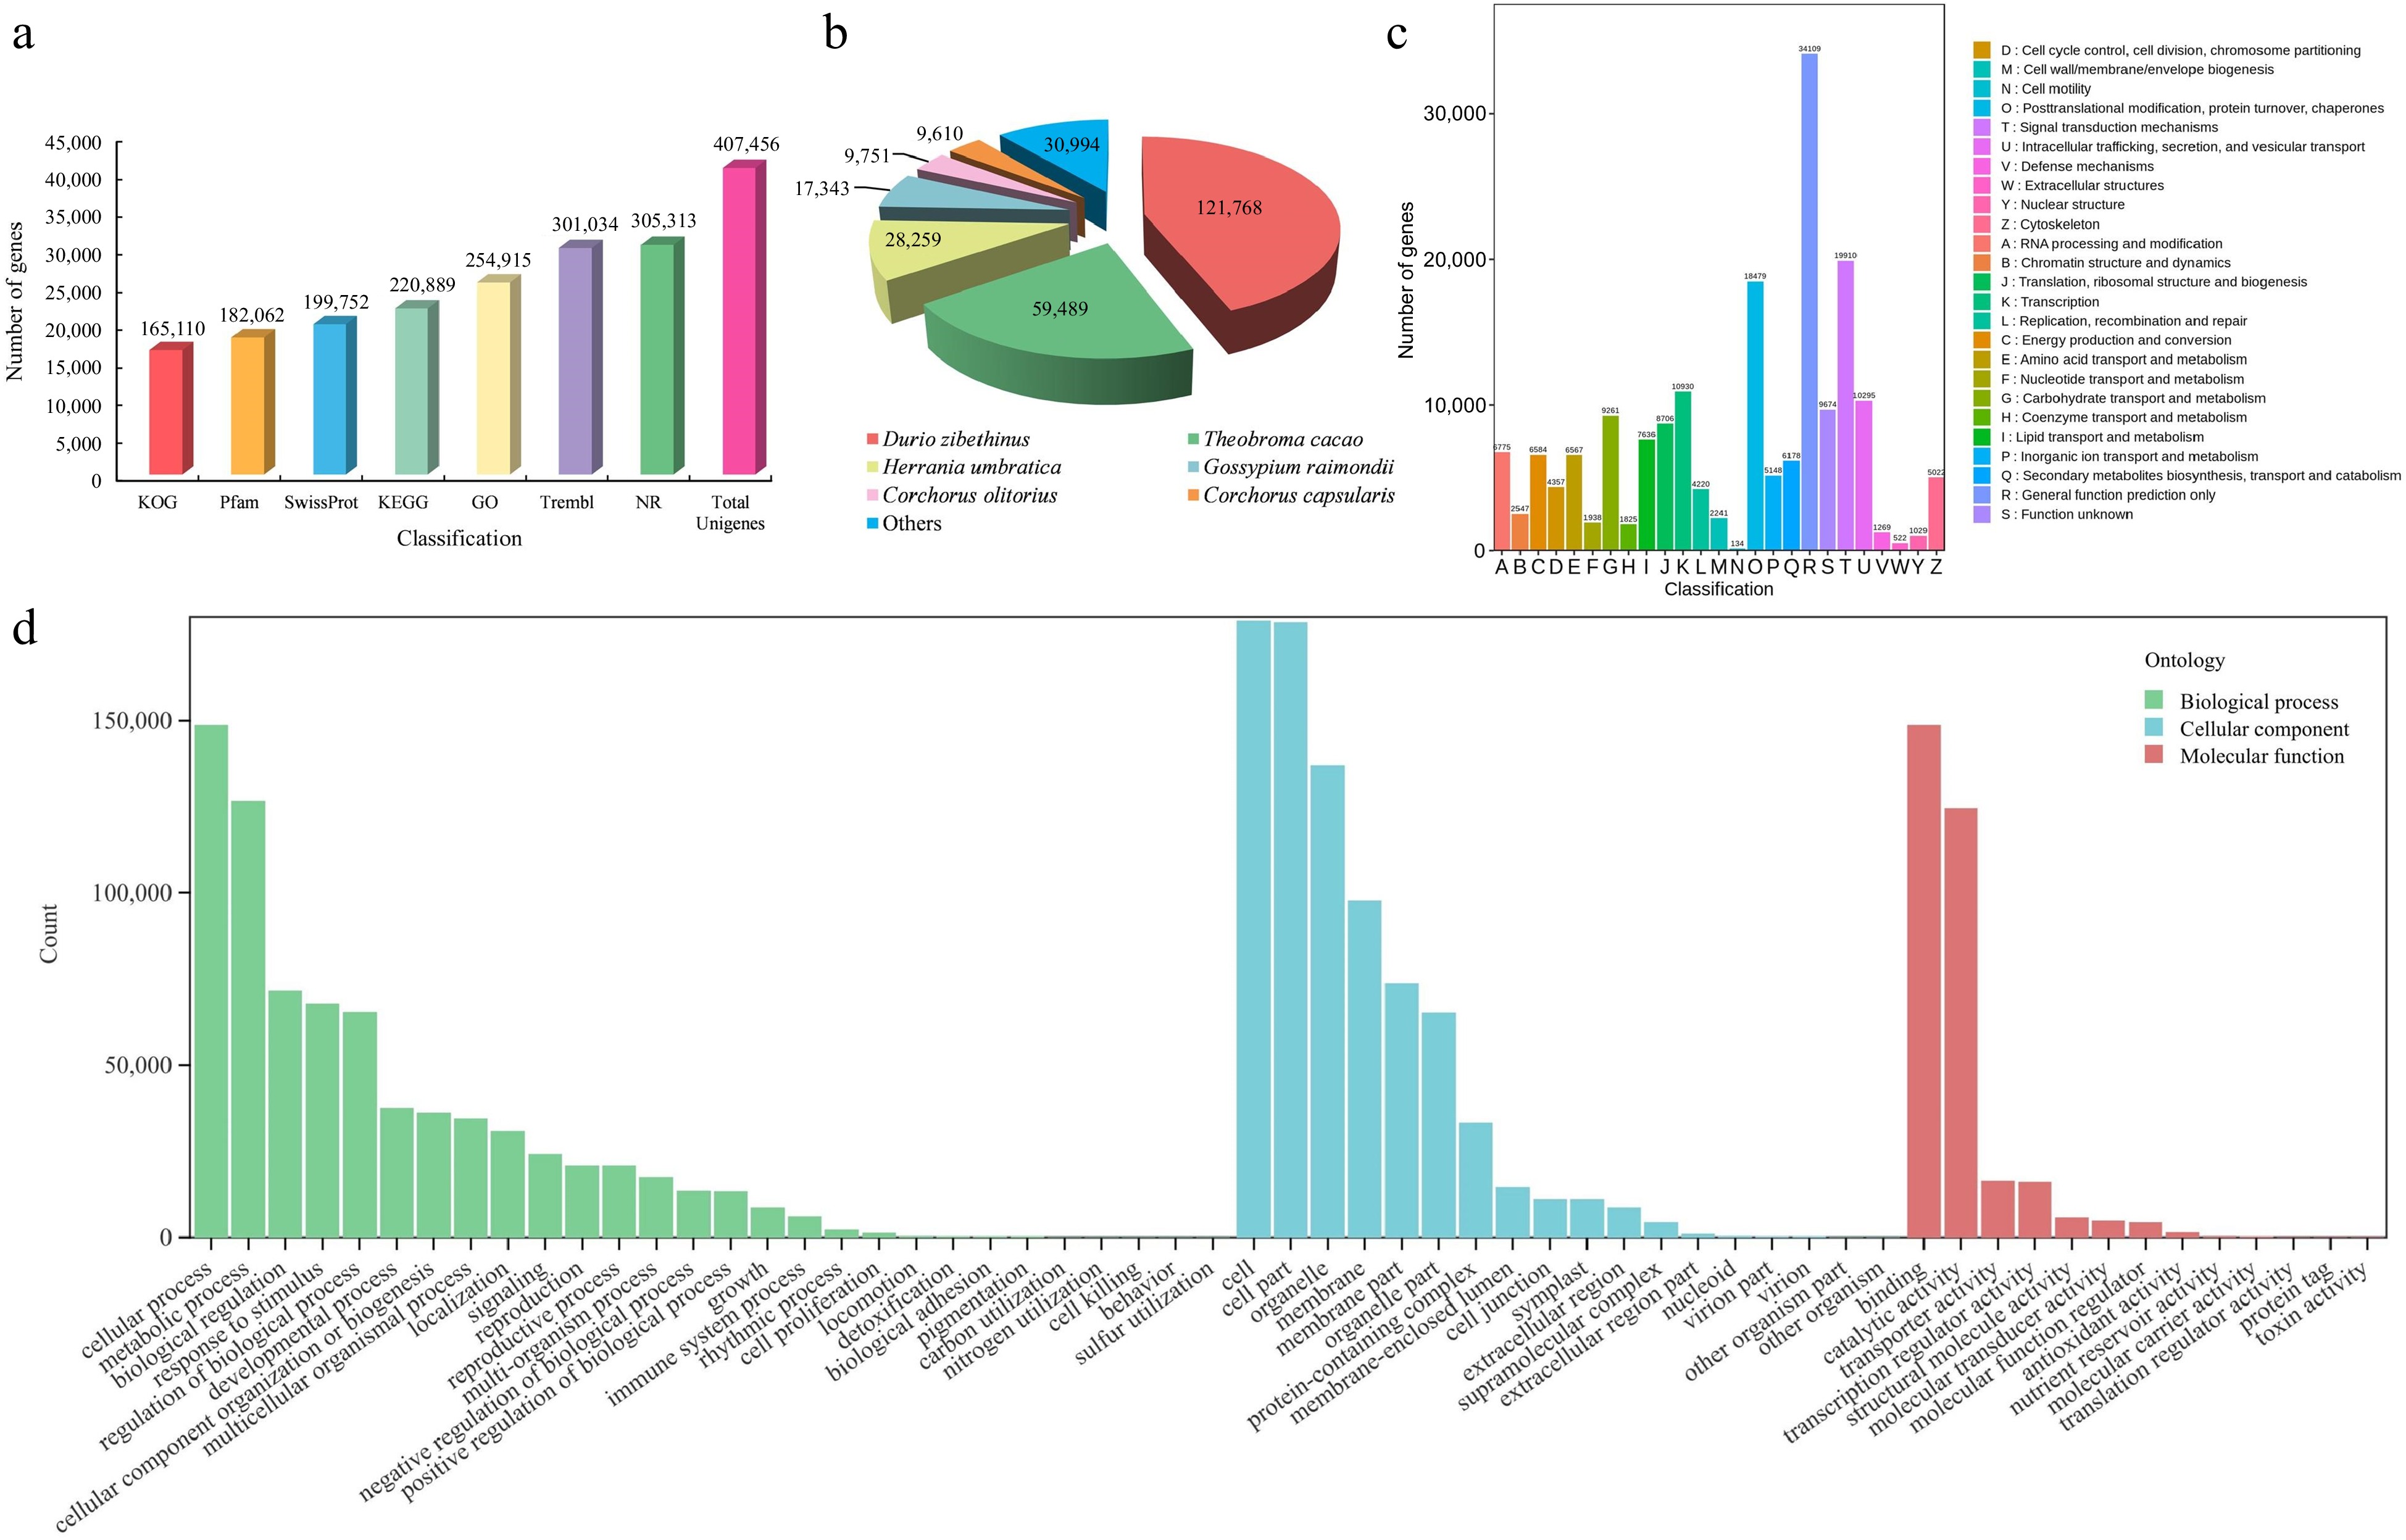
Figure 3.
Identification and annotation analysis of unigenes of T. amurensis flowers. (a) Annotation information of unigenes in various public databases. (b) Statistical analysis of species distribution from the Nr database. (c) Function annotation of unigenes in KOG database. (d) The distribution across functional categories of unigenes in GO database.
-
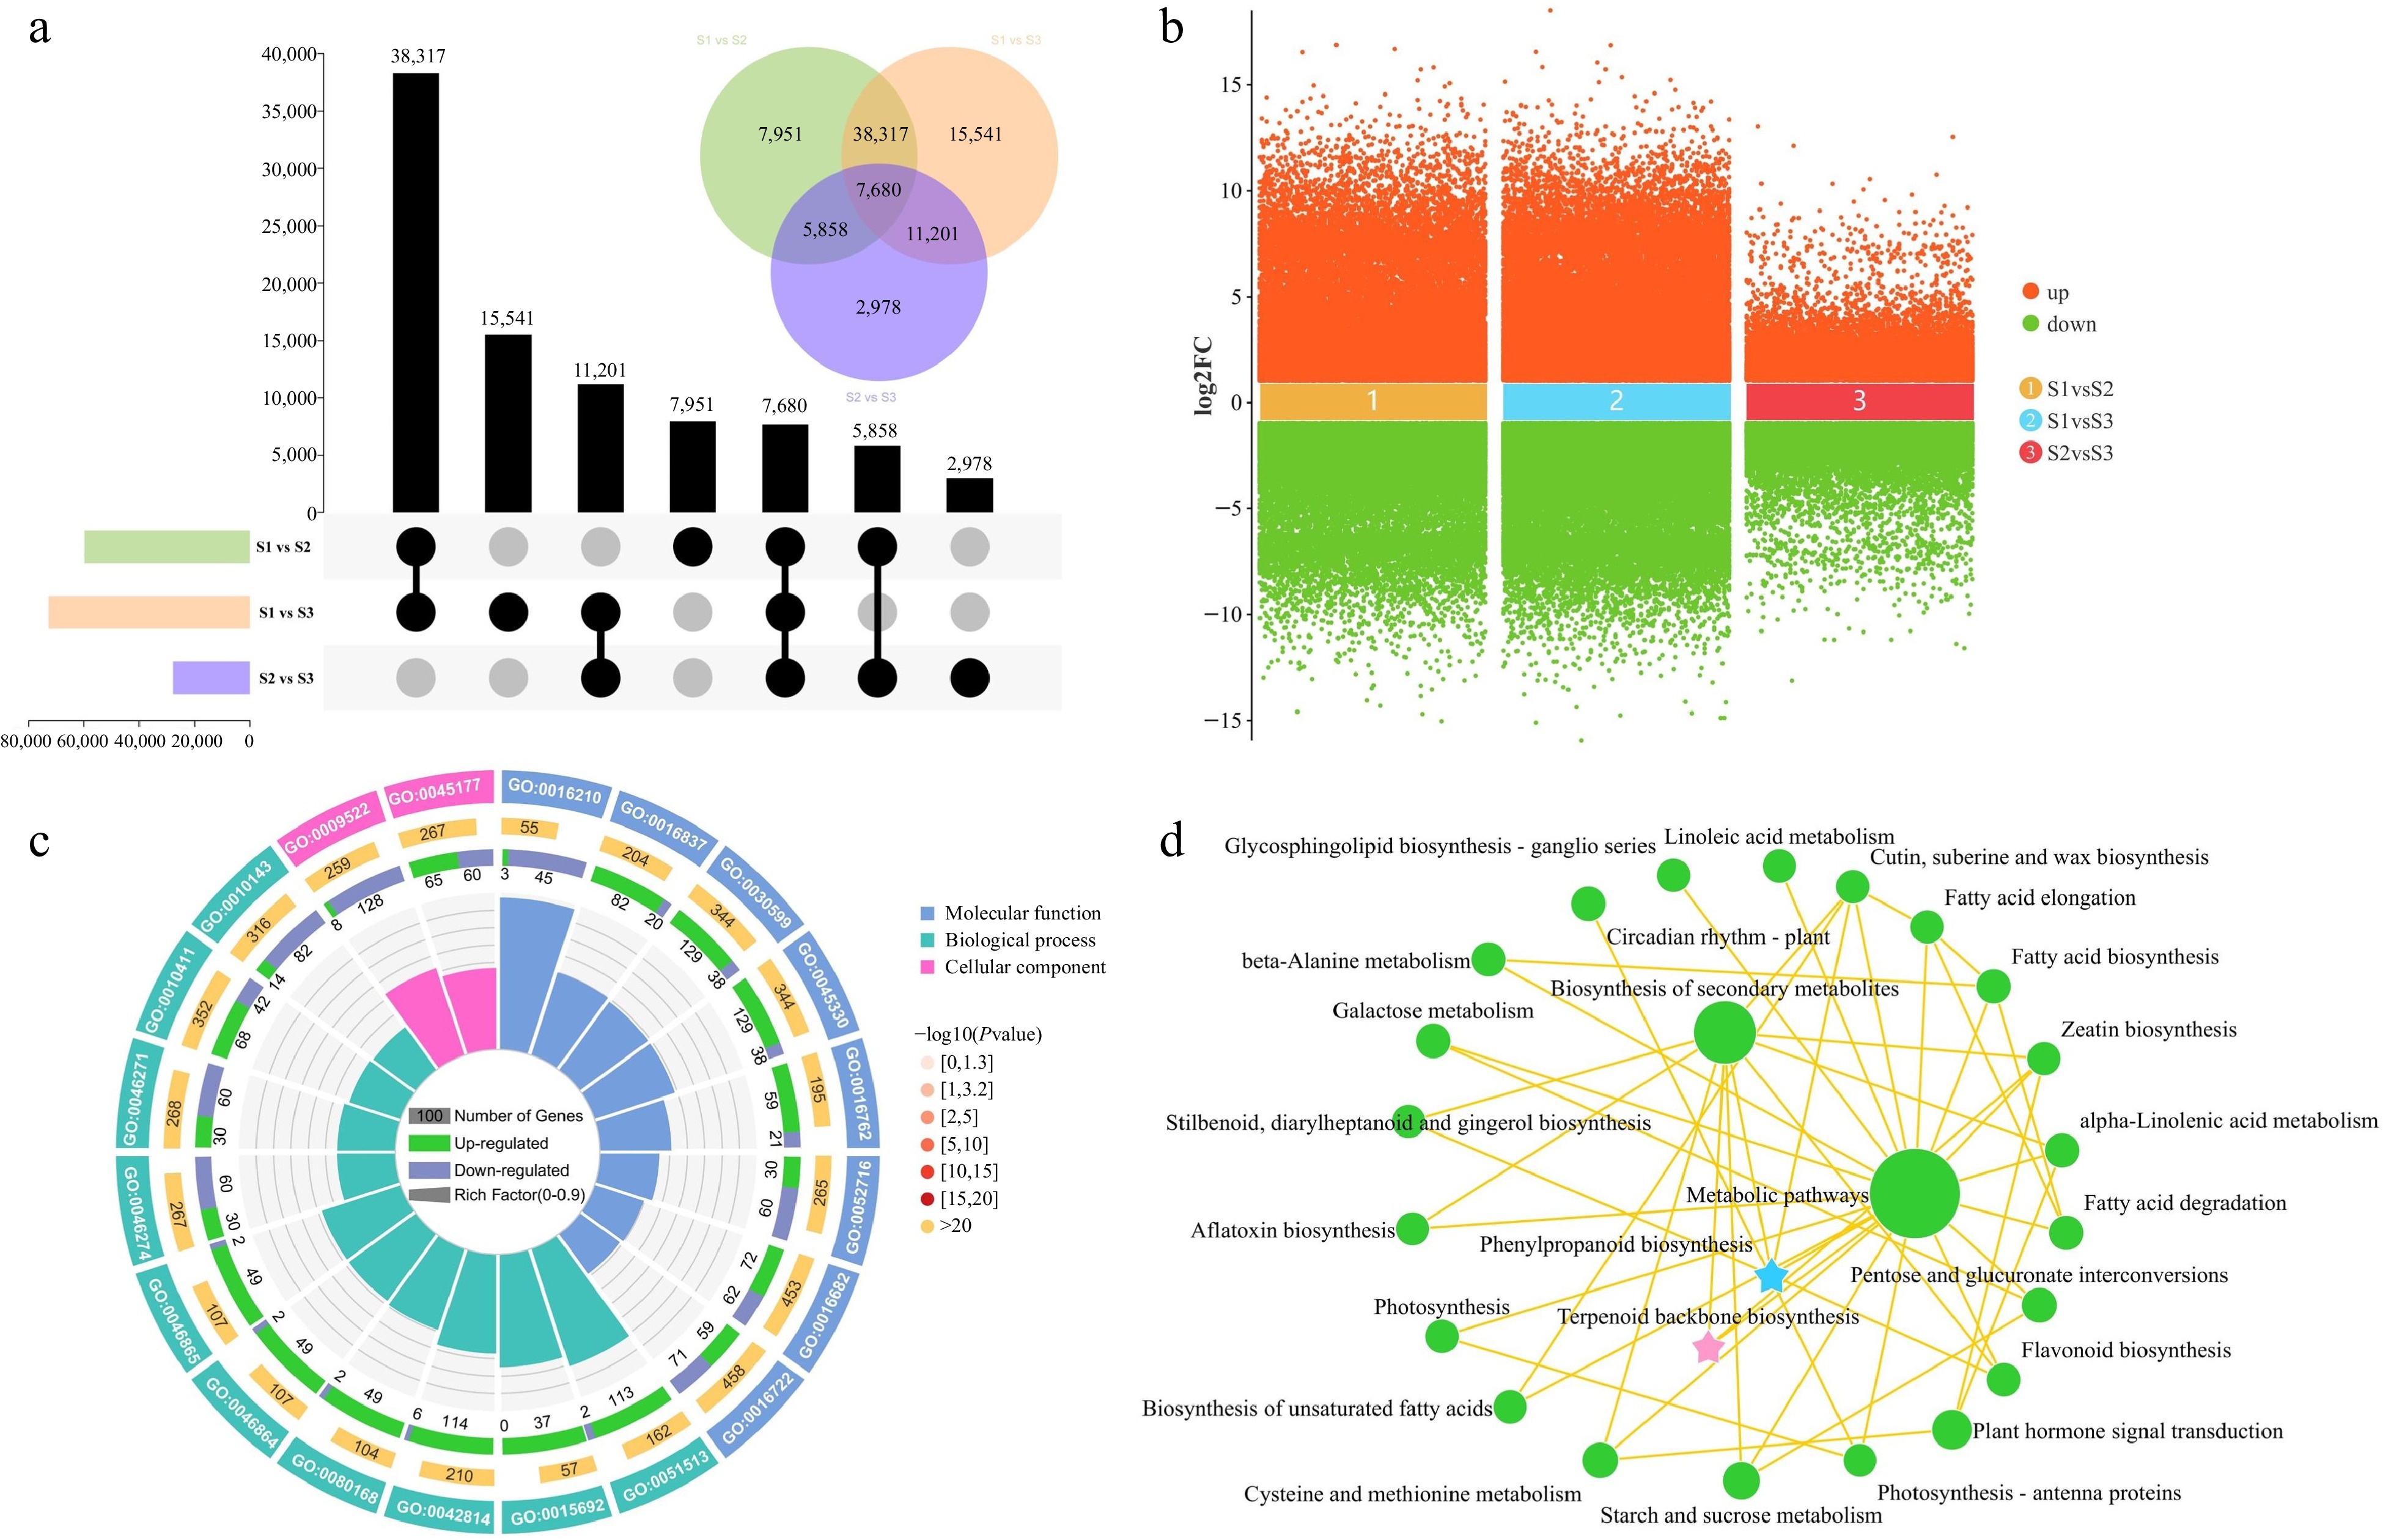
Figure 4.
Identification and enrichment analysis of DEGs in three comparison groups. (a) UpSet and Venn diagram of DEGs in three comparison groups. (b) Volcano plot of upregulated and downregulated DEGs in three comparison groups. (c) Gene Ontology enrichment circle diagram of DEGs. (d) KEGG enrichment analysis network diagram of DEGs.
-
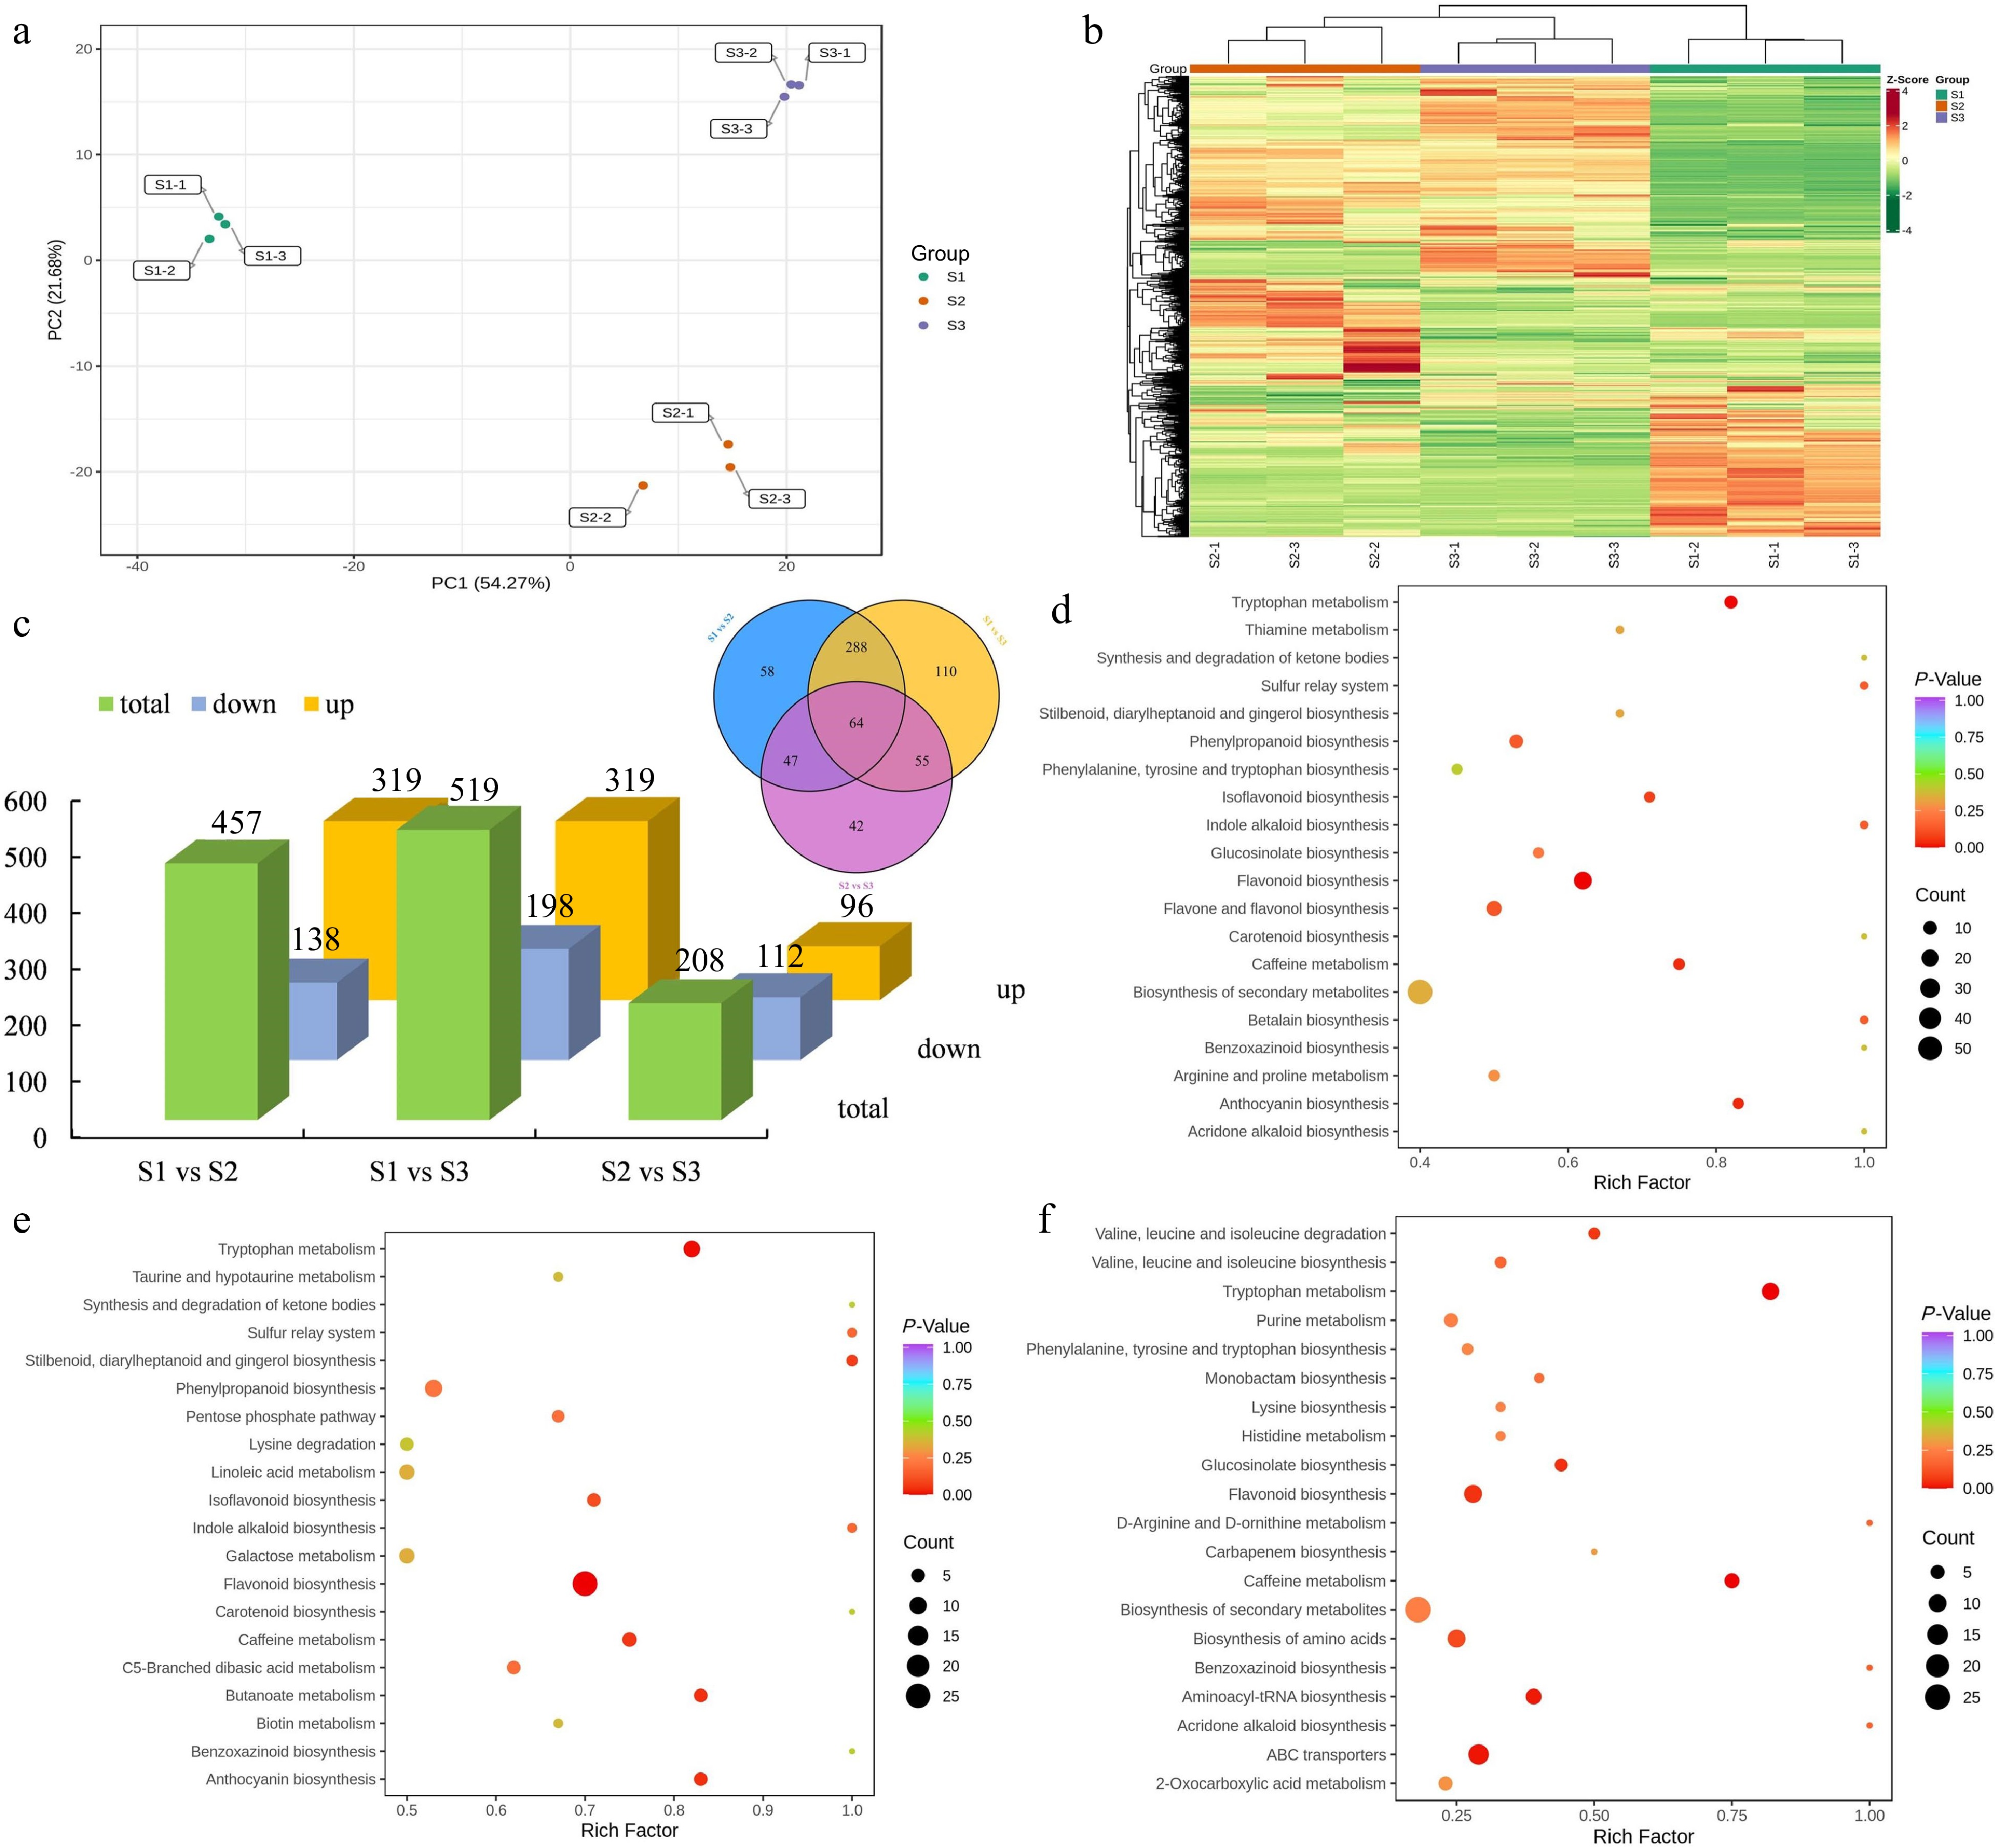
Figure 5.
Identification and enrichment analysis of DEMs. (a) PCA of the metabolome data from three stages. (b) Cluster heatmap of all DEMs in three stages. (c) Statistical analysis of upregulated and downregulated DEMs in three comparison groups. (d) KEGG enrichment analysis of the DEMs in the S1 vs S2 group. (e) KEGG enrichment analysis of the DEMs in the S1 vs S3 group. (f) KEGG enrichment analysis of the DEMs in the S2 vs S3 group.
-
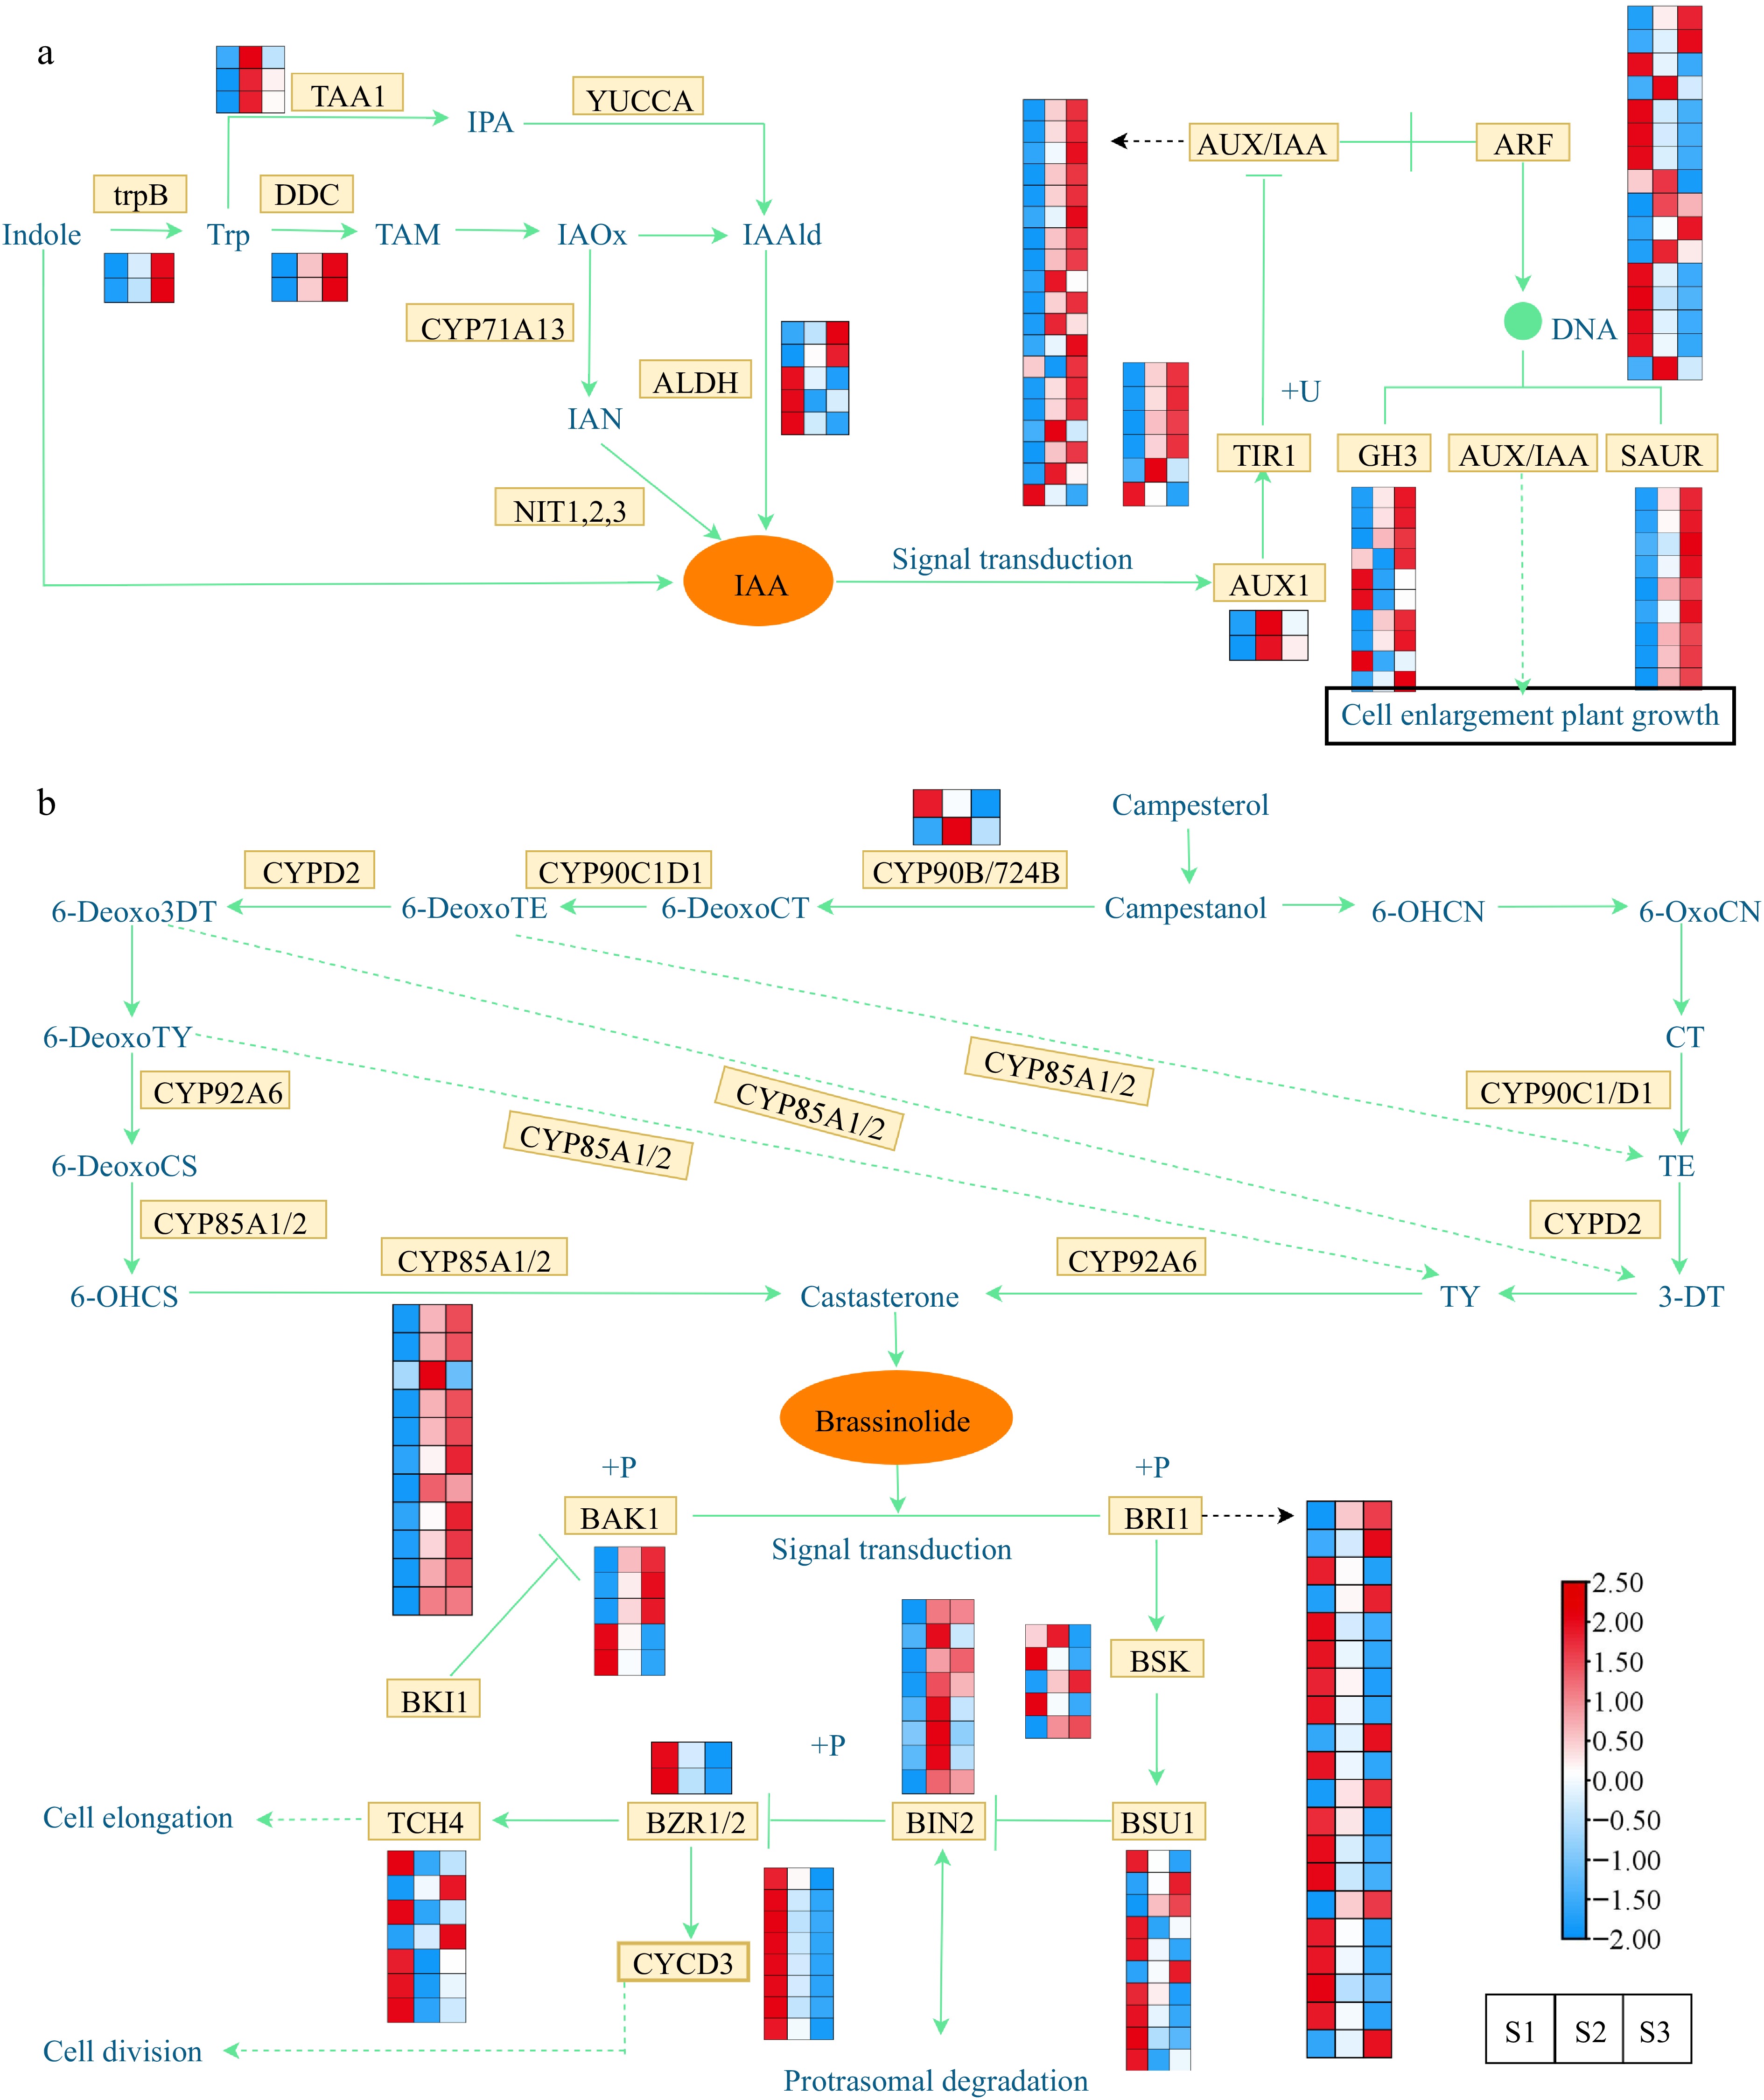
Figure 6.
Expression profiles of DEGs associated with phytohormone biosynthesis and signal transduction. (a) Expression profiles of DEGs involved in the auxin. (b) Expression profiles of DEGs involved in the brassinosteroid. The expression profiles of genes at the three stages are displayed in separate columns within the colored boxes, while each row represents a distinct gene. The color gradient indicates the expression levels, with red indicating upregulation and blue indicating downregulation. trpB, tryptophan synthase beta chain; DDC, tryptophan decarboxylase; TAA, tryptophan aminotransferase; YUCCA, indole-3-pyruvate monooxygenase; CYP71A13, indoleacetaldoxime dehydratase; ALDH, aldehyde dehydrogenase; NIT, nitrilase; AUX1, auxin influx carrier 1; TIR1, transport inhibitor response 1; AUX/IAA, auxin-responsive protein IAA; ARF, auxin response factor; GH3, gretchen hagen 3; SAUR, small auxin upregulated RNA; CYP90B/724B, steroid 22-alpha-hydroxylase; CYP92A6, typhasterol/6-deoxotyphasterol 2alphahydroxylase; CYP85A1/2, brassinosteroid-6-oxidase 1/2; BRI1; BRI1 kinase inhibitor 1; BAK1, brassinosteroid insensitive 1-associated receptor kinase 1; BSK, BR-signaling kinase; BSU1, serine/threonine-protein phosphatase; BIN2, brassinosteroid insensitive 2; BZR1/2, brassinosteroid resistant 1/2; TCH4, xyloglucan: xyloglucosyl transferase; CYCD3, cyclin D3.
-
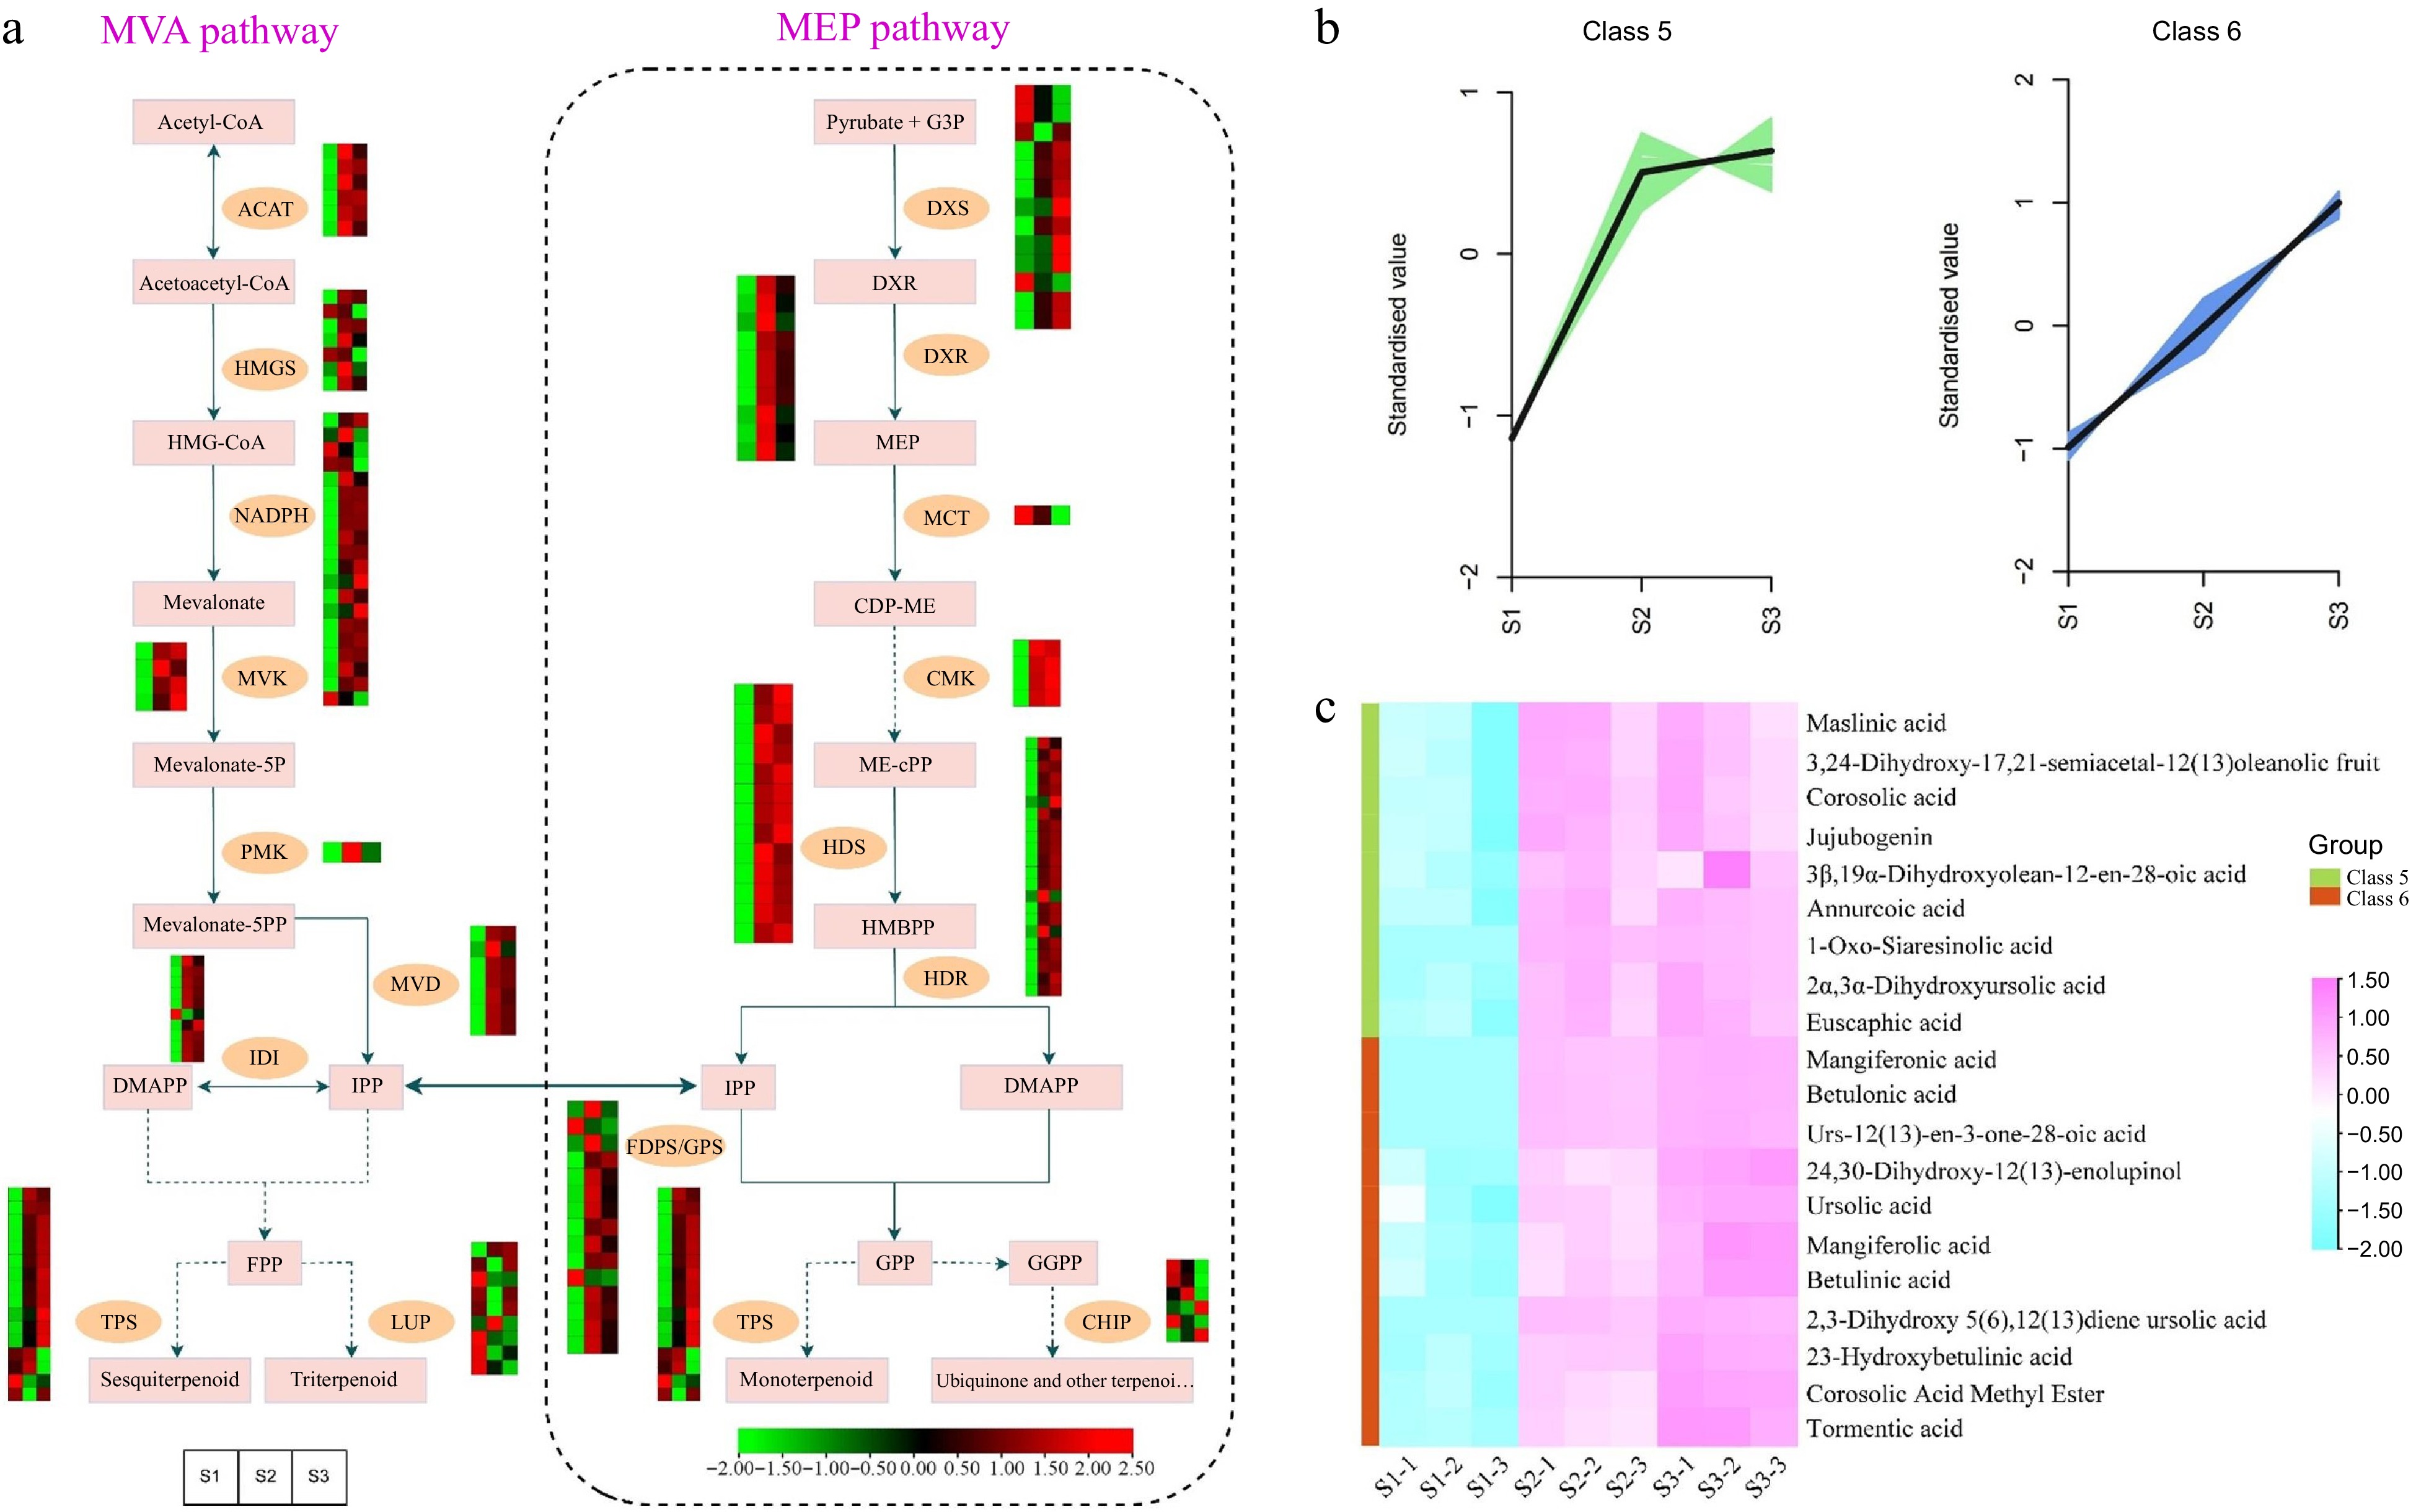
Figure 7.
Illustrations and expression patterns of DEGs and DEMs implicated in the biosynthesis pathway of terpenoids. (a) Expression levels of DEGs. (b) K-means cluster analysis of DEM accumulation. (c) Heatmap of DEMs in the terpenoid biosynthesis pathway. The expression profiles of genes at the three stages are displayed in separate columns within the colored boxes, while each row represents a distinct gene. The color gradient indicates the expression levels, with red indicating upregulation and green indicating downregulation. ACAT, acetyl-CoA C-acetyltransferase; HMGS, 3-hydroxy-3-methyl-glutaryl-CoA synthase; MVK, mevalonate kinase; PMK, phosphomevalonate kinase; MVD, mevalonate-5-pyrophosphate decarboxylase; IDI, isopentenyl-diphosphate delta-isomerase; LUP, lupeol synthase; DXS, 1-deoxy-D-xylulose 5-phosphate synthase; DXR, 1-deoxy-D-xylulose-5-phosphate reductoisomerase; MCT, 2-C-methyl-D-erythritol 4-phosphate cytidylyltransferase; CMK, 4-diphosphocytidyl-2-C-methyl-D-erythritol kinase; HDS, 1-hydroxy-2-methyl-2-butenyl 4-diphosphate synthase; HDR, 1-hydroxy-2-methyl-2-butenyl 4-diphosphate reductase; FDPS/GPS, farnesyl diphosphate synthase/geranyl diphosphate synthase; TPS, terpene synthases.
-
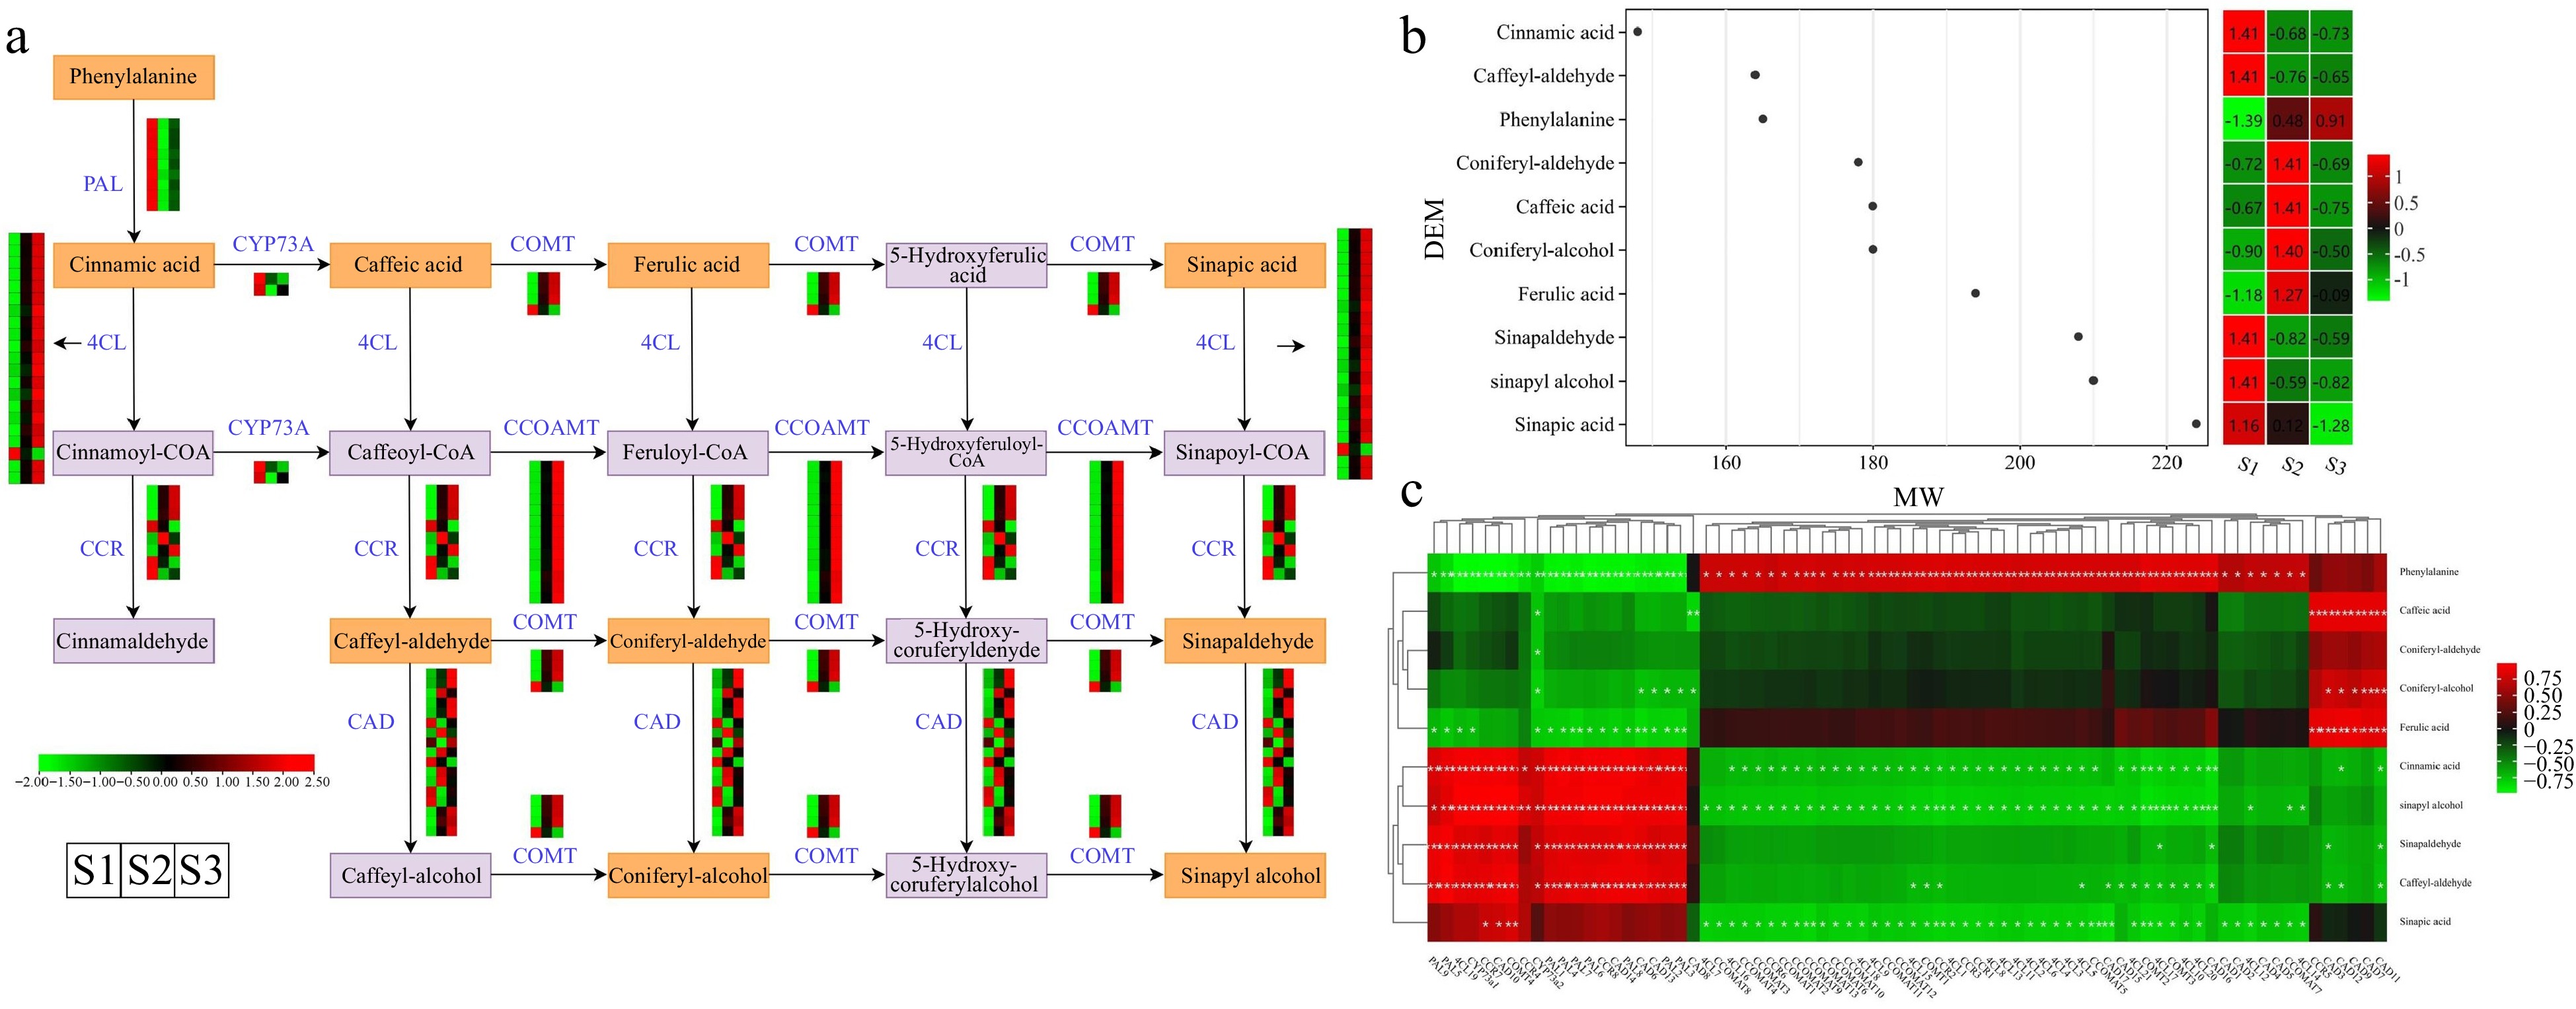
Figure 8.
Illustrations and expression patterns of DEGs and DEMs involved in the phenylpropanoid biosynthesis pathway. (a) Expression levels of DEGs. (b) Heatmap of DEMs in the phenylpropanoid biosynthesis pathway. (c) Correlation analysis of phenylpropanoid biosynthesis-related structural gene expression profile and DEM accumulation. The expression profiles of genes at the three stages are displayed in separate columns within the colored boxes, while each row represents a distinct gene. The color gradient indicates the expression levels, with red indicating upregulation and green indicating downregulation. PAL, phenylalanine ammonia-lyase; 4CL, 4-coumarate–CoA ligase; CCR, cinnamoyl-CoA reductase; COMT, caffeic acid 3-O-methyltransferase; CCOAMT, caffeoyl-CoA O-methyltransferase; CAD, cinnamyl-alcohol dehydrogenase; CYP73A, trans-cinnamate 4-monooxygenase.
-
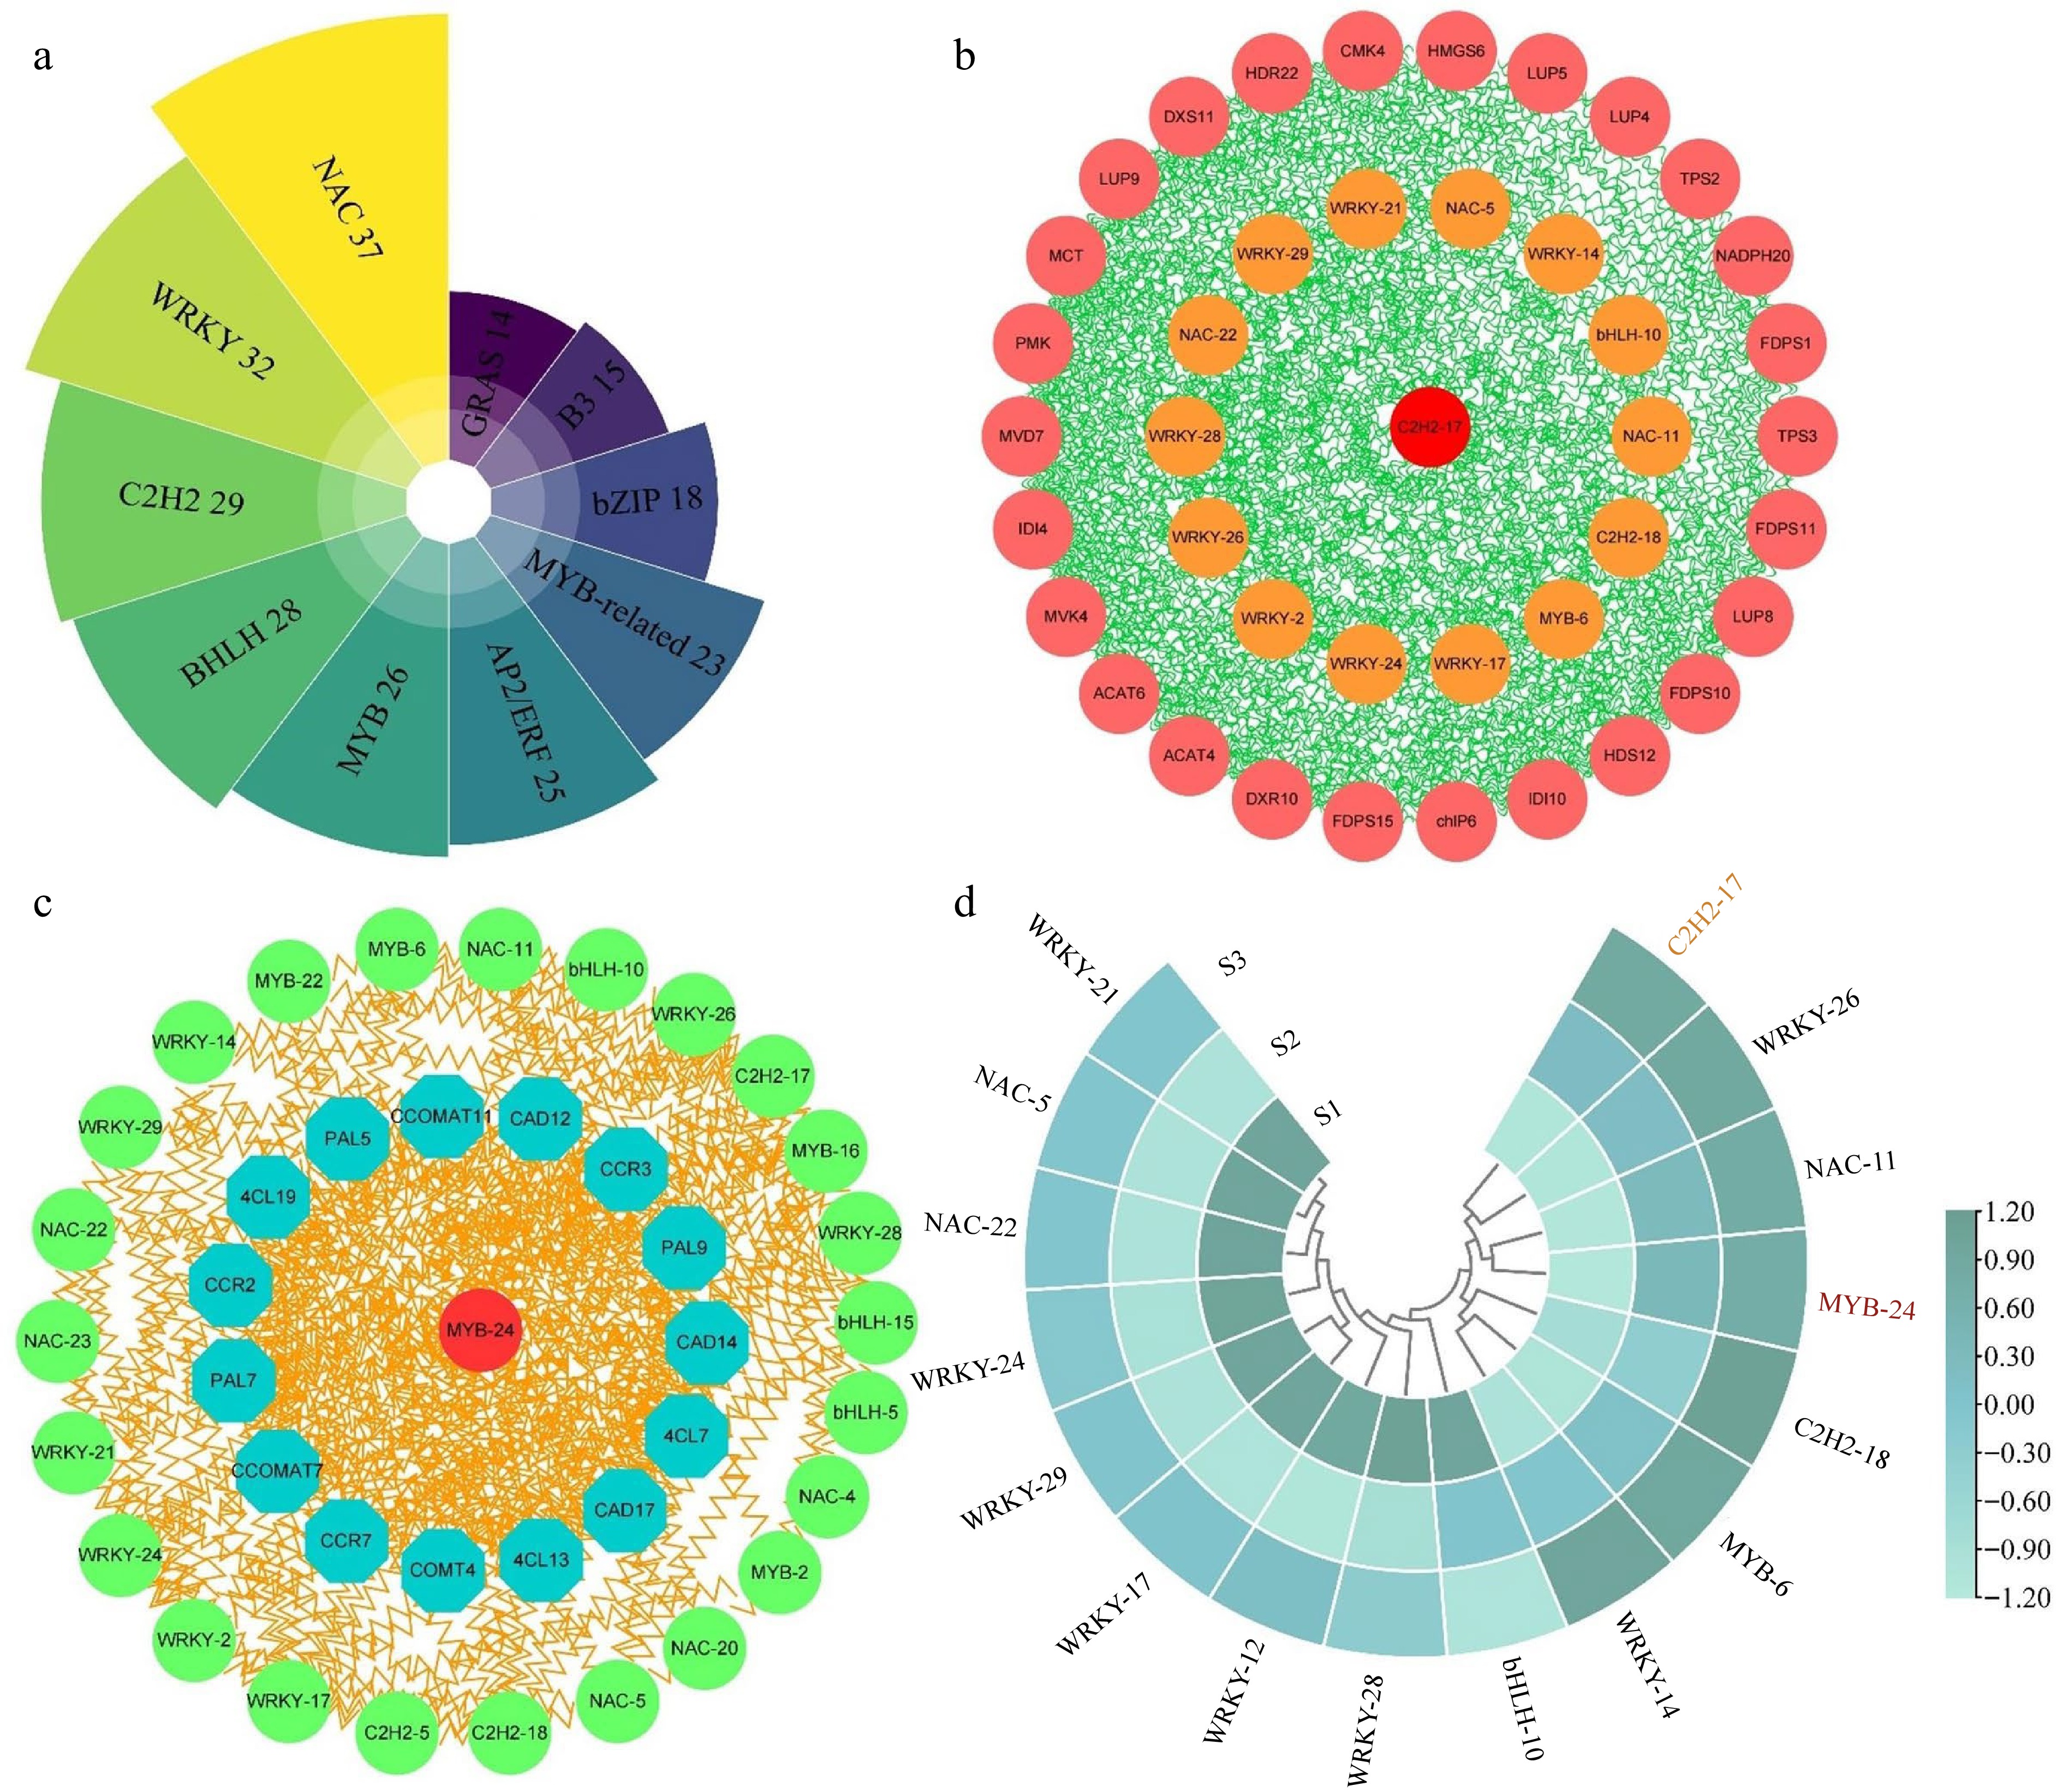
Figure 9.
Analysis of correlation and expression patterns between structural genes and transcription factors. (a) Statistical analysis of the highest number of ten transcription factor families in three comparison groups. (b) Correlation network analysis of terpenoid biosynthesis-related structural genes and the highest number of five transcription factor families. (c) Correlation network analysis of phenylpropanoid biosynthesis-related structural genes and the top five transcription factor families. (d) The expression patterns of 16 selected transcription factors.
-
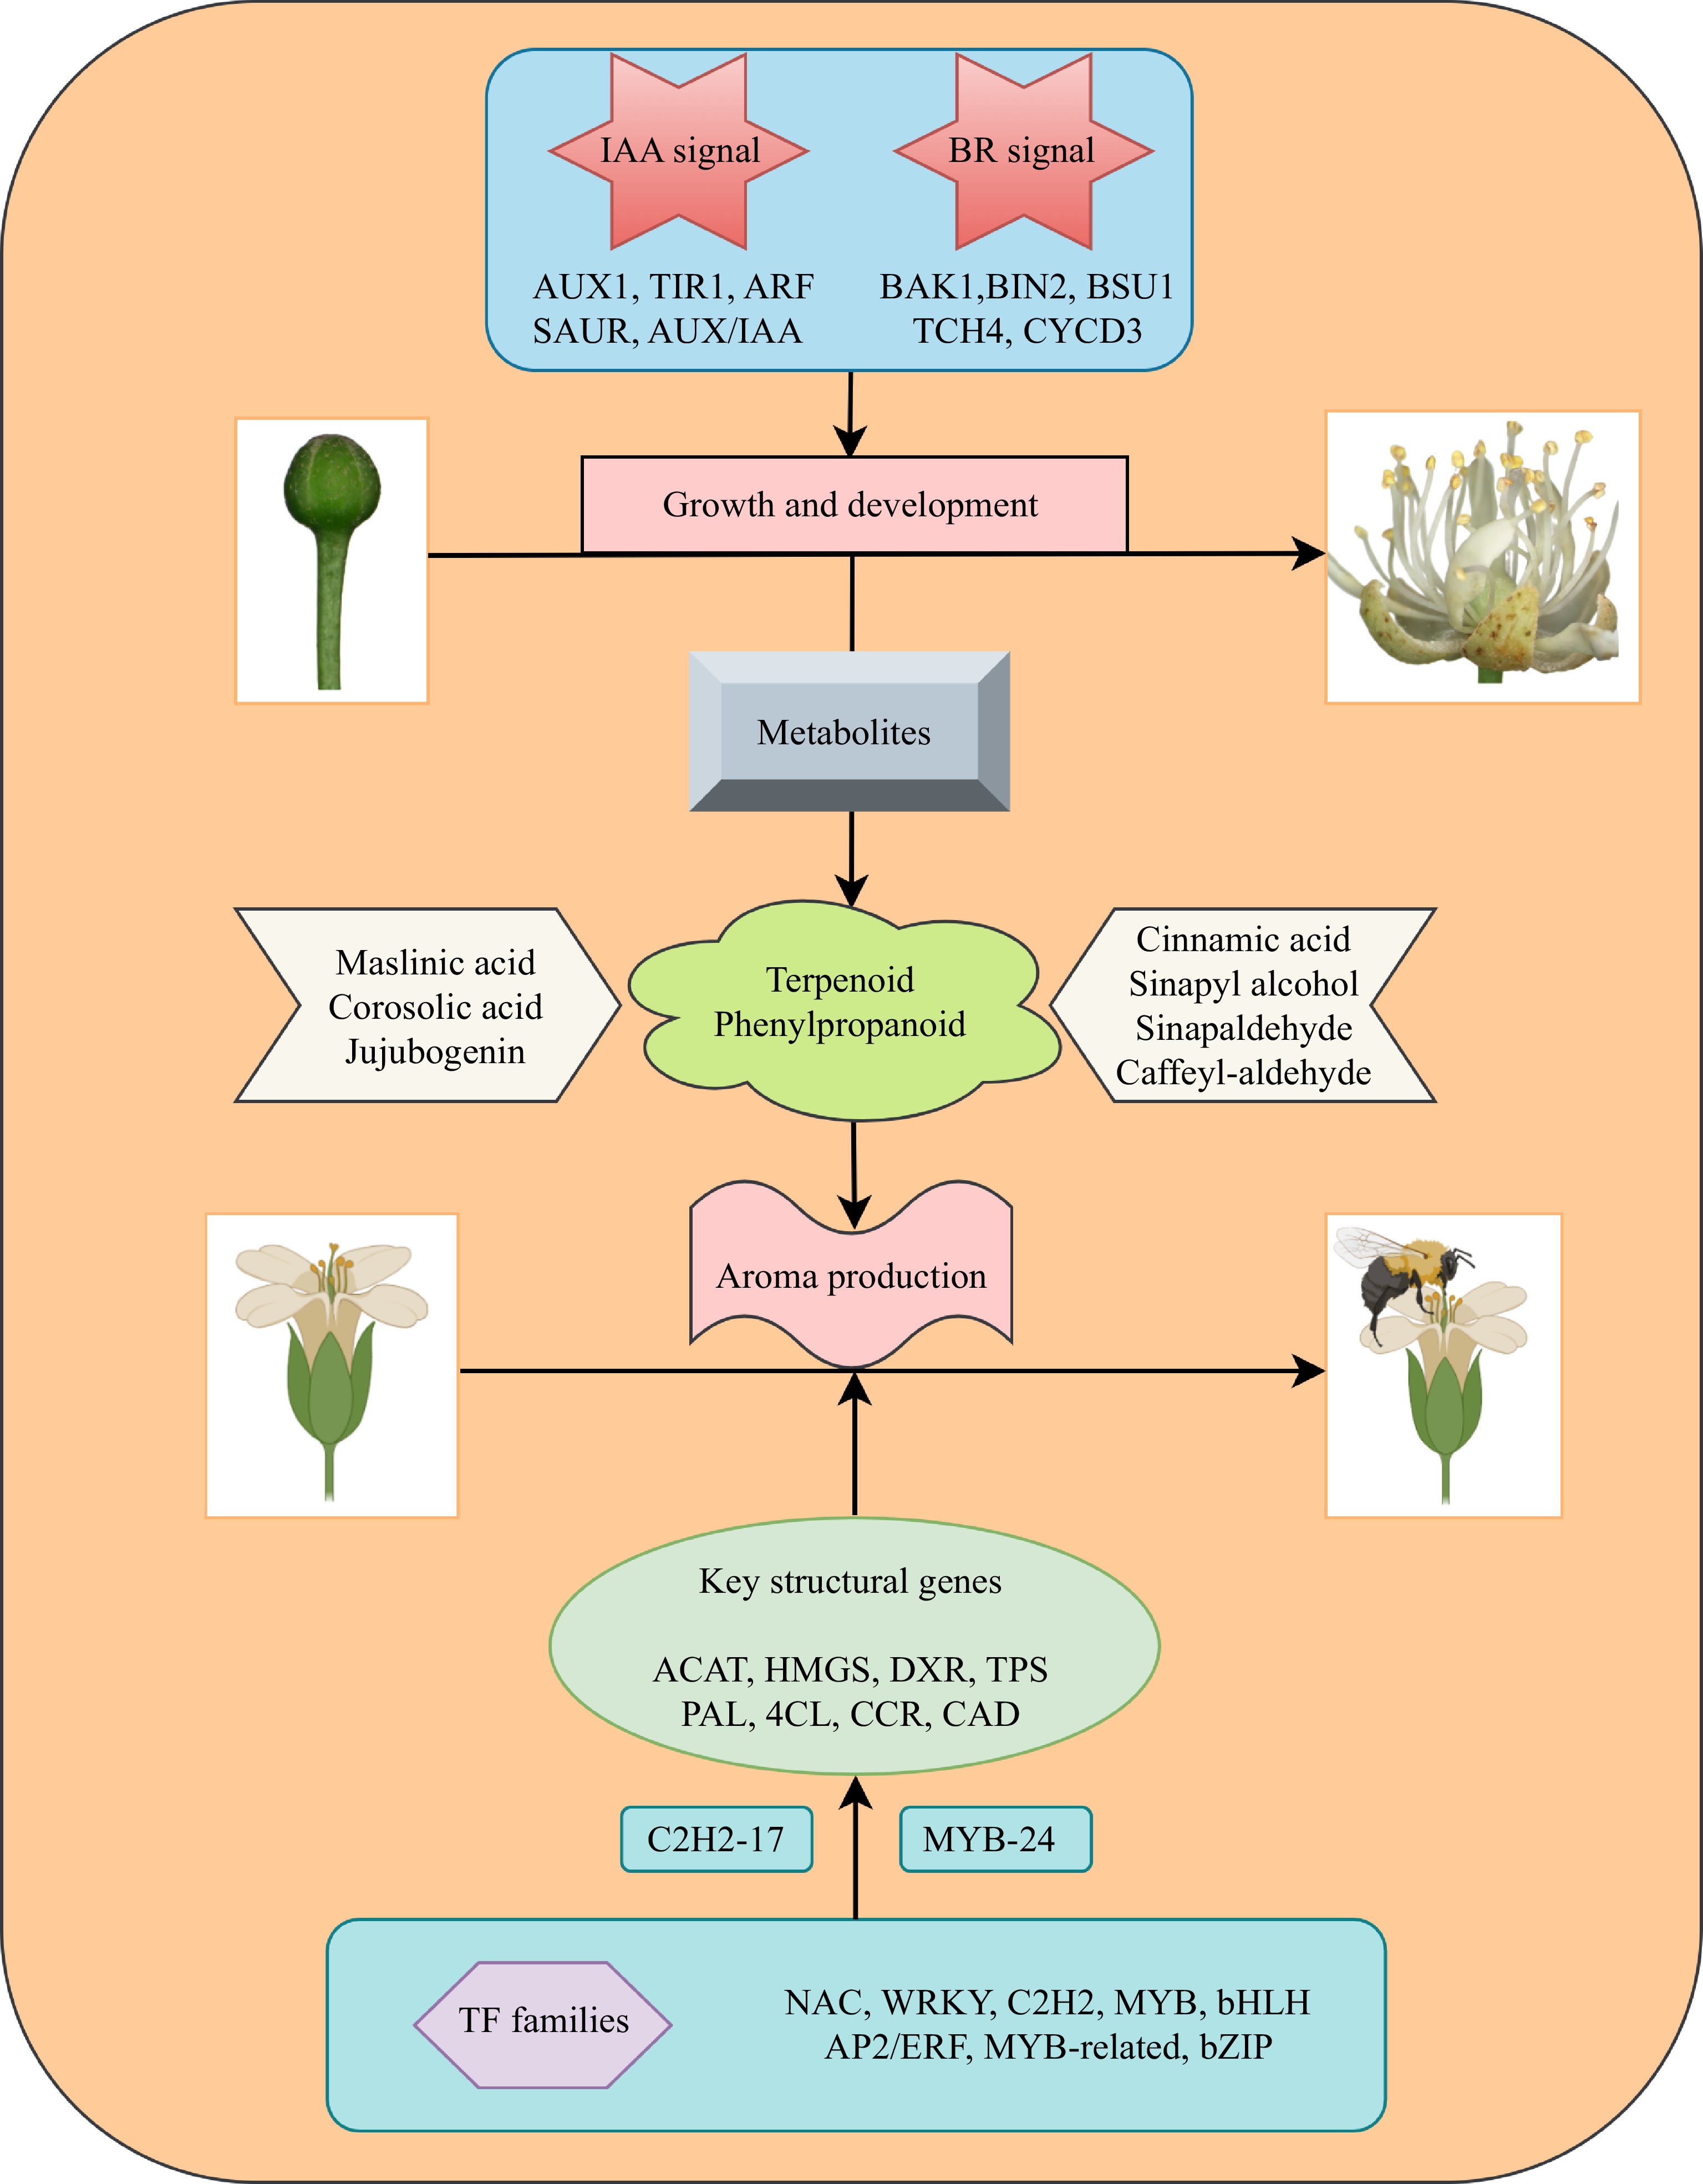
Figure 10.
Diagram illustrating the process of flower development and aroma synthesis in the nectar tree (Tilia amurensis).
Figures
(10)
Tables
(0)