-
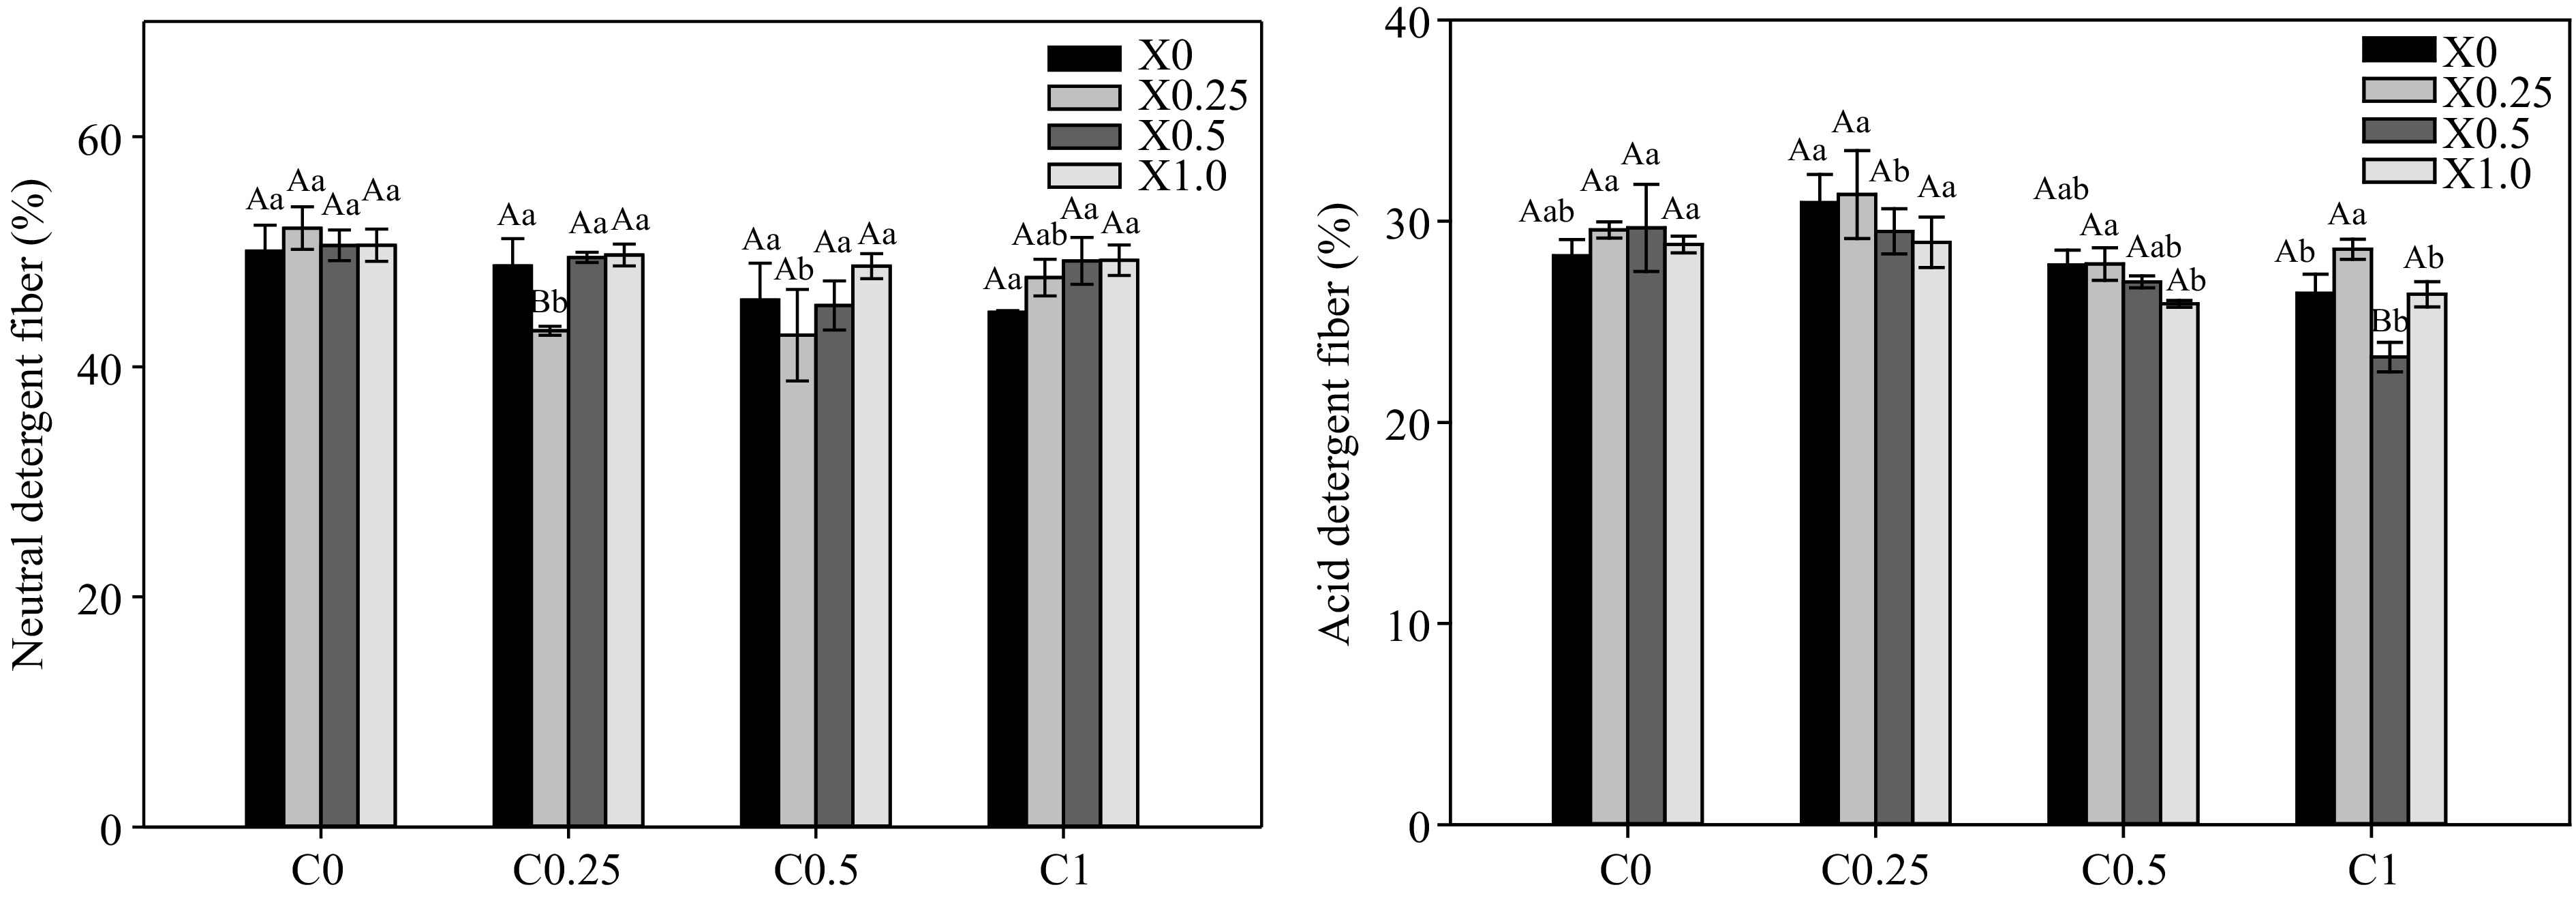
Figure 1.
Effects of cellulase and xylanase on ADF and NDF of silage maize.
-
Treatments Xylanase (g·kg−1) Cellulase (g·kg−1) C0-X0 X : 0 C : 0 C0.25-X0 C : 0.25 C0.5-X0 C : 0.5 C1.0-X0 C : 1.0 C0-X0.25 X : 0.25 C : 0 C0.25-X0.25 C : 0.25 C0.5-X0.25 C : 0.5 C1.0-X0.25 C : 1.0 C0-X0.5 X : 0.5 C : 0 C0.25-X0.5 C:0.25 C0.5-X0.5 C : 0.5 C1.0-X0.5 C : 1.0 C0-X1.0 X : 1.0 C : 0 C0.25-X1.0 C : 0.25 C0.5-X1.0 C : 0.5 C1.0-X1.0 C : 1.0 Cellulase and xylanase were provided by Shanghai Yien Chemical Technology Co. Ltd. (Shanghai, China). Table 1.
Cellulase and xylanase experiment design.
-
Xylanase Cellulase pH value Water soluble
carbohydrates
(%)Ammonia
nitrogen/total
nitrogen (%)X0 C0 3.71 ± 0.10Aa 3.02 ± 0.03Ab 10.53 ± 0.44Aa C0.25 3.59 ± 0.00Aa 3.26 ± 0.17Aab 9.36 ± 0.46ABa C0.5 3.72 ± 0.06Aa 3.73 ± 0.27Aa 9.69 ± 0.27Aa C1.0 3.71 ± 0.09Aa 3.33 ± 0.07Aab 9.82 ± 0.49Aa X0.25 C0 3.70 ± 0.03Aa 3.32 ± 0.24Aa 9.50 ± 0.48ABa C0.25 3.68 ± 0.02Aa 3.33 ± 0.26Aa 10.45 ± 0.46Aa C0.5 3.67 ± 0.04Aa 3.39 ± 0.12Aa 8.77 ± 0.57Aa C1.0 3.77 ± 0.09Aa 3.42 ± 0.20Aa 8.49 ± 0.73ABa X0.5 C0 3.65 ± 0.01Aa 3.58 ± 0.23Aa 7.68 ± 0.49Cab C0.25 3.73 ± 0.08Aa 3.85 ± 0.28Aa 6.79 ± 0.17Cb C0.5 3.70 ± 0.02Aa 3.58 ± 0.11Aa 8.49 ± 0.70Aa C1.0 3.64 ± 0.01Aa 3.66 ± 0.07Aa 8.23 ± 0.38ABab X1.0 C0 3.61 ± 0.02Aa 3.40 ± 0.23Aa 8.09 ± 0.43BCa C0.25 3.72 ± 0.07Aa 3.78 ± 0.19Aa 8.31 ± 0.44Ba C0.5 3.73 ± 0.06Aa 3.66 ± 0.17Aa 9.27 ± 0.48Aa C1.0 3.69 ± 0.04Aa 3.79 ± 0.51Aa 7.81 ± 0.56Ba Different lowercase letters indicate there are significant differences between cellulase concentration treatments at the same concentration of xylanase (p < 0.05); different uppercase letter indicates that there are significant difference between different xylanase concentration treatments at the same cellulase concentration (p < 0.05). Table 2.
Effects of cellulase and xylanase on pH, water soluble content and ammonia nitrogen/total nitrogen of silage maize.
-
Xylanase
(g·kg−1)Cellulase
(g·kg−1)Lactic acid
(mg·g−1 FM)Acetic acid
(mg·g−1 FM)Propionic acid
(mg·g−1 FM)Butyric acid
(mg·g−1 FM)X0 C0 12.71 ± 0.58Ab 11.99 ± 0.74Aa 4.45 ± 0.08ABa 1.31 ± 0.04Ab C0.25 13.74 ± 0.82Aab 11.31 ± 1.00Aa 3.45 ± 0.18Bb 1.01 ± 0.09Ac C0.5 14.46 ± 0.64Aab 9.57 ± 1.24Aa 3.11 ± 0.36Bb 1.54 ± 0.02Aa C1.0 15.11 ± 0.32Aa 9.83 ± 1.28Aa 3.06 ± 0.31Bb 1.43 ± 0.07Aab X0.25 C0 13.92 ± 0.59Aa 10.33 ± 0.53Ba 3.18 ± 0.16Cb 2.01 ± 0.39Aa C0.25 14.12 ± 0.35Aa 10.71 ± 0.20Aa 3.29 ± 0.13Bb 1.25 ± 0.27Aab C0.5 13.03 ± 0.77Aa 7.95 ± 2.37ABa 3.23 ± 0.15Bb 1.10 ± 0.25Aab C1.0 10.86 ± 0.35Bb 3.91 ± 0.15Bb 4.19 ± 0.13Aa 0.72 ± 0.11Bb X0.5 C0 10.65 ± 0.06Ba 4.50 ± 0.15Ca 5.09 ± 0.11Aa 1.19 ± 0.39Aa C0.25 11.03 ± 0.27Ba 4.30 ± 0.16Ba 5.21 ± 0.33Aa 1.52 ± 0.09Aa C0.5 10.47 ± 0.11Ba 4.29 ± 0.06Ba 5.13 ± 0.16Aa 1.38 ± 0.32Aa C1.0 10.70 ± 0.27Ba 4.37 ± 0.15Ba 4.77 ± 0.08Aa 1.43 ± 0.20Aa X1.0 C0 9.47 ± 0.22Ba 3.80 ± 0.25Ca 4.00 ± 0.40Bab 1.20 ± 0.18Aab C0.25 9.42 ± 0.08Ca 3.84 ± 0.09Ba 3.28 ± 0.17Bb 1.02 ± 0.12Ab C0.5 9.57 ± 0.44Ba 4.20 ± 0.60Ba 4.63 ± 0.09Aa 1.53 ± 0.09Aa C1.0 10.28 ± 0.18Ba 3.95 ± 0.15Ba 4.64 ± 0.24Aa 1.07 ± 0.06ABb Different lowercase letters indicate there are significant differences between cellulase concentration treatments at the same concentration of xylanase (p < 0.05); different uppercase letter indicates that there are significant difference between different xylanase concentration treatments at the same cellulase concentration (p < 0.05). Table 3.
Effects of cellulase and xylanase on organic acids of silage maize.
-
Xylanase (g·kg−1) Cellulase (g·kg−1) Water content (%) Crude protein (%) Ether extract (%) Crude ash (%) X0 C0 74.33 ± 0.33Aa 5.19 ± 0.14Bc 2.97 ± 0.05Bb 50.05 ± 2.27Aa C0.25 74.33 ± 0.33Aa 5.61 ± 0.16Ab 3.23 ± 0.17Aab 48.76 ± 2.38Aa C0.5 75.33 ± 0.33Aa 6.11 ± 0.05Aa 3.69 ± 0.27Aa 45.80 ± 3.21Aa C1.0 74.67 ± 0.33Aa 5.50 ± 0.11Bbc 3.30 ± 0.07Aab 44.74 ± 0.15Aa X0.25 C0 74.67 ± 0.33Aa 5.71 ± 0.04ABab 3.40 ± 0.18ABa 52.06 ± 1.85Aa C0.25 75.00 ± 0.58Aa 5.51 ± 0.14Abc 3.46 ± 0.09Aa 43.14 ± 0.39Bb C0.5 75.33 ± 0.33Aa 5.39 ± 0.10Bc 3.31 ± 0.08Aa 42.76 ± 3.98Ab C1.0 76.00 ± 0.58Aa 5.92 ± 0.07Aa 3.70 ± 0.18Aa 47.76 ± 1.59Aab X0.5 C0 75.33 ± 0.33Aa 5.93 ± 0.02Aa 3.55 ± 0.22Aa 50.55 ± 1.33Aa C0.25 75.33 ± 0.33Aa 5.89 ± 0.14Aab 3.47 ± 0.13Aa 49.51 ± 0.45Aa C0.5 74.33 ± 0.67Aa 5.49 ± 0.20Bbc 3.54 ± 0.11Aa 45.33 ± 2.13Aa C1.0 75.33 ± 0.33Aa 5.37 ± 0.03Bc 3.63 ± 0.07Aa 49.20 ± 2.04Aa X1.0 C0 75.33 ± 0.67Aa 5.38 ± 0.36ABa 3.53 ± 0.11Aa 50.57 ± 1.40Aa C0.25 75.00 ± 0.00Aa 5.72 ± 0.06Aa 3.75 ± 0.19Aa 49.73 ± 0.95Aa C0.5 75.00 ± 0.58Aa 5.57 ± 0.14Ba 3.62 ± 0.17Aa 48.75 ± 1.08Aa C1.0 75.67 ± 0.33Aa 4.63 ± 0.07Cb 3.42 ± 0.17Aa 49.26 ± 1.33Aa Different lowercase letters indicate there are significant differences between cellulase concentration treatments at the same concentration of xylanase (p < 0.05); different uppercase letter indicates that there are significant difference between different xylanase concentration treatments at the same cellulase concentration (p < 0.05). Table 4.
Effects of cellulase and xylanase on nutritional parameters of silage maize.
-
Treatments Cellulase Xylanase Cellulase* Xylanase pH value 0.749ns 0.925 ns 0.503 ns WSC (%) 0.171ns 0.028 * 0.834ns AN/TN (%) 0.826ns 0.019 * 0.028 * LA (mg·g−1) 0.954ns 0.001** 0.000 ** AA (mg·g−1) 0.239ns 0.000 ** 0.005 ** PA (mg·g−1) 0.780ns 0.012 * 0.000 ** BA (mg·g−1) 0.626ns 0.904ns 0.017 * WC (%) 0.425ns 0.316ns 0.335 ns CP (%) 0.638ns 0.584ns 0.000 ** EE (%) 0.606ns 0.241ns 0.152ns Ash (%) 0.025 * 0.017 * 0.142ns NDF (%) 0.044 * 0.227ns 0.335ns ADF (%) 0.003 ** 0.128ns 0.348ns 'ns' indicates that the difference is not significant (p > 0.05); '*' indicates that the difference is significant (p < 0.05); '**' indicates that the difference is very significant (p < 0.01). Table 5.
Interaction of cellulase and xylanase on the fermentation quality and nutritional components
-
Treatments R1 R2 R3 R4 R5 R6 R7 R8 R9 R10 R11 R12 Average Rank C0.5 0.28 0.85 0.22 0.89 0.70 0.98 0.36 1.00 0.94 0.85 0.67 0.43 0.68 1 C1.0 0.35 0.37 0.19 1.00 0.74 1.00 0.45 0.59 0.42 0.99 0.79 0.61 0.62 2 C0.5-X0.25 0.57 0.45 0.47 0.63 0.51 0.92 0.71 0.51 0.44 0.15 1.00 0.43 0.57 3 C0.25-X0.25 0.48 0.37 0.02 0.83 0.84 0.89 0.59 0.59 0.64 0.34 0.96 0.00 0.55 4 C0.25 1.00 0.29 0.31 0.76 0.92 0.82 0.78 0.66 0.34 0.17 0.35 0.05 0.54 5 C1.0-X0.5 0.70 0.78 0.61 0.22 0.07 0.20 0.45 0.50 0.85 0.69 0.31 1.00 0.53 6 C0.25-X1.0 0.30 0.92 0.59 0.00 0.00 0.89 0.77 0.73 1.00 0.54 0.25 0.29 0.53 7 C1.0-X0.25 0.00 0.49 0.55 0.25 0.01 0.47 1.00 0.87 0.94 0.43 0.46 0.34 0.48 8 C1.0-X1.0 0.44 0.93 0.73 0.15 0.02 0.27 0.73 0.00 0.58 1.00 0.30 0.61 0.48 9 C0-X1.0 0.89 0.45 0.65 0.01 0.00 0.56 0.63 0.51 0.73 0.79 0.16 0.31 0.47 10 C0.5-X0.5 0.39 0.68 0.55 0.18 0.06 0.04 0.49 0.58 0.74 0.57 0.72 0.54 0.46 11 C0-X0.5 0.65 0.68 0.76 0.22 0.09 0.06 0.64 0.88 0.75 0.24 0.16 0.21 0.44 12 C0.5-X1.0 0.24 0.77 0.34 0.03 0.05 0.27 0.37 0.64 0.85 0.65 0.36 0.67 0.44 13 C0.25-X0.5 0.22 1.00 1.00 0.28 0.06 0.00 0.38 0.85 0.65 0.28 0.27 0.23 0.44 14 C0-X0.25 0.41 0.36 0.27 0.79 0.80 0.94 0.00 0.73 0.55 0.00 0.00 0.22 0.42 15 C0 0.33 0.00 0.00 0.58 1.00 0.36 0.55 0.38 0.00 0.41 0.22 0.38 0.35 16 R1~R12 stand for pH, water soluble carbohydrates, ammonia nitrogen/total nitrogen, lactic acid, acetic acid, propionic acid, butyric acid, crude protein, crude extract, crude ash, neutral detergent fiber and acid detergent fiber. Table 6.
Analysis of silage maize membership function and comprehensive value ranking.
Figures
(1)
Tables
(6)