-
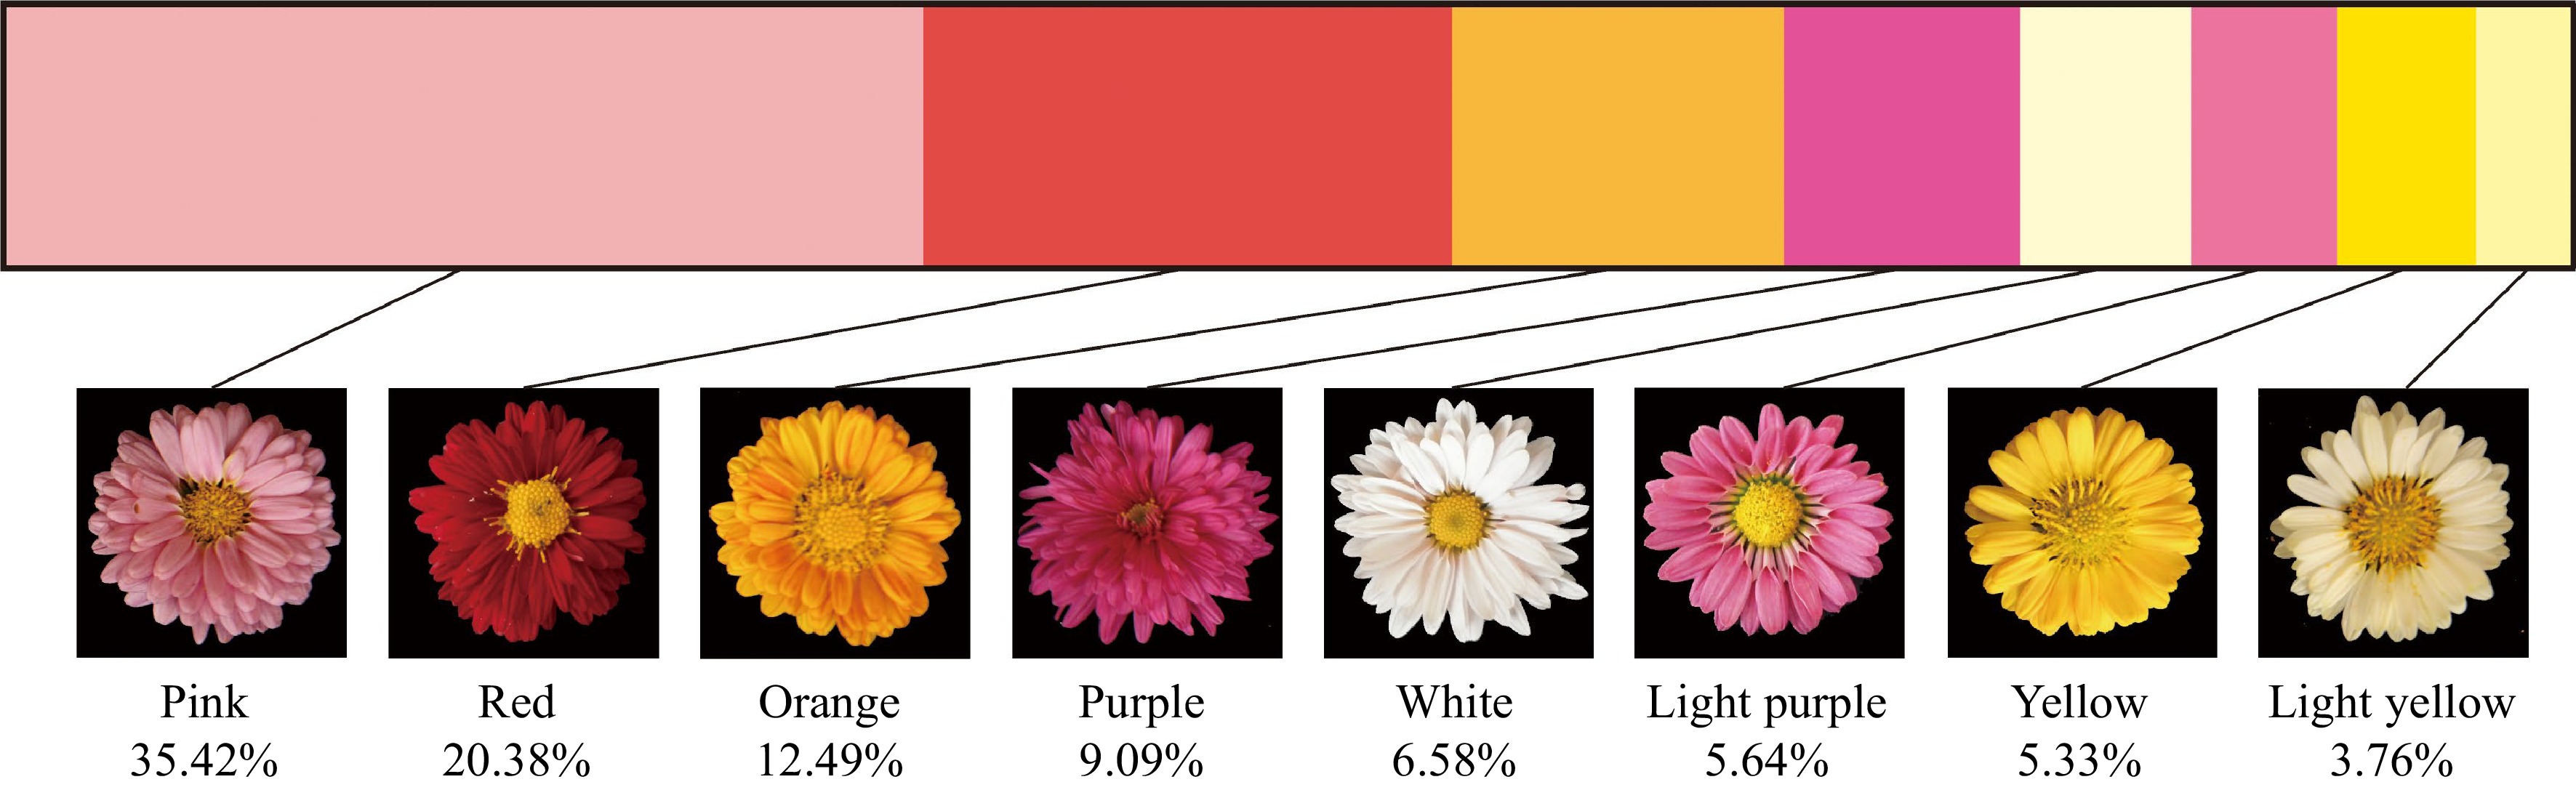
Figure 1.
The distribution of different color group in F1 hybrids.
-
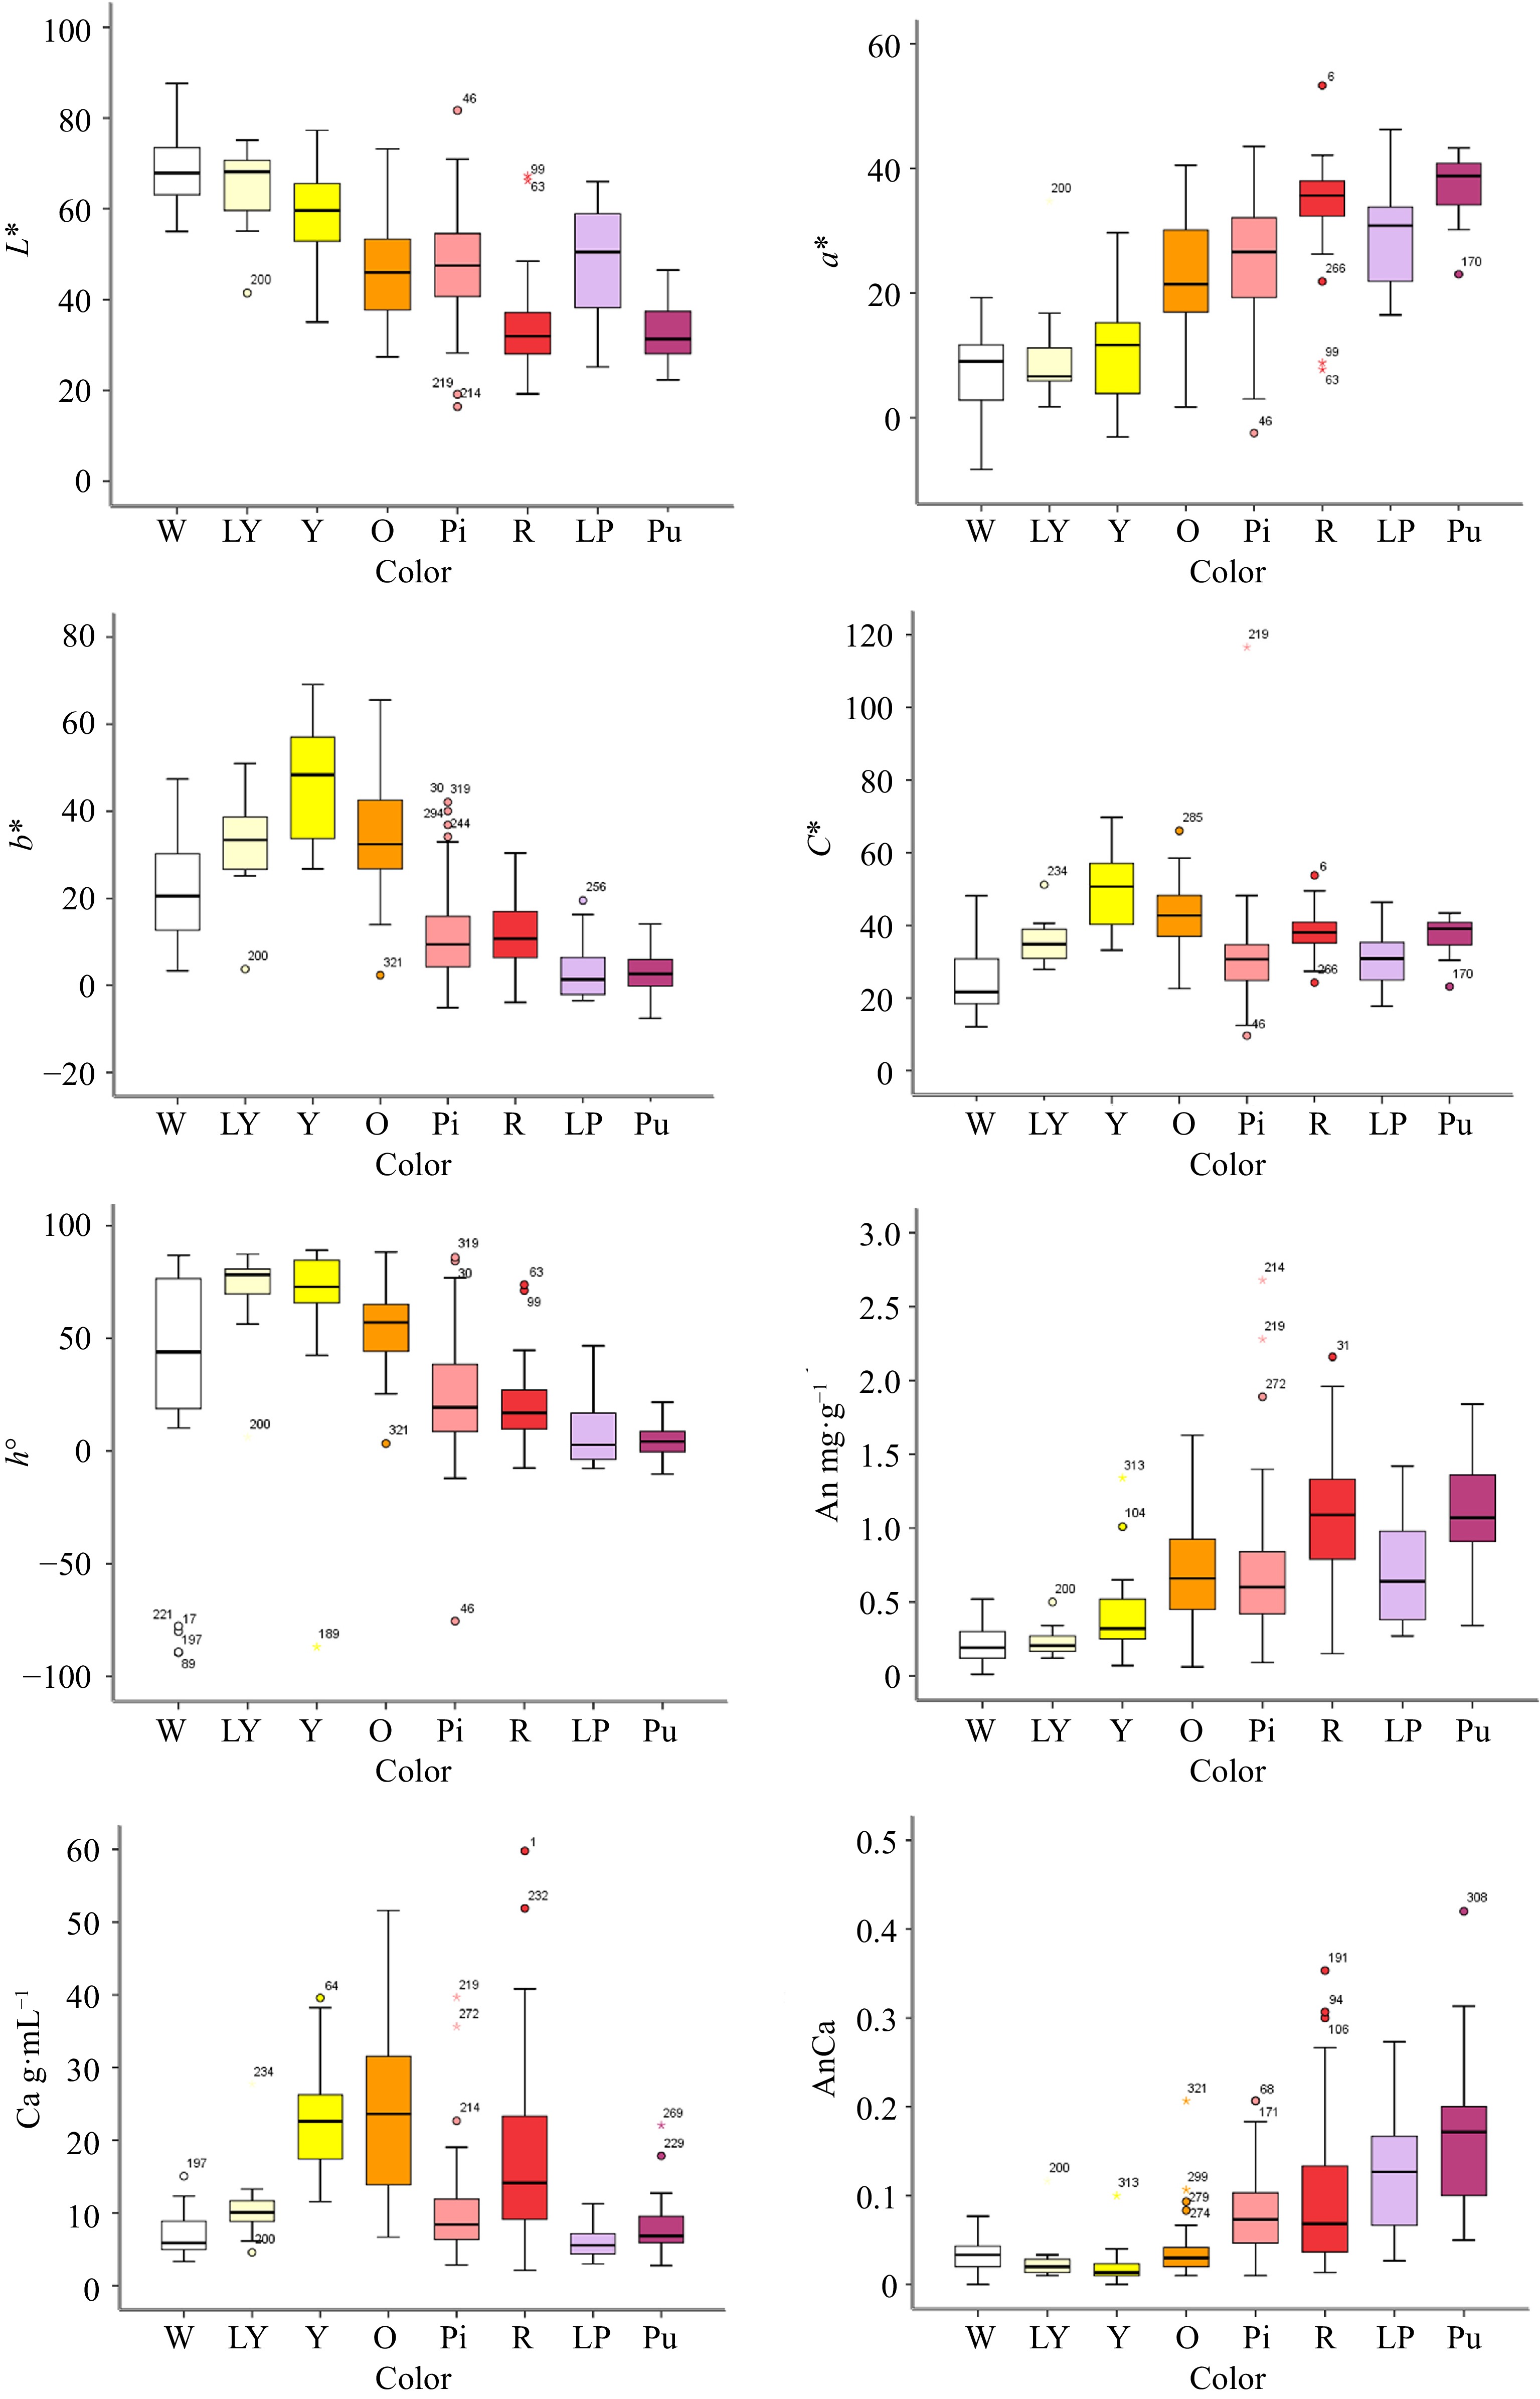
Figure 2.
The box plot of different color group of F1 hybrids according to flower color L*, a*, b*, C*, h° and flower pigment content. Note: Error bars refer to the standard error of the mean. X-axis label abbreviations: W, White; LY, Light Yellow; Y, Yellow; O, Orange; Pi, Pink; R, Red; LP, Light Purple; Pu, Purple. Y-axis label abbreviations: An, Anthocyanin content; Ca, Carotenoid content; AnCa, Anthocyanin content/Carotenoid content.
-
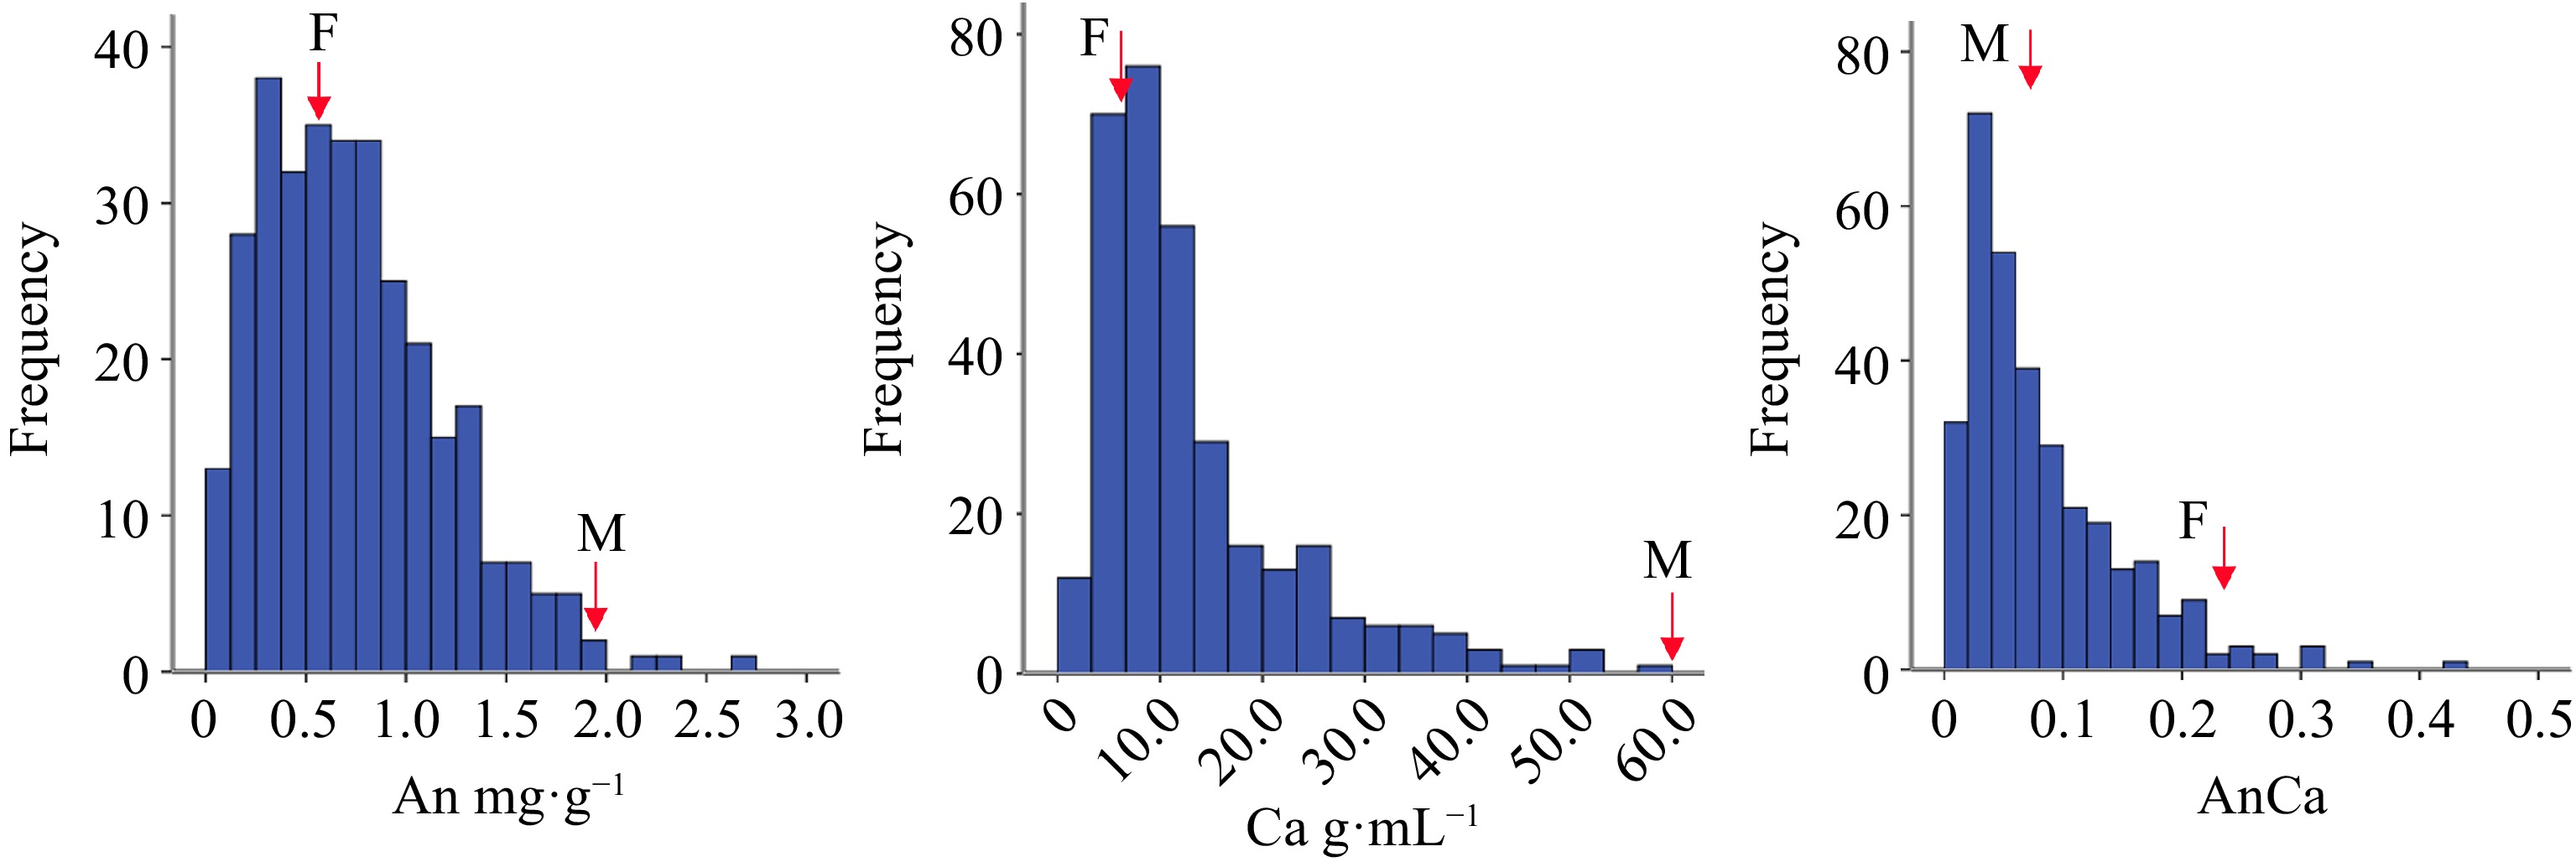
Figure 3.
The box plot of different color group of F1 hybrids according to flower pigment. Note: Anthocyanin content (An); Carotenoid content (Ca); Anthocyanin content/Carotenoid content (AnCa).
-
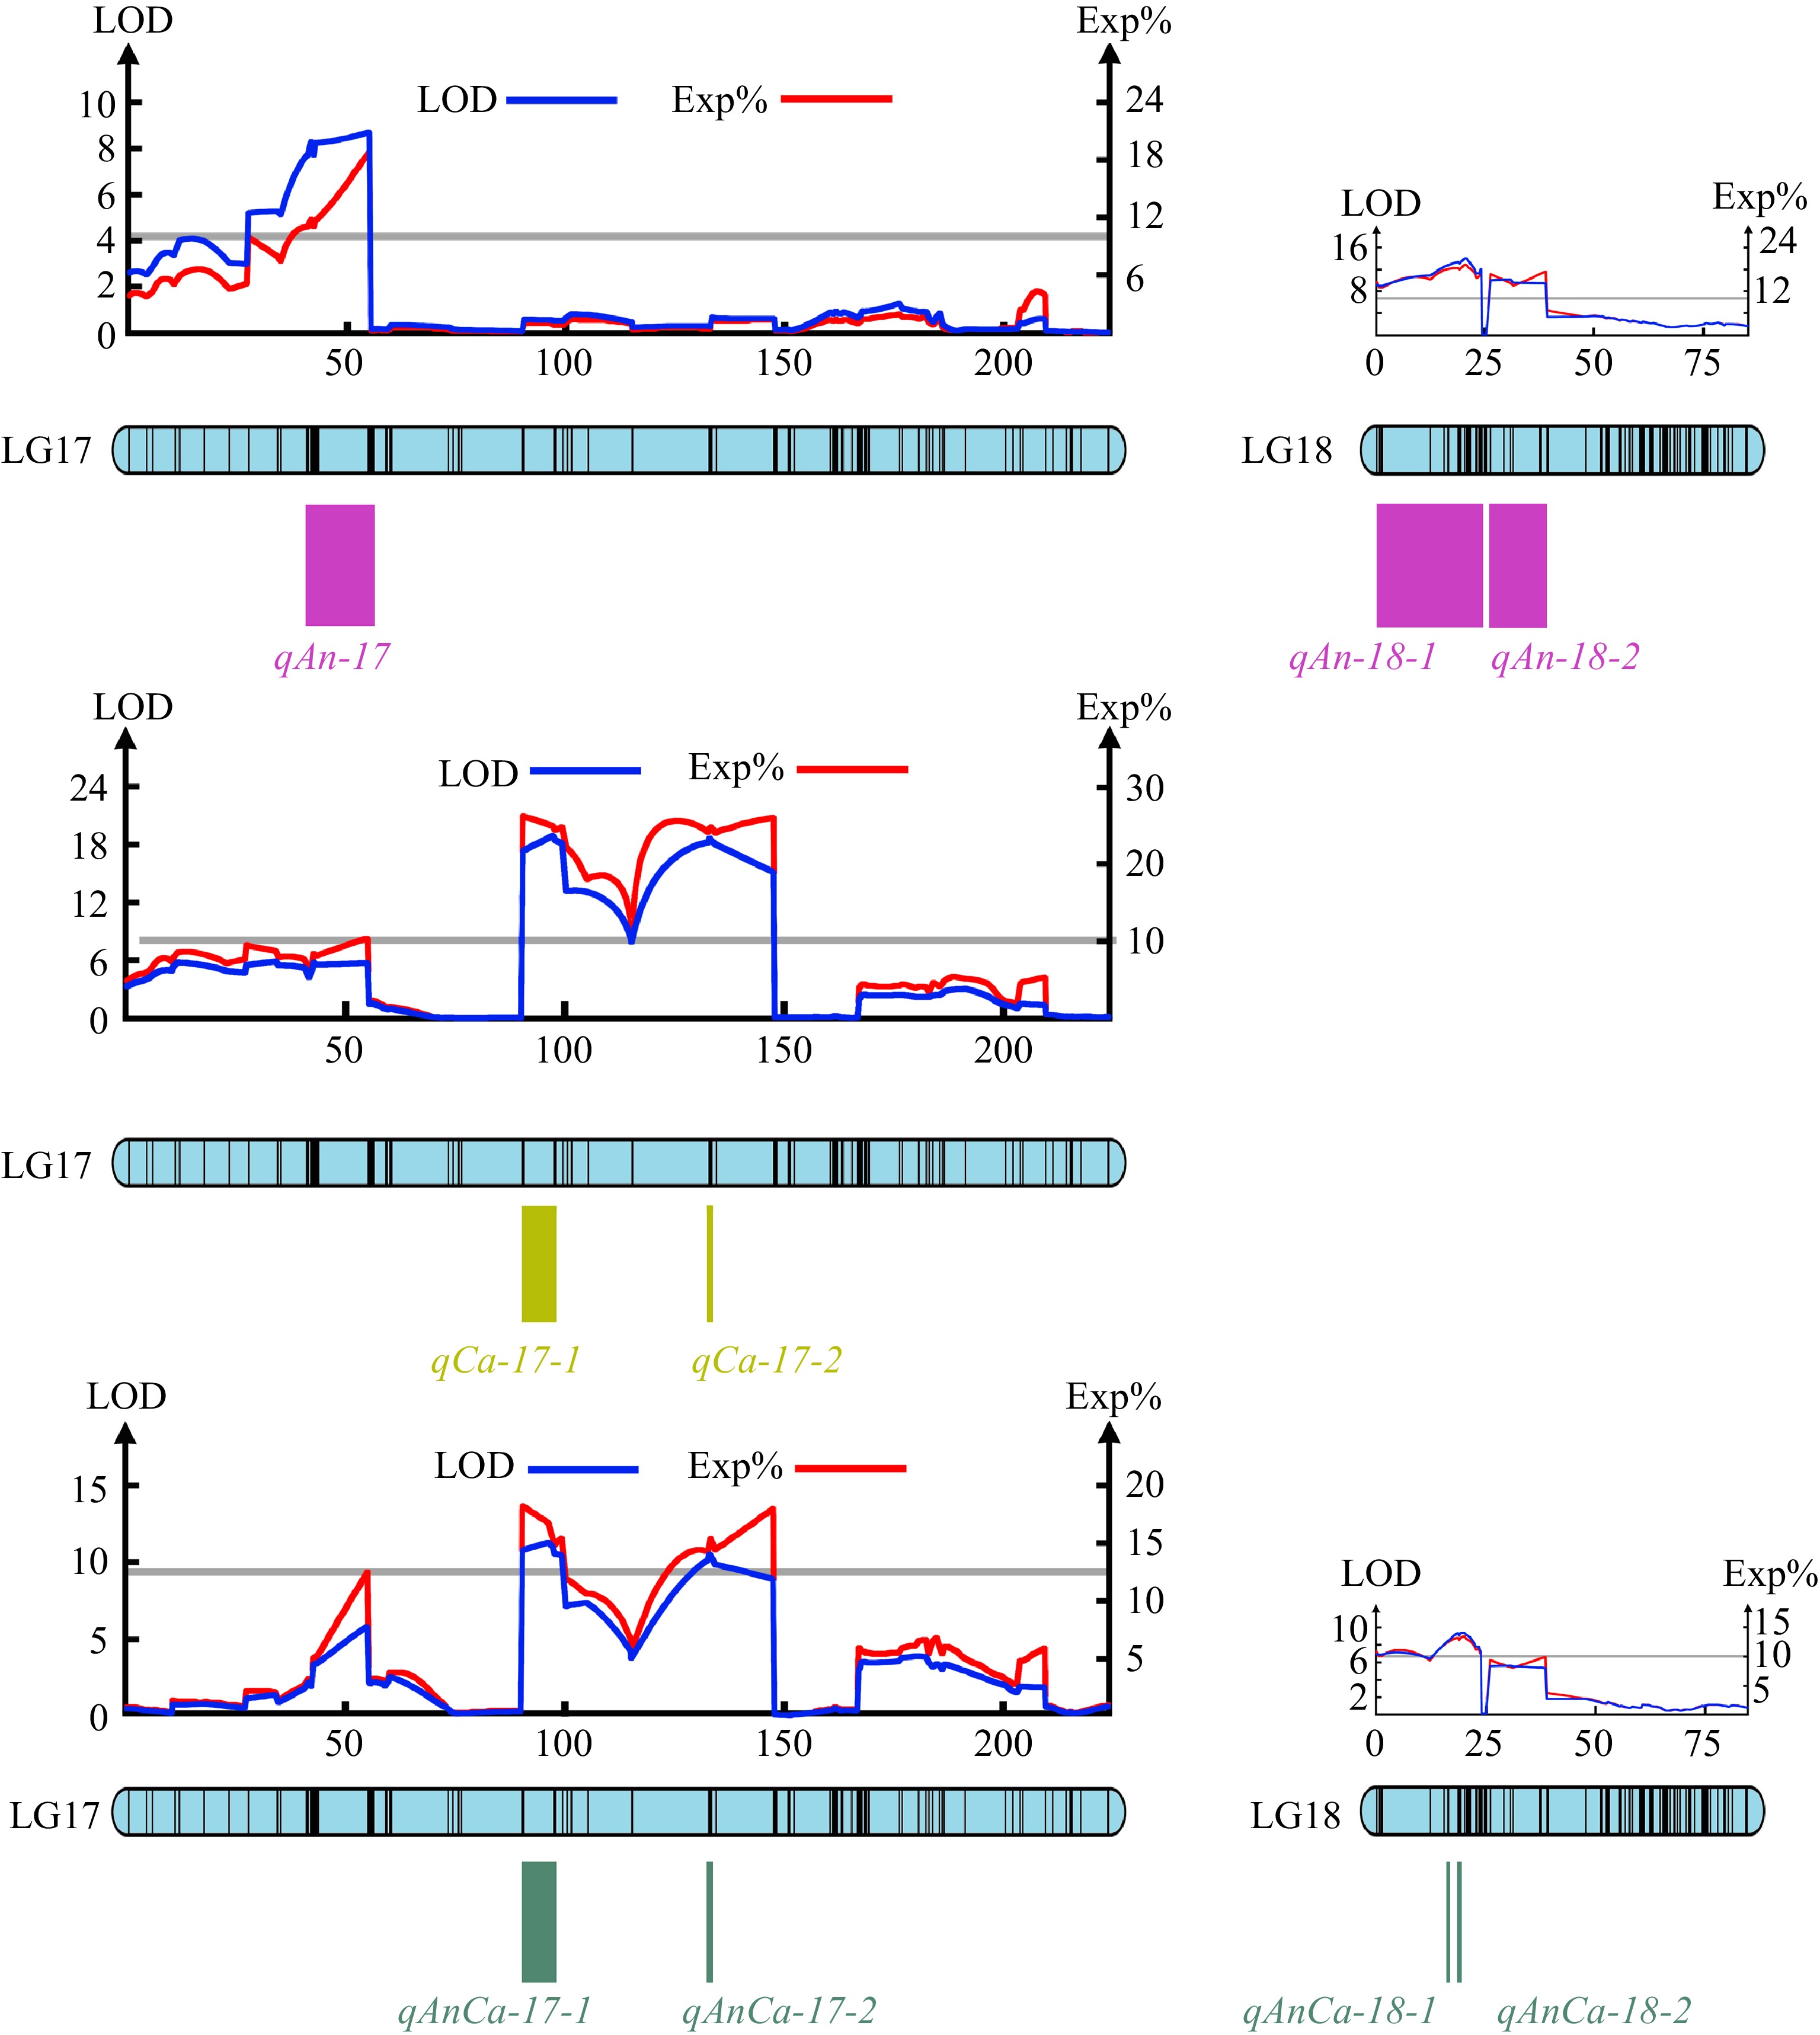
Figure 4.
The major QTLs tested for the total anthocyanins content, carotenoids content and anthocyanins/carotenoids content.
-
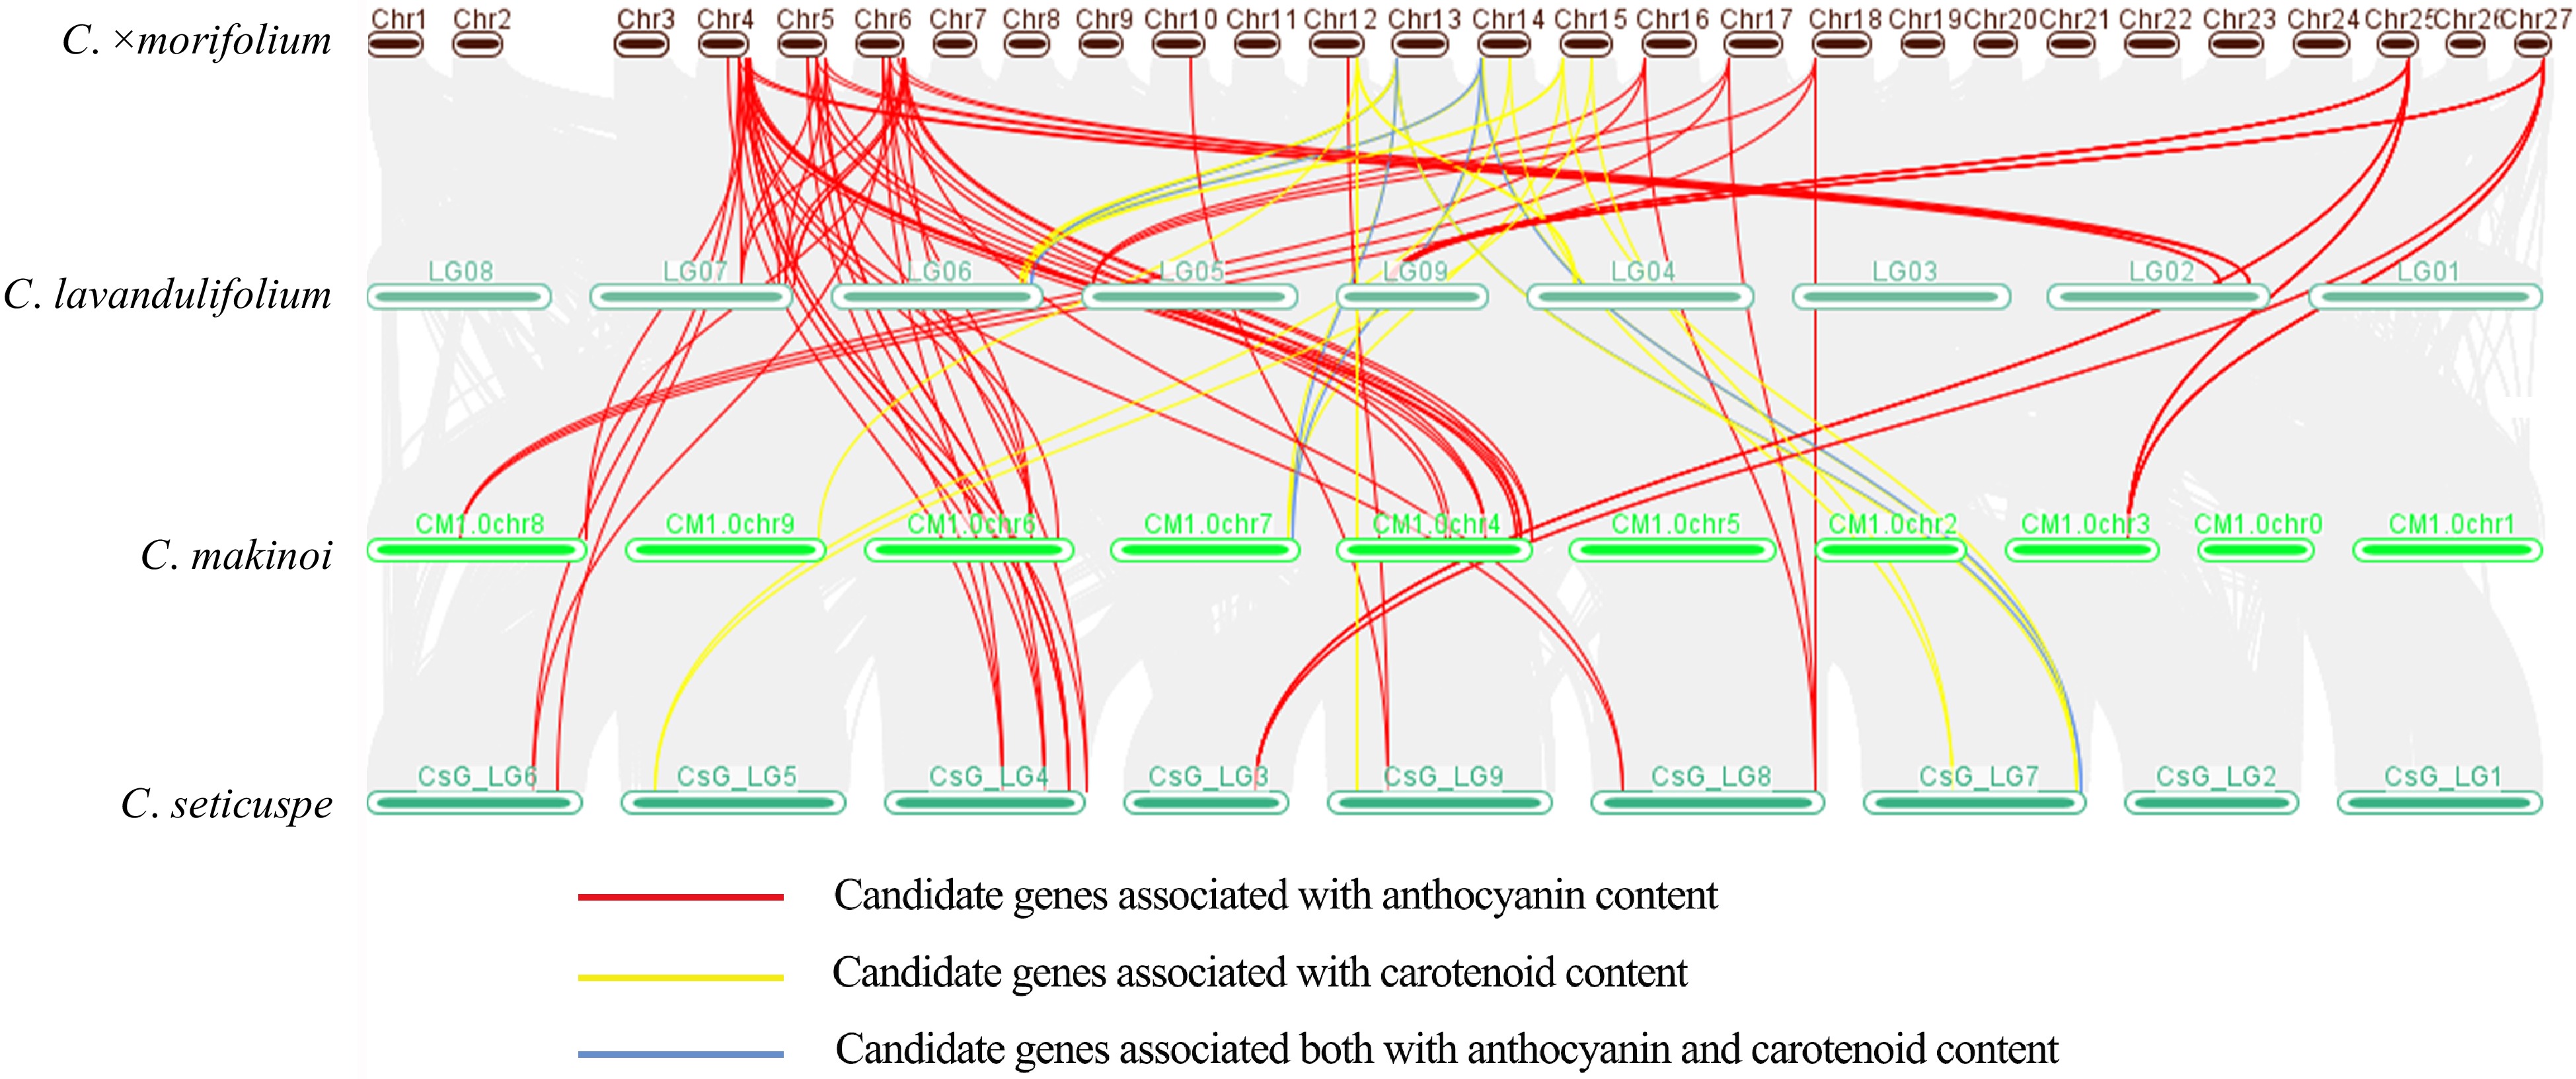
Figure 5.
Collinearity analysis of candidate genes related to pigment content in three genomes of diploid species of Chrysanthemum and the first genome of cultivated chrysanthemum.
-
Model An (mg·g−1) Ca (g·ml−1) An/Ca A-0 407.87 2359.44 −725.42 A-1 388.34 2233.06 −813.00 A-2 409.88 2361.45 −723.41 A-3 411.87 2363.44 −721.42 A-4 411.87 2363.44 −721.42 B-1 391.41 2184.52 −891.78 B-2 381.88 2182.94 −945.85 B-3 411.89 2363.44 −721.41 B-4 409.87 2361.45 −723.40 B-5 411.87 2363.44 −721.42 B-6 409.87 2361.44 −723.42 Table 1.
AIC values under different genetic models.
-
Traits The
number
of QTLsLinkage group The number
of QTL
associated
markersLOD threshold Exp% L* 2 LG18 63 18.88−30.51 33.60−37.10 a* 2 LG18 63 19.66−27.99 31.50−39.00 b* 5 LG17, LG18 100 9.91−19.37 16.4−32.30 C* 2 LG6 5 11.43−11.46 22.40 h° 5 LG17, LG18 113 7.82−14.01 13.4−25.40 An 3 LG17, LG18 97 8.67−14.12 17.60−19.3 Ca 2 LG17 36 18.66−18.92 24.80−26.20 An/Ca 4 LG17, LG18 40 9.35−11.00 13.20−18.30 Table 2.
QTLs test for traits of flower color and pigment content.
Figures
(5)
Tables
(2)