


-
Flower color refers to the visual color of flowers and is one of the most important features of ornamental plants[1]. In physics, color is a property of light, and the flower color is due to the combined effect of specific wavelength absorption by pigments and light scattering by the petals[2]. From a chemical viewpoint, different types and content of pigments play a role in the flower coloration[3]. Other factors, such as intracellular pH[4] and metal ions[5], also affect the coloration. To analyze the relationship between the flower color and pigmentation, and to elucidate the genetic mechanism of flower coloration can provide a guide for ornamental plant flower color directional breeding.
A quantitative and accurate determination of the flower color is a prerequisite for the study of the relationships between the flower color and pigments[6]. In the past, flower color was identified by visual observation or using the RHSCC (Royal Horticultural Society Color Chart)[7] for color measurement. Instrumental color measurement is currently the most accurate method for flower color determination[7]. The instrument provides an accurate and quantitative representation of flower color based on a predefined color space. Recently, the CIELAB color space has been extensively used to quantify the flower color, such as C. morifolium[6], Osmanthus fragrans[8], Paeonia spp.[9] and Rosa spp.[10]. The CIELAB color space system provides an accurate and uniform color measurement by calculating color on three axes, which is L* (lightness), a* (redness), and b* (yellowness)[11].
The difference in flower color is attributed to the presence of pigments in chromoplasts or cell vacuoles of floral tissues. The pigments are divided into three classes: carotenoids, flavonoids, and betalains[3]. Different pigment accumulations lead to different flower colorations. Flavonoids have a color range from yellow to blue, carotenoids are yellow, red, and orange pigments, betalains, which confer yellow to red colors, are found only in a limited number of plants[12]. The relationship between flower color and pigments has been analyzed and found to be largely different across different species[13−15].
Chrysanthemum (Chrysanthemum × morifolium Ramat.) is a world well-known flower originating from China. Chrysanthemum has a long history of cultivation and the highest abundance of phenotypic variation among the world's ornamental plants[16,17]. Small-flowered chrysanthemums have the characteristics of a small capitulum diameter (< 6 cm)[18], a round plant type, dense flowers and bright colors, so they are often used in square flower beds, flower borders and landscaping, showing a broad application prospect. Among the many phenotypic traits, flower color is one of the most abundant traits and is a major objective of chrysanthemum breeding due to its strong influence on consumer choice.
The flower color of chrysanthemums is mainly determined by carotenoids and flavonoids[19−21]. Carotenoids lend yellow, orange and bright red colors to flowers. Flavonoids produce a variety of colors from yellow to red, blue and dark purple. Anthocyanins are the largest class of flavonoids and the main color-forming pigment.
In chrysanthemum flower color research, the relationship between pigments and flower color has been studied. A correlation analysis between flower color and pigment content found that the a* and b* were strongly positively correlated with the total amounts of anthocyanins and carotenoids respectively[6].
However, the molecular regulatory mechanisms by which pigments affect flower coloration are very complex[3,12]. The synthesis, transport, and localization of pigments in plants involve complex metabolic pathways that are regulated not only by multiple structural genes[1], but also by multiple transcription factors and their constituent complexes[22], and epigenetic modifications play an important role[19]. This allows traits related to flower color, both in terms of visual flower color differences and pigment content, to be expressed as complex quantitative traits[6].
In addition, chrysanthemums have a complex genetic background, and a variety of wild chrysanthemum species, such as C. vestitum[23] and C. lavandulifolium[24], as well as C. rhombifolium and C. indicum from Nanjing (China)[25] are suggested to be related to the origin of the cultivated chrysanthemums. These reasons make it difficult to resolve the genetic mechanism of chrysanthemum flower color.
Genetic analysis of hybrid populations and QTL analysis via high-density genetic mapping are currently two of the most effective methods for exploring and comprehending the genetic relationships of complex quantitative traits, as well as identifying the locations of critical genes. Among them, genetic analysis can reveal multiple genes regulate quantitative traits at the population level. Several studies have conducted genetic analyses of important ornamental traits such as leaf morphology[26], flowering time[27], flower type[28], and branching trait[29] in chrysanthemums. In studies on the genetic analysis of flower color in chrysanthemums, researchers have used different methods of flower color classification to record flower color, but they all regard it as a qualitative trait[30−33]. This method masks the subtle differences among the flower colors of different strains.
QTL analysis based on high-density genetic linkage mapping can provide the exact location on the chromosome of genes associated with the target trait, and this method has been widely used in a variety of ornamental plants, such as C. morifolium[34], Rosa chinensis[35], Paeonia Sect. Moutan[36] and Osmanthus fragrans[37]. In addition, for complex traits, intrinsic genetic regulatory pathways are often controlled by many genes, and current research has focused on individual identified genes[38]. High-density genetic maps can identify some important and possibly undiscovered genes.
Chrysanthemum has a highly heterozygous genome and is a self-incompatible ornamental plant[39]. Most cultivars of chrysanthemum are hexaploid or aneuploid[40]. Therefore, it has been a great challenge to construct a high-density genetic map of chrysanthemums. Only three genetic maps of chrysanthemum have been published, and none of them have resolved the genetic mechanism of flower color and pigment content from the perspective of quantitative traits.
The first genetic map of chrysanthemum was constructed based on the F1 population of 142 single strains and 597 markers, with an average map distance between the parents' markers of 6.9 cM and 6.6 cM respectively. The study found some QTLs related to floret number, floret size and inflorescence size[41]. In another study, a high-density genetic map of chrysanthemum was constructed based on 30,312 SNP markers for an F1 population of 406 individual plants. Some QTLs related to flower color, flowering time and number of ligule flowers were found[42]. However, the first genetic map did not contain a complete chain group, and it was difficult to achieve the subsequent fine localization of important traits.
For the second genetic map of chrysanthemum, the distribution of the markers developed by the transcriptome was concentrated on the genome, and the uniformity and coverage of the genetic map could not be guaranteed. Although flower color was considered as a target trait in the second research, flower color phenotype data were obtained by visual inspection and did not involve pigment content differences.
The third genetic map of chrysanthemum was constructed using SLAF-seq technique with an average map distance of 0.76 cM, and several QTLs controlling the degree of corolla tube merging and the relative number of ray florets were identified[34]. This genetic linkage map could lay the foundation for the QTL analysis of flower color and pigment content differences in this study.
In this study, we studied the variation and distribution of flower color and pigment content in a crossed population of chrysanthemums, and investigated the correlation between flower color and different pigment contents. The genetic effects and genetic models of flower pigment were analyzed by using heterozygous dominance and mixed genetic models. The high-density genetic map of chrysanthemum was used to analyze QTLs for these traits. This study lays the foundation for further use of molecular markers closely linked to chrysanthemum flower color, and provides new references for chrysanthemum flower color directed breeding.
-
During the autumn of 2013, an artificial cross was performed between Chrysanthemum × morifolium ‘Candy’ and C. × morifolium ‘225’. The female parent 'Candy' was a pink cultivar, while the male parent '225' was a red cultivar, and a total of 319 F1 hybrid offspring were obtained[34]. The F1 hybrid seeds were directly sown in May 2014. Floral traits of the hybrids were stable in two consecutive years (the autumn of 2014 and 2015) of asexual reproduction.
In early April 2015, a healthy, disease-free, 7−8 cm cutting was obtained from the parents and hybrids and planted in a seeding tray of 81 holes (a single hole area of 7.5 cm square, 9.3 cm deep) in a mix of peat and perlite (volume ratio: 3:1); 25 d later, the rooted cuttings were placed in pots (diameter 21 cm, 15 cm deep). Proper water, fertilizer and pest control were performed throughout the growing season. The materials used for the experiment were all stored in the Nursery of Beijing Forestry University, Beijing, China (40.1608°N, 116.4595°E) under natural temperature and light conditions. The detailed procedure is shown in Supplemental materials.
Measurement of flower color and pigment content
-
The flower color traits of the parent plants and the F1 population were investigated in the autumn blooming periods of 2015 and 2016. These traits mainly included the flower color phenotype and pigment content. The specific testing methods were as follows.
The capitulum development of C. morifolium was divided into five stages[22], and the blooming period, S4, was used as the standard for the measurement of color. Using a colorimeter (NF333, Nippon Denshoku Industries Co., Ltd., Japan) under the condition of light source C/2°, the L*, a*, b*, C* (chroma) and h° (hue) values of chrysanthemum ray florets were determined. According to the method of Lu et al.[6], three individual plants were selected from each strain, and each individual was measured in triplicate. For each individual, we selected three capitula at the S4 stage and took one ray floret of the outer whorl from each capitulum for phenotypic measurements.
In the determination of the total anthocyanin and total carotenoid content, three replicates were performed for each strain. We selected three individual plants from each strain. For each individual, we took fresh ray florets located in the outer whorl from one or two capitula. Each floret sample was weighed 0.1 g. Then we placed each sample in a 10 ml centrifuge tube and concentrated it to dryness under liquid nitrogen. After removing the samples from the liquid nitrogen, they are quickly ground in 3 to 5 s, and 5 ml of extraction solution was added. For the determination of total anthocyanin content, the ratio of extraction solution is 1:99 between hydrochloric acid and methanol. For the determination of total carotenoid content, the ratio of extraction solution is 1:1 between ethanol and acetone. Extraction was performed at 4 °C for more than 12 h under dark conditions.
For the determination of total anthocyanin, an ultraviolet-visible spectrophotometer (UV2600, Shimadzu, Japan) was used for scanning in the range of 500−600 nm. For the determination of total carotenoid, the scanning was performed in the range of 400−500 nm. The scanning interval was 2 nm, and the light diameter of the quartz cuvette was 1.0 cm. The optical density at the maximum absorption peak of each line was determined. According to the extinction coefficient of total anthocyanins (98.2) and total carotenoids (2500), the content of total anthocyanins and total carotenoids were obtained[43].
Data analysis
-
Mean value, standard deviation and coefficient of variation of the flower color phenotype and pigment content were calculated. The relationship between different traits was discussed on the basis of Pearson correlation analysis. The heterosis of the phenotypic parameters and pigment content in the hybrid offspring was measured according to the mid-parent value (MPV), mid-parent heterosis (Hm) (Eq. 1), and ratio of mid-parent heterosis (RHm) (Eq. 2). The MPV represented the average between the parents and the Hm represented the difference between the average value for the F1 offspring and the average value for the parents.
The formulas used for these calculations are as follows:
$ Hm={F}_{1}-({P}_{1}+{P}_{2})/2 . $ (1) $ RHm=\frac{{F}_{1}-MP}{MP}\times 100\% . $ (2) Where
$ {P}_{1} $ $ {P}_{2} $ $ {F}_{1} $ $ MP $ For chrysanthemum, the F1 population was considered a pseudo-F2 population in the genetic analysis in accordance with the double-pseudo-testcross strategy[44]. Single-generation segregation analysis as described by Gai[45] was used to analyze the mixed inheritance model for the pigment content of hybrid progeny. We used a total of 11 kinds of genetic models and calculate the various properties of the genetic parameter values. Then, we select the optimal model according to the Akaike Information criterion (AIC) value minimum standards, and evaluated the model by the goodness-of-fit test. The specific parameters were the same as those describe by Gao et al.[26] Finally, the major gene heritability was calculated according to Song et al.[28] The analysis software SEgregation Analysis (SEA) was provided by Cao et al.[46]
QTL analysis and collinearity analysis
-
In previous research, we constructed a high-density genetic linkage map with an average map distance of 0.76 cM based on this population[34]. Based on this genetic map, the QTL analysis was carried out on the flower color parameters and pigment content using MapQTL® 6 software[47]. The specific analysis was performed according to Gao et al.[26] The rice character QTL naming method of McCouch et al.[48] was adopted.
We aligned the genetic map with the genome of C. nankingense by using BLAST+ with the parameters of an E-value < 1E-5 and a bitscore > 60. However, the C. nankingense genome has not been mapped to chromosomes, so to further verify the effectiveness of these candidate genes, a collinearity analysis was performed in four chromosome level genomes, including three genomes of the genus Chrysanthemum and the first genome of cultivated chrysanthemum. The results were visualized by using TBtools[49].
-
The analysis of variance showed that the color parameters L*, a*, b*, C* and h° were not significantly different within the different lines (p < 0.05), indicating that the color phenotype showed high consistency in the lines and was less affected by the environment. There were significant differences among the different lines (p < 0.01), which indicated that the flower colors of the different lines were significantly different. The variation coefficients of the flower color phenotypes among the different lines in the hybrid offspring were, from large to small, h° (108.77%), b* (94.07%), a* (45.72%), L* (31.16%), and C* (30.01%), all of which were greater than 30%, indicating that the flower color was clearly separated in the hybrid offspring (Supplemental Table S1).
The differences in the total anthocyanin content, total carotenoid content and total anthocyanin content/total carotenoid content among the lines were not significant, indicating that the contents of different pigments in chrysanthemums showed high consistency in the lines and were less affected by the environment. Significant differences were found among different lines (p < 0.01). The coefficients of variation among the different lines were 61.94%, 75.05% and 83.94%, indicating that the pigment content was significantly different from that in the offspring. The coefficient of variation of the total carotenoid content was higher than that of the total anthocyanin content, indicating that the carotenoid content in the hybrid progeny had a greater impact on flower color. The results laid a foundation for the genetic analysis of chrysanthemum flower color (Supplemental Table S1).
Classification of the flower color of hybrid offspring
-
By collecting CIELAB color system parameters and referring to the classification of chrysanthemum flowers[50], the hybrid offspring were divided into eight color groups: white, light yellow, yellow, orange, pink, red, light purple and purple. Figure 1 showed the distribution of the flower color phenotype in the hybrid offspring. Among the 319 hybrid offspring lines, the number of pink lines was the greatest, accounting for 35.42% (113) of the lines. The red and the orange series showed the next highest percentages, of 20.38% (65) and 13.79% (44), respectively. The proportions of purple, white and light purple lines were 9.09% (29), 6.58% (21) and 5.64% (18), respectively. Yellow and light yellow lines accounted for smaller proportions of 5.33% (17) and 3.76% (12), respectively (Fig. 1).
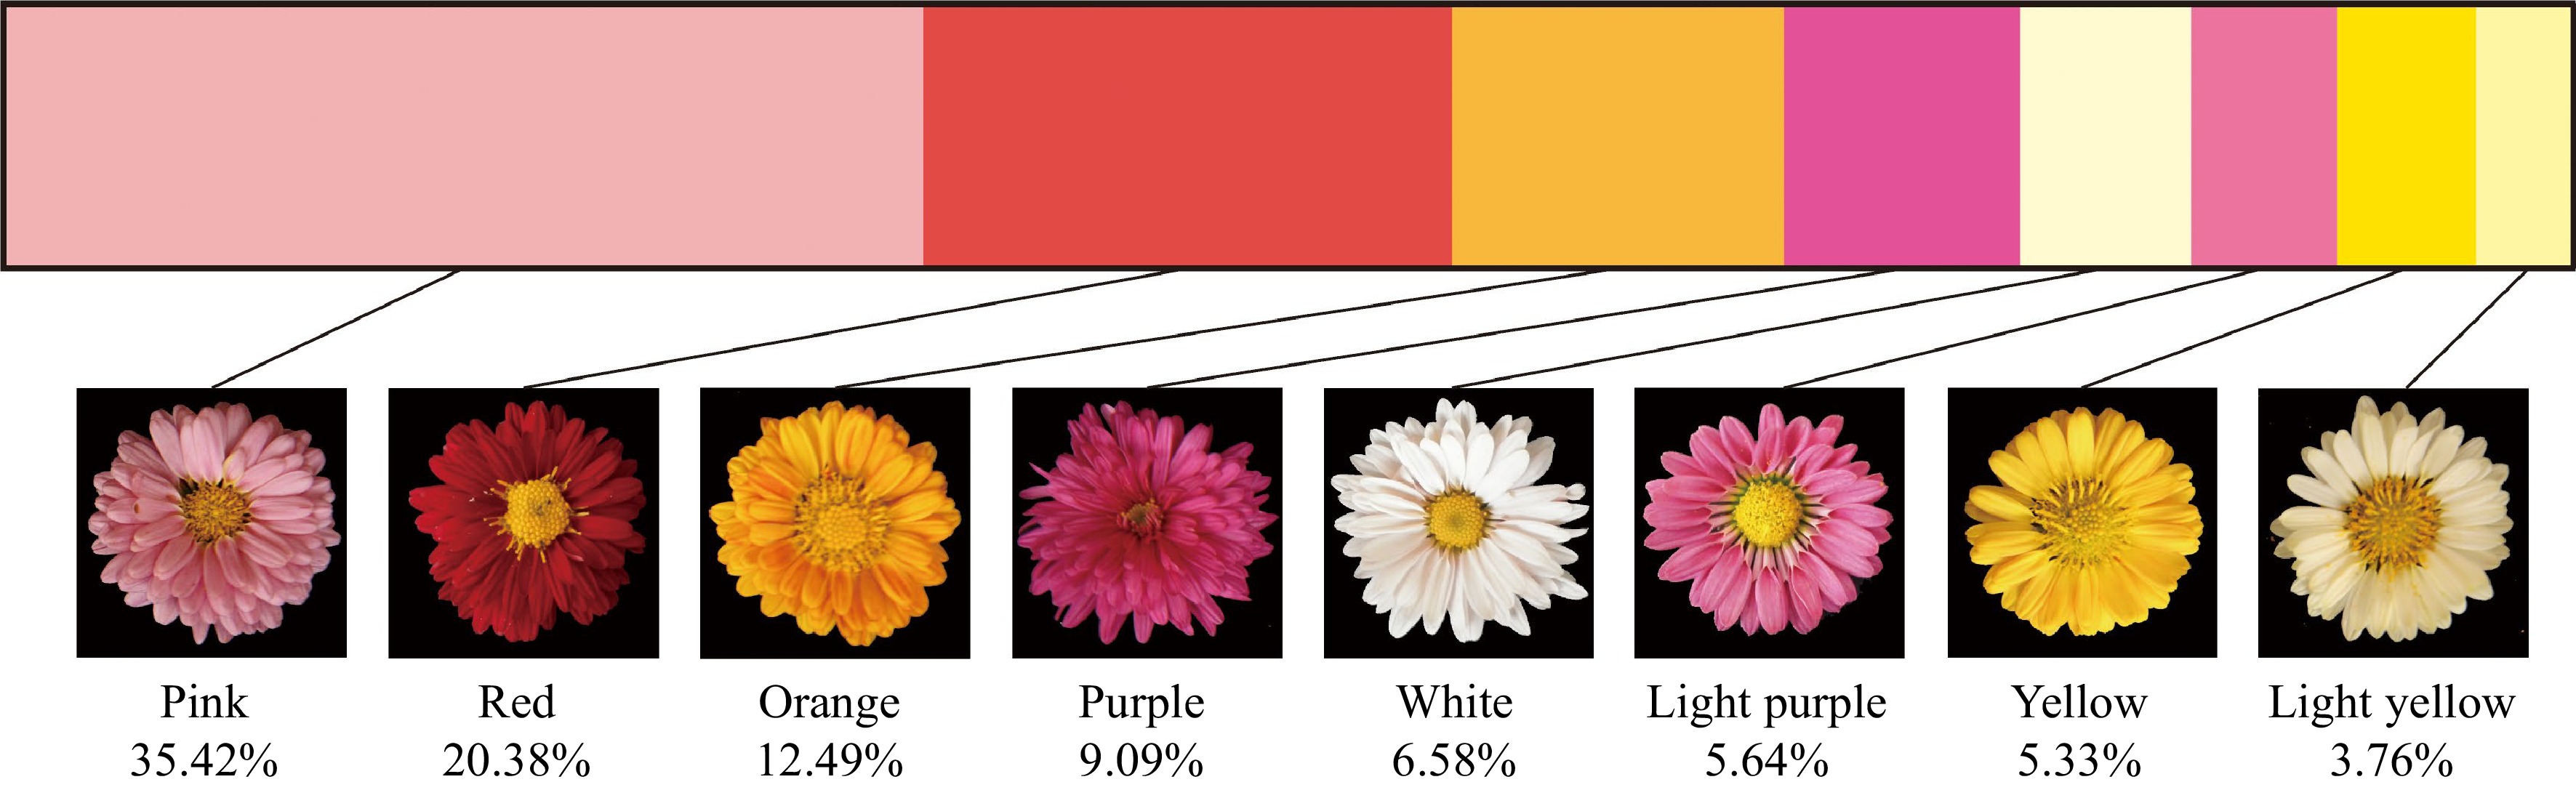
Figure 1.
The distribution of different color group in F1 hybrids.
Among the flower color parameters, the L* values of the white, light yellow and yellow lines were high and concentrated, while the L* values of the red and purple lines were concentrated and distributed at a lower position, and the values of the other colors were distributed in intermediate positions (Fig. 2). The a* values of the red and purple lines were high, whereas those of the light purple, orange, pink, white, light yellow and yellow lines were relatively low. The values of b* in the yellow and orange lines were large, while the distribution of these values in the light purple and purple lines was relatively low and concentrated. The C* values of the red, yellow, orange and purple lines were high, and the distribution of the C* values of the red lines was concentrated, while the distribution of these values for the other colors was relatively low. The values of h° for the light yellow, yellow and orange lines were high, while those for the other colors were distributed at lower positions.
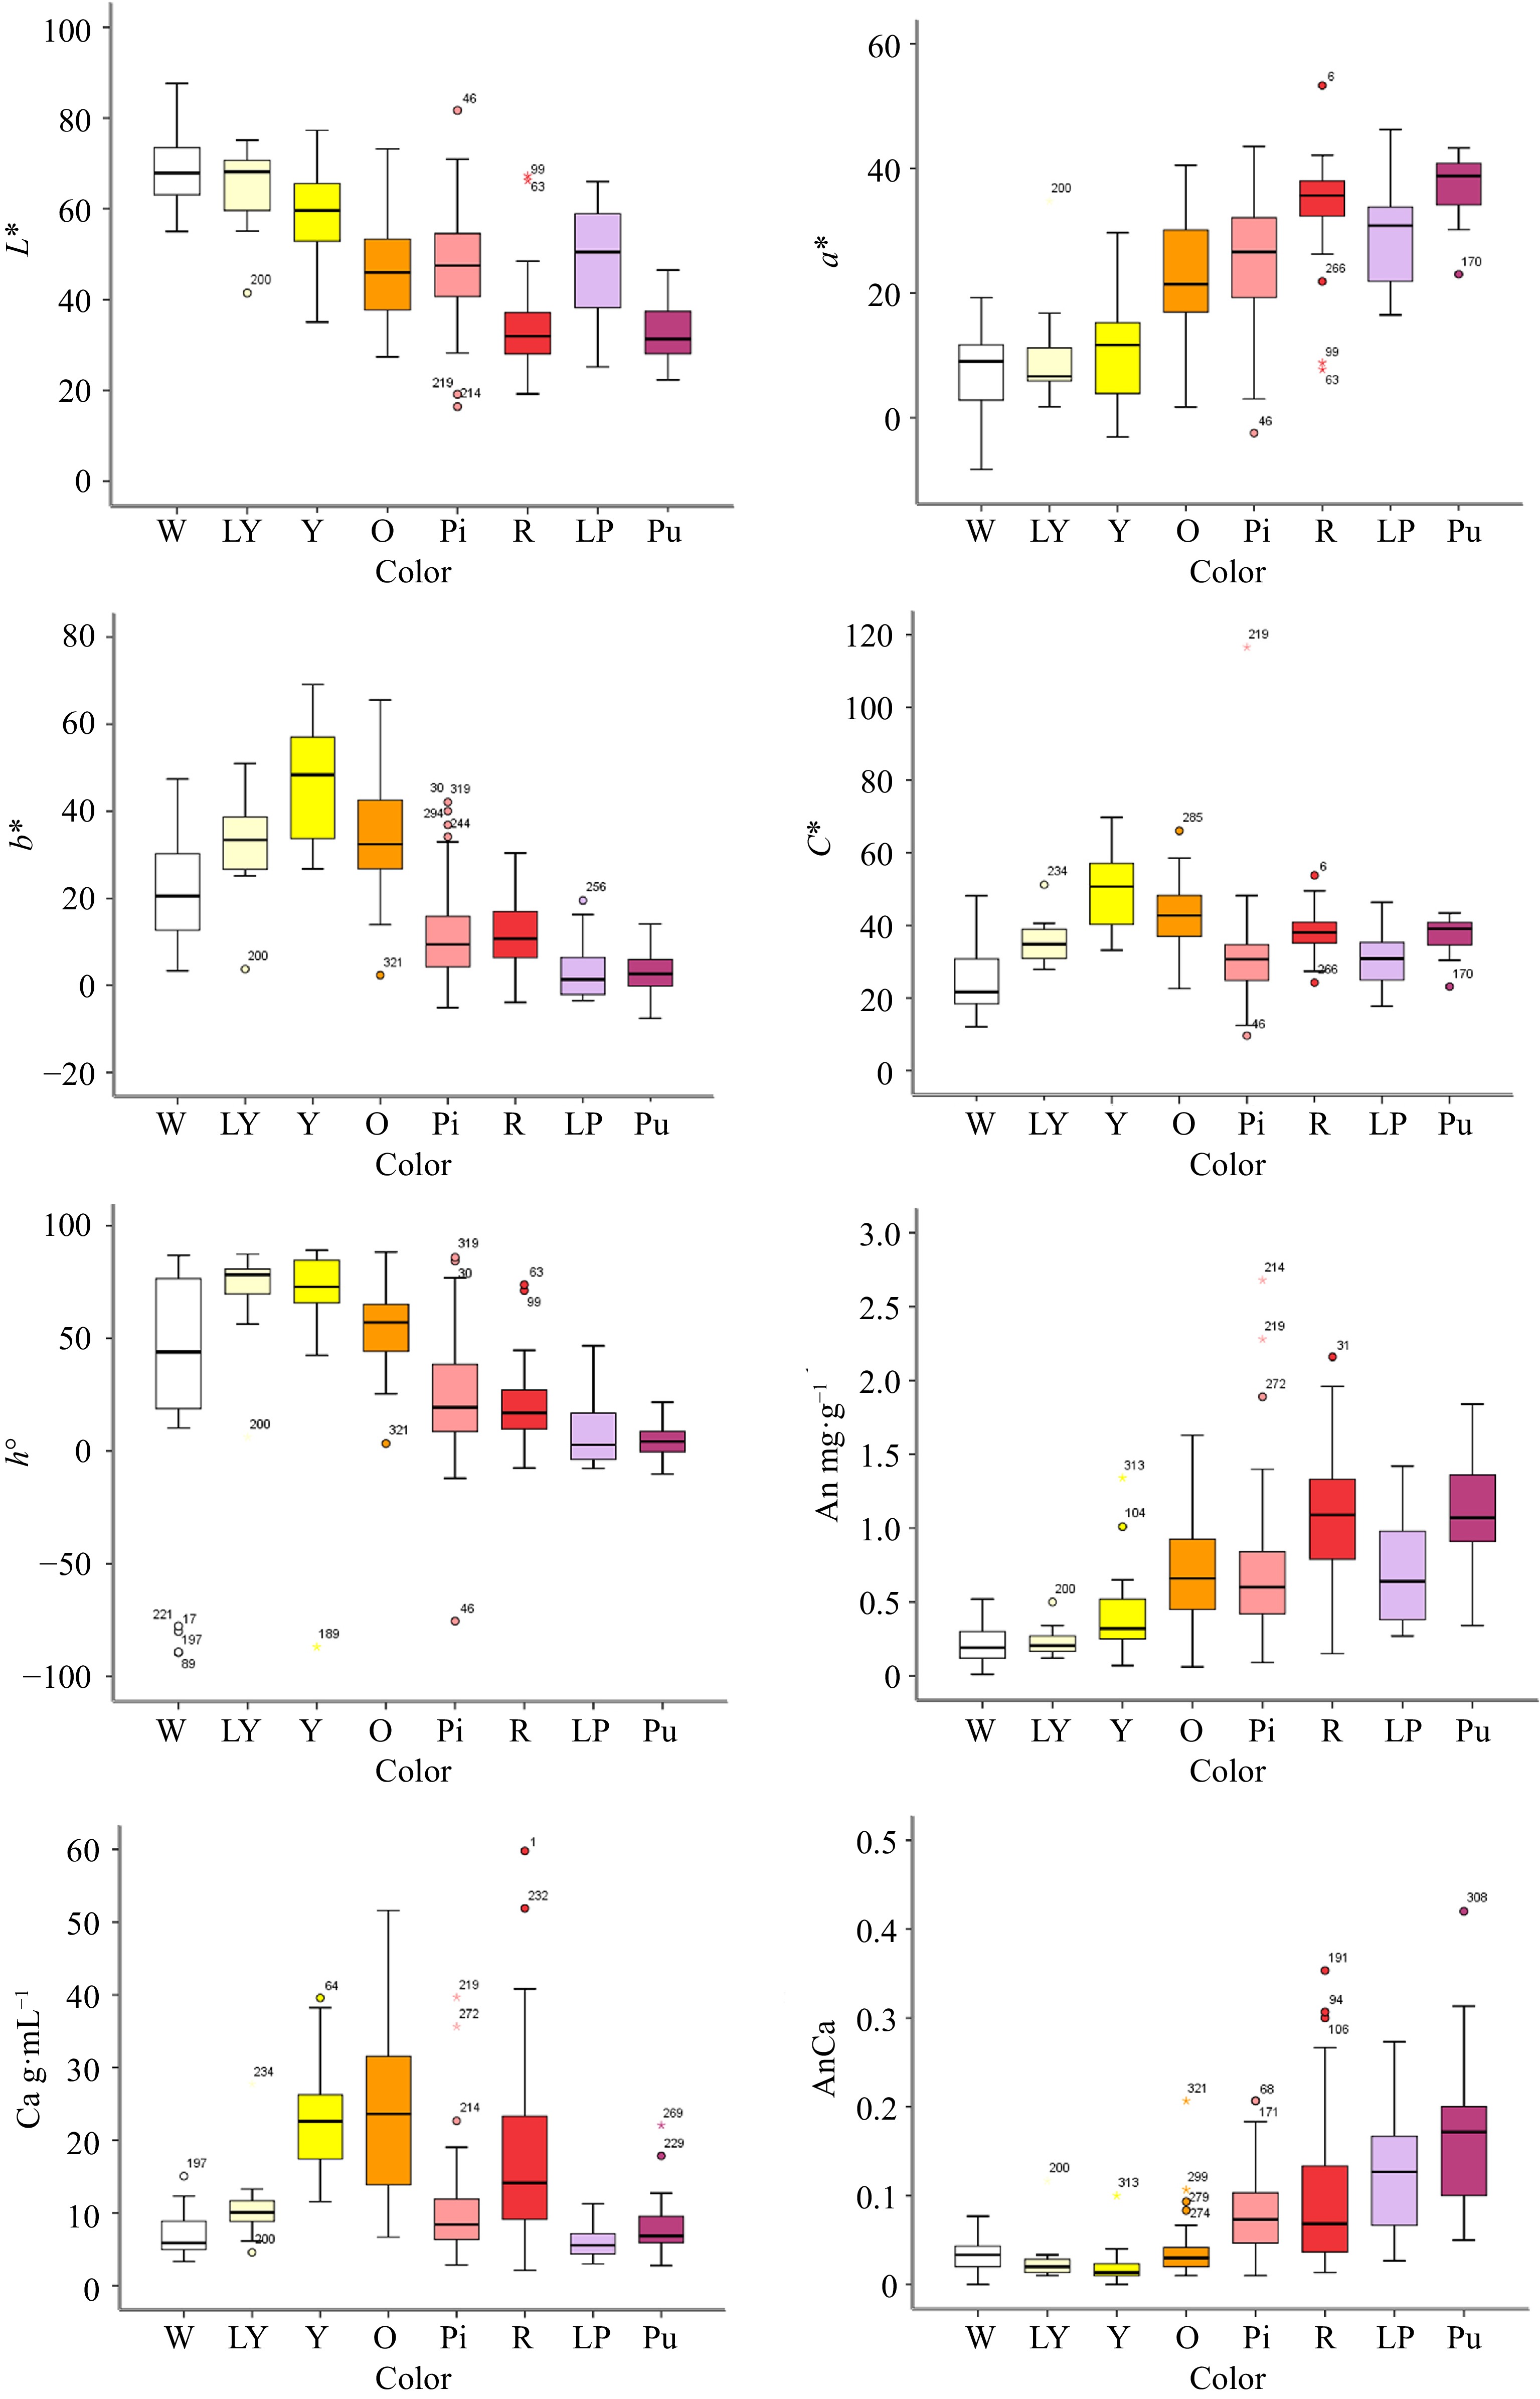
Figure 2.
The box plot of different color group of F1 hybrids according to flower color L*, a*, b*, C*, h° and flower pigment content. Note: Error bars refer to the standard error of the mean. X-axis label abbreviations: W, White; LY, Light Yellow; Y, Yellow; O, Orange; Pi, Pink; R, Red; LP, Light Purple; Pu, Purple. Y-axis label abbreviations: An, Anthocyanin content; Ca, Carotenoid content; AnCa, Anthocyanin content/Carotenoid content.
In this hybrid population, regarding the anthocyanin content, red and purple were associated with the highest anthocyanin content, followed by orange, light purple and pink, while the total anthocyanin contents for the yellow, light yellow and white lines were relatively low. The orange and yellow lines exhibited the highest contents of total carotenoids, followed by the red lines, while the values for the other lines were distributed at lower positions. For the total anthocyanin/carotenoid content, the purple, light purple, red and pink lines were higher than the white, light yellow, yellow and orange lines (Fig. 2). Details on each sample and the corresponding phenotypic data are provided in Supplemental Table S2.
In summary, red and purple flowers contained more total anthocyanins, yellow and orange flowers contained more total carotenoids, and the contents of total anthocyanins and total carotenoids in the white group were low.
The relationship between flower color parameters and pigment contents in different flower colors
-
The correlations of the flower color parameters L*, a*, and b* and pigment content are shown in the Supplemental Table S3. The total anthocyanin content was negatively correlated with L* and b*. The total anthocyanin content increased, leading to a reduced ray floret color brightness, enhanced blue color and decreased yellow color. However, there was a significant positive correlation between a* and the total anthocyanin content; that is, an increase in the total anthocyanin content leads to increases in a* and red coloration and a lessening of green coloration.
There was a negative correlation between the total carotenoid content and L*. The increase in total carotenoids led to a decrease in the color brightness of the ray florets. A significant positive correlation was found between the total carotenoids and b*; that is, an increase in the total carotenoid content could increase the yellow coloration and decrease the blue coloration. There was no correlation between the total carotenoid content and a* values.
The content of total anthocyanins/total carotenoids was negatively correlated with L* and b*; that is, the increase in total anthocyanin content decreases the brightness of ray florets, enhancing the blue color and decreasing the yellow color. However, there was a significant positive correlation with a*; that is, an increase in the total anthocyanin content would increase the hue value, enhancing red coloration and lessening green coloration. The results showed that total anthocyanins and total carotenoids were the key factors affecting the flower color.
Analysis of the heterosis of pigment content in F1
-
As shown in Supplemental Table S4, the ratios of the mid-parent heterosis of the total anthocyanin, carotenoid and anthocyanin/carotenoid contents were −35.96%, −57.16% and −27.50% respectively, which indicates that the three pigments have dominant genetic effects in heterosis. In addition, the total anthocyanin and carotenoid contents in the F1 population both exceeded (positively and negatively) those in the parents, indicating that the two kinds of pigment content in the hybrid offspring presented a transgressive separation phenomenon. According to the observed skewness, kurtosis (Supplemental Table S4) and the frequency distribution histogram (Fig. 3), the anthocyanin, carotenoid and anthocyanin/carotenoid contents differed among the parents. The continuous frequency distribution of pigment content of chrysanthemum ray florets was a quantitative trait controlled by multiple genes.
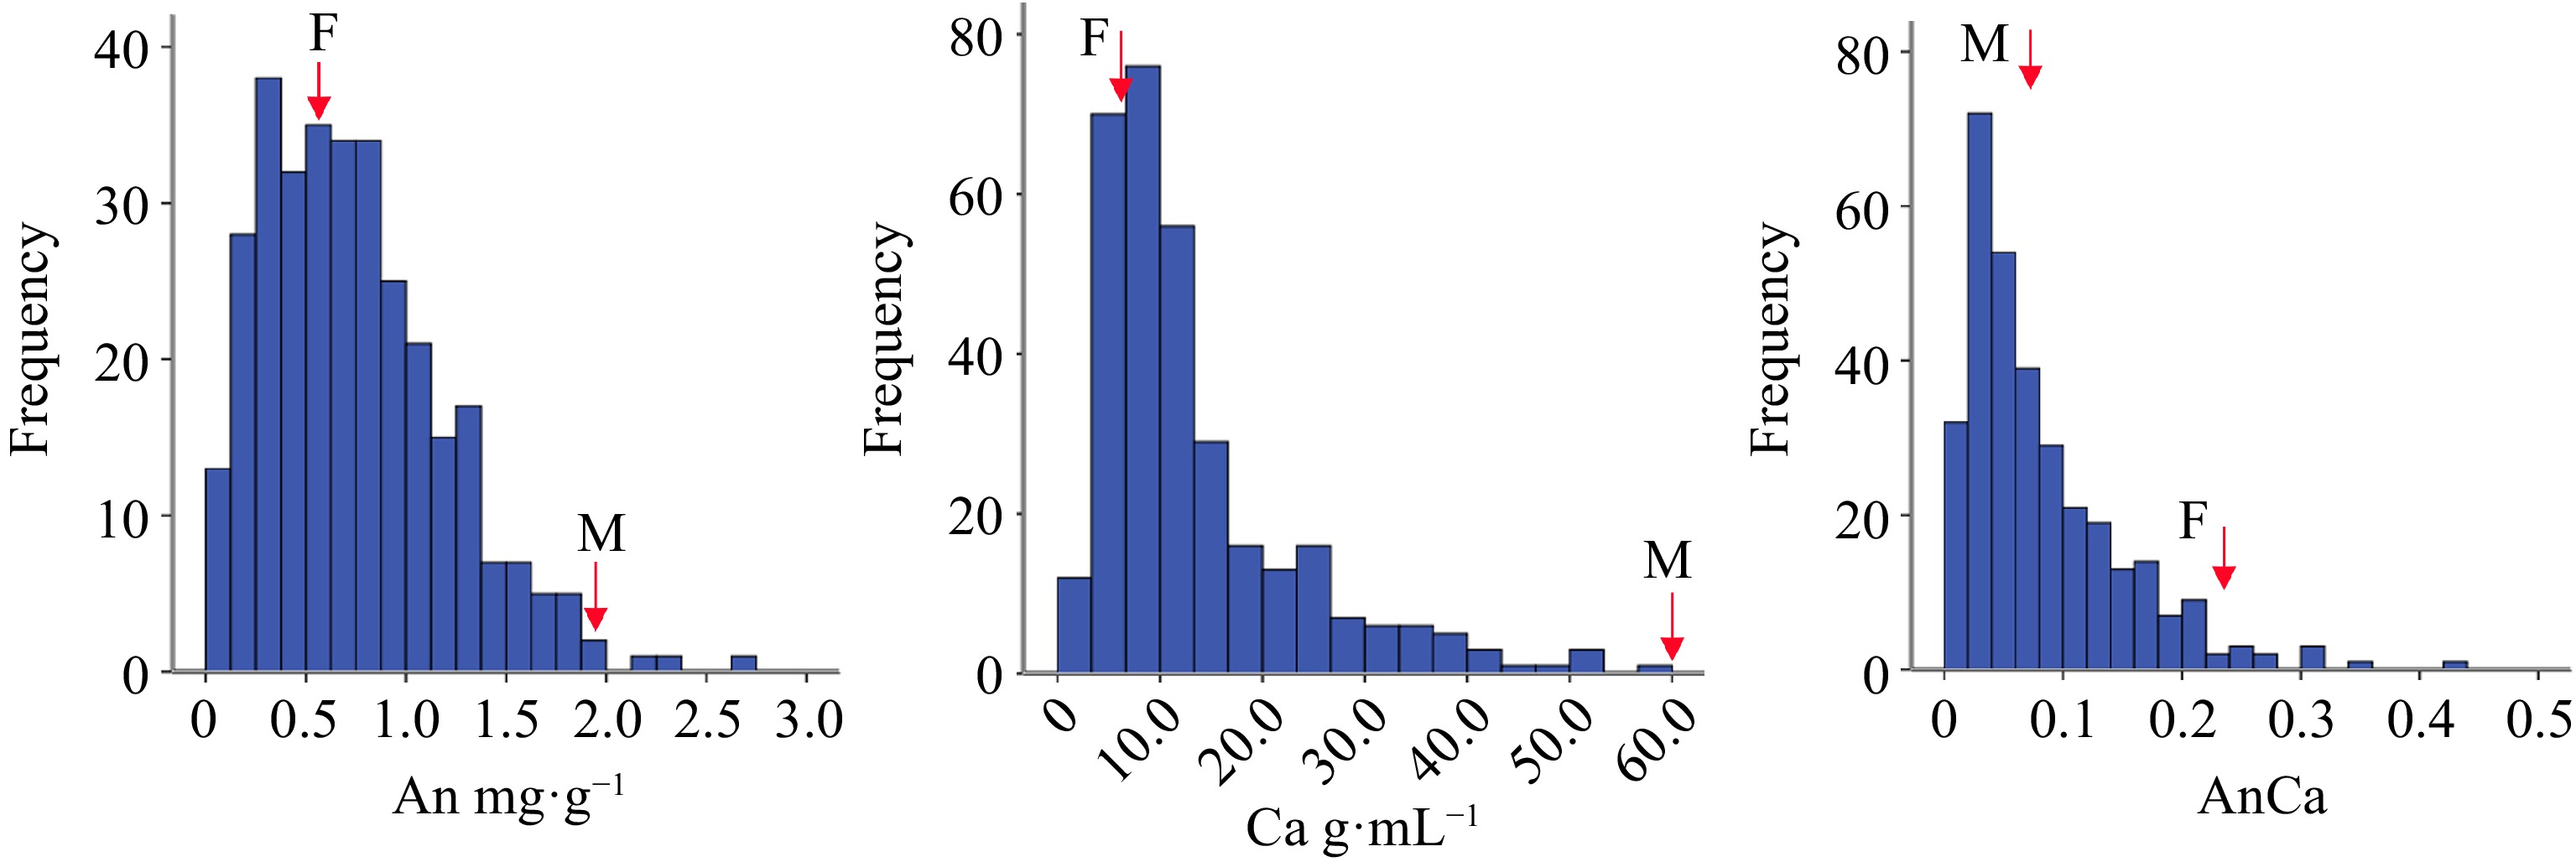
Figure 3.
The box plot of different color group of F1 hybrids according to flower pigment. Note: Anthocyanin content (An); Carotenoid content (Ca); Anthocyanin content/Carotenoid content (AnCa).
Major gene and multigene genetic model of pigment contents
-
According to the F2 single-generation separation and the major gene and multigene hybrid genetic model of plant quantitative traits, the total anthocyanin content and total carotenoid content of the F1 population were analyzed with the mixed genetic model. First, 11 models of A and B were calculated, and the AIC values were obtained (Table 1). According to the minimum AIC criterion, the genetic model with the minimum AIC value was selected as the alternative model.
Table 1. AIC values under different genetic models.
Model An (mg·g−1) Ca (g·ml−1) An/Ca A-0 407.87 2359.44 −725.42 A-1 388.34 2233.06 −813.00 A-2 409.88 2361.45 −723.41 A-3 411.87 2363.44 −721.42 A-4 411.87 2363.44 −721.42 B-1 391.41 2184.52 −891.78 B-2 381.88 2182.94 −945.85 B-3 411.89 2363.44 −721.41 B-4 409.87 2361.45 −723.40 B-5 411.87 2363.44 −721.42 B-6 409.87 2361.44 −723.42 The suitability test was carried out for the alternative model, and the model under which the fewest statistics reached the significance level (p < 0.05) was found to be the optimal model (Supplemental Tables S5 & S6). The results showed that the model with the smallest AIC values for the total anthocyanin content, total carotenoid content and total anthocyanin content/total carotenoid content was B-2 in all cases, which was controlled by two major genes, and the major gene model was additive-dominant (Supplemental Table S6).
The inheritance of the total anthocyanin content was controlled by two pairs of additive-dominant major genes. The additive effect of da and db was 0.34 and 0.32, respectively and da > db. The ha and hb (dominance effect) were −0.47 and −0.21, respectively, and the ha/da and hb/db ratios were −1.38 and −0.66, respectively, indicating that the first pair of genes was negatively hyperdominant, while the second pair of major genes was negatively partially dominant. The heritability of the major genes was 70.44% (Supplemental Table S6).
The inheritance of total carotenoid content was controlled by two pairs of major additive-dominant genes, whose da and db were 10.08 and 6.89, respectively and da > db. The ha, hb, ha/da and hb/db were −14.18, −3.53, −1.41 and −0.51, respectively, indicating that the first pair of genes was negatively hyperdominant, while the second pair of genes was negatively partially dominant, and the heritability of the major gene was 86.03% (Supplemental Table S6).
The inheritance of total anthocyanin contents/total carotenoid contents was controlled by twopairs of major additive-dominant genes, whose da and db were 0.08 and 0.07, respectively, and da > db. The ha, hb, ha/da and hb/db were −0.11, −0.04, −1.38 and −0.57, respectively, indicating that the first pair of genes was negatively hyperdominant, while the second pair of major genes was negatively partially dominant, and the heritability of the main genes was 90.91% (Supplemental Table S6).
QTLs of small-flowered chrysanthemum flower color
QTLs related to flower color traits based on mapping
-
According to the results of the statistical analysis of the flower color parameters and variations in pigment content presented above, all phenotypic traits could be used for QTL analysis (Table 2, Supplemental Table S7).
Table 2. QTLs test for traits of flower color and pigment content.
Traits The
number
of QTLsLinkage group The number
of QTL
associated
markersLOD threshold Exp% L* 2 LG18 63 18.88−30.51 33.60−37.10 a* 2 LG18 63 19.66−27.99 31.50−39.00 b* 5 LG17, LG18 100 9.91−19.37 16.4−32.30 C* 2 LG6 5 11.43−11.46 22.40 h° 5 LG17, LG18 113 7.82−14.01 13.4−25.40 An 3 LG17, LG18 97 8.67−14.12 17.60−19.3 Ca 2 LG17 36 18.66−18.92 24.80−26.20 An/Ca 4 LG17, LG18 40 9.35−11.00 13.20−18.30 For L*, 2 QTLs were located in the LG18. Sixty three closely linked markers were detected, the LOD values ranging from 18.88 to 30.51, and the range of variation for the phenotype was 33.60%−37.10%. 2 QTLs control the a*, which were located in the in the LG18, and there were 63 closely linked markers. The LOD value ranging from 19.66 to 27.99, and the range of the variation in the explainable phenotype was 31.50%−39.00%. For b*, three QTLs were mapped in the LG17 and two QTLs in the LG18. There were 100 closely linked markers, with LOD values ranging from 9.91 to 19.37, and the range of the variation in the explainable phenotype was 16.40%−32.30%. For C*, two QTLs were located in the LG6. There were five closely linked markers, for which the LOD value ranging from 11.43 to 11.46, which can explain the range of variation for the phenotype of 22.40%. For the h°, three QTLs were located in the LG17 and two QTLs in the LG18. There were 113 closely linked markers, with LOD values ranging from 7.82 to 14.01, and the explained phenotypic variation was 13.4%−25.40%.
There were three QTLs that controlled the total anthocyanin content. Ninety seven closely linked markers were detected, the corresponding LOD values ranging from 8.67 to 4.12, and the range of variation for the explainable phenotype was 17.66%−19.30%. For the total carotenoid content, two QTLs were mapped in LG17. There were 36 closely linked markers, with LOD values ranging from 18.92 to 18.66, and the range of the variation in the phenotype was 24.80%−26.20%. Four QTLs were mapped that controlled the total anthocyanin content/total carotenoid content. There were 40 closely linked markers, for which LOD values ranging from 9.35 to 11.00, and the range of the explained variation in the phenotype was 13.20%−18.30%.
Major QTLs related to pigment content based on mapping
-
QTLs that can explain more than 10% of phenotypic variation are major QTLs. The major QTLs that control the pigment contents of the chrysanthemum were analyzed. All the QTLs related to pigment content were major QTLs. Three major QTLs were found to control the total anthocyanin content, located in the region of 40.65−55.37 cM of the LG17 chain group and the regions of 0-24.01 cM and 25.99−38.86 cM of the LG18 chain group. Two major QTLs were found to control the total carotenoid content, located in the regions of 90.28-99.23 cM and 132.59-134.24 cM in the LG17 chain group. Four major QTLs controlling the total anthocyanin/total carotenoid content were found, located in the regions of 90.28−99.23 cM and 132.59−134.24 cM in the LG17 linkage group and 18.54-18.54 cM and 19.20−20.04 cM in the LG18 linkage group, respectively (Fig. 4).
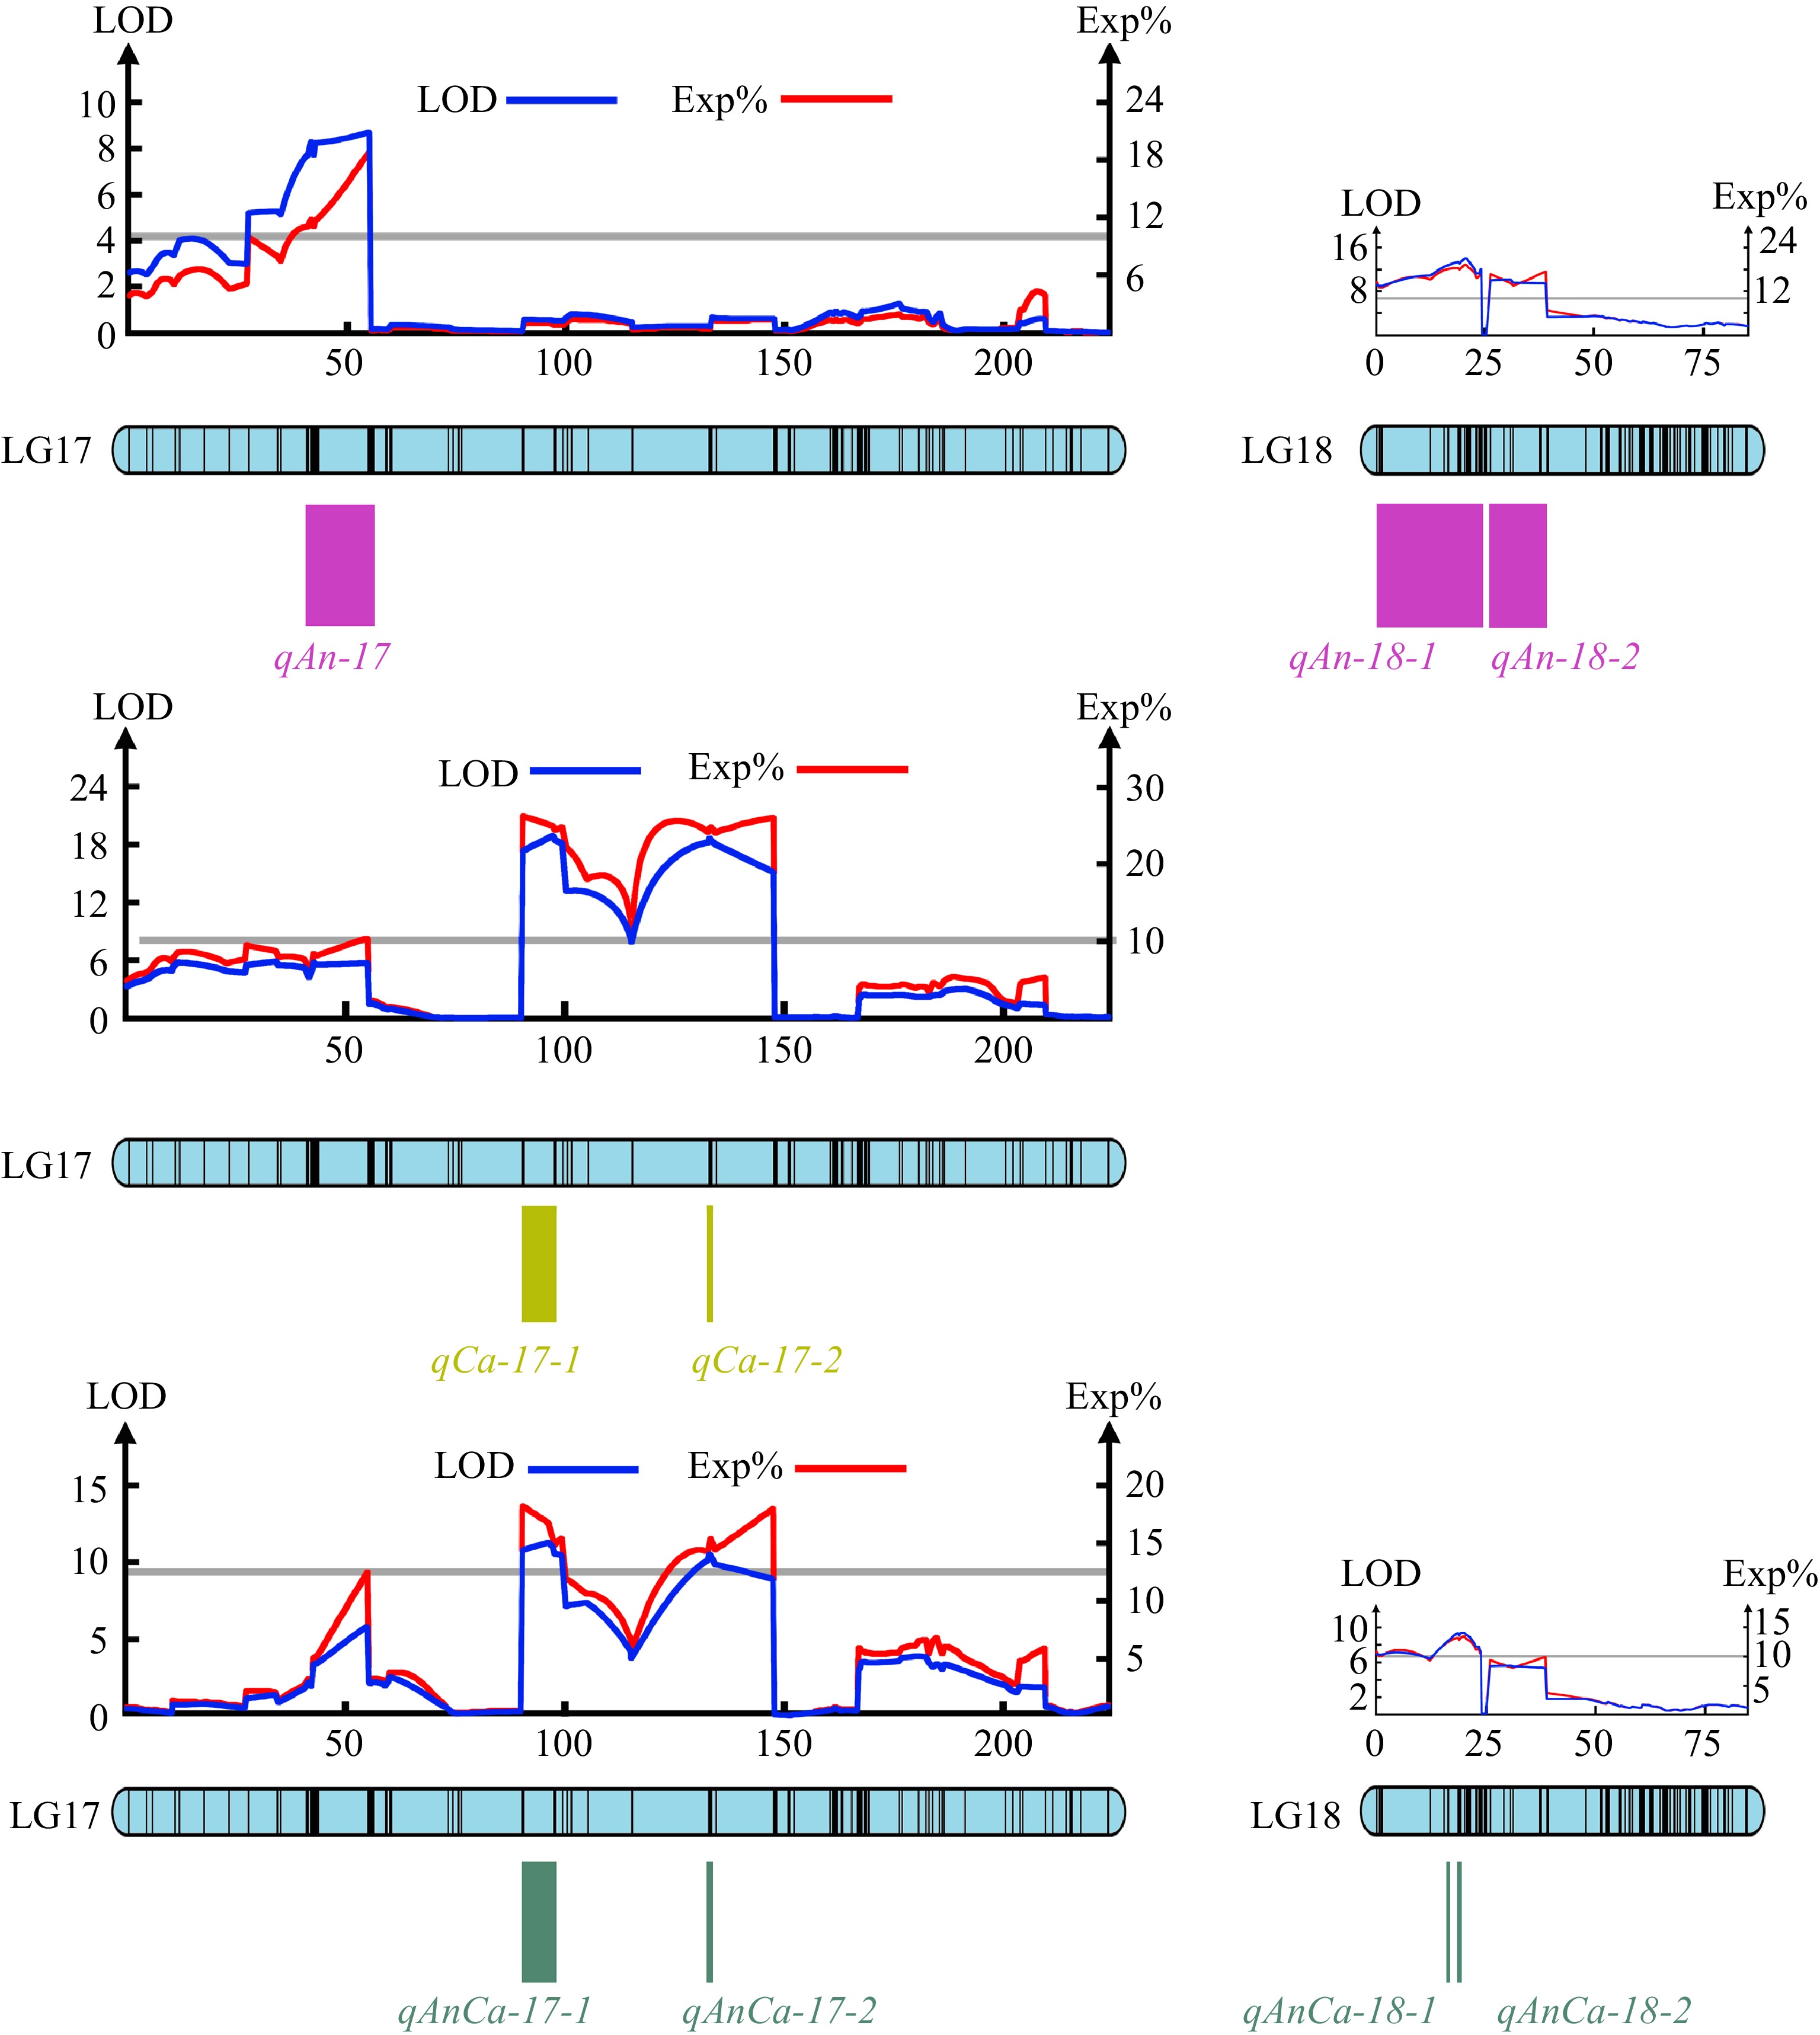
Figure 4.
The major QTLs tested for the total anthocyanins content, carotenoids content and anthocyanins/carotenoids content.
Candidate gene prediction and collinearity analysis
-
To screen possible candidate genes based on the detected QTLs, we aligned our genetic map with the Chrysanthemum reference genome of C. nankingense[51]. Within the QTL intervals of three traits related to pigments content, 14 candidate genes associated with anthocyanin content, four genes were in the QTL responsible for carotenoid content and 12 genes associated with the ratio of the two pigment contents were found. These genes were annotated through the NR database (Supplemental Table S8).
To further verify the effectiveness of these candidate genes, we performed a collinearity analysis of the above candidate genes in three reference genomes of Chrysanthemum that reached the chromosome level (C. lavandulifolium[24], C. seticuspe[52], C. makinoi[53]) and the first chromosome-scale genome of cultivated chrysanthemum[25]. The results showed that these genes have high homology in different Chrysanthemum species and almost all genes in three Chrysanthemum genomes have at least three homologous copies in C. morifolium. The genomic variation brought by species divergence did not affect the relative positions of these genes, suggesting that they may still maintain the same physical position in cultivated chrysanthemum, which can provide a reference for subsequent map-based cloning. In addition, multiple candidate genes affecting anthocyanin content (Supplemental Table S8) existed as gene clusters in the genomes of all four Chrysanthemum species, which may have conserved functions. (Fig. 5).
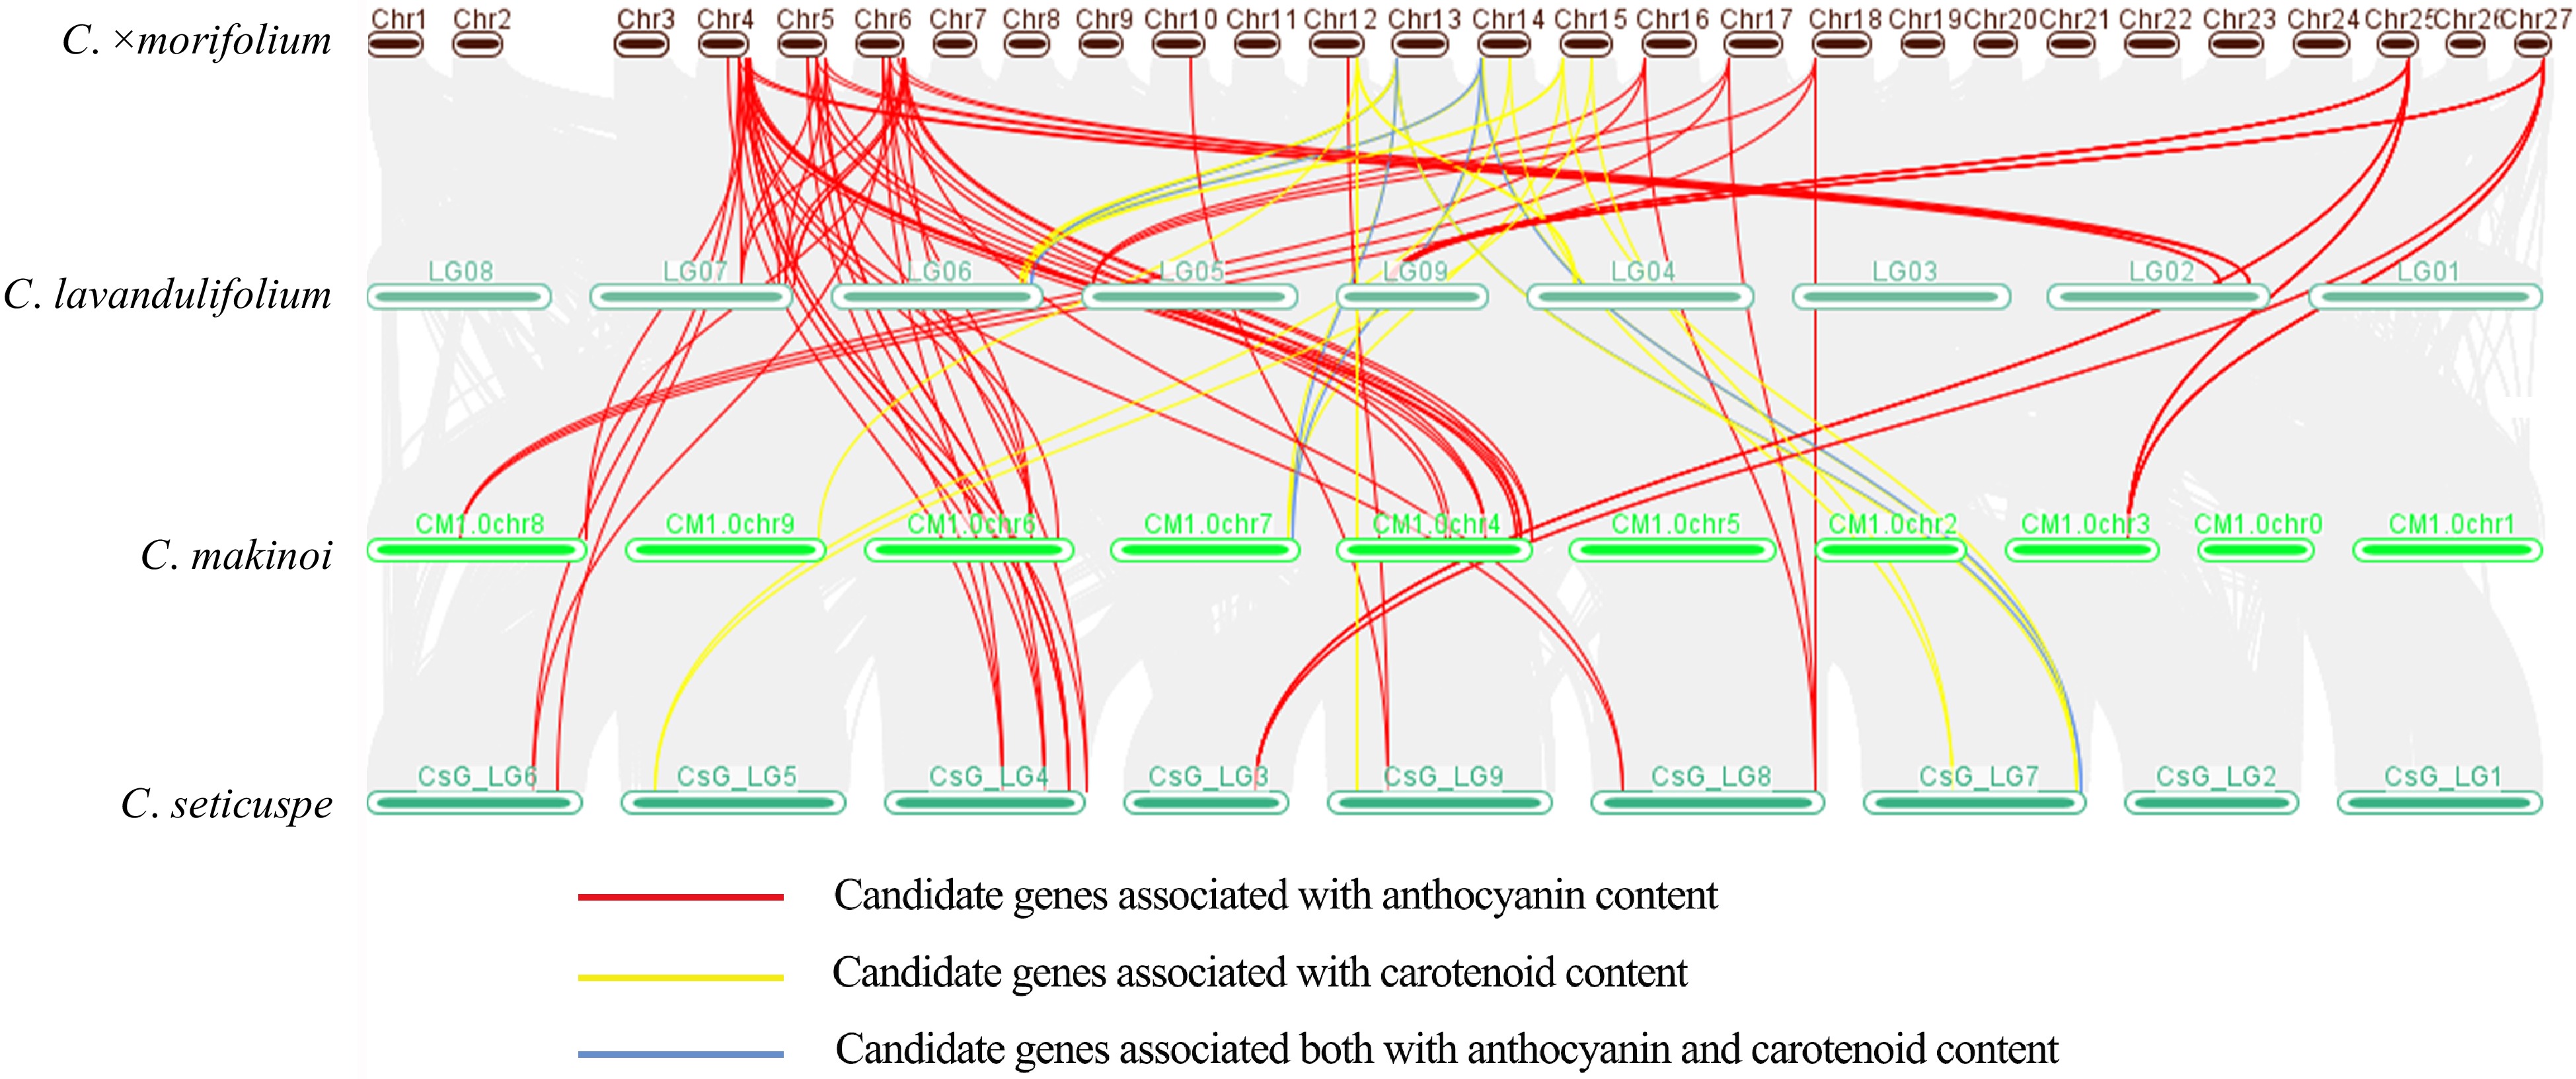
Figure 5.
Collinearity analysis of candidate genes related to pigment content in three genomes of diploid species of Chrysanthemum and the first genome of cultivated chrysanthemum.
-
In this study, a hybrid population with abundant color variation was obtained via the hybridization of pink and red chrysanthemums. By studying the flower color parameter values and pigment contents of different lines in the hybrid offspring, it was found that the coefficient of variation of the total anthocyanin and carotenoid contents was more than 60%, indicating that there was a relatively high selection potential for these two pigments.
Previous studies have shown that carotenoids, anthocyanins, and different combinations of the two lead to the abundant floret color of chrysanthemum cultivars (except green and blue)[54]. In this study, we found that all the ray florets in this hybrid population contained both anthocyanins and carotenoids. The yellow and orange groups contained mainly carotenoids, and the orange group showed a higher total carotenoid content than the yellow lines. The main type of pigment in red, light purple and purple chrysanthemum was anthocyanins, and white flowers exhibited very low total carotenoid and total anthocyanin contents.
It was also found that the pink and the red lines could be crossed and the pink line was responsible for the dominant contribution in the offspring. Yellow, orange, and white lines appeared among the hybrid offspring, indicating the complexity of the separation of chrysanthemum flower color in the hybrid offspring.
Correlation between phenotypic parameter values and pigment contents of different flower colors
-
By analyzing the correlation between the color space values and the pigment content of different hybrids, it can be seen that the total anthocyanins were negatively correlated with L* and b* and positively correlated with a*. Total carotenoids were positively correlated with b* and negatively correlated with L*, but not with a*. The results showed that the contents of total anthocyanins and total carotenoids were closely related to the phenotypic value of flower color and that they were the main pigment components that affected the flower colors.
Heterosis and genetic effects of total anthocyanin and carotenoid contents in the F1 generation
-
In this study, a hybrid population of small chrysanthemum was constructed from parents with different colors, and the contents of main pigments in the florets were analyzed for heterosis and genetic effects to explore the genetic law governing flower color. It was found that the contents of total anthocyanins and total carotenoids in chrysanthemum presented heritable heterosis, and the heterosis rate was negative, indicating that a dominant effect of the two types of pigments existed in heterosis. The results of the mixed genetic analysis indicated that the optimal genetic model of total anthocyanin content inheritance was B-2, which was controlled by two major genes, and the major gene model was the additive-dominant model. The optimal genetic model for total carotenoid contents was also B-2, which is controlled by two major genes. The major gene genetic model was the additive–dominant model. The heritability of the major genes with the total anthocyanin or carotenoid content was greater than 50% in both cases, indicating that flower color-related traits were relatively less influenced by the environment, and showed great improvement potential. A good selection effect could be achieved via individual selection in the early generation.
Analysis of the QTL of flower color characteristics of chrysanthemum
-
Chrysanthemum is an important flower in landscaping, but there is a lack of bright red and blue strains among its rich cultivars[38]. Therefore, research on flower color formation mechanisms and flower color improvement through breeding has always been of interest. The results of the analysis of pigments in florets showed that anthocyanins and carotenoids were the main color compounds in the examined chrysanthemum cultivars, and the differences in the relative contents of the two pigments in chrysanthemum were the reason for the abundance of different flower colors[6,55,56].
In this study, the pigment content was a quantitative trait controlled by a major gene and polygenes. Then through QTL analysis, three major QTLs controlling the total anthocyanin content and two major QTLs controlling the total carotenoid content were found, and these major sites were all located in the LG17 and LG18 linkage groups. At the same time, the total anthocyanin/total carotenoid content was controlled by the four major QTLs also located in LG17 and LG18. These preliminary targeted QTLs lay a foundation for further selection and gene cloning of floral color candidate genes in chrysanthemum.
In this work, we focused on the process from pigment production to flower coloration with the aim of finding some new genes that influenced the flower coloration. However, since we only quantitatively measured the total content of anthocyanins and carotenoids, rather than identifying the pigment type and then quantifying chemical structure of each specific pigment. Therefore, in subsequent work, it is necessary to identify compounds (pigment types) and then quantify each specific pigment so as to reveal the function of the candidate genes identified.
-
In this study, two cultivars with different colors were selected as parents for hybridization, and the flower color parameters and pigment content variation of the hybrid offspring were analyzed. The correlation and genetic analysis between the flower color and pigment content were performed. The total anthocyanins were negatively correlated with L* and b* and positively correlated with a*. There was a positive correlation between total carotenoids and b* and a negative correlation between total carotenoids and L*, but no correlation was found between total carotenoids and a*, indicating that total anthocyanins had a greater impact on flower color than total carotenoids.
Hybridization was found in total anthocyanins and total carotenoids of chrysanthemums and a dominant effect of hybridization was found. The most appropriate genetic model was B-2 for pigment content, and the major gene heritability values were 70.44%, 86.03% and 90.01%, indicating that the effect of the environment on flower color traits was relatively small and a good selection effect can be achieved by individual selection in the early generations.
Based on the high-density genetic map constructed in the early stage, the QTLs of flower color traits were analyzed by interval mapping. Through QTL analysis, three major QTLs controlling the total anthocyanin content and two major QTLs controlling the total carotenoid content were found, and these major sites were all located in the LG17 and LG18 linkage groups. The genetic rules governing the phenotypic parameters and pigment content of small-flowered chrysanthemum were preliminarily analyzed through the genetic analysis of flower color traits of small-flowered chrysanthemum in this work. The conclusion of this study lays a foundation for further selection and cloning of candidate genes for chrysanthemum flower color, and it provides a reference for improving the efficiency of chrysanthemum flower color breeding.
-
The authors confirm contribution to the paper as follows: research topic proposed: Dai S; experiment design: Song X and Tian Y; experiment and data analysis: Tian Y, Gao K and Li J; draft manuscript preparation: Song X; feedback on the analysis and manuscript: Li Y, Wang J, Deng C, Zhang F, Kong D and Fan G. All authors read and approved the final manuscript. Song X and Tian Y contributed equally to this work.
-
The data supporting the findings of this study are available within the supplementary materials.
This research was funded by the National Natural Science Foundation of China (32171849, 31530064), the National Natural Science Foundation Youth Fund Project (32101580) and the National key research and the development program (2018YFD1000405). We are particularly indebted to the Beijing Greenland Maintenance and Management Service Center for providing test sites. We thank Zhijun Fang, Yushan Ji and Shuo Wang for their guidance on plant material cultivation.
-
The authors declare that they have no conflict of interest.
-
# These authors contributed equally: Xuebin Song, Yuankai Tian
- Supplemental Table S1 Descriptive statistics of flower color phenotypic parameters and flower pigment content.
- Supplemental Table S2 The flower color L*, a*, b*, C*, h° and flower pigment content of 319 F1 hybrids.
- Supplemental Table S3 The Person correlation of flower color L*, a*, b* parameters and flower pigment.
- Supplemental Table S4 The heterosis of flower color phenotypic parameters and flower pigment.
- Supplemental Table S5 Test for fitness of genetic models on pigment content in F1.
- Supplemental Table S6 Estimates of genetic parameters of pigment content.
- Supplemental Table S7 The detailed result of QTLs test of all flower color traits.
- Supplemental Table S8 Annotation information of candidate gene based on Chrysanthemum nankingense genome.
- Supplemental materials Plant material cultivation and traits measurement.
- Copyright: © 2023 by the author(s). Published by Maximum Academic Press, Fayetteville, GA. This article is an open access article distributed under Creative Commons Attribution License (CC BY 4.0), visit https://creativecommons.org/licenses/by/4.0/.
-
About this article
Cite this article
Song X, Tian Y, Gao K, Li J, Li Y, et al. 2023. Genetic and QTL analysis of flower color and pigments in small-flowered chrysanthemum based on high-density genetic map. Ornamental Plant Research 3:17 doi: 10.48130/OPR-2023-0017 

Genetic and QTL analysis of flower color and pigments in small-flowered chrysanthemum based on high-density genetic map
- Received: 23 April 2023
- Accepted: 25 September 2023
- Published online: 24 October 2023
Abstract: Flower color is an important trait for ornamental plants and is determined by pigments. Variations in the flower color of chrysanthemum are abundant, which is an important feature related to its ornamental and commercial value. However, few reports have elucidated the inheritance of the flower color and pigmentation of chrysanthemum. In this study, an F1 hybrid population, including 319 hybrids of small-flowered chrysanthemum cultivars with different flower color, was constructed. The genetic variation rules for some color and pigment-related traits were discussed based on major gene and polygene mixed inheritance analyses. Both the total anthocyanin and carotenoid contents were controlled by two pairs of additive dominant major genes and the heritability of the major genes was 70.44% and 86.03%, respectively. Based on the high-density genetic map constructed for the hybrid population, QTL analysis for the above traits was carried out using the interval mapping method. A total of 25 related QTLs and 517 closely linked markers were detected, including three QTLs controlling the total anthocyanin content and two QTLs controlling the total carotenoid content, all of which were major QTLs. Furthermore, 17 unigenes related to pigments were identified via BLAST searches with Chrysanthemum nankingense genome. For such genes, the collinearity was observed in four chromosome level genomes, including three genomes of the genus Chrysanthemum and the first genome of cultivated chrysanthemum. The results lay a foundation for in-depth exploration of flower color and pigmentation in chrysanthemum and provide a reference for future research in other ornamental plants.
-
Key words:
- Flower color /
- QTL /
- Genetic analysis /
- Small-flowered chrysanthemum