-
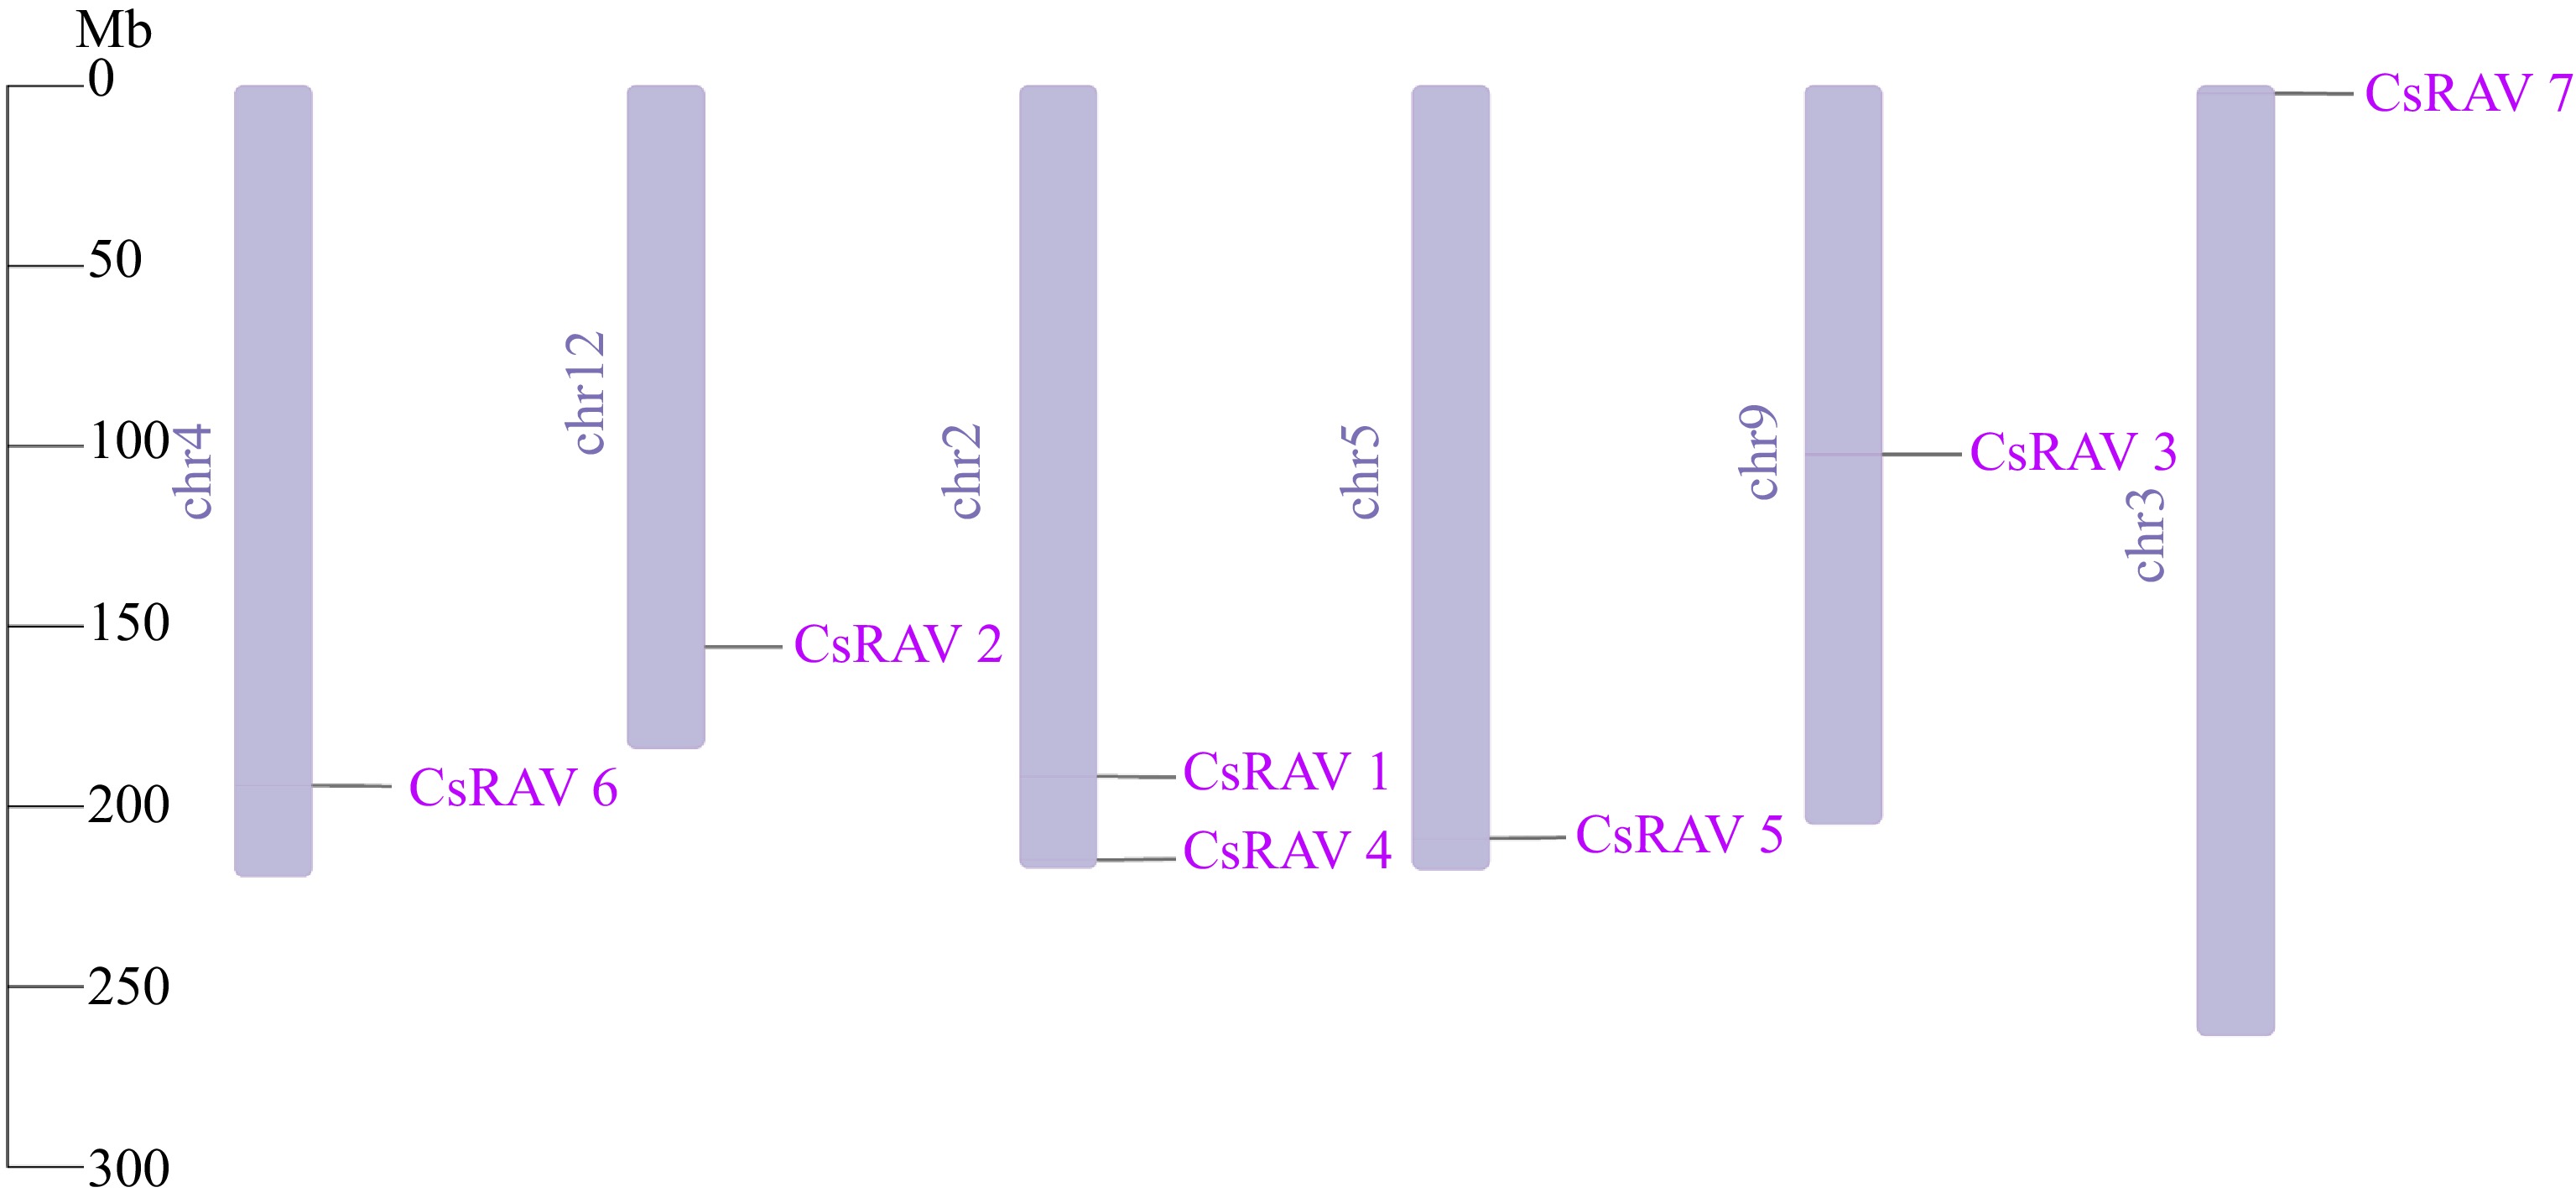
Figure 1.
The chromosomal locations of CsRAV genes.
-
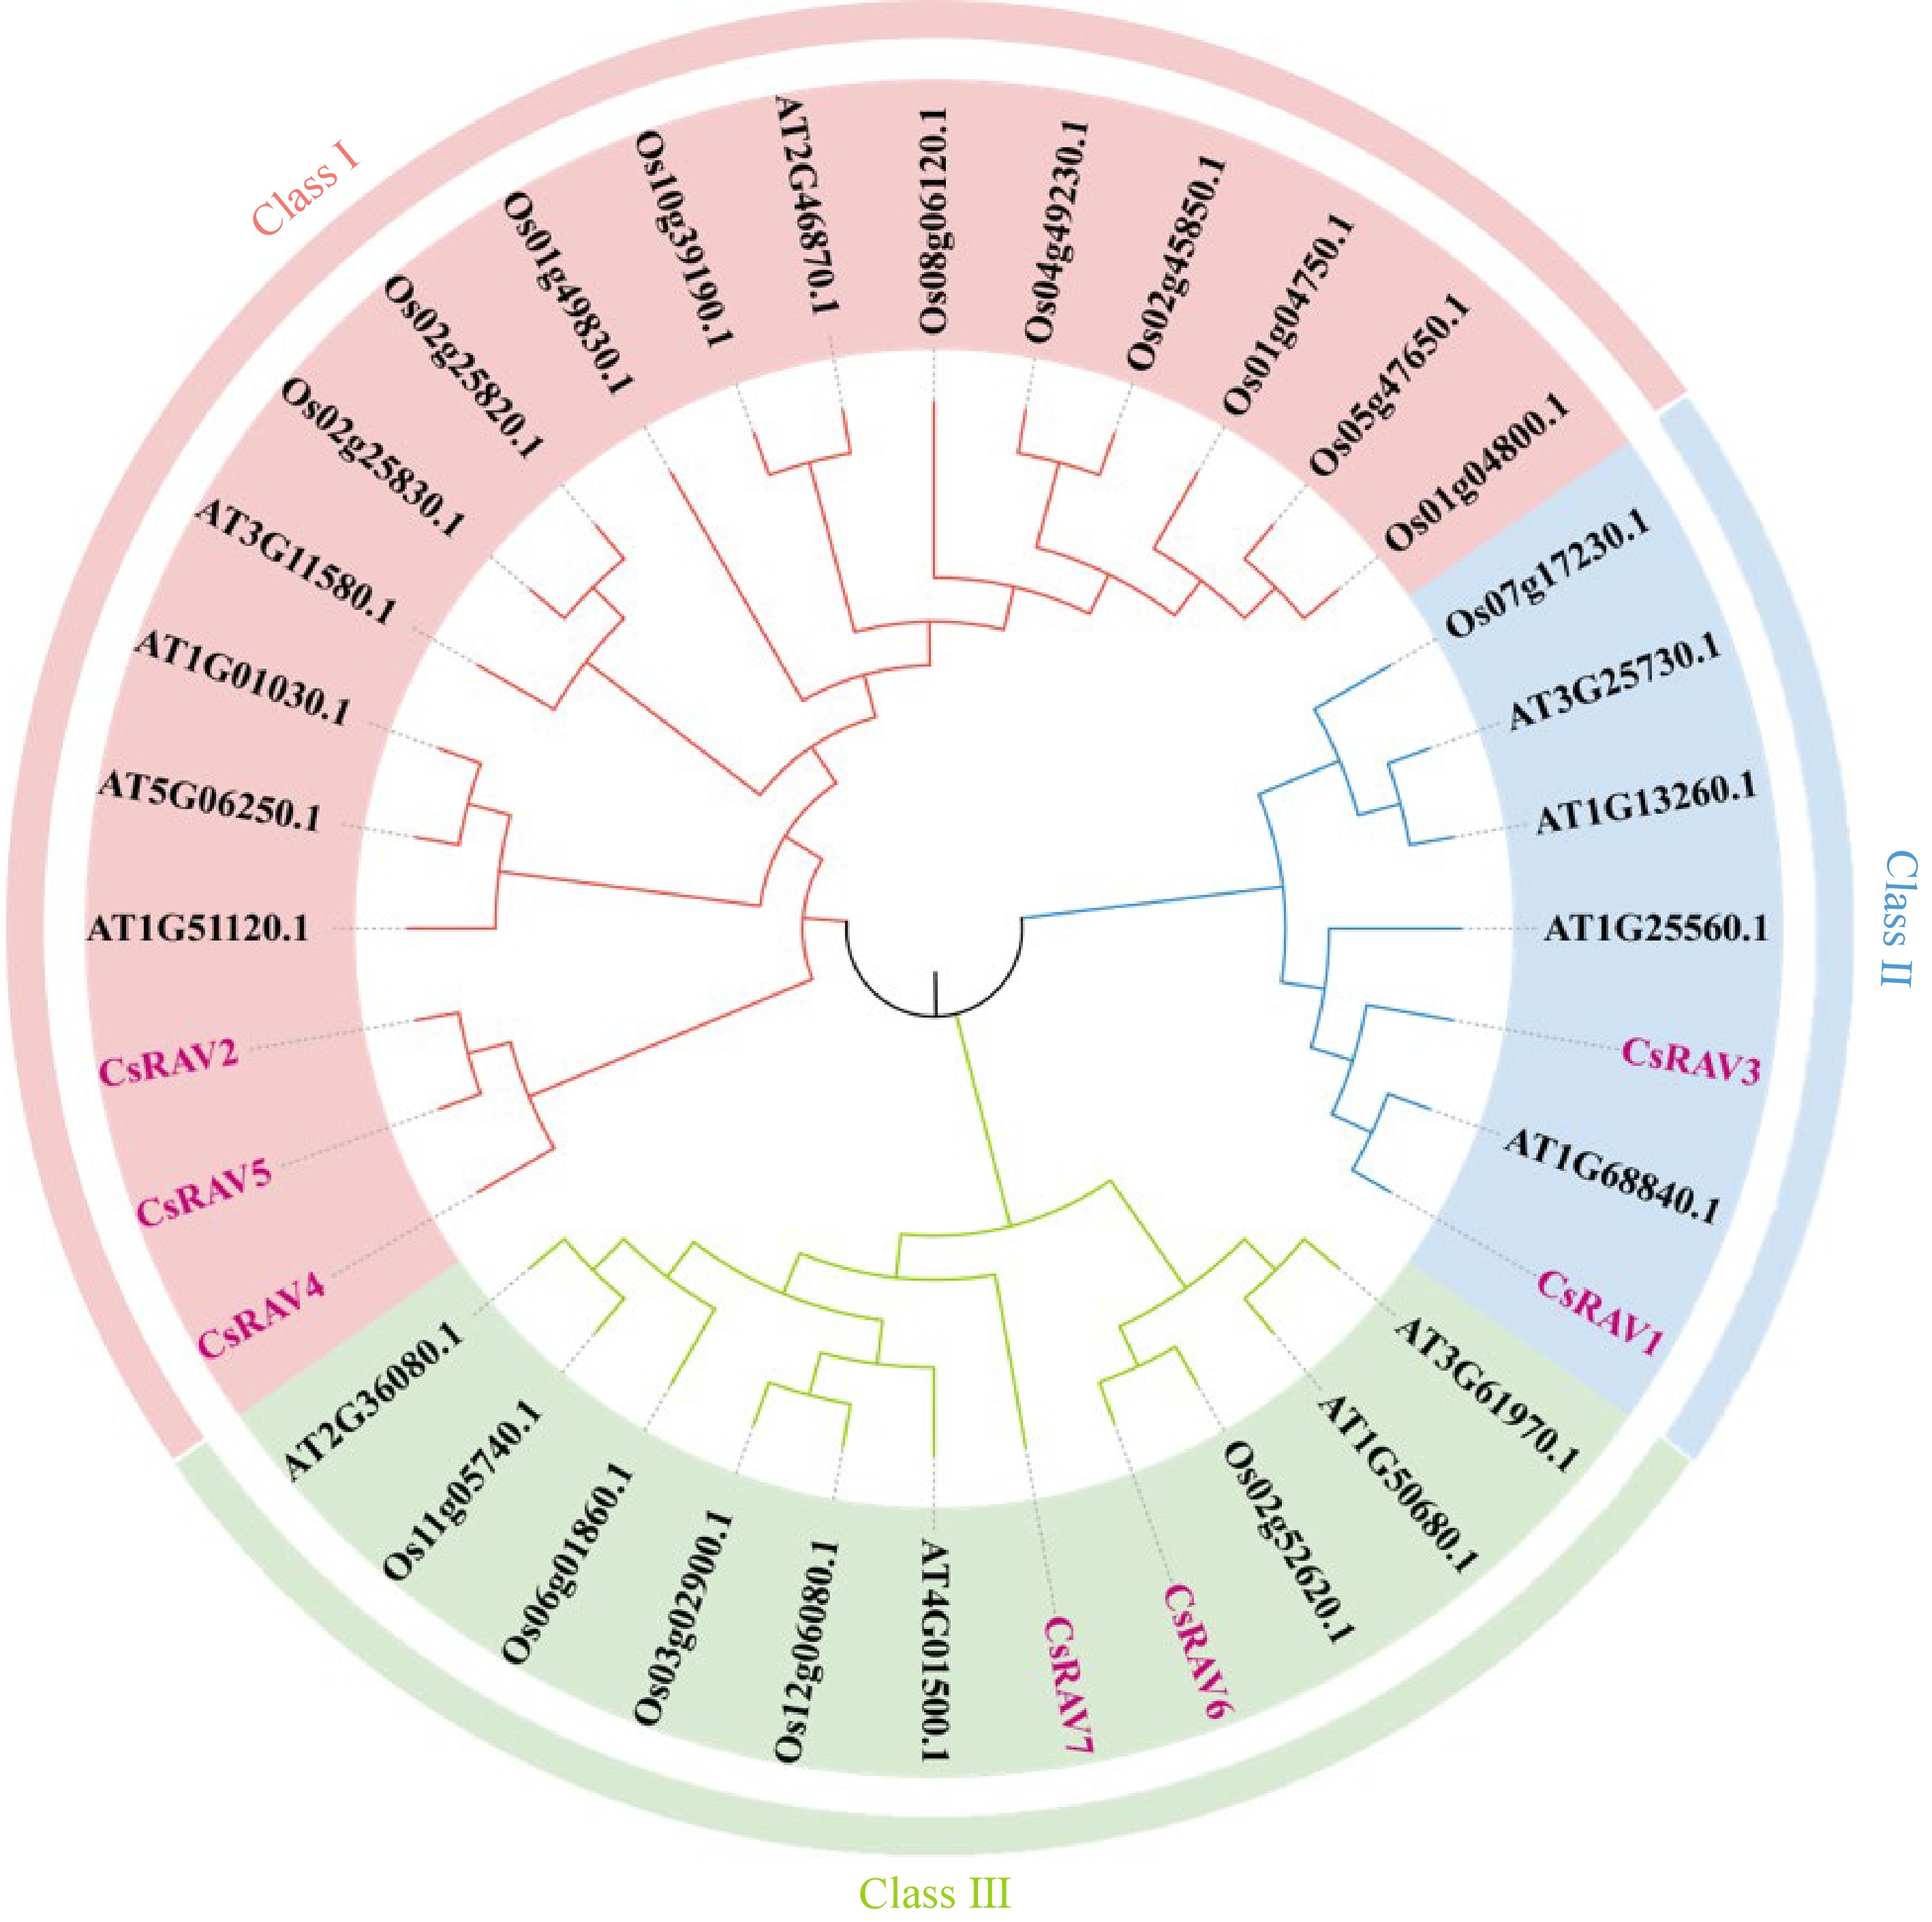
Figure 2.
Phylogenetic analysis of RAV genes from Camellia sinensis, Arabidopsis thaliana, and Oryza sativa.
-
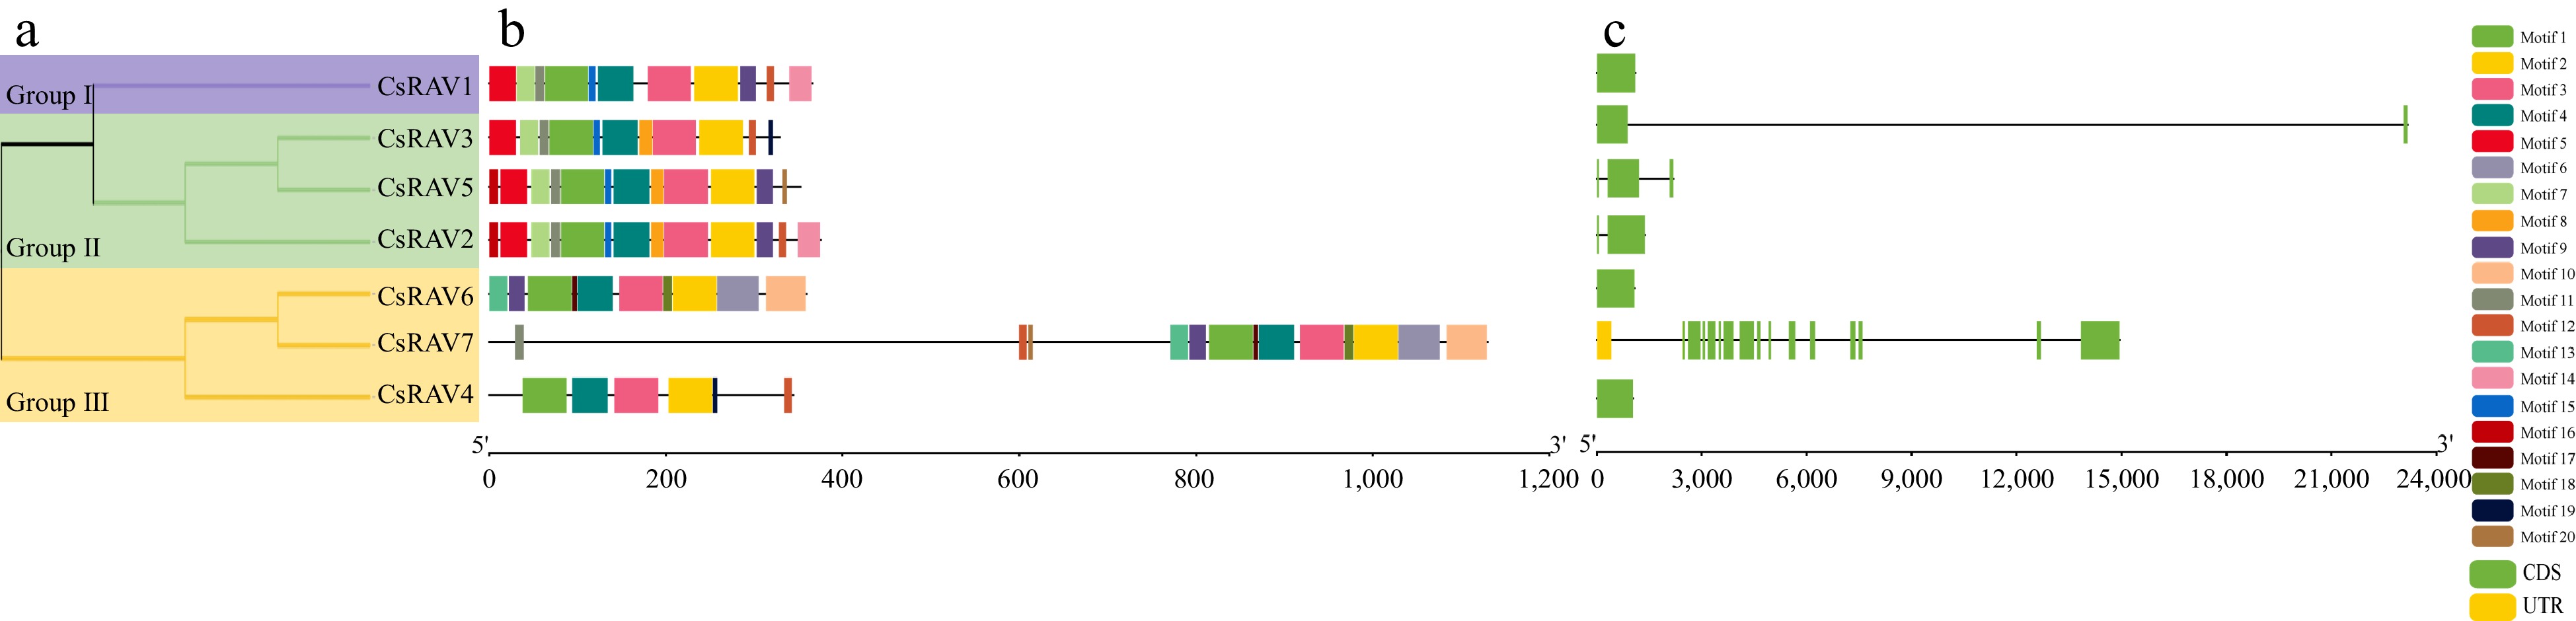
Figure 3.
CsRAV protein and gene sequence analysis. (a) Phylogenetic tree analysis, the purple line represents group I, the green line represents group II and the yellow line represents group III. (b) Motif analysis. (c) Gene structure analysis. Horizontal lines indicate introns.
-
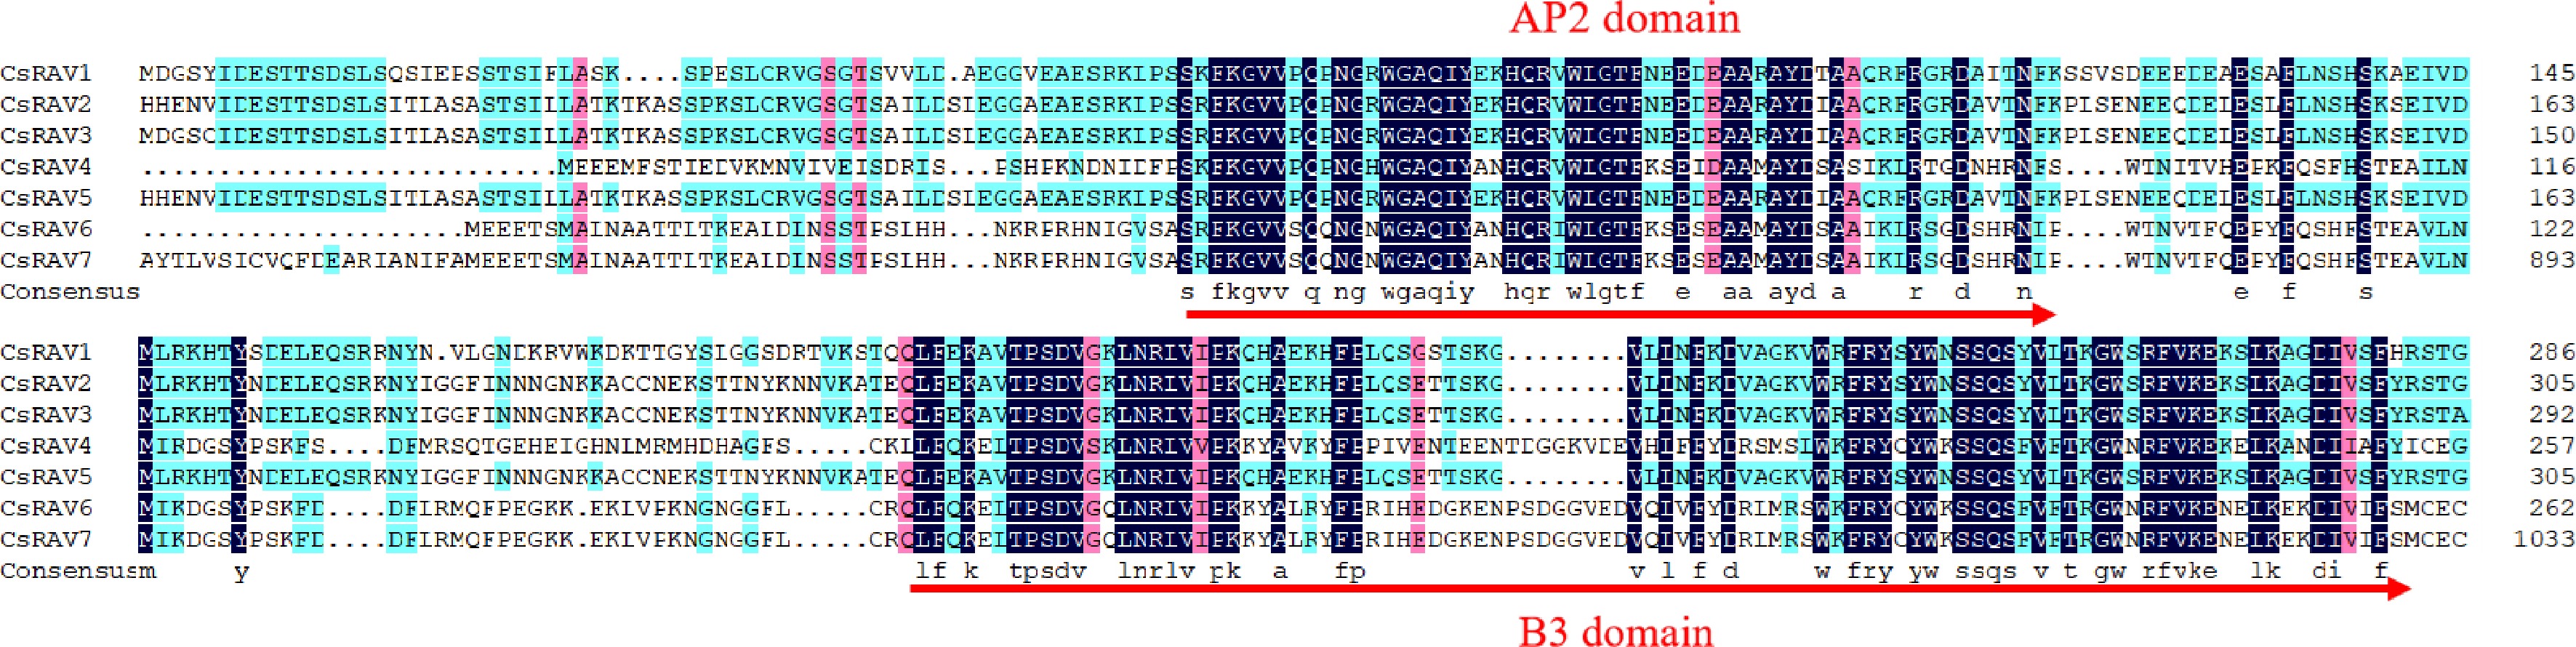
Figure 4.
Multiple alignments of CsRAV proteins in tea plants.
-
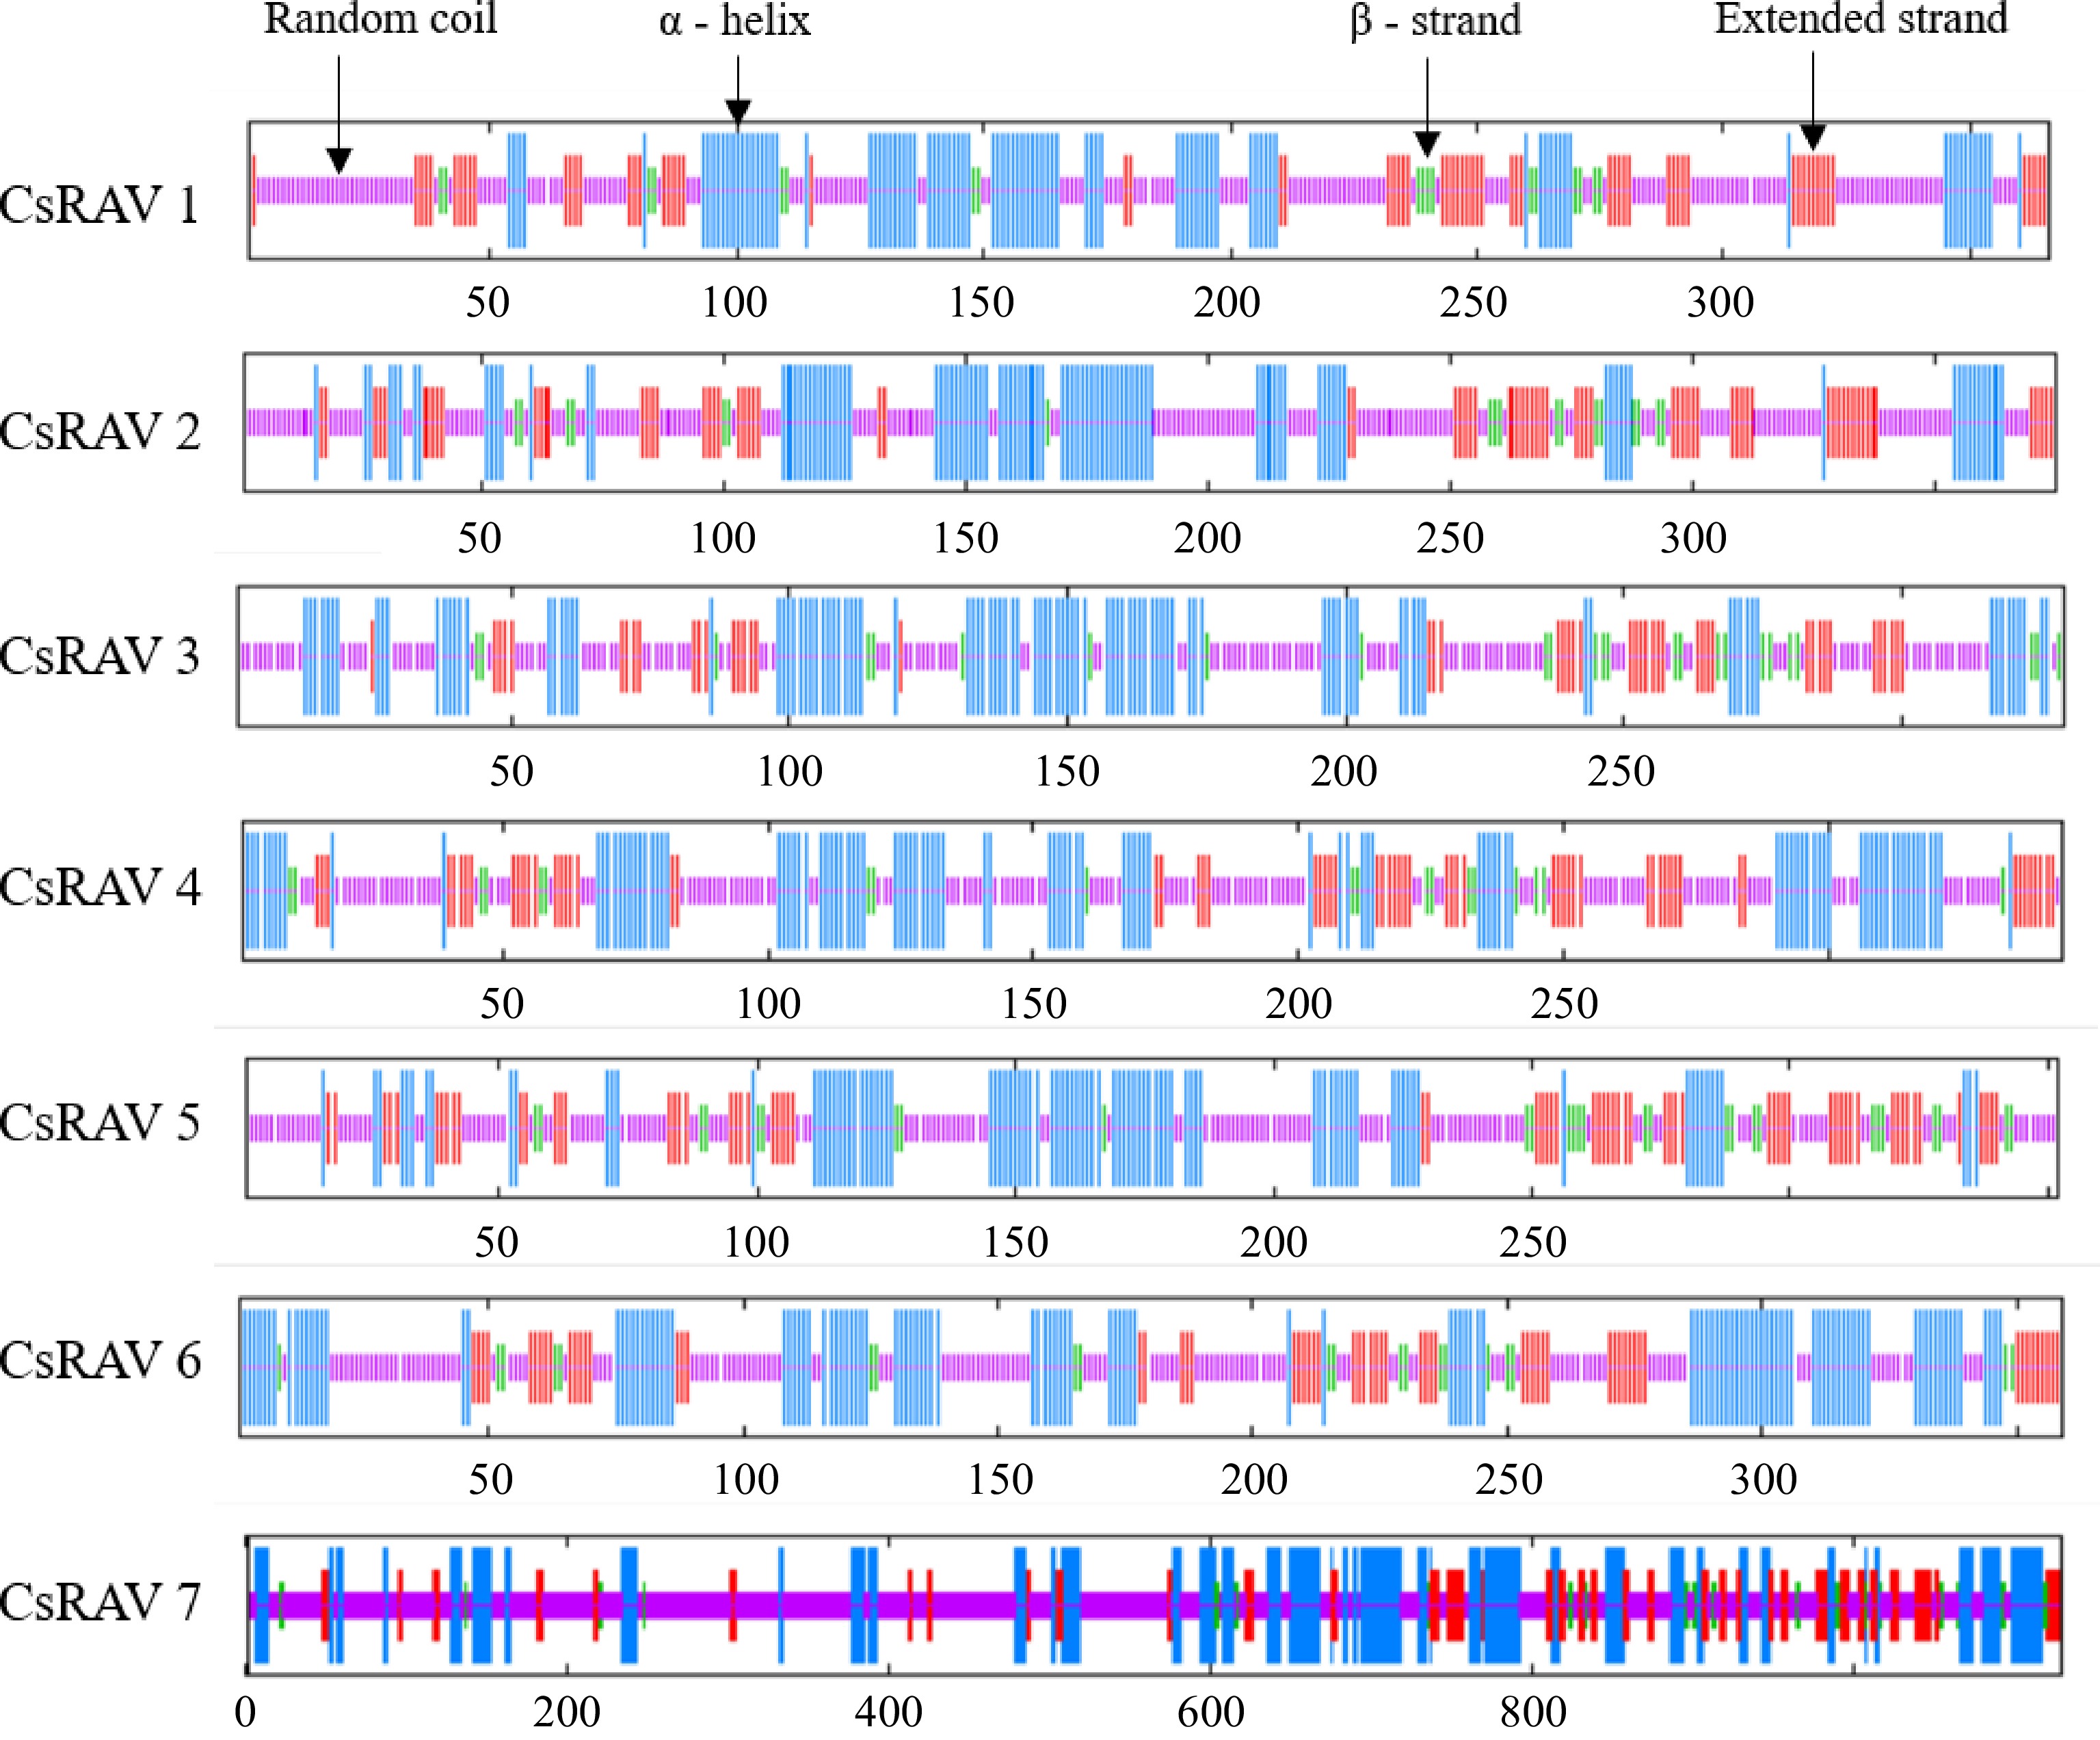
Figure 5.
Secondary structure prediction of the RAV family in tea.
-
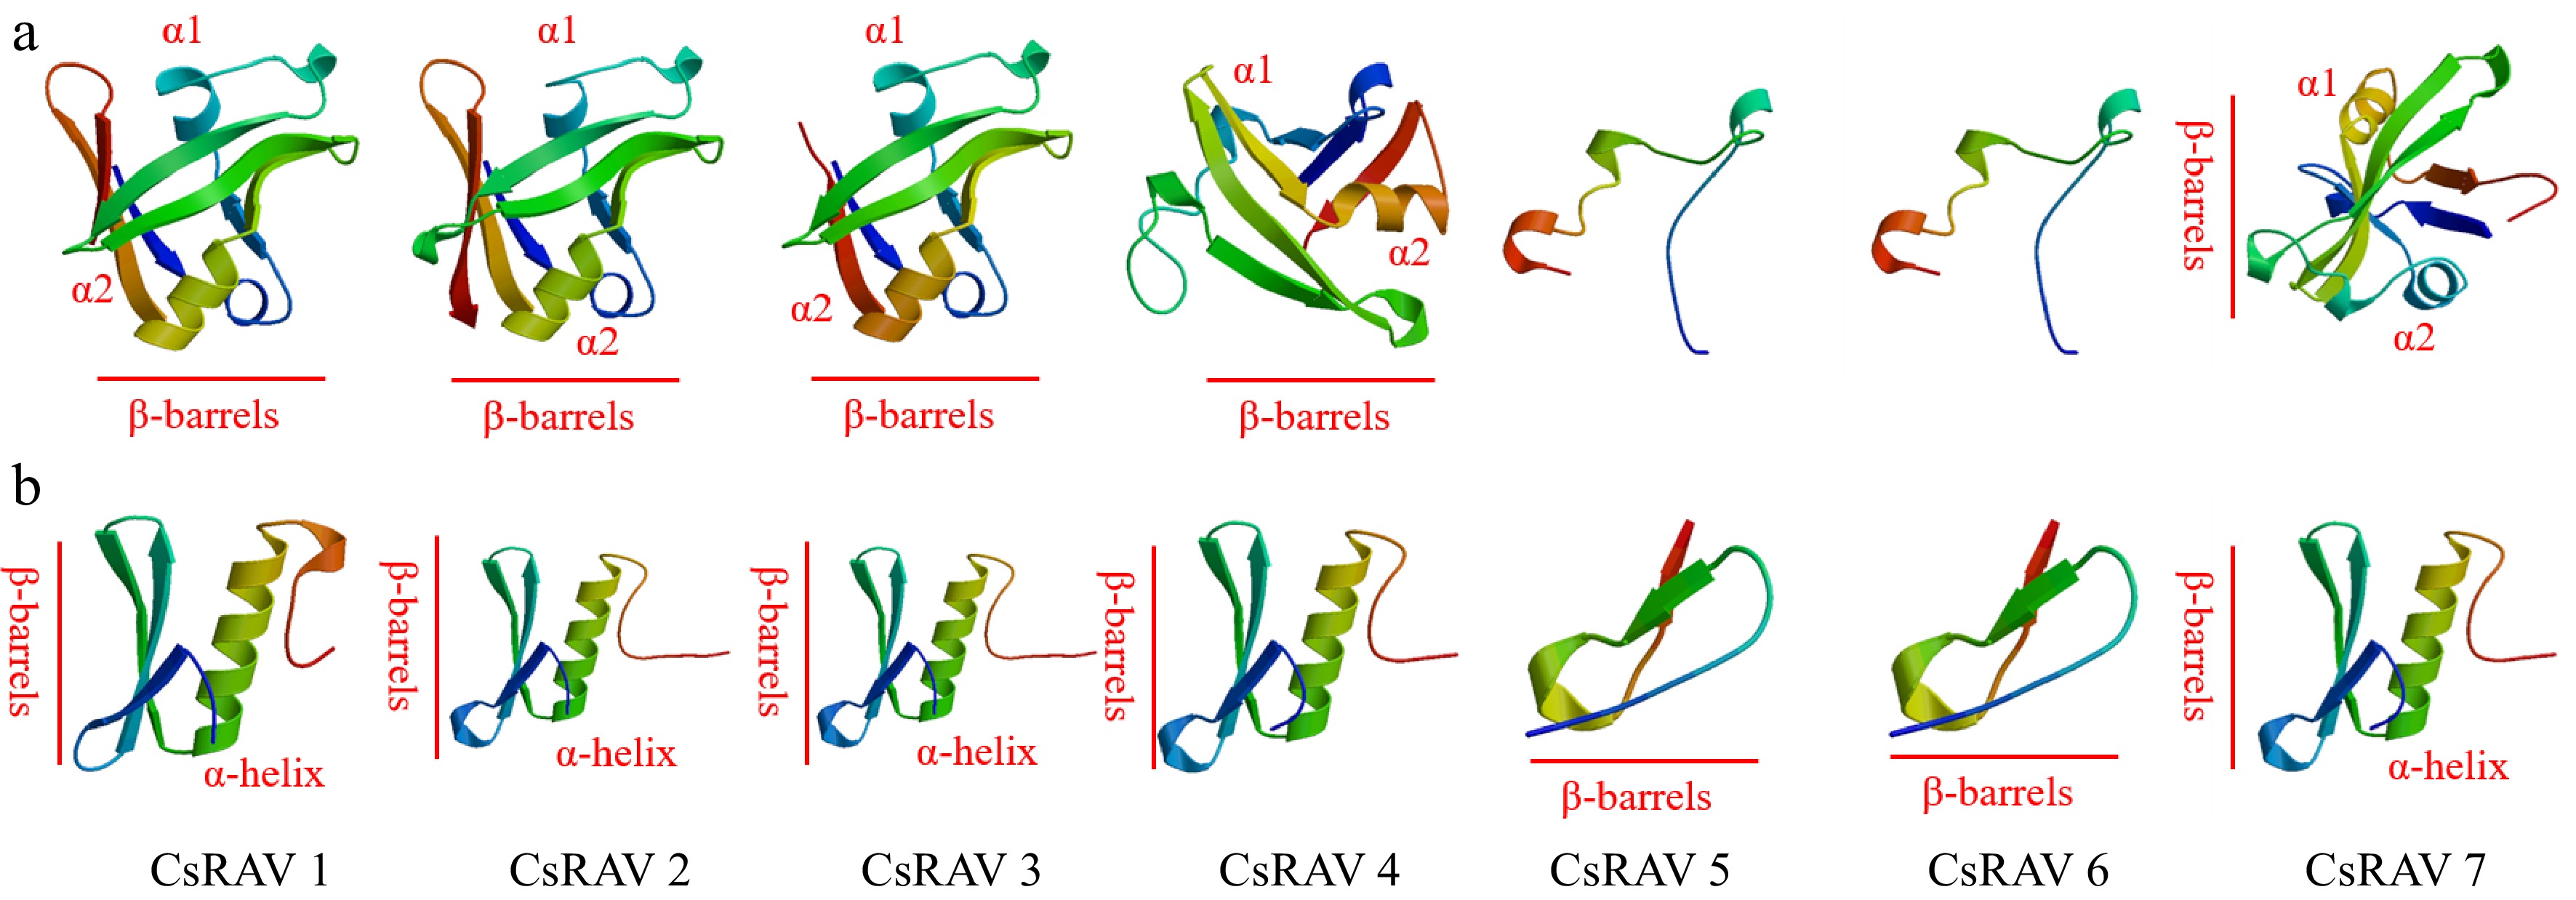
Figure 6.
Predicted structures of conserved domains in RAV proteins of tea plants. (a) Ribbon diagrams of the B3 domains of the tea plant CsRAV proteins. (b) Ribbon diagrams of the AP2 domains of the tea plant CsRAV proteins.
-
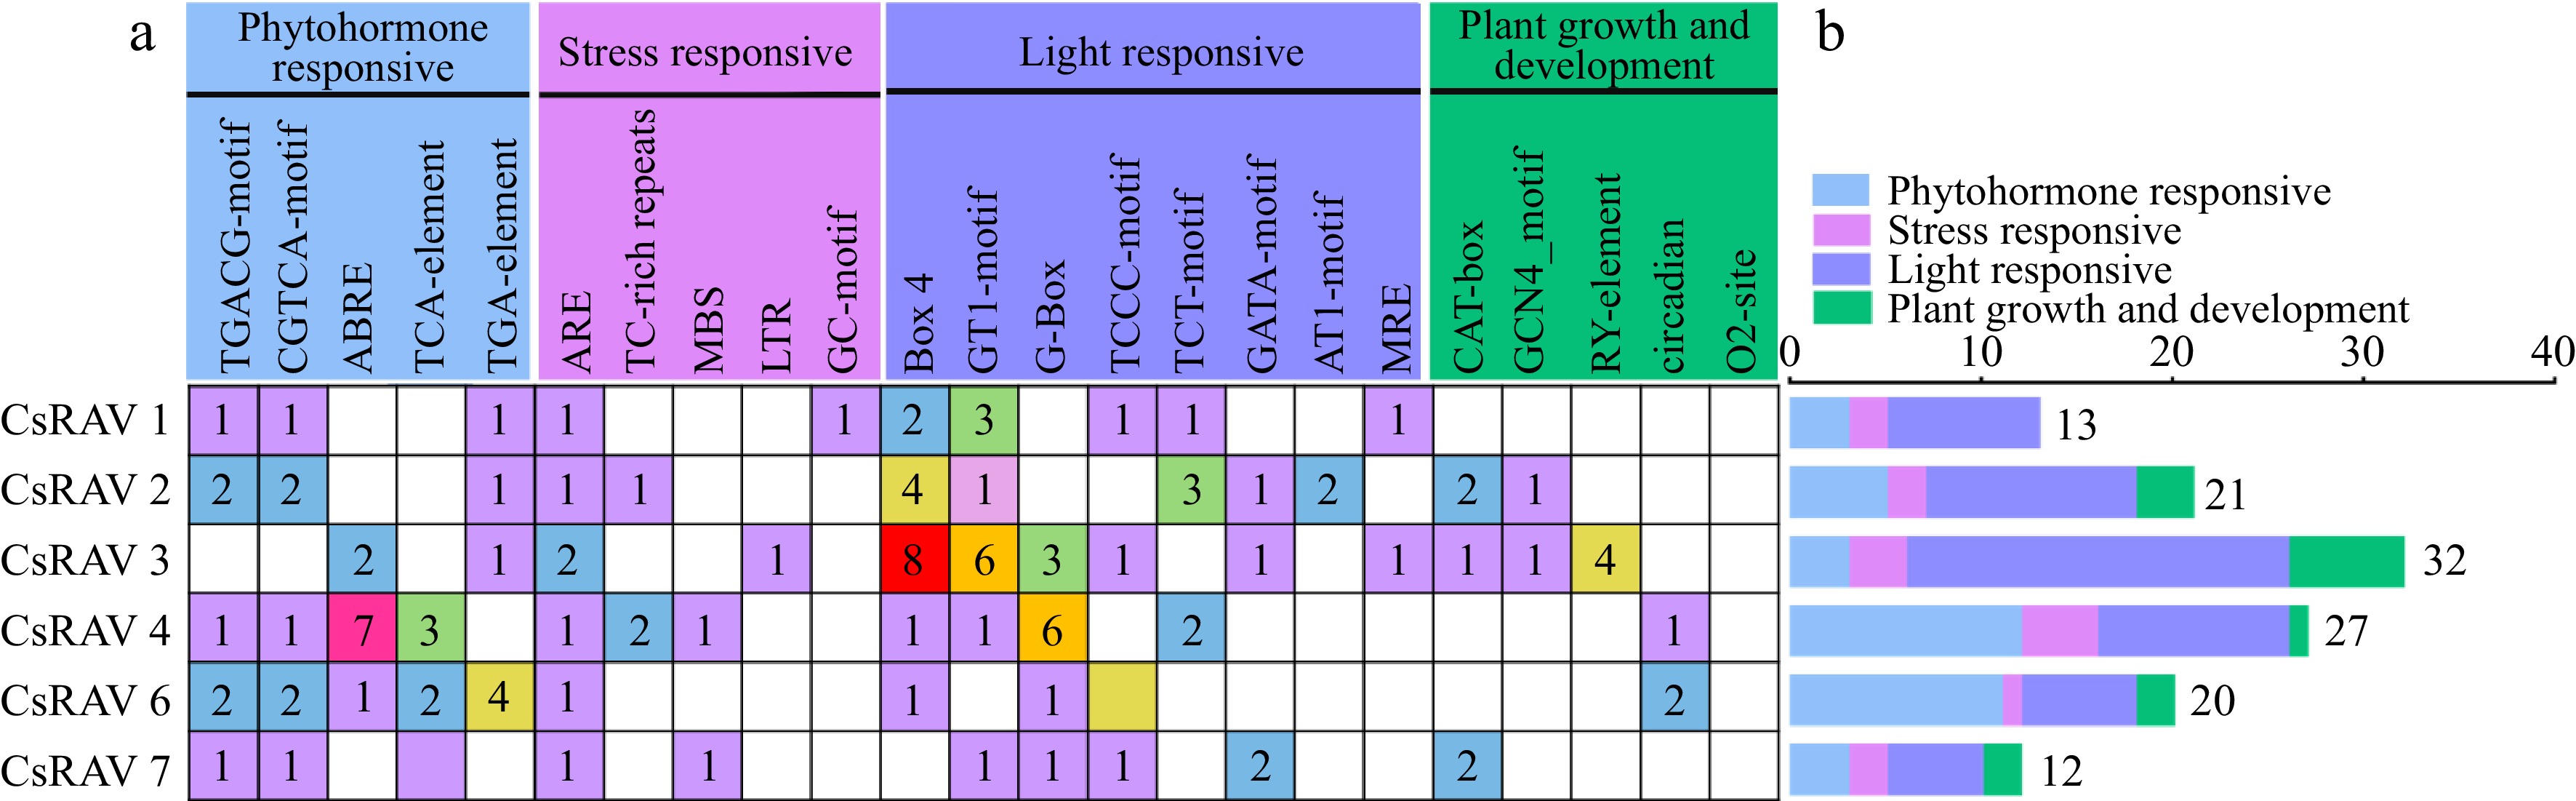
Figure 7.
Cis-promoter elements of the CsRAV genes in tea plants. (a) The numbers of different cis-elements in the promoters of CsRAV genes are indicated in different colors in the grid. (b) The numbers of cis-elements in four functional categories per gene are represented by different colored histograms.
-
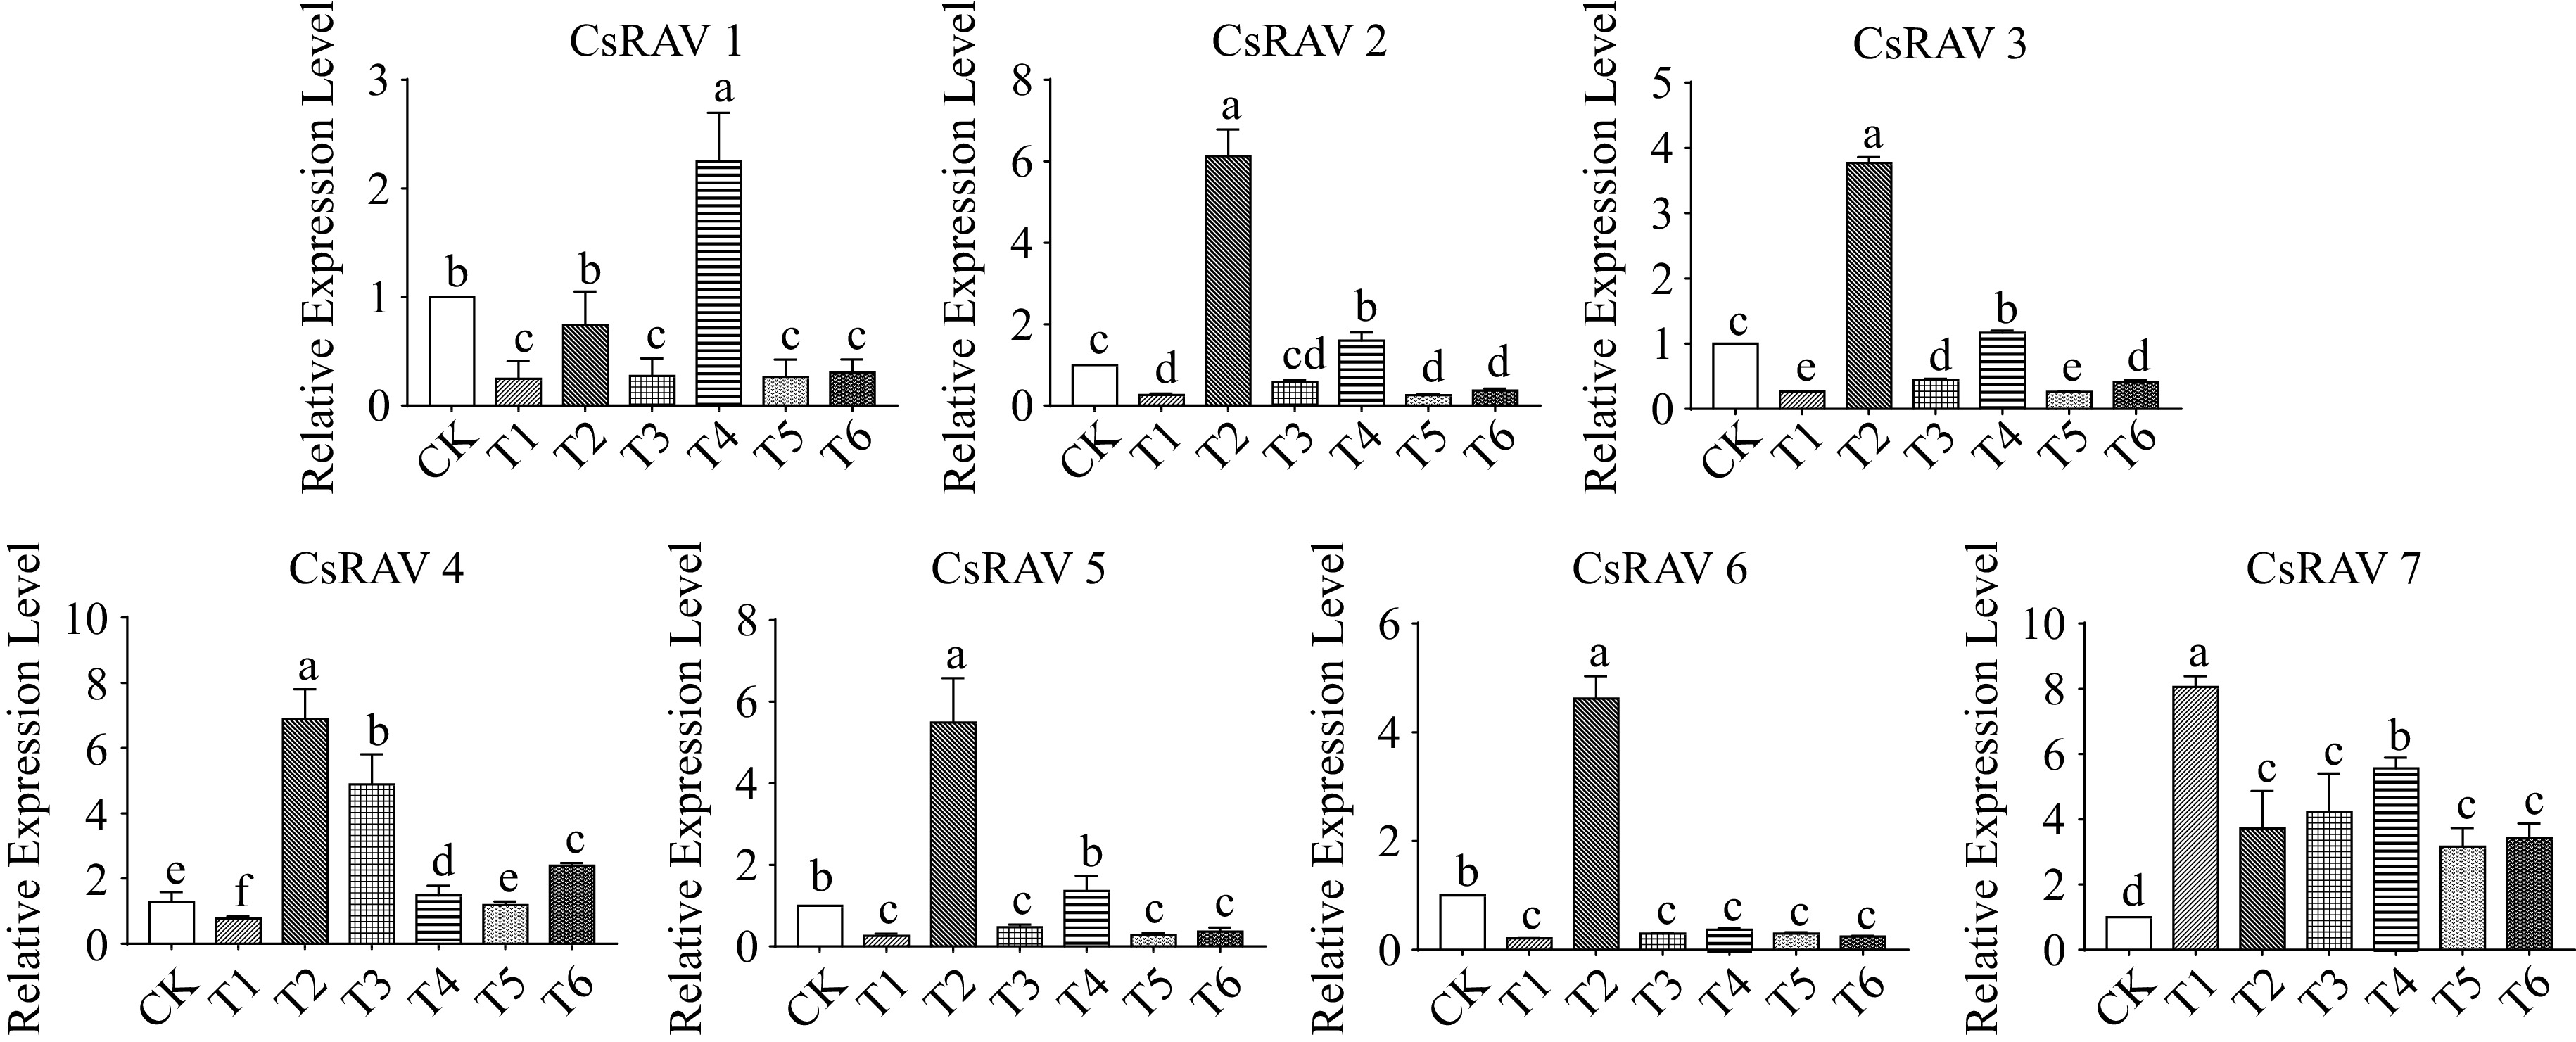
Figure 8.
The expression pattern of CsRAV genes in each sample. Error bars represent the standard error of the mean (n = 3). Different lowercase letters indicate significance at p < 0.05.
-
Treatment Days 1–4 Days 5–8 Day 9 CK Room temperature and water spray Room temperature and water spray Samples collected T1 Room temperature and water spray 4 °C cold stress Samples collected T2 4 °C cold stress Room temperature and water spray Samples collected T3 Room temperature and water spray Room temperature and 100 μM MeJA spray Samples collected T4 Room temperature and 100 μM MeJA spray Room temperature and water spray Samples collected T5 Room temperature and water spray 4 °C cold stress and 100 μM MeJA spray Samples collected T6 4 °C cold stress and 100 μM MeJA spray Room temperature and water spray Samples collected Table 1.
Details of each treatment.
-
Number Gene name Gene ID Amino acid
residuesMolecular
weight (kDa)Theoretical pI Grand average of
hydropathicitySubcellular
localization1 CsRAV1 TEA028514.1 366 40.67 8.96 −0.610 Nuclear 2 CsRAV2 TEA006376.1 375 41.78 9.30 −0.561 Nuclear 3 CsRAV3 TEA020682.1 329 36.77 8.97 −0.462 Nuclear 4 CsRAV4 TEA006600.1 344 39.68 6.20 −0.516 Nuclear 5 CsRAV5 TEA016614.1 352 39.56 8.19 −0.655 Nuclear 6 CsRAV6 TEA004203.1 359 41.07 5.61 −0.698 Nuclear 7 CsRAV7 TEA030533.1 1,130 127.04 5.20 −0.819 Nuclear Table 2.
The physicochemical properties of tea plant RAV proteins.
Figures
(8)
Tables
(2)