-
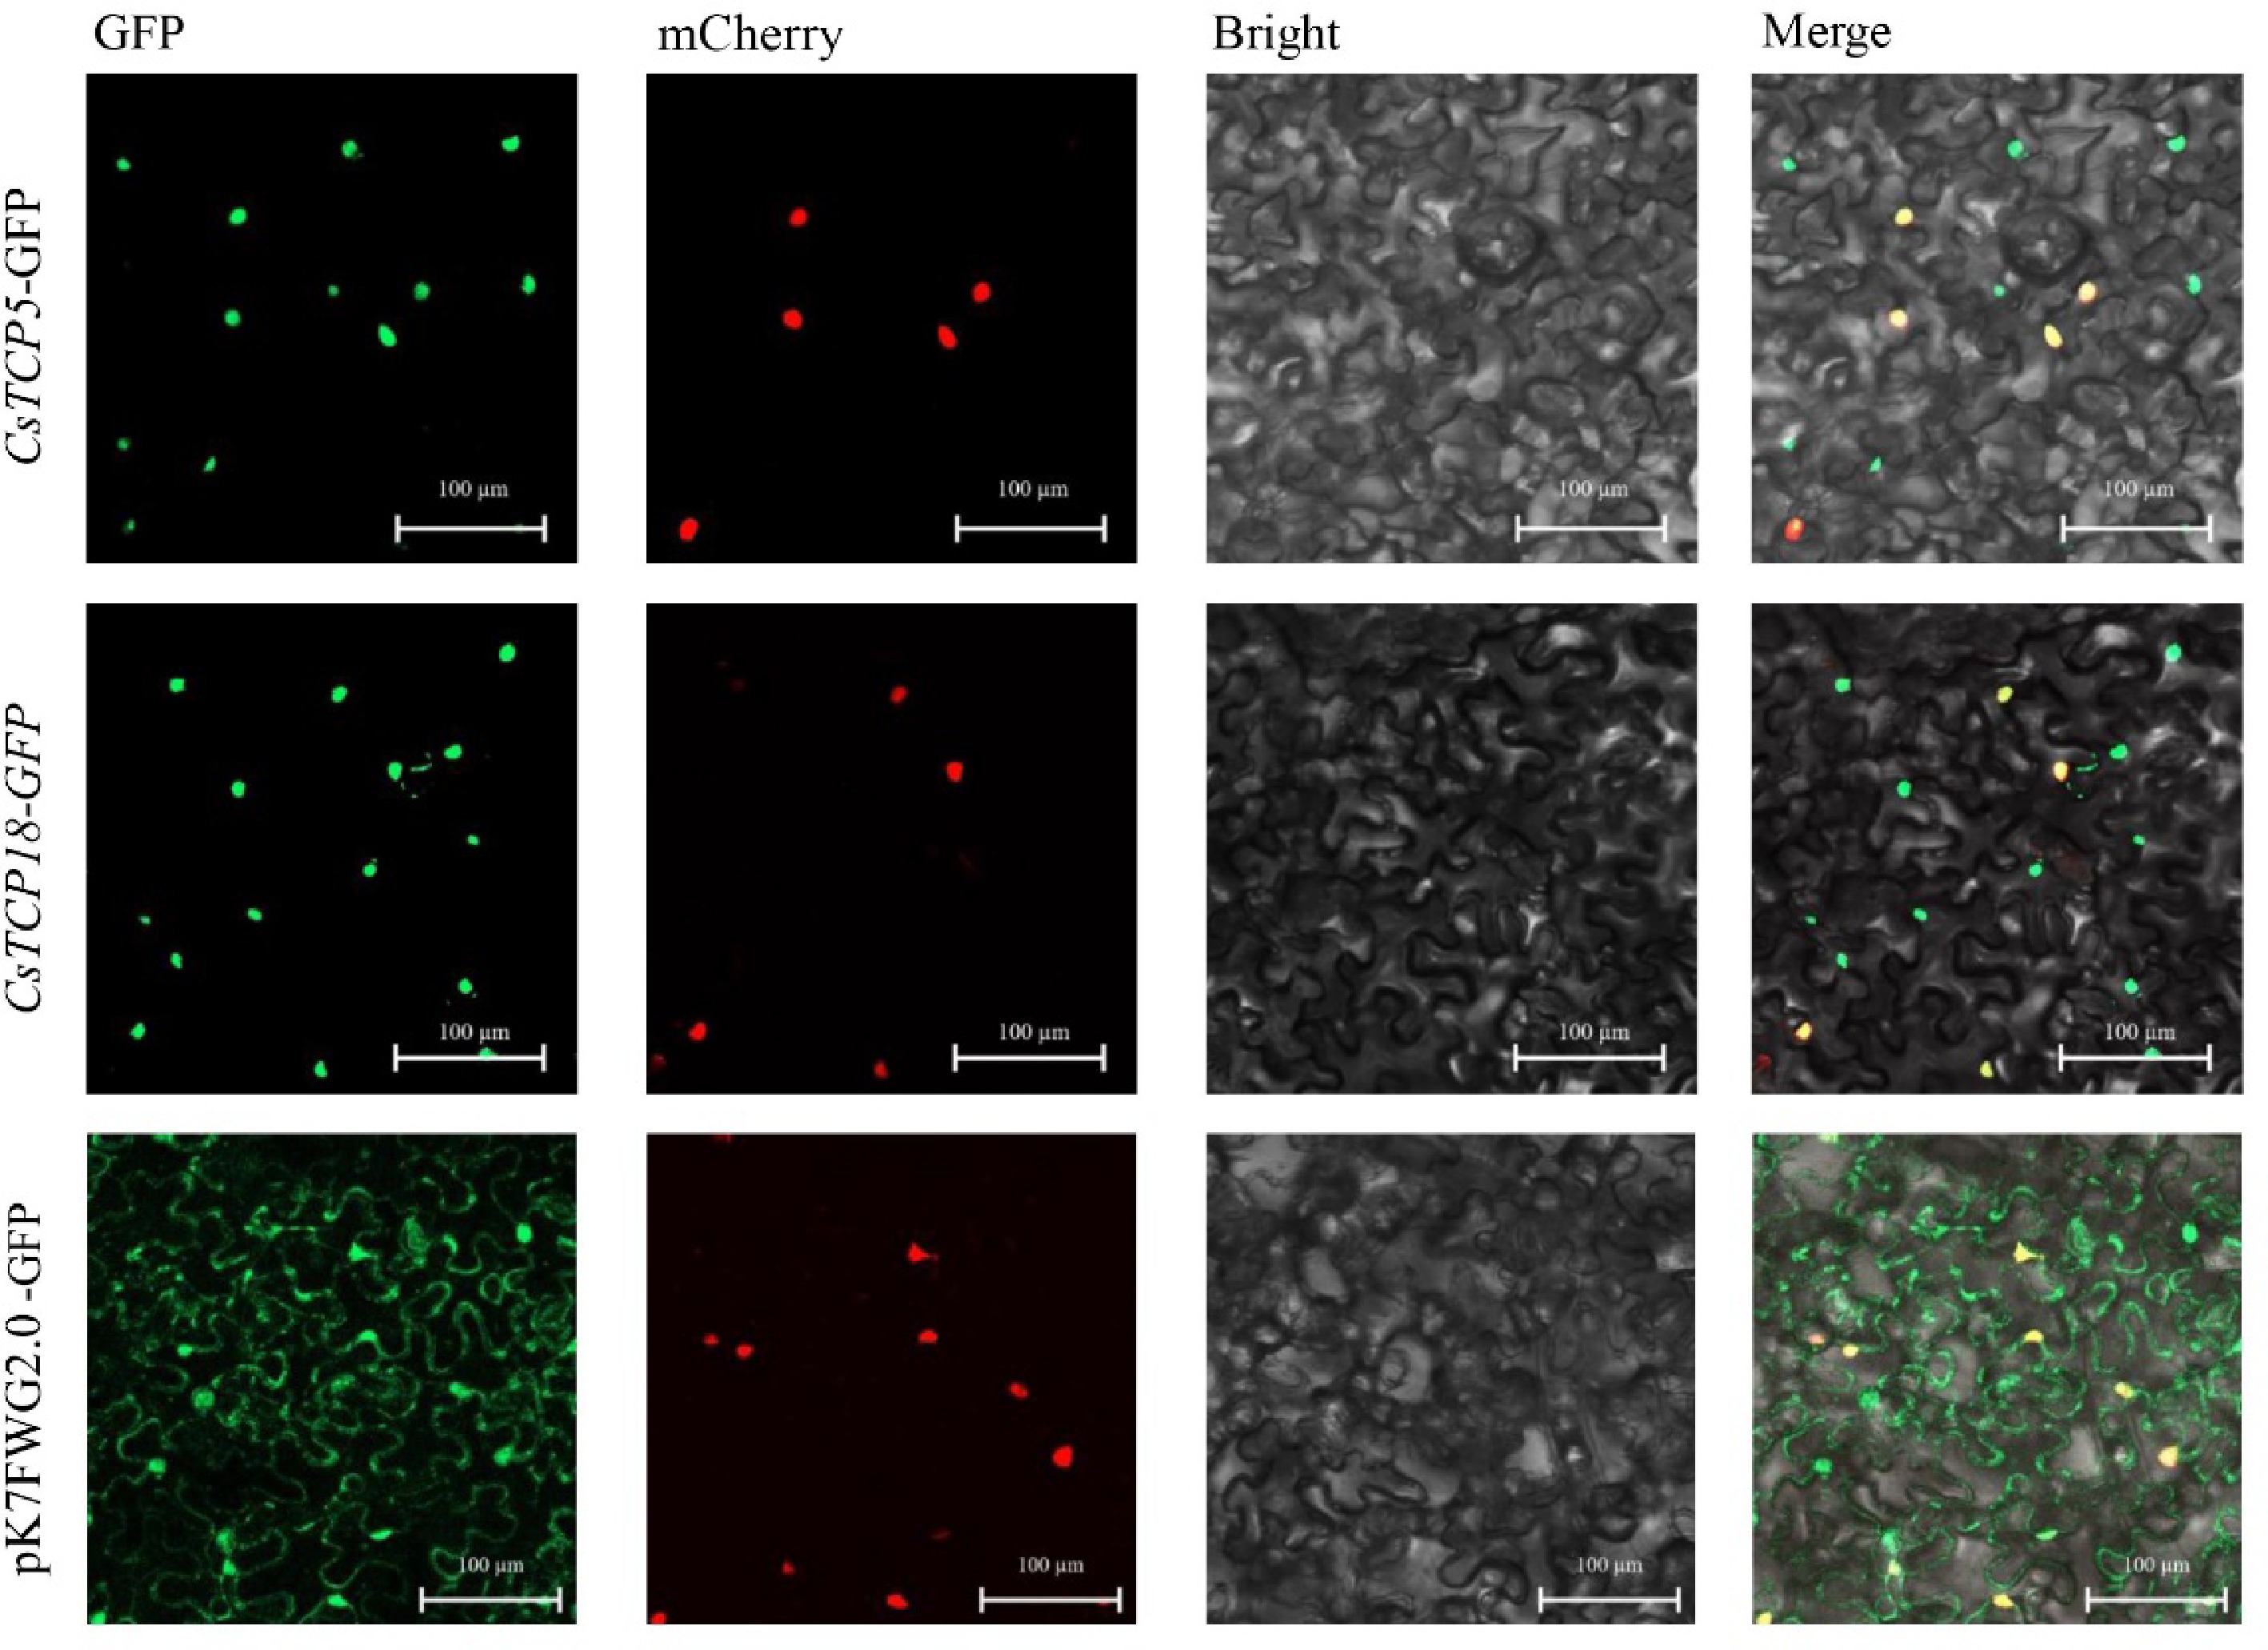
Figure 1.
Subcellular localization of CsTCP5 and CsTCP18 proteins in N. benthamiana leaf cells. GFP: green fluorescence channel. mCherry: red fluorescence channel. Bright: bright field channel. Merge: superimposed channel. Images are representative of at least three independent experiments. Bar = 100 µm.
-
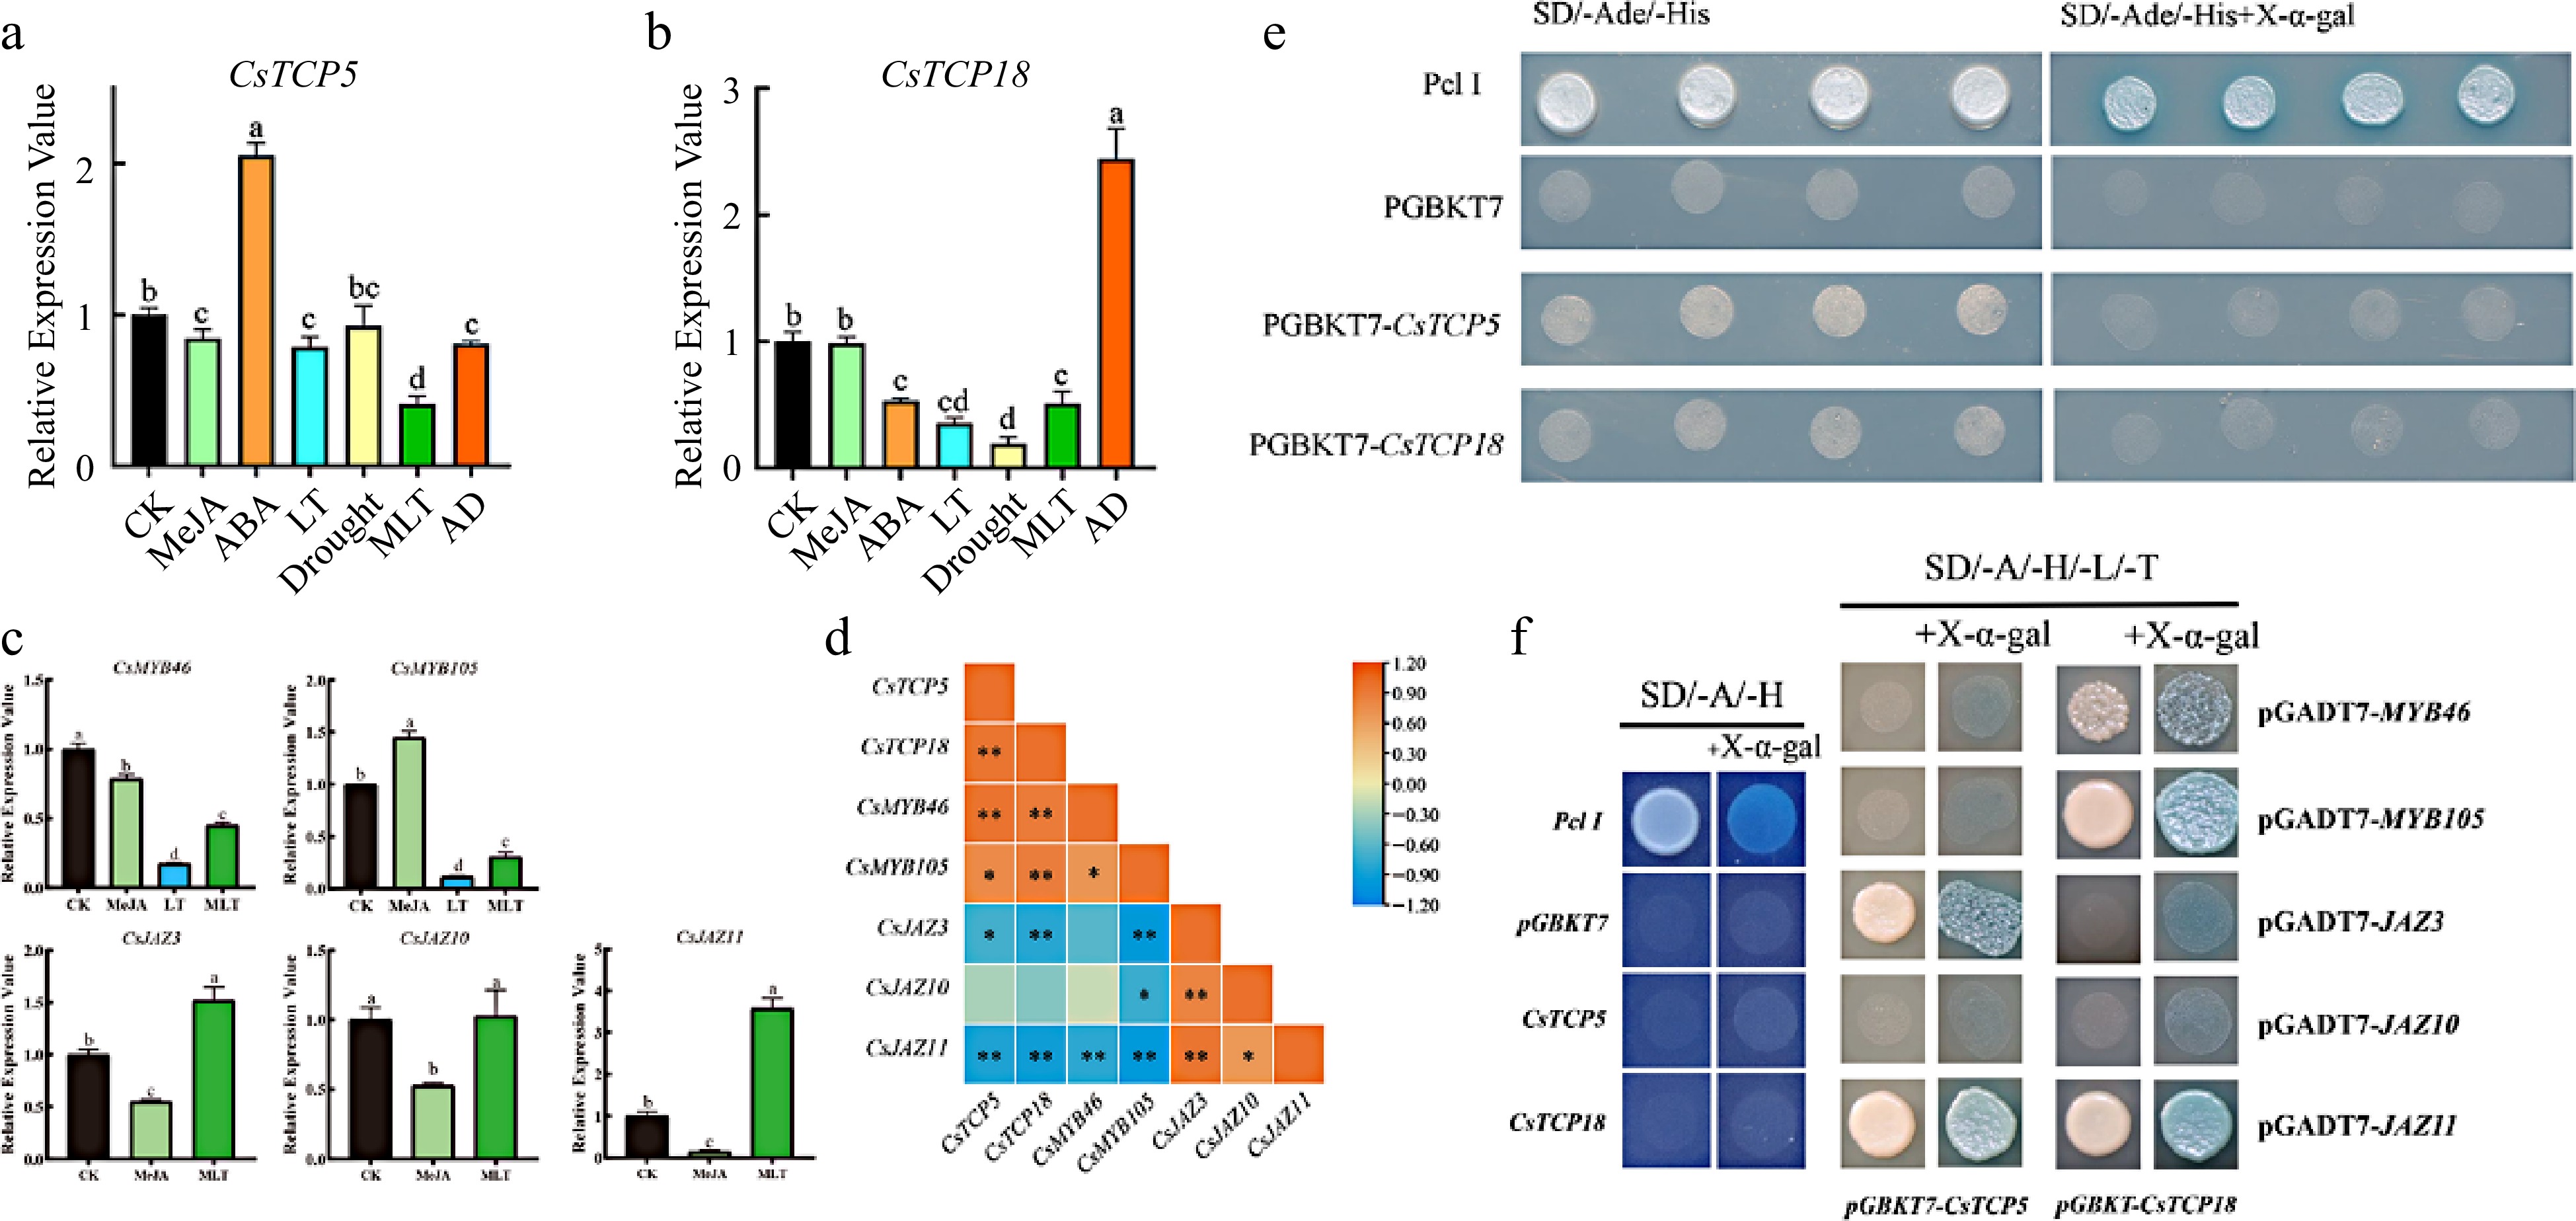
Figure 2.
Relative expression of CsTCP5, CsTCP18, CsMYBs, and CsJAZs in response to different treatments and Y2H assays. (a) Relative expression of CsTCP5. (b) Relative expression of CsTCP18. (c) Relative expression of CsMYBs and CsJAZs under MeJA, LT and/or MLT treatments. (d) Correlation analysis of CsTCP5/18, CsMYB46/105, and CsJAZ3/10/11 expression. CK: control group. MeJA: methyl jasmonate. ABA: abscisic acid. LT: low temperature. MLT: MeJA and low temperature. AD: ABA and drought. In (a)–(c), different letters indicate significant differences (p < 0.05). Error bars represent the SE of three replicates. In (d), asterisks indicate significant differences between values (* p < 0.05, ** p < 0.01). (e) Y2H transcriptional activation assay of CsTCP5 and CsTCP18. SD/-Ade/-His, SD medium lacking adenine and histidine. SD/-Ade/-His+X-α-gal, SD medium lacking adenine (Ade) and histidine (His) and containing 10 μM X-α-gal. Pcl I, positive control. PGBKT7, negative control. (f) Y2H assays reveal interactions of CsTCP5 and CsTCP18 with CsMYBs and CsJAZs in yeast cells. SD/-A/-H, SD medium lacking adenine and histidine. SD/-A/-H/-L/-T, SD medium lacking adenine, histidine, leucine, and tryptophan. +X-α-gal, 10 μM X-α-gal. Pcl I, positive control. PGBKT7, negative control.
-
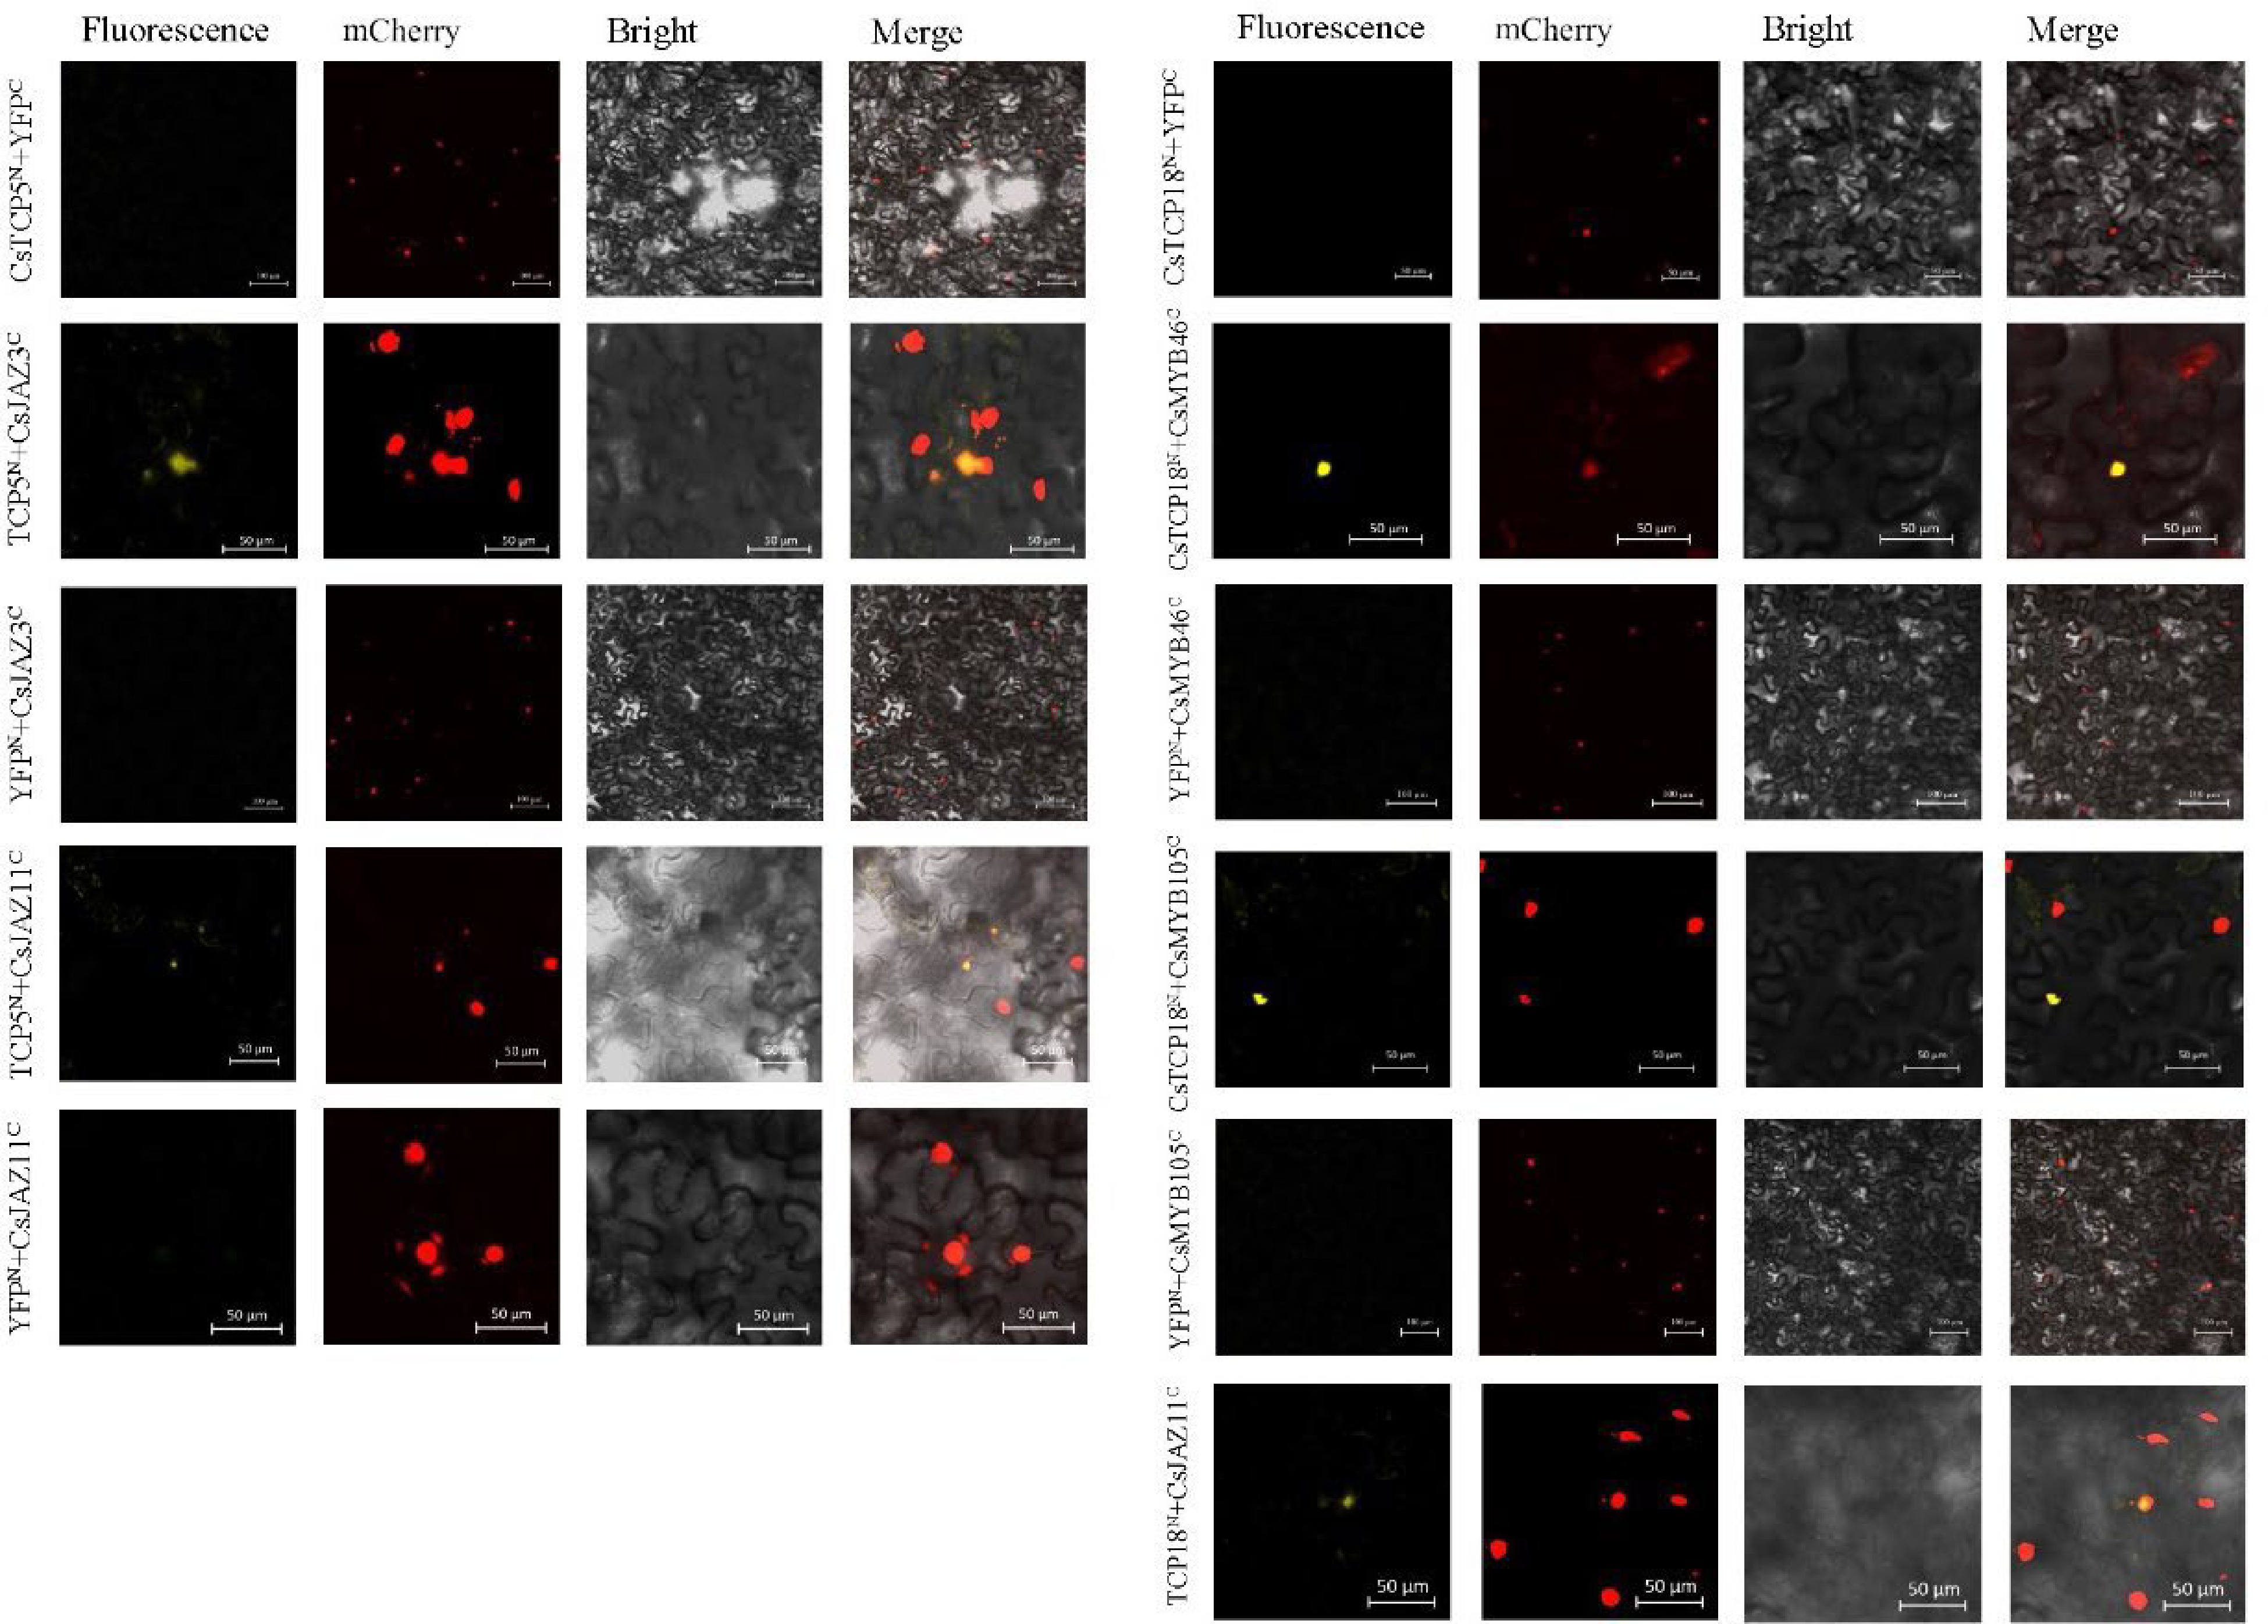
Figure 3.
BiFC analysis of protein–protein interactions of CsTCP5 and CsTCP18 with CsMYBs and CsJAZs in N. benthamiana cells. Fluorescence: yellow fluorescence channel. mCherry: red fluorescence channel. Bright: bright field channel. Merge: superimposed channel. Bar = 100 µm.
-
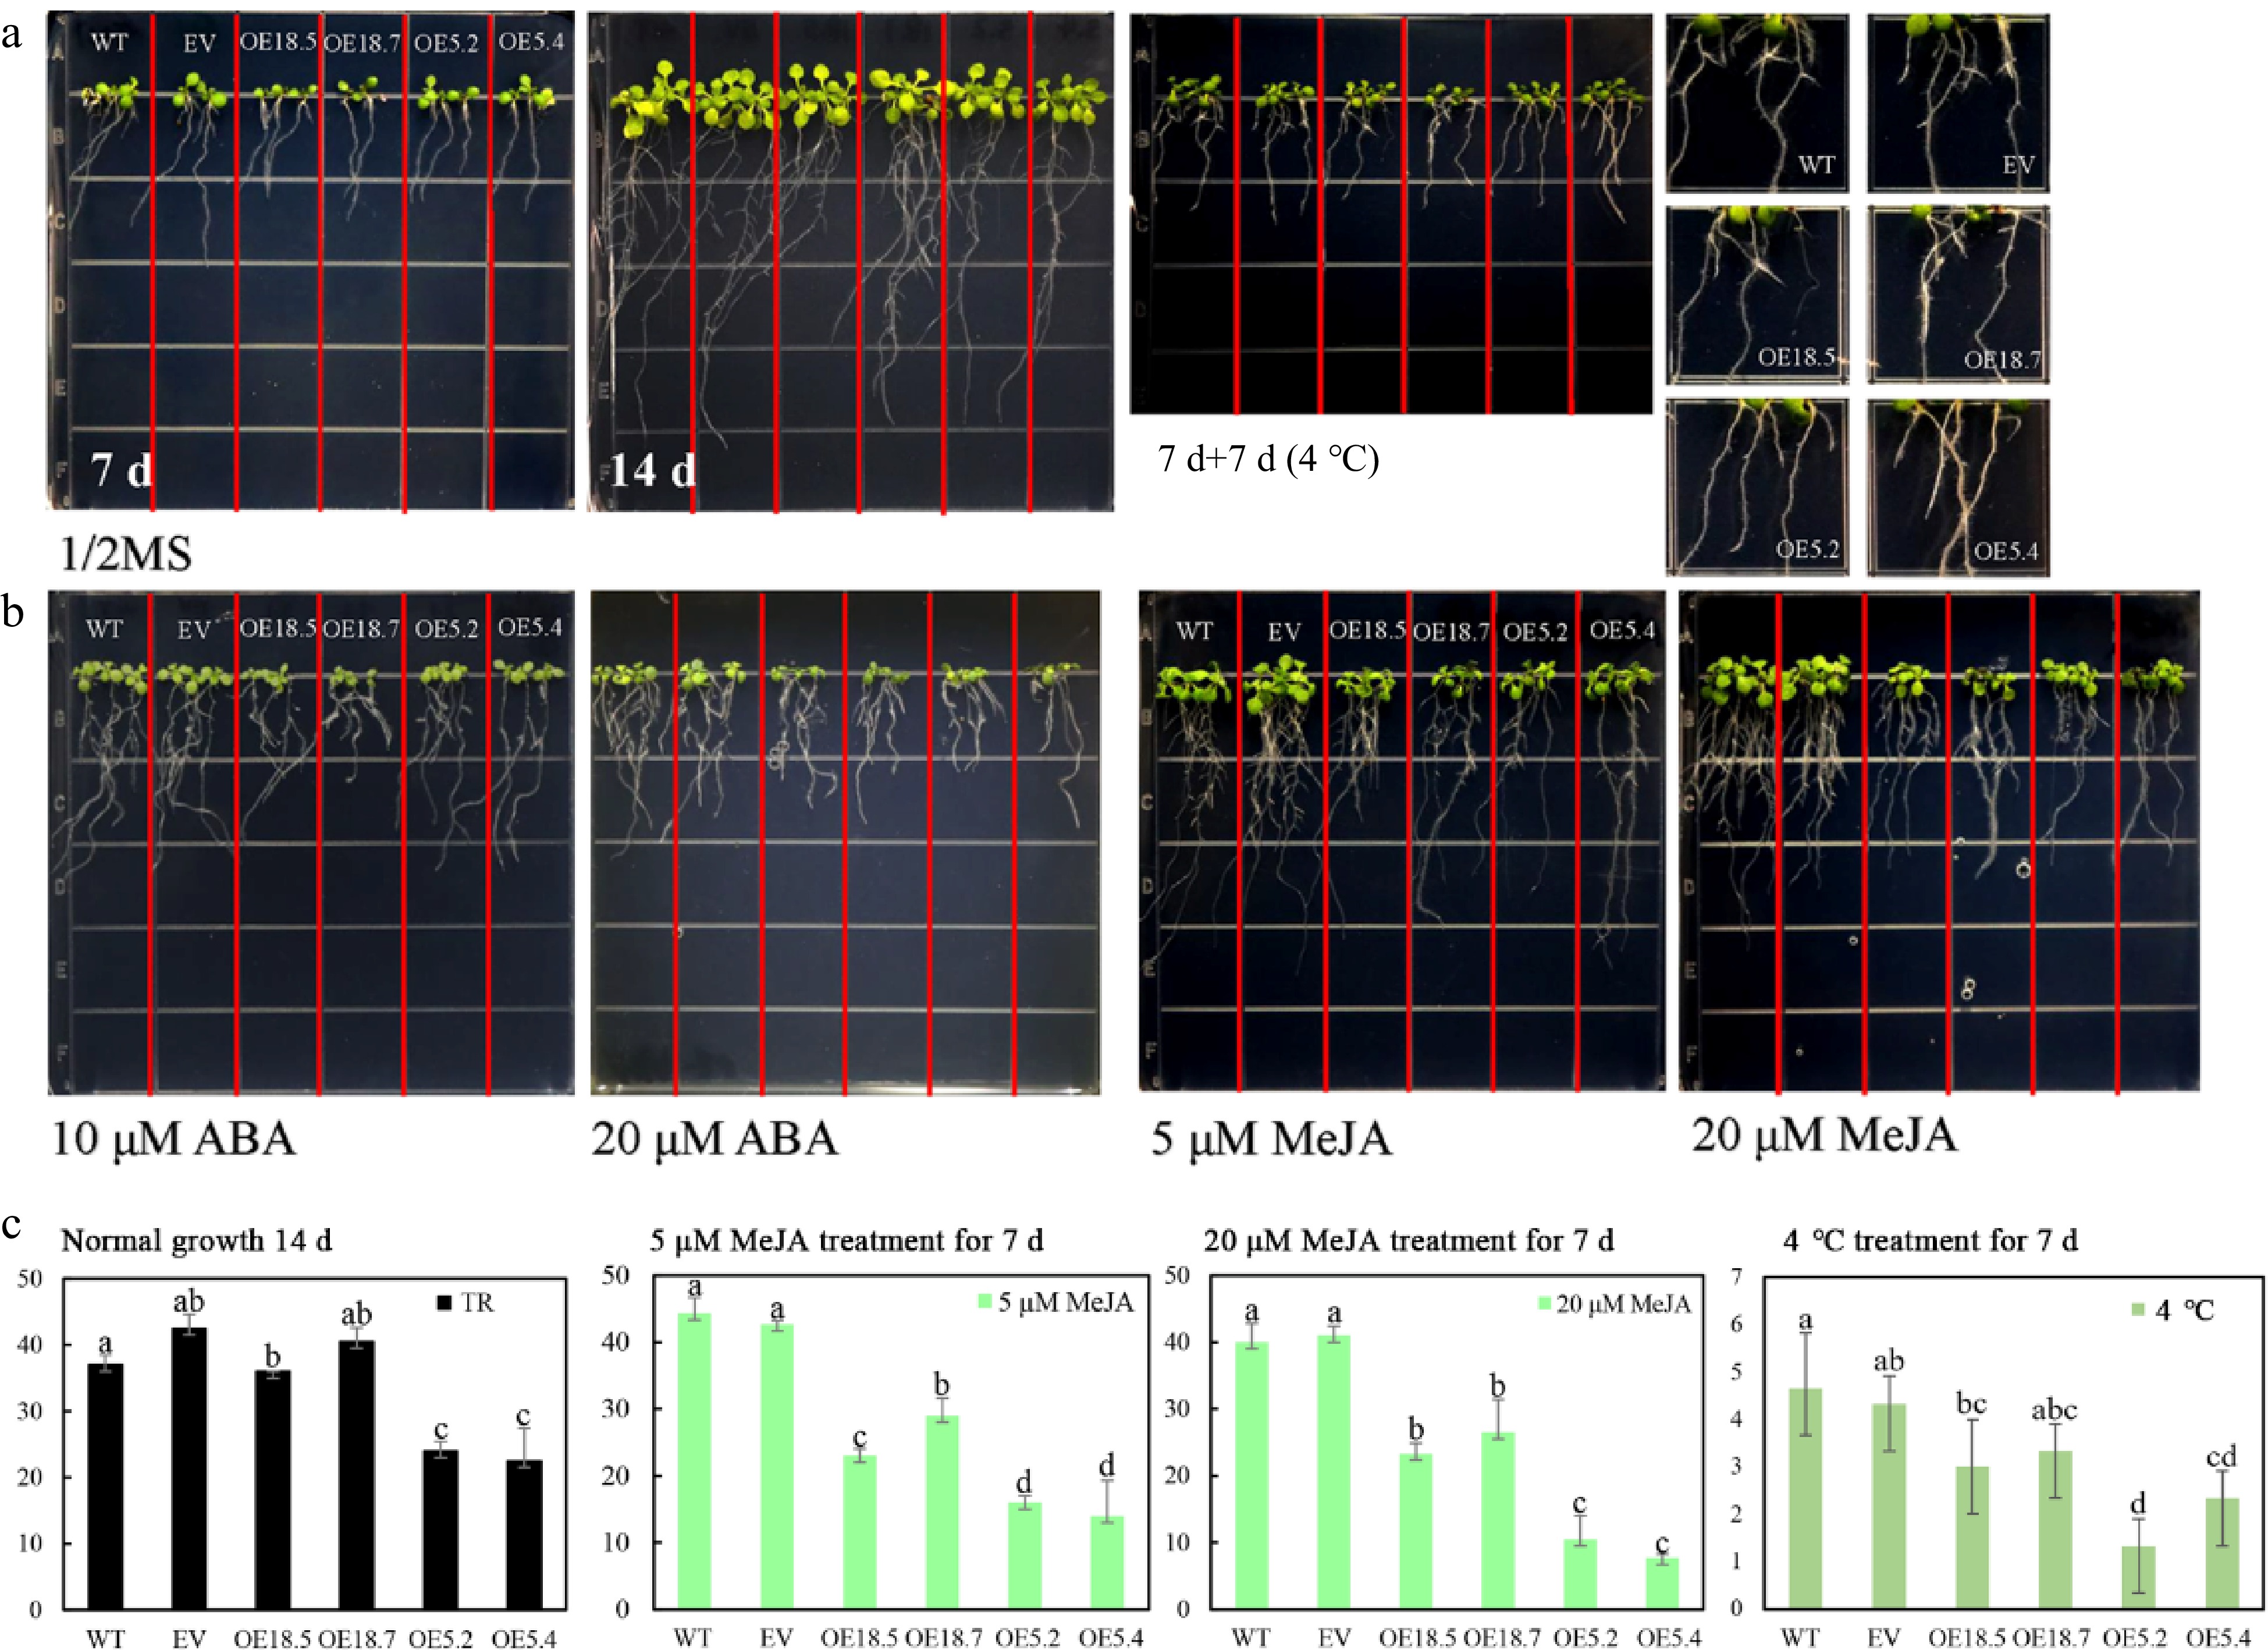
Figure 4.
Root growth of WT, EV, CsTCP18-overexpressing (OE18.7 and OE18.5), and CsTCP5-overexpressing (OE5.2 and OE5.4) Arabidopsis under different treatments. (a) Root growth after 7 d at normal temperature, 14 d at normal temperature, and 7 d at normal temperature followed by 7 d at low temperature (4 °C). (b) Root growth after 7 d with 10 μM ABA, 20 μM ABA, 5 μM MeJA, or 20 μM MeJA. Each square in the grid measures 1.5 cm × 1.5 cm. (c) Lateral root numbers of control and transgenic Arabidopsis lines under different treatment conditions. Error bars represent the SE of three replicates. Different letters indicate significant differences between measurements (p < 0.05). TR: total lateral roots.
-
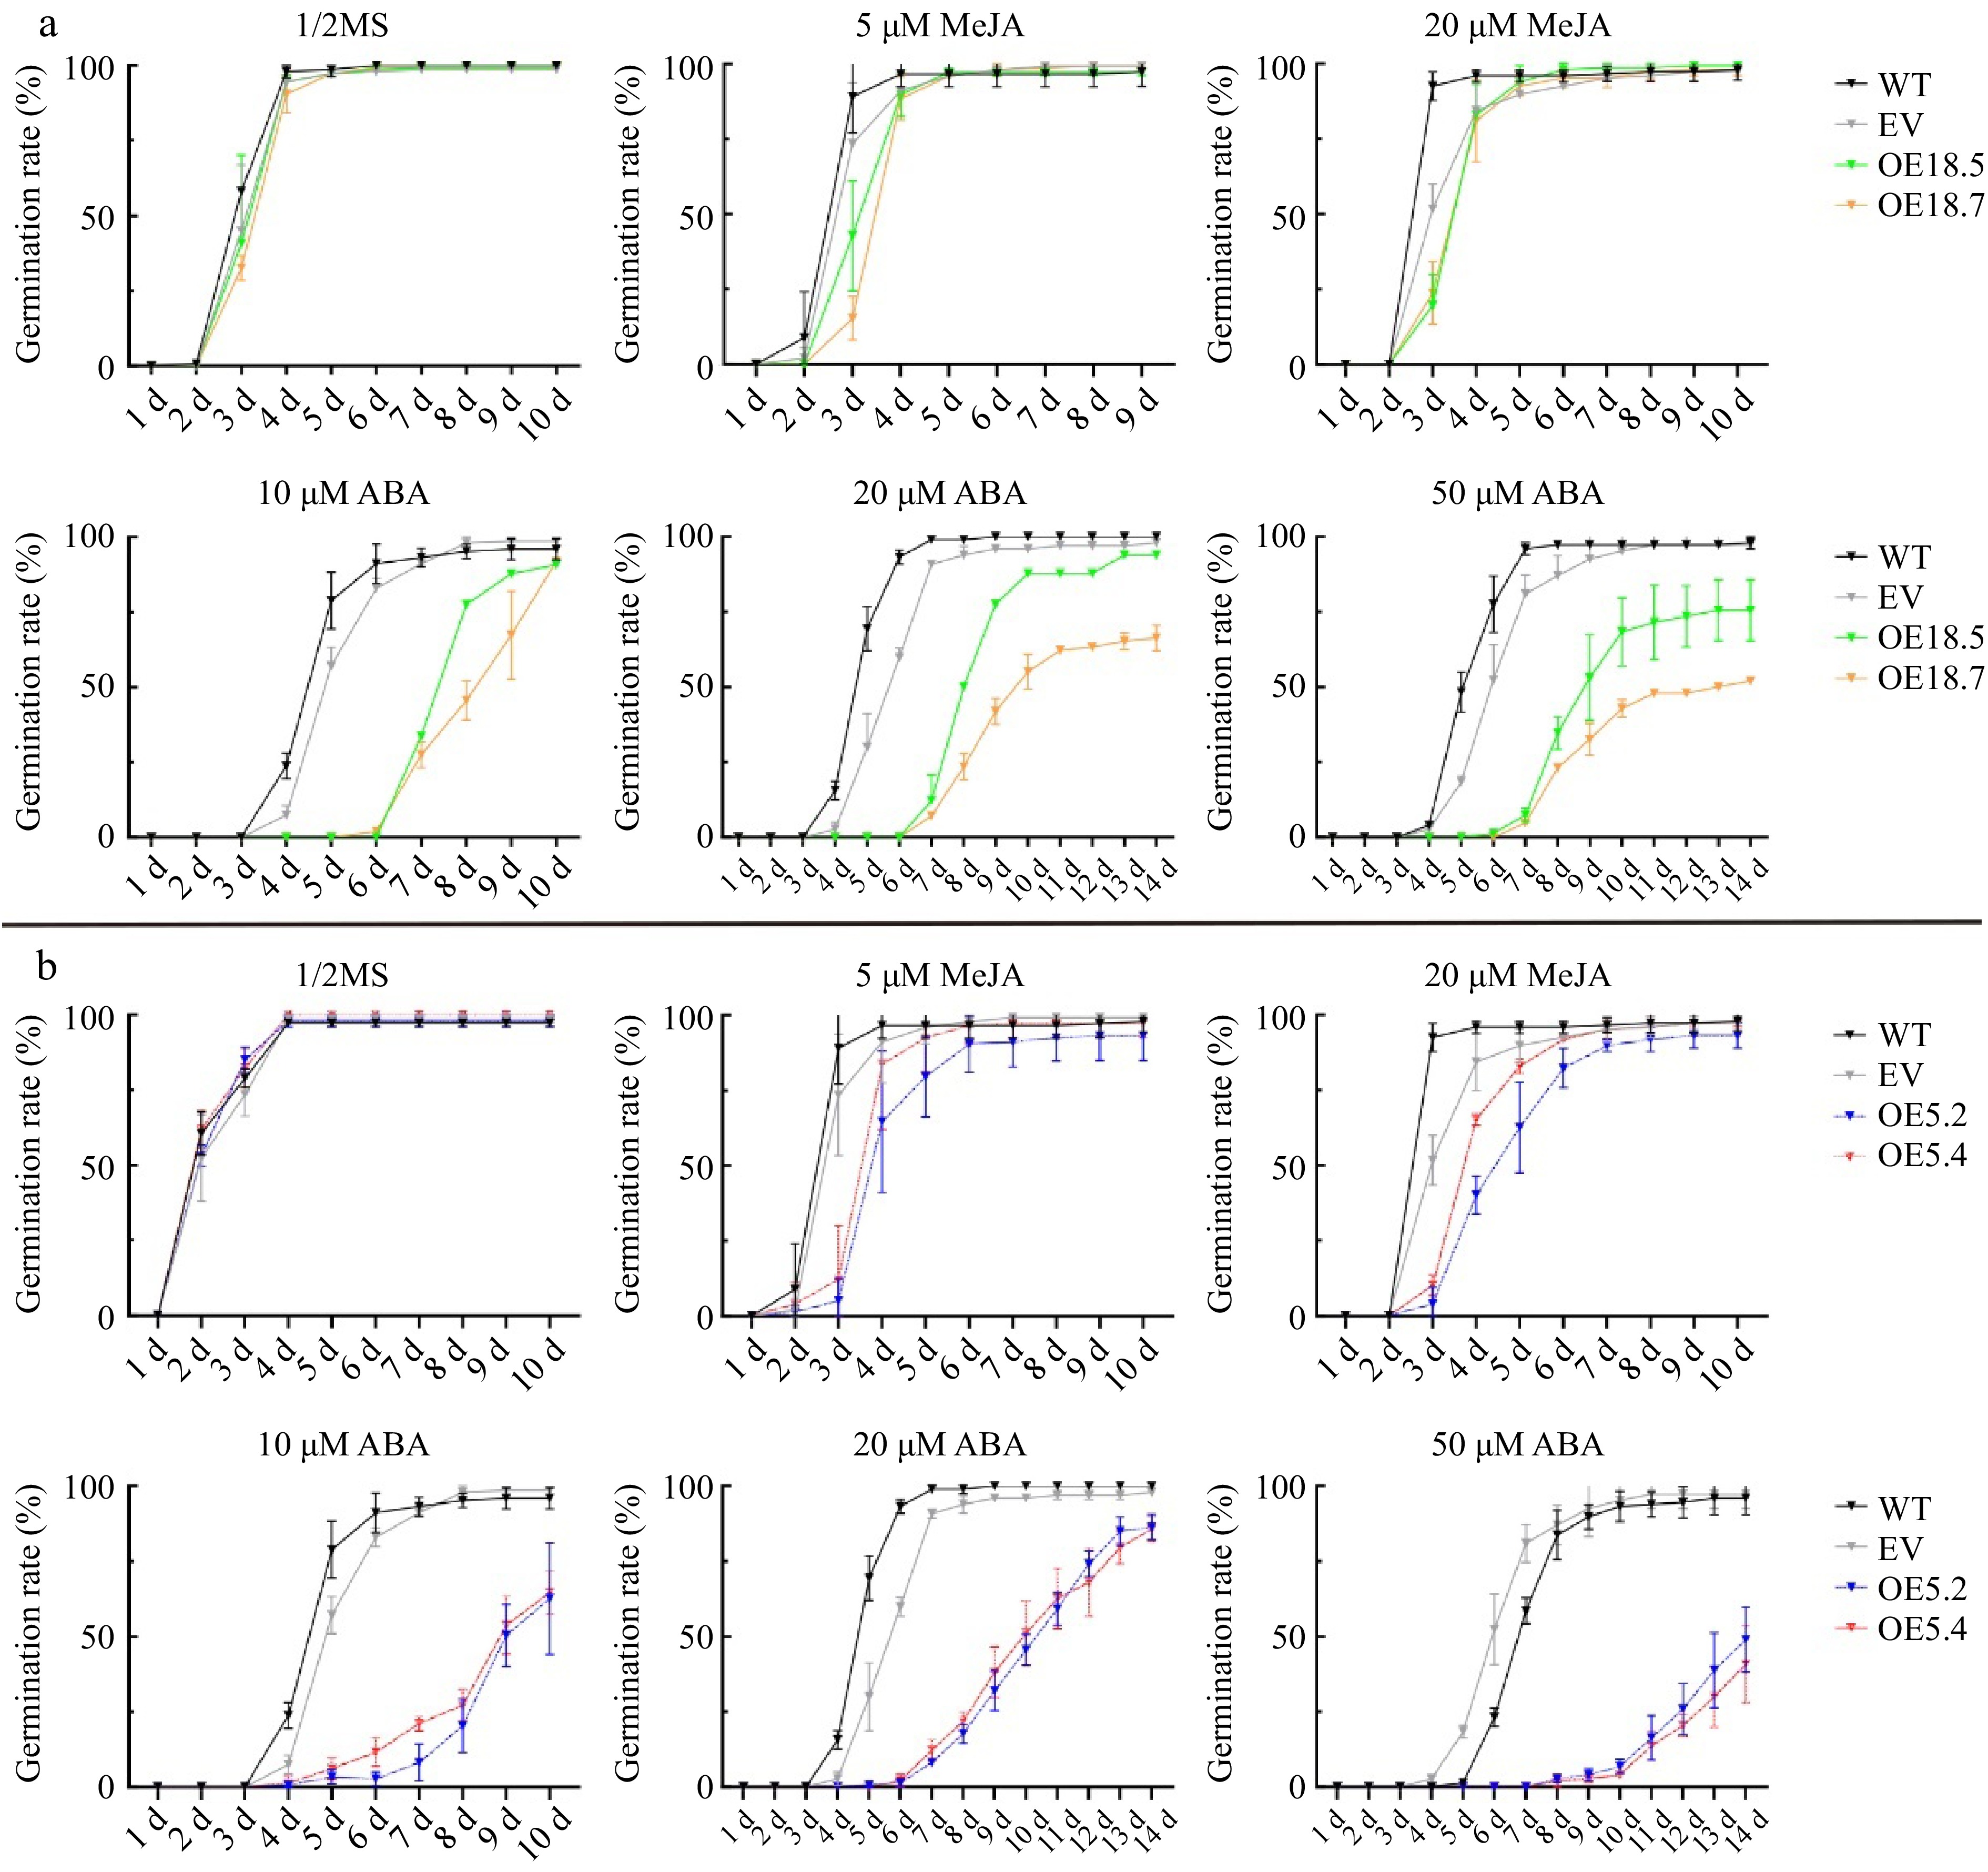
Figure 5.
Germination rates of WT, EV, CsTCP18-overexpressing (OE18.5 and OE18.7), and CsTCP5-overexpressing (OE5.2 and OE5.4) Arabidopsis exposed to different concentrations of MeJA and ABA. (a) Germination rates of CsTCP18-overexpressing Arabidopsis. (b) Germination rates of CsTCP5-overexpressing Arabidopsis. Error bars represent the SE of three replicates.
-
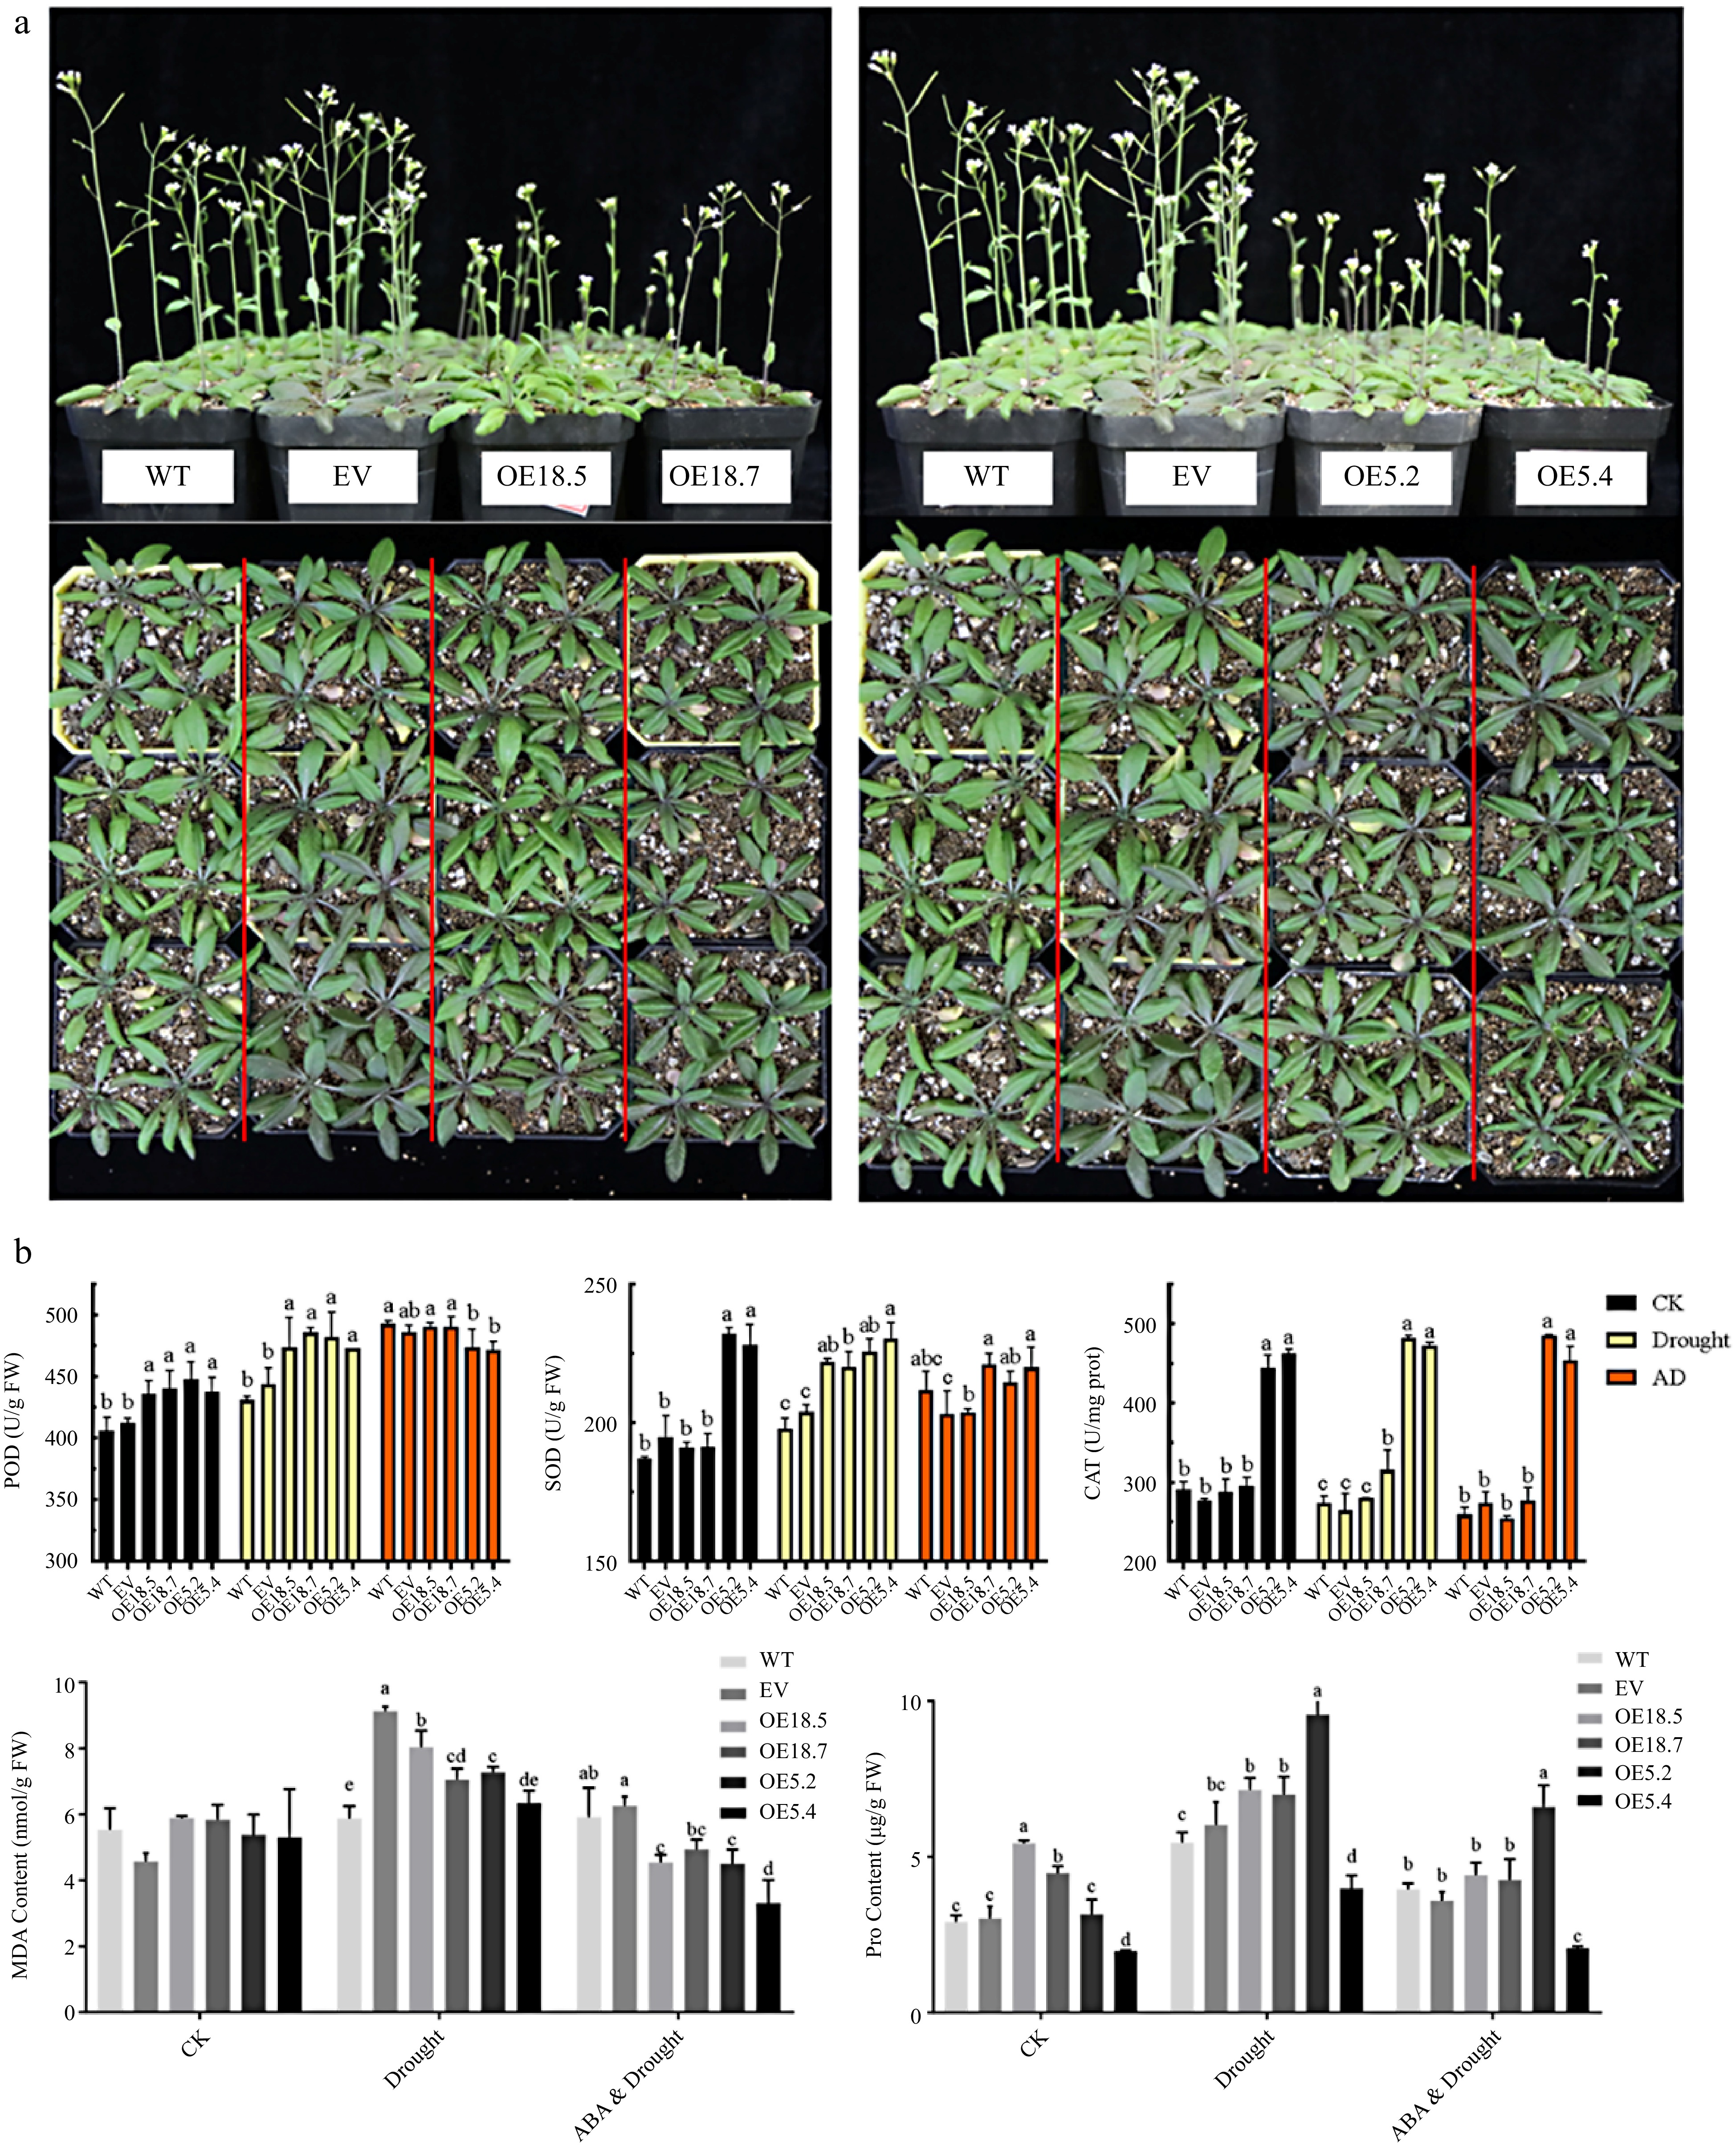
Figure 6.
Phenotypes and physiological verification of WT, EV, CsTCP18-overexpressing (OE18.5/OE18.7), and CsTCP5-overexpressing (OE5.2/OE5.4) Arabidopsis exposed to different conditions. (a) Phenotypes observations of all lines exposed to drought conditions. Bar = 7 cm. (b) Antioxidant enzyme activities and contents of malondialdehyde (MDA) and proline in Arabidopsis under control conditions, drought, or drought plus ABA application. CK: control group. AD: ABA and Drought. Different letters indicate significant differences between groups (p < 0.05).
-
WT EV OE18.5 OE18.7 OE5.2 OE5.4 Survived 3/24 (12.5%) 5/24 (20.8%) 7/24 (29.1%) 9/24 (37.5%) 13/24 (54.1%) 16/24 (66.7%) Flowered 13/24 (54.1%) 7/24 (29.1%) 4/24 (16.7%) 7/24 (29.1%) 0/24 (0%) 4/24 (16.7%) Table 1.
Numbers of plants that survived and flowered in WT, EV, CsTCP5-overexpressing, and CsTCP18-overexpressing Arabidopsis lines under drought conditions.
Figures
(6)
Tables
(1)