-
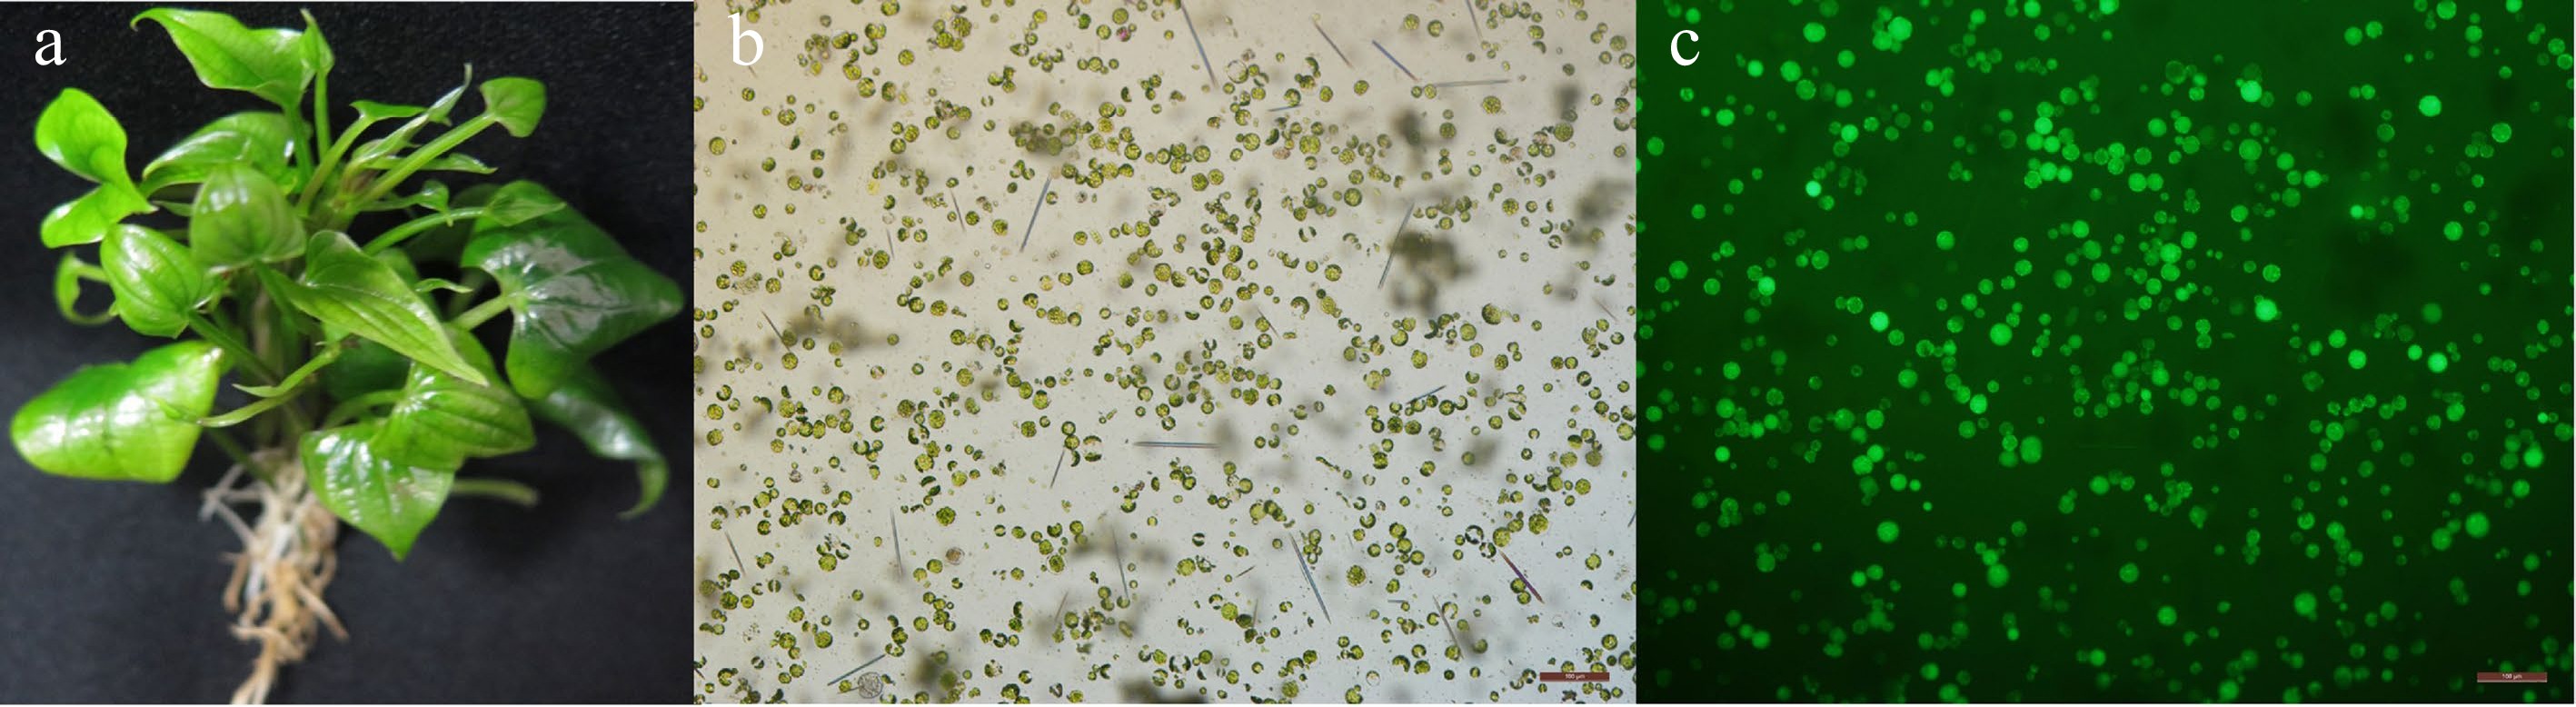
Figure 1.
Greater yam protoplast isolation and viability assay. (a) A healthy six-week-old greater yam plantlet after sub culture which is suitable for protoplast isolation. Mesophyll protoplasts were stained with FDA and observed under (b) bright light and (c) UV light. Scale bar = 100 μm.
-
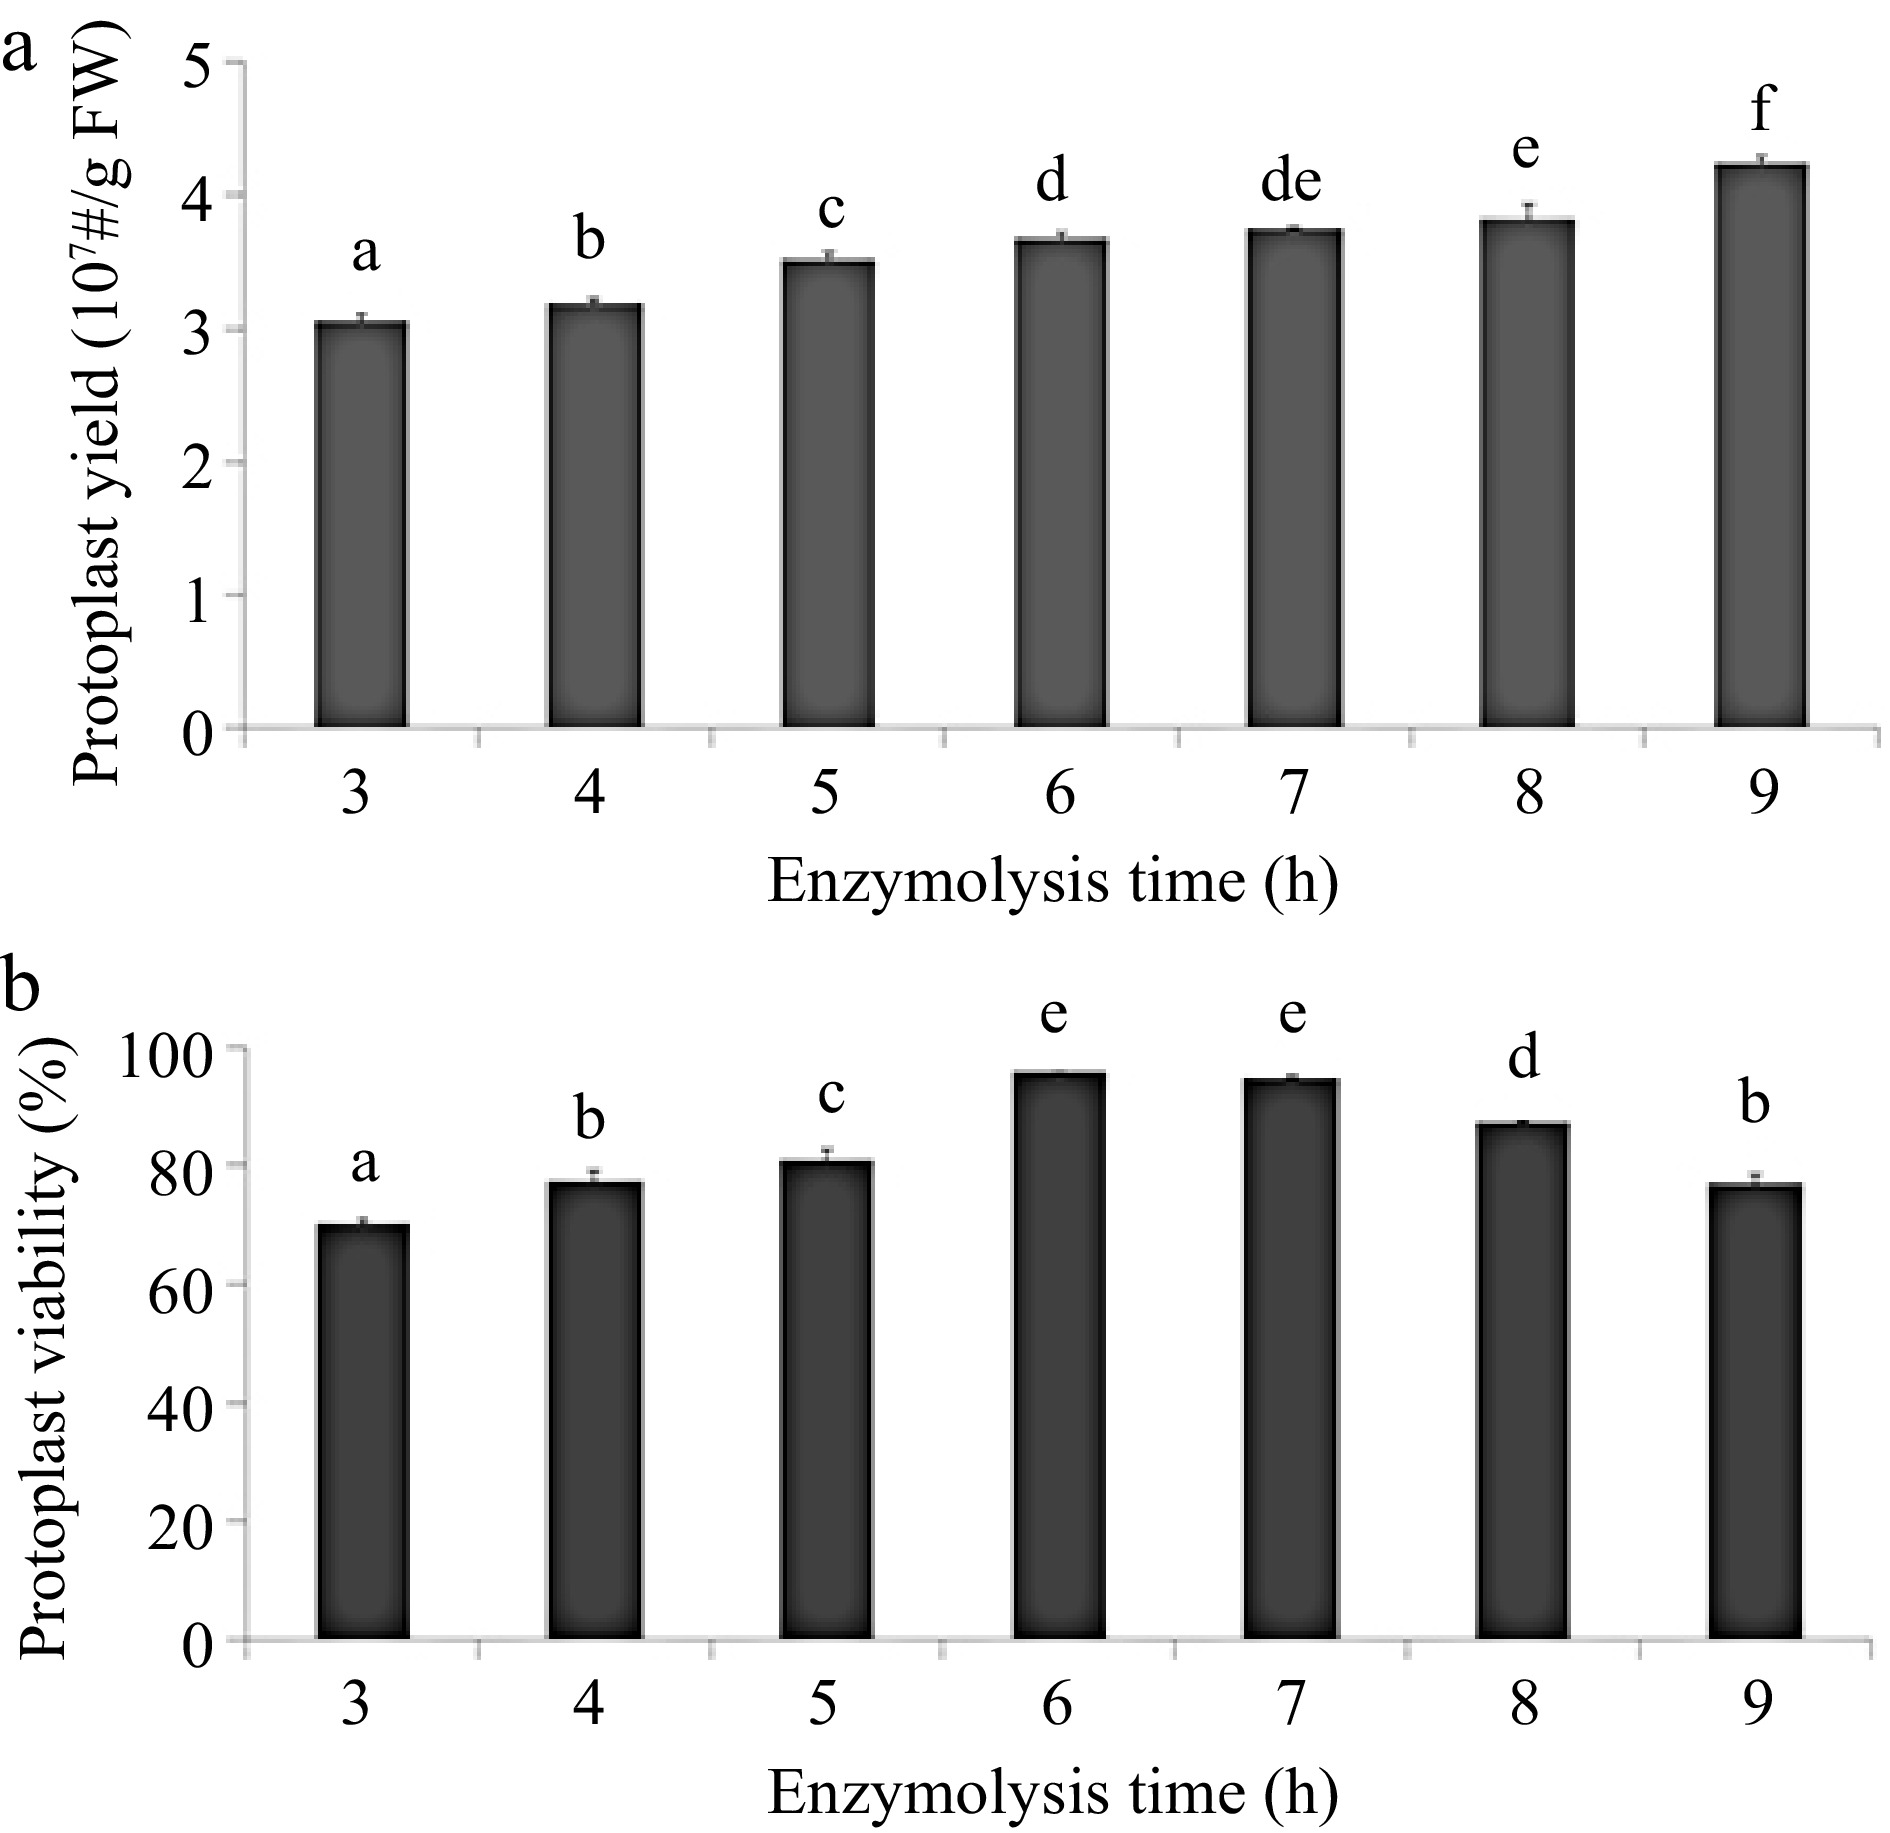
Figure 2.
Effects of digestion time on greater yam protoplast isolation. (a) Effects of digestion time on protoplast production. (b) Effects of digestion time on protoplast viability counted using the FDA staining assay. Different letters represent statistically significant difference at p ≤ 0.05 based on the Duncan test. Three biological replicates were used for each set of digestion time. The protoplast yield and viability were evaluated via cell counting under a fluorescence microscope equipped with a hemocytometer. The viability of protoplasts was measured with 0.2% fluorescein diacetate (FDA) staining and determined as follows: protoplast viability (%) = (fluorescent protoplast number in view/protoplast total number in view) × 100%.
-
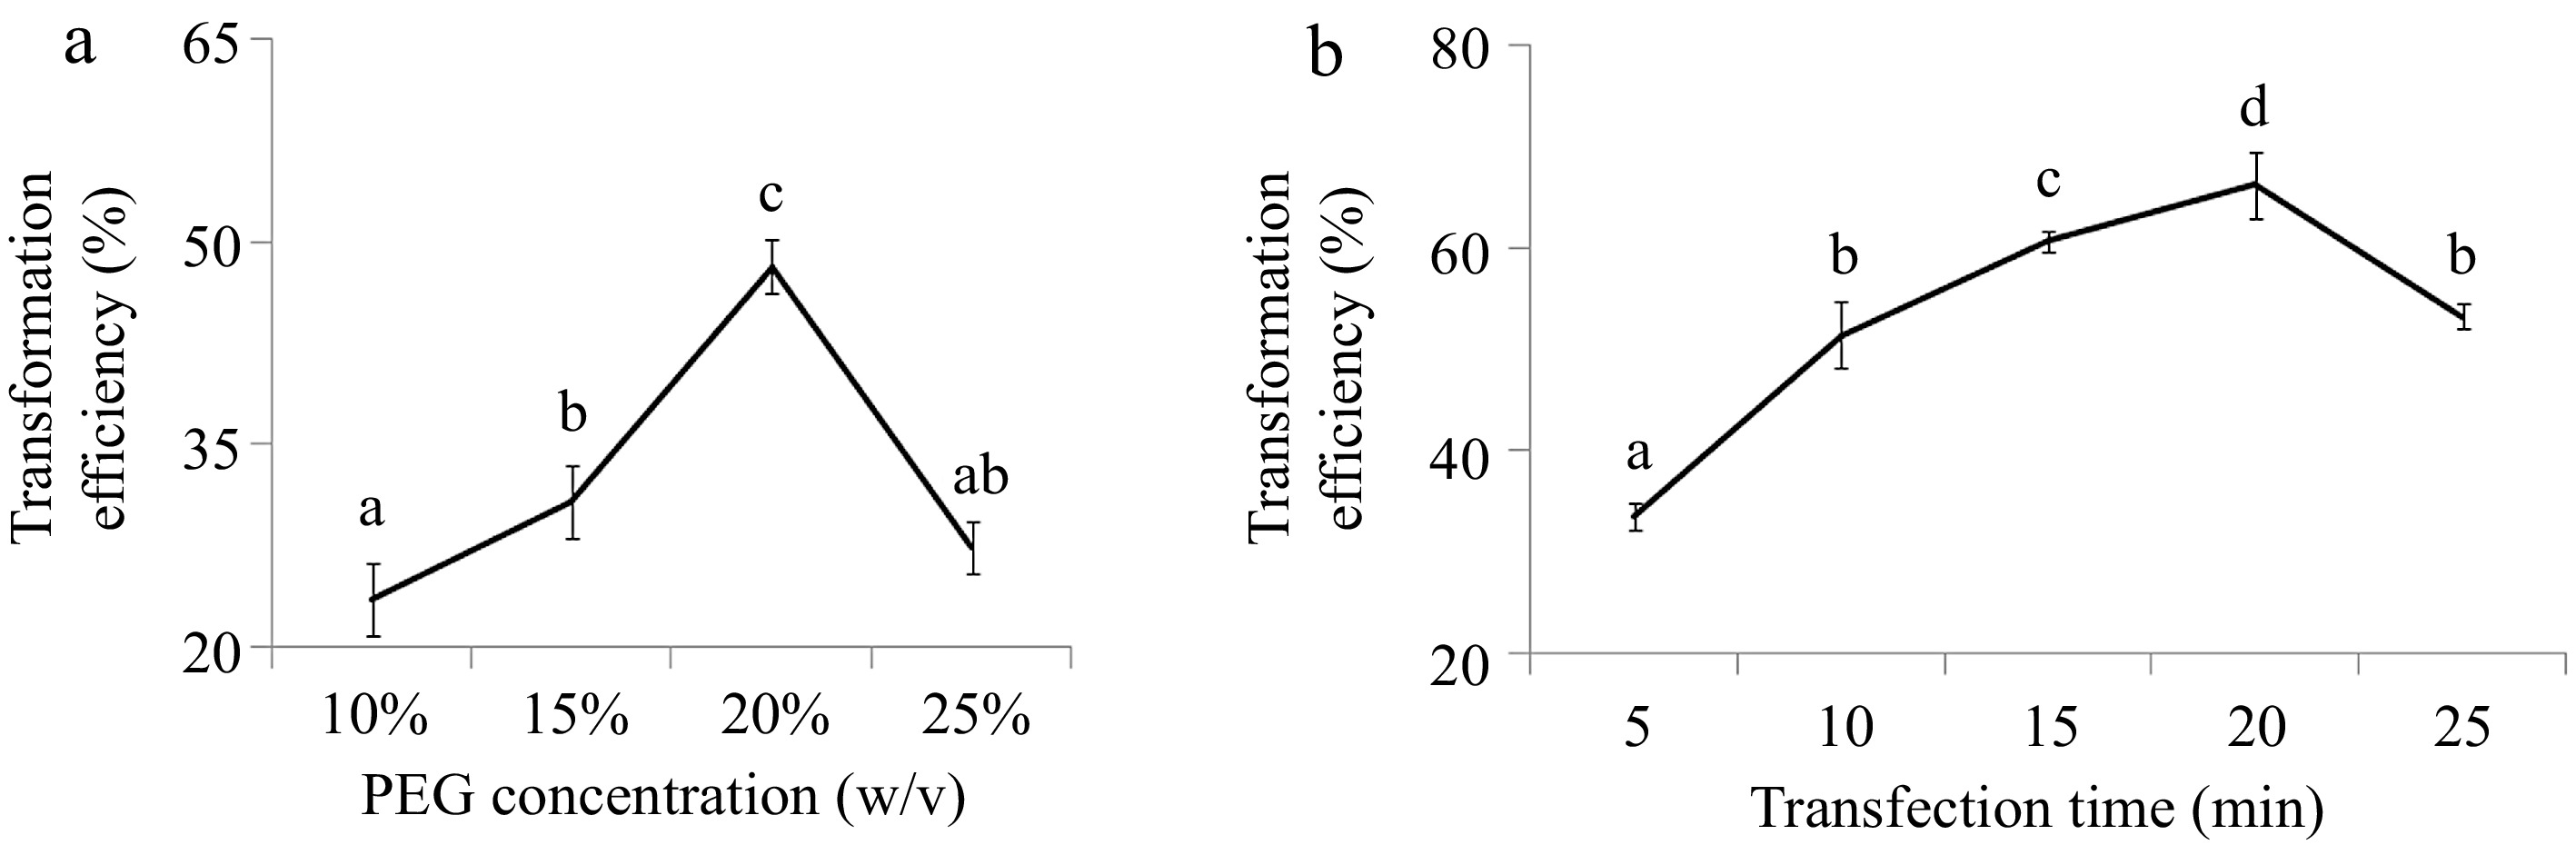
Figure 3.
Effects of PEG4000 (a) concentration and (b) transfection time on protoplast transformation efficiency in greater yam. The different letters represent significant differences (p ≤ 0.05) based on the Duncan test. Three biological replicates were used for each set of digestion time. Protoplast transformation rate (%) = (fluorescent protoplast number in view/protoplast total number in view) × 100%.
-
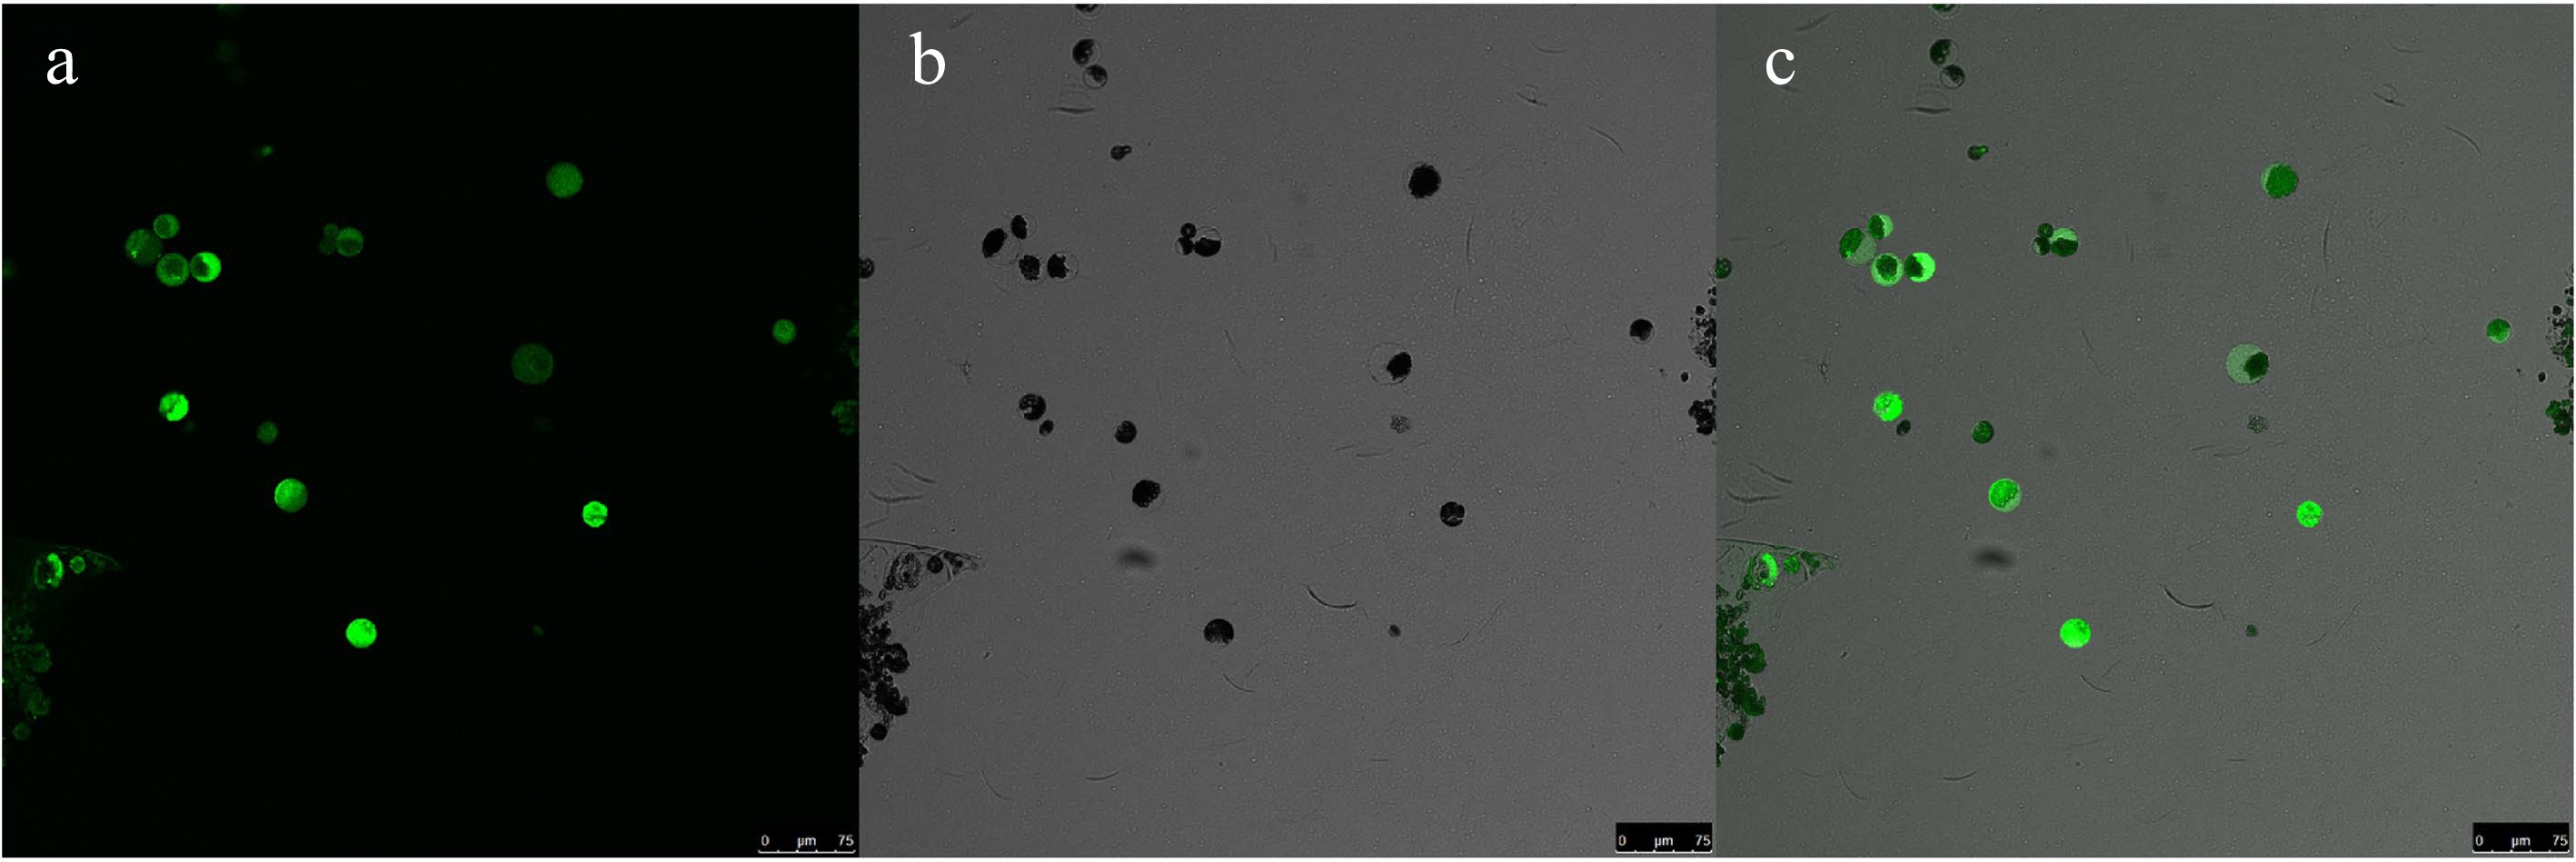
Figure 4.
Transient transformation of greater yam mesophyll protoplasts with pA7-GFP plasmid. (a) Image of GFP. (b) Bright field image of protoplasts. (c) Merged image (Scale bar = 75 μm).
-
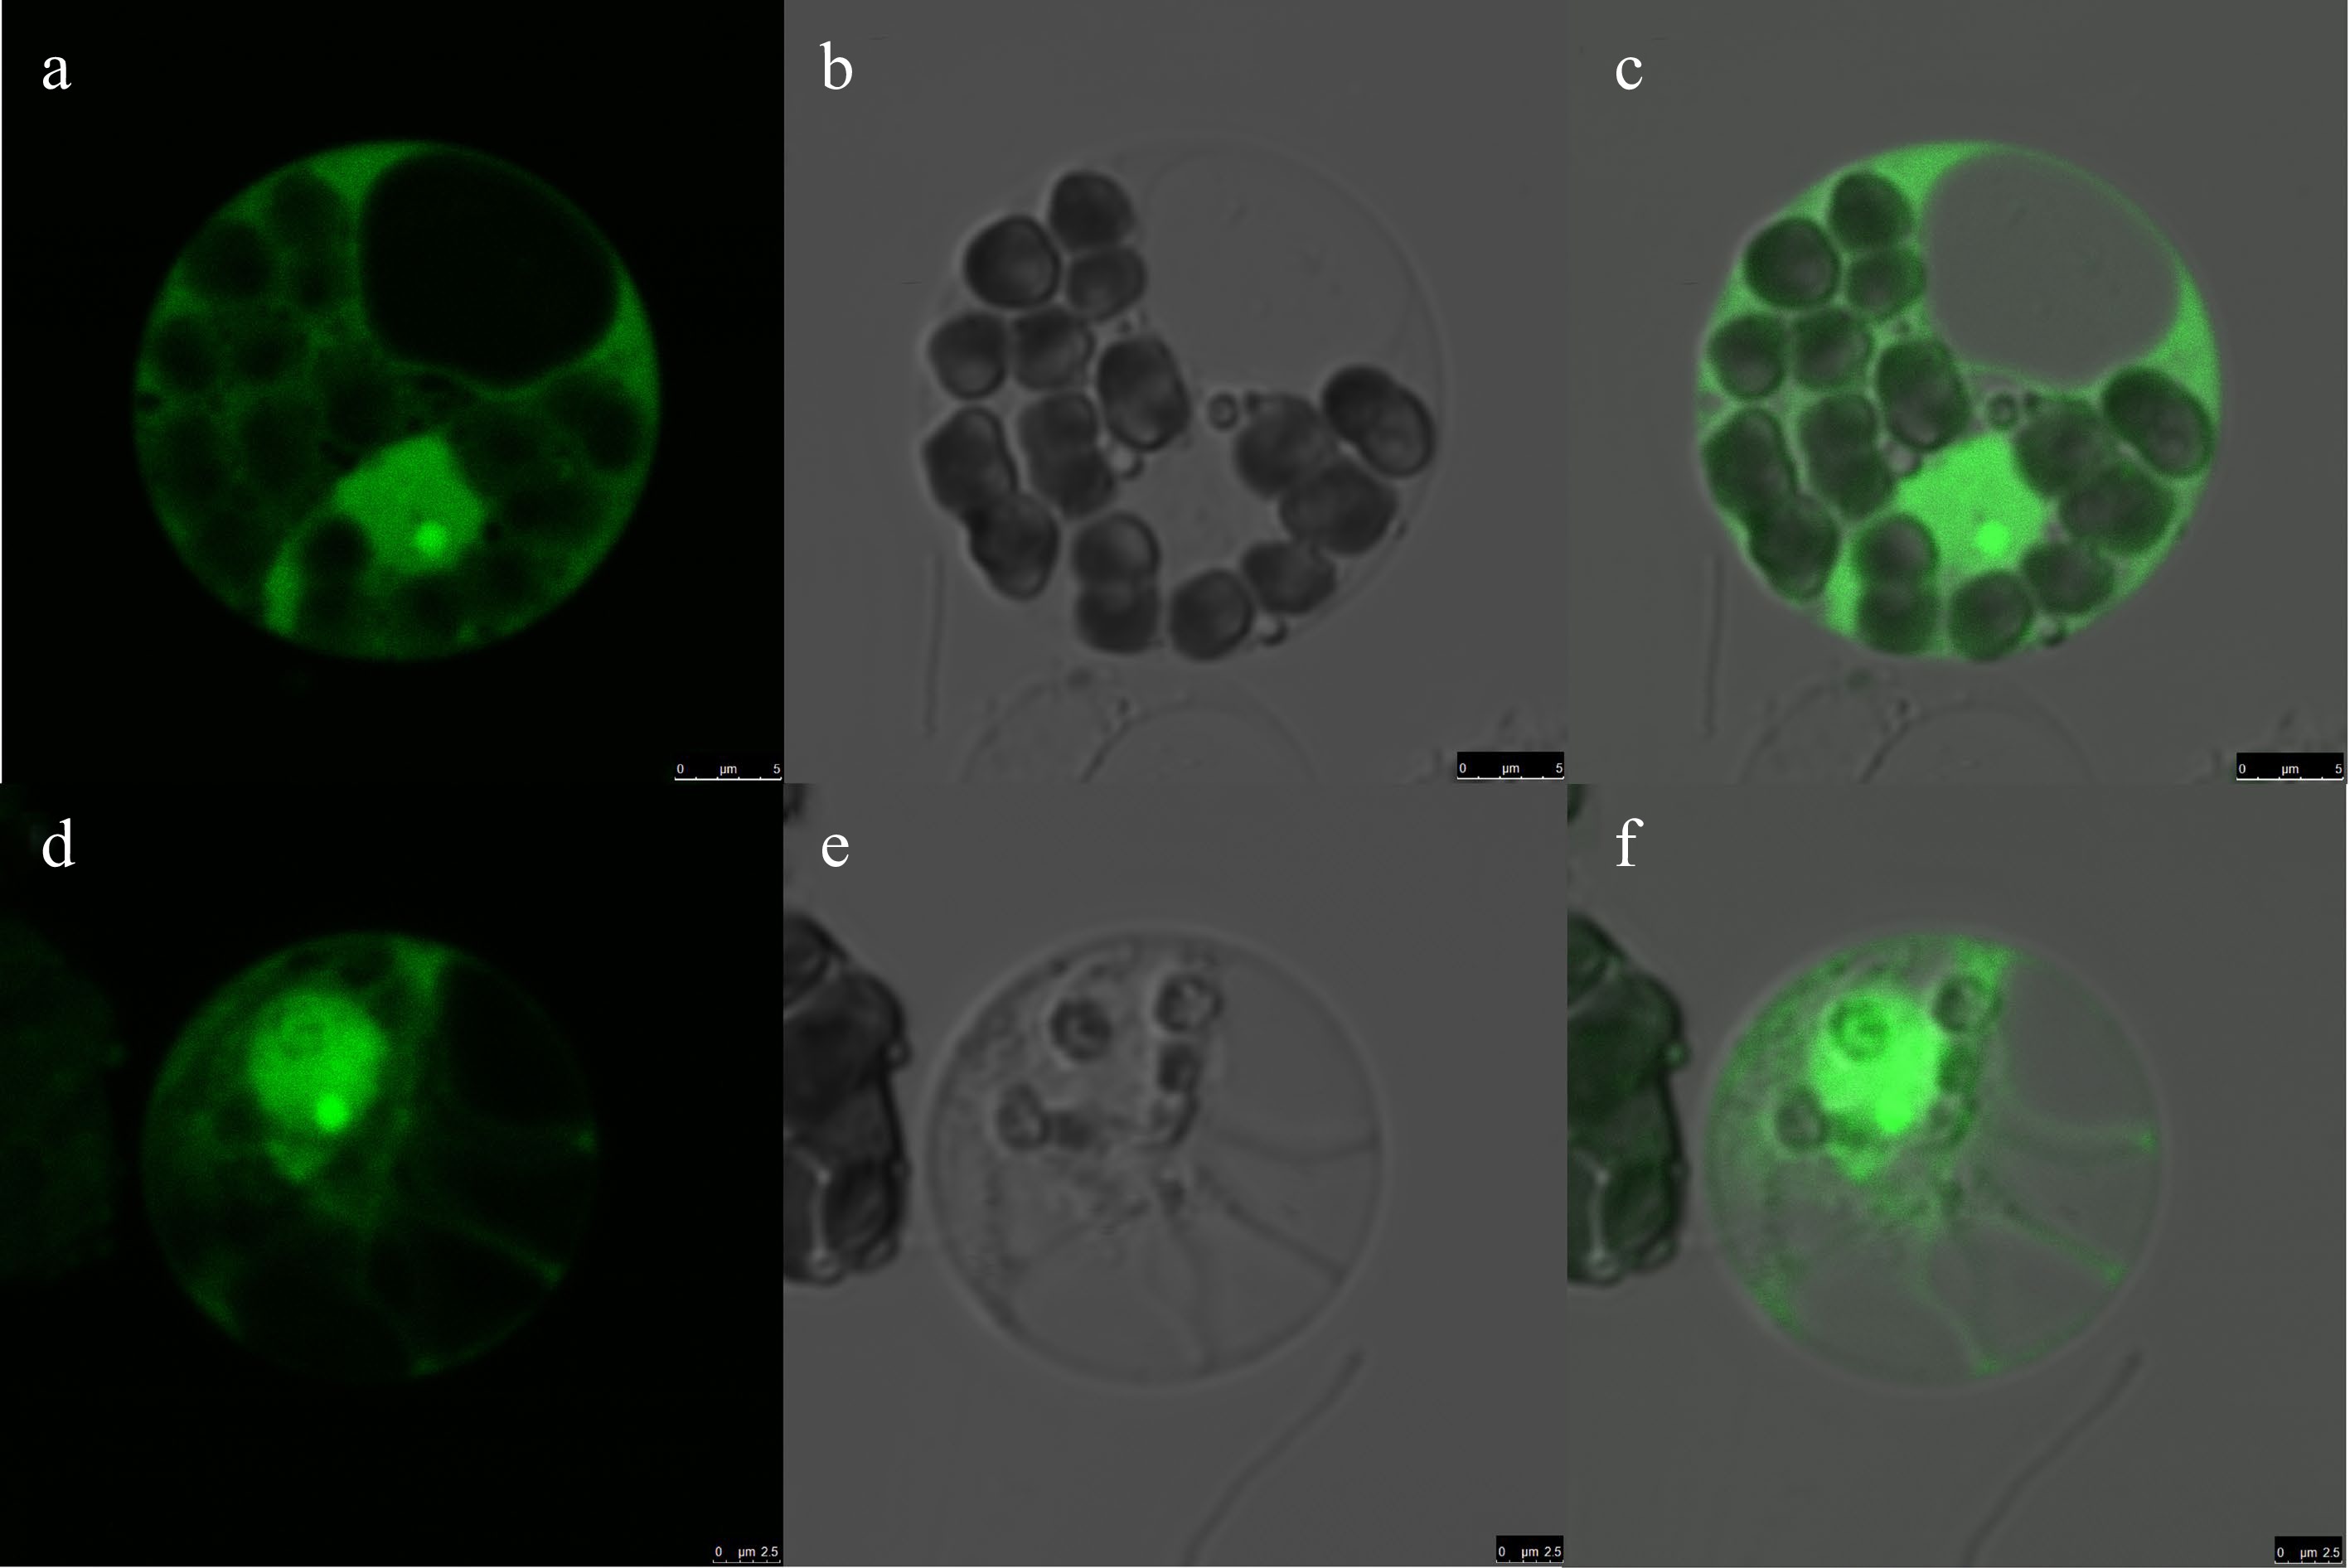
Figure 5.
Subcellular localization of DaERF1 in greater yam mesophyll protoplasts. Transient expression of GFP, showing that the GFP is distributed both in the nucleus and cytoplasm (a−c, Scale bar = 5 μm). The transient expression of GFP-fused DaERF1 protein, showing that the GFP-fused DaERF1 protein is likely localized to the nucleus (d−f, Scale bar = 2.5 μm). The laser-scanning confocal microscopy images are the (a), (d) bright field image, (b), (e) fluorescence image and (c), (f) merged image, respectively.
-
Cellulase
R-10 (W/V)Macerozyme
R-10 (W/V)Protoplast yield
(107#/g FW)Protoplast
viability (%)0.4 0.5 2.19 ± 0.01a 72.32 ± 2.02a 0.4 1 2.28 ± 0.16a 79.27 ± 1.37b 0.4 1.5 2.97 ± 0.03b 82.31 ± 2.5b 0.8 0.5 3.46 ± 0.01cd 88.91 ± 2.45c 0.8 1 3.70 ± 0.04e 92.14 ± 0.72d 0.8 1.5 3.63 ± 0.09de 86.27 ± 2.16c 1.2 0.5 3.40 ± 0.1c 81.15 ± 1.08b 1.2 1 3.30 ± 0.13c 73.35 ± 2.2a 1.2 1.5 3.00 ± 0.02b 70.21 ± 1.41a The averages of three technical replicates ± standard error of the mean are shown. FW is abbreviation for fresh weight. The different letters indicate significant differences (p ≤ 0.05) according to the Duncan test. Table 1.
Effects of enzyme combination on the yield and viability of protoplasts isolated from leaves of greater yam.
Figures
(5)
Tables
(1)