-
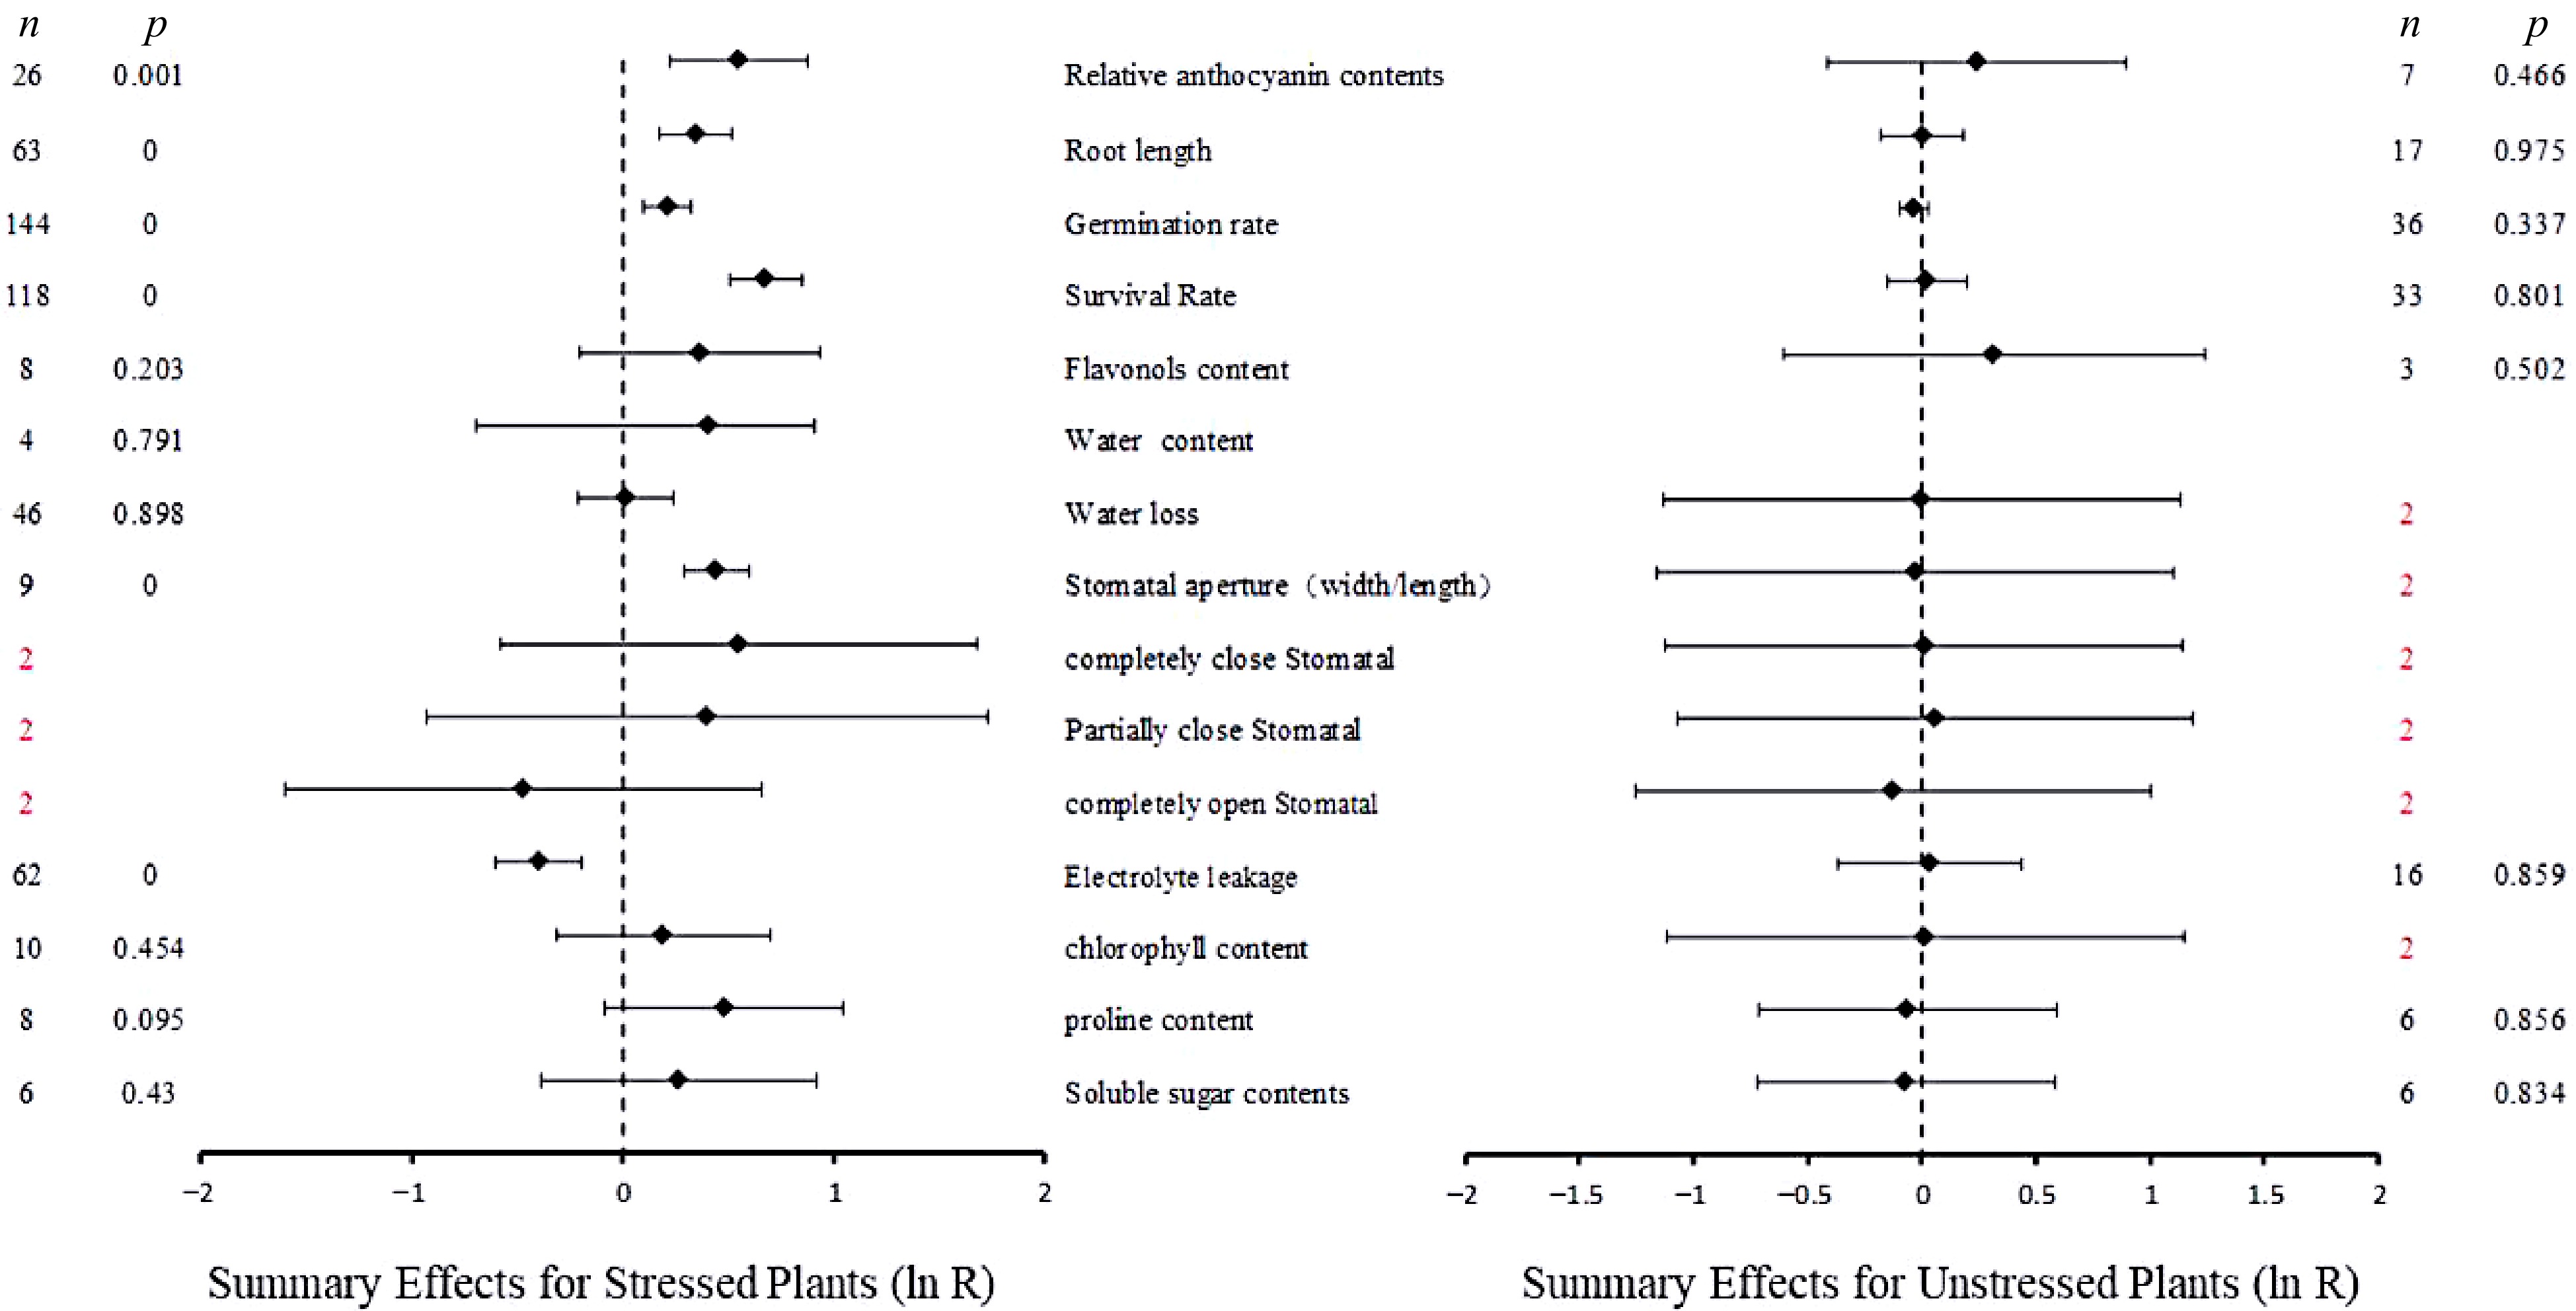
Figure 1.
Summary effect sizes (ln ratio of the response in UGT overexpressing plants/ WT plants; ln R). Horizontal bars associated with summary effects represent the 95% confidence intervals. n is the number of studies contributing to each summary effect. p-values ≤ 0.05 were taken as significant.
-
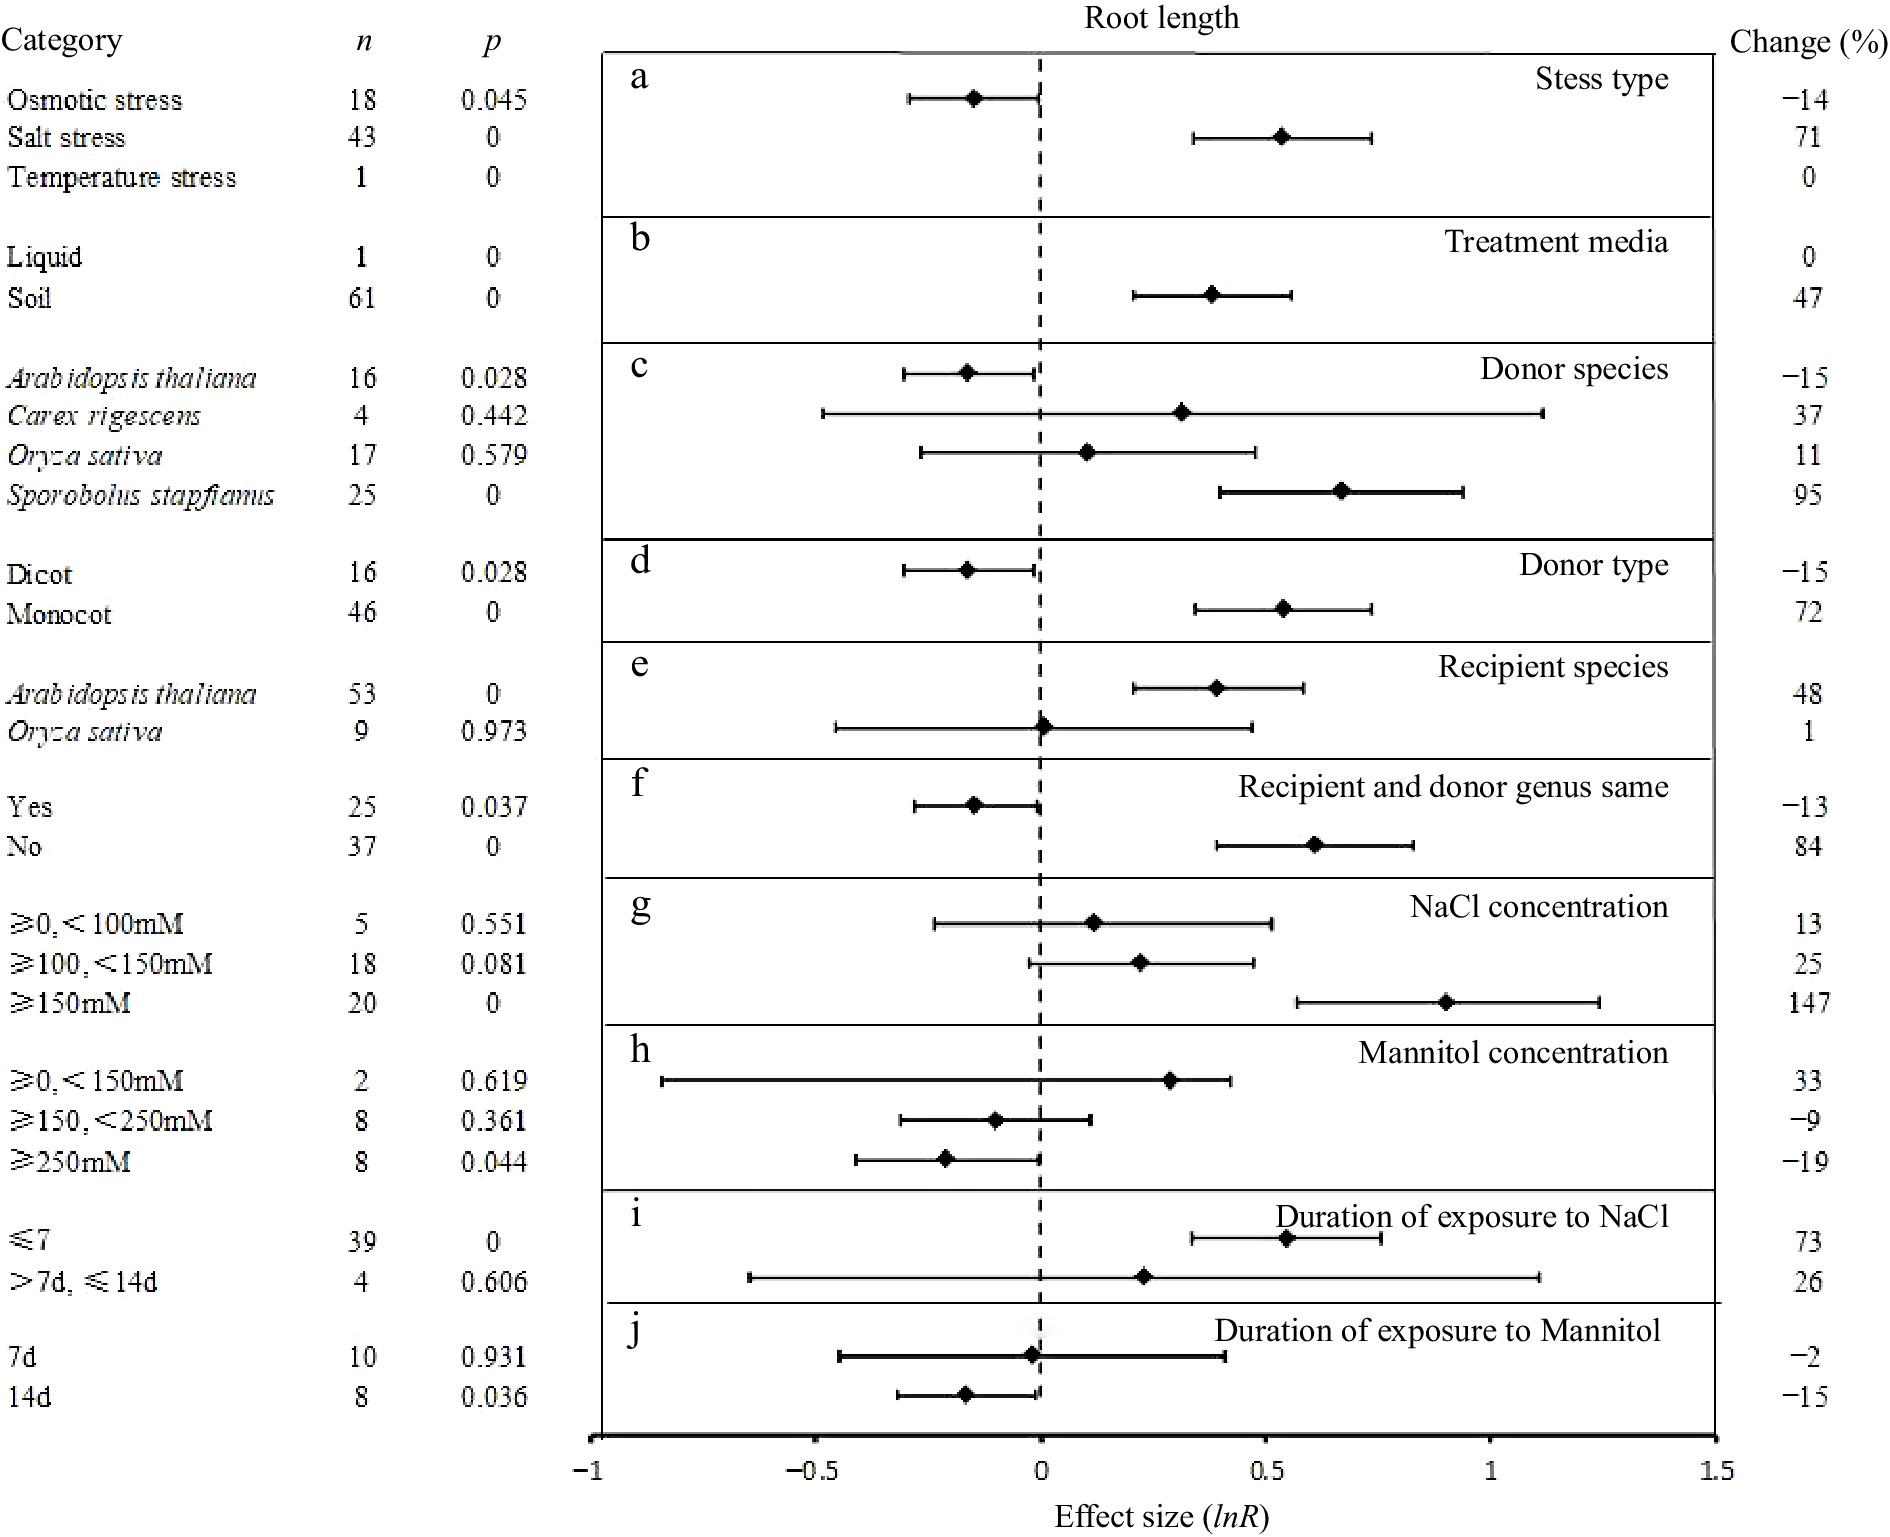
Figure 2.
The effect sizes of UGT overexpression on root length under different experimental conditions of abiotic stress. The horizontal error bars represent the 95% confidence interval. .
-
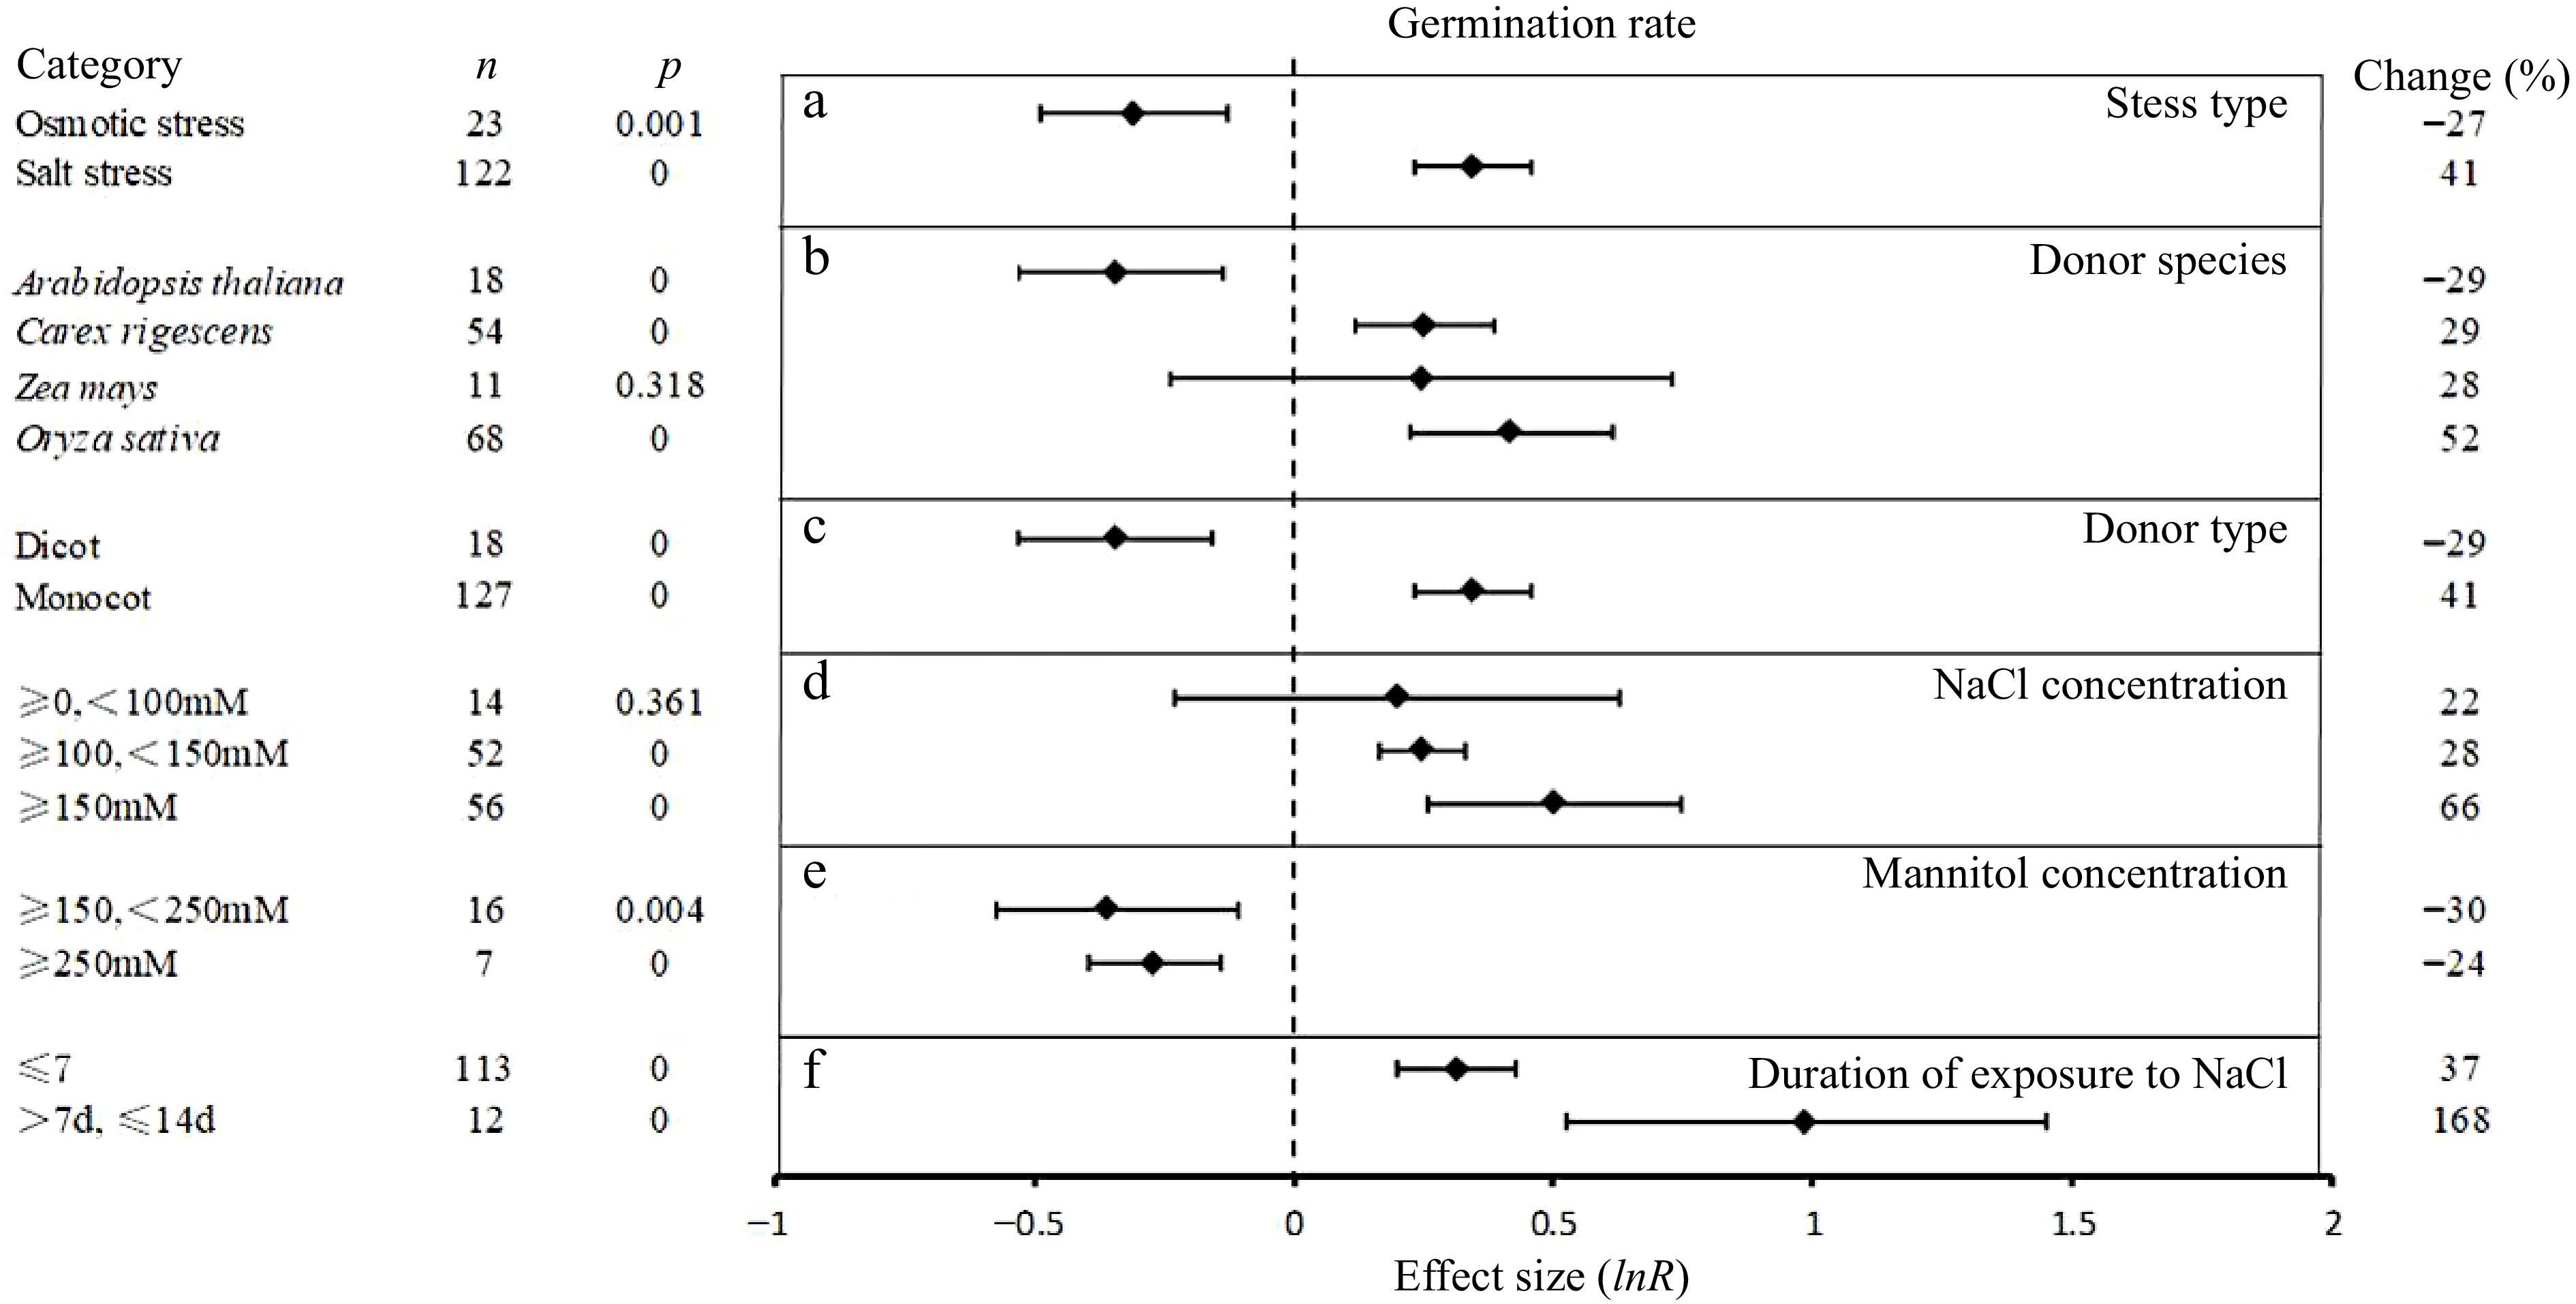
Figure 3.
The effect sizes of UGT overexpression on germination rate under different experimental conditions of abiotic stress. The horizontal error bars represent the 95% confidence interval.
-
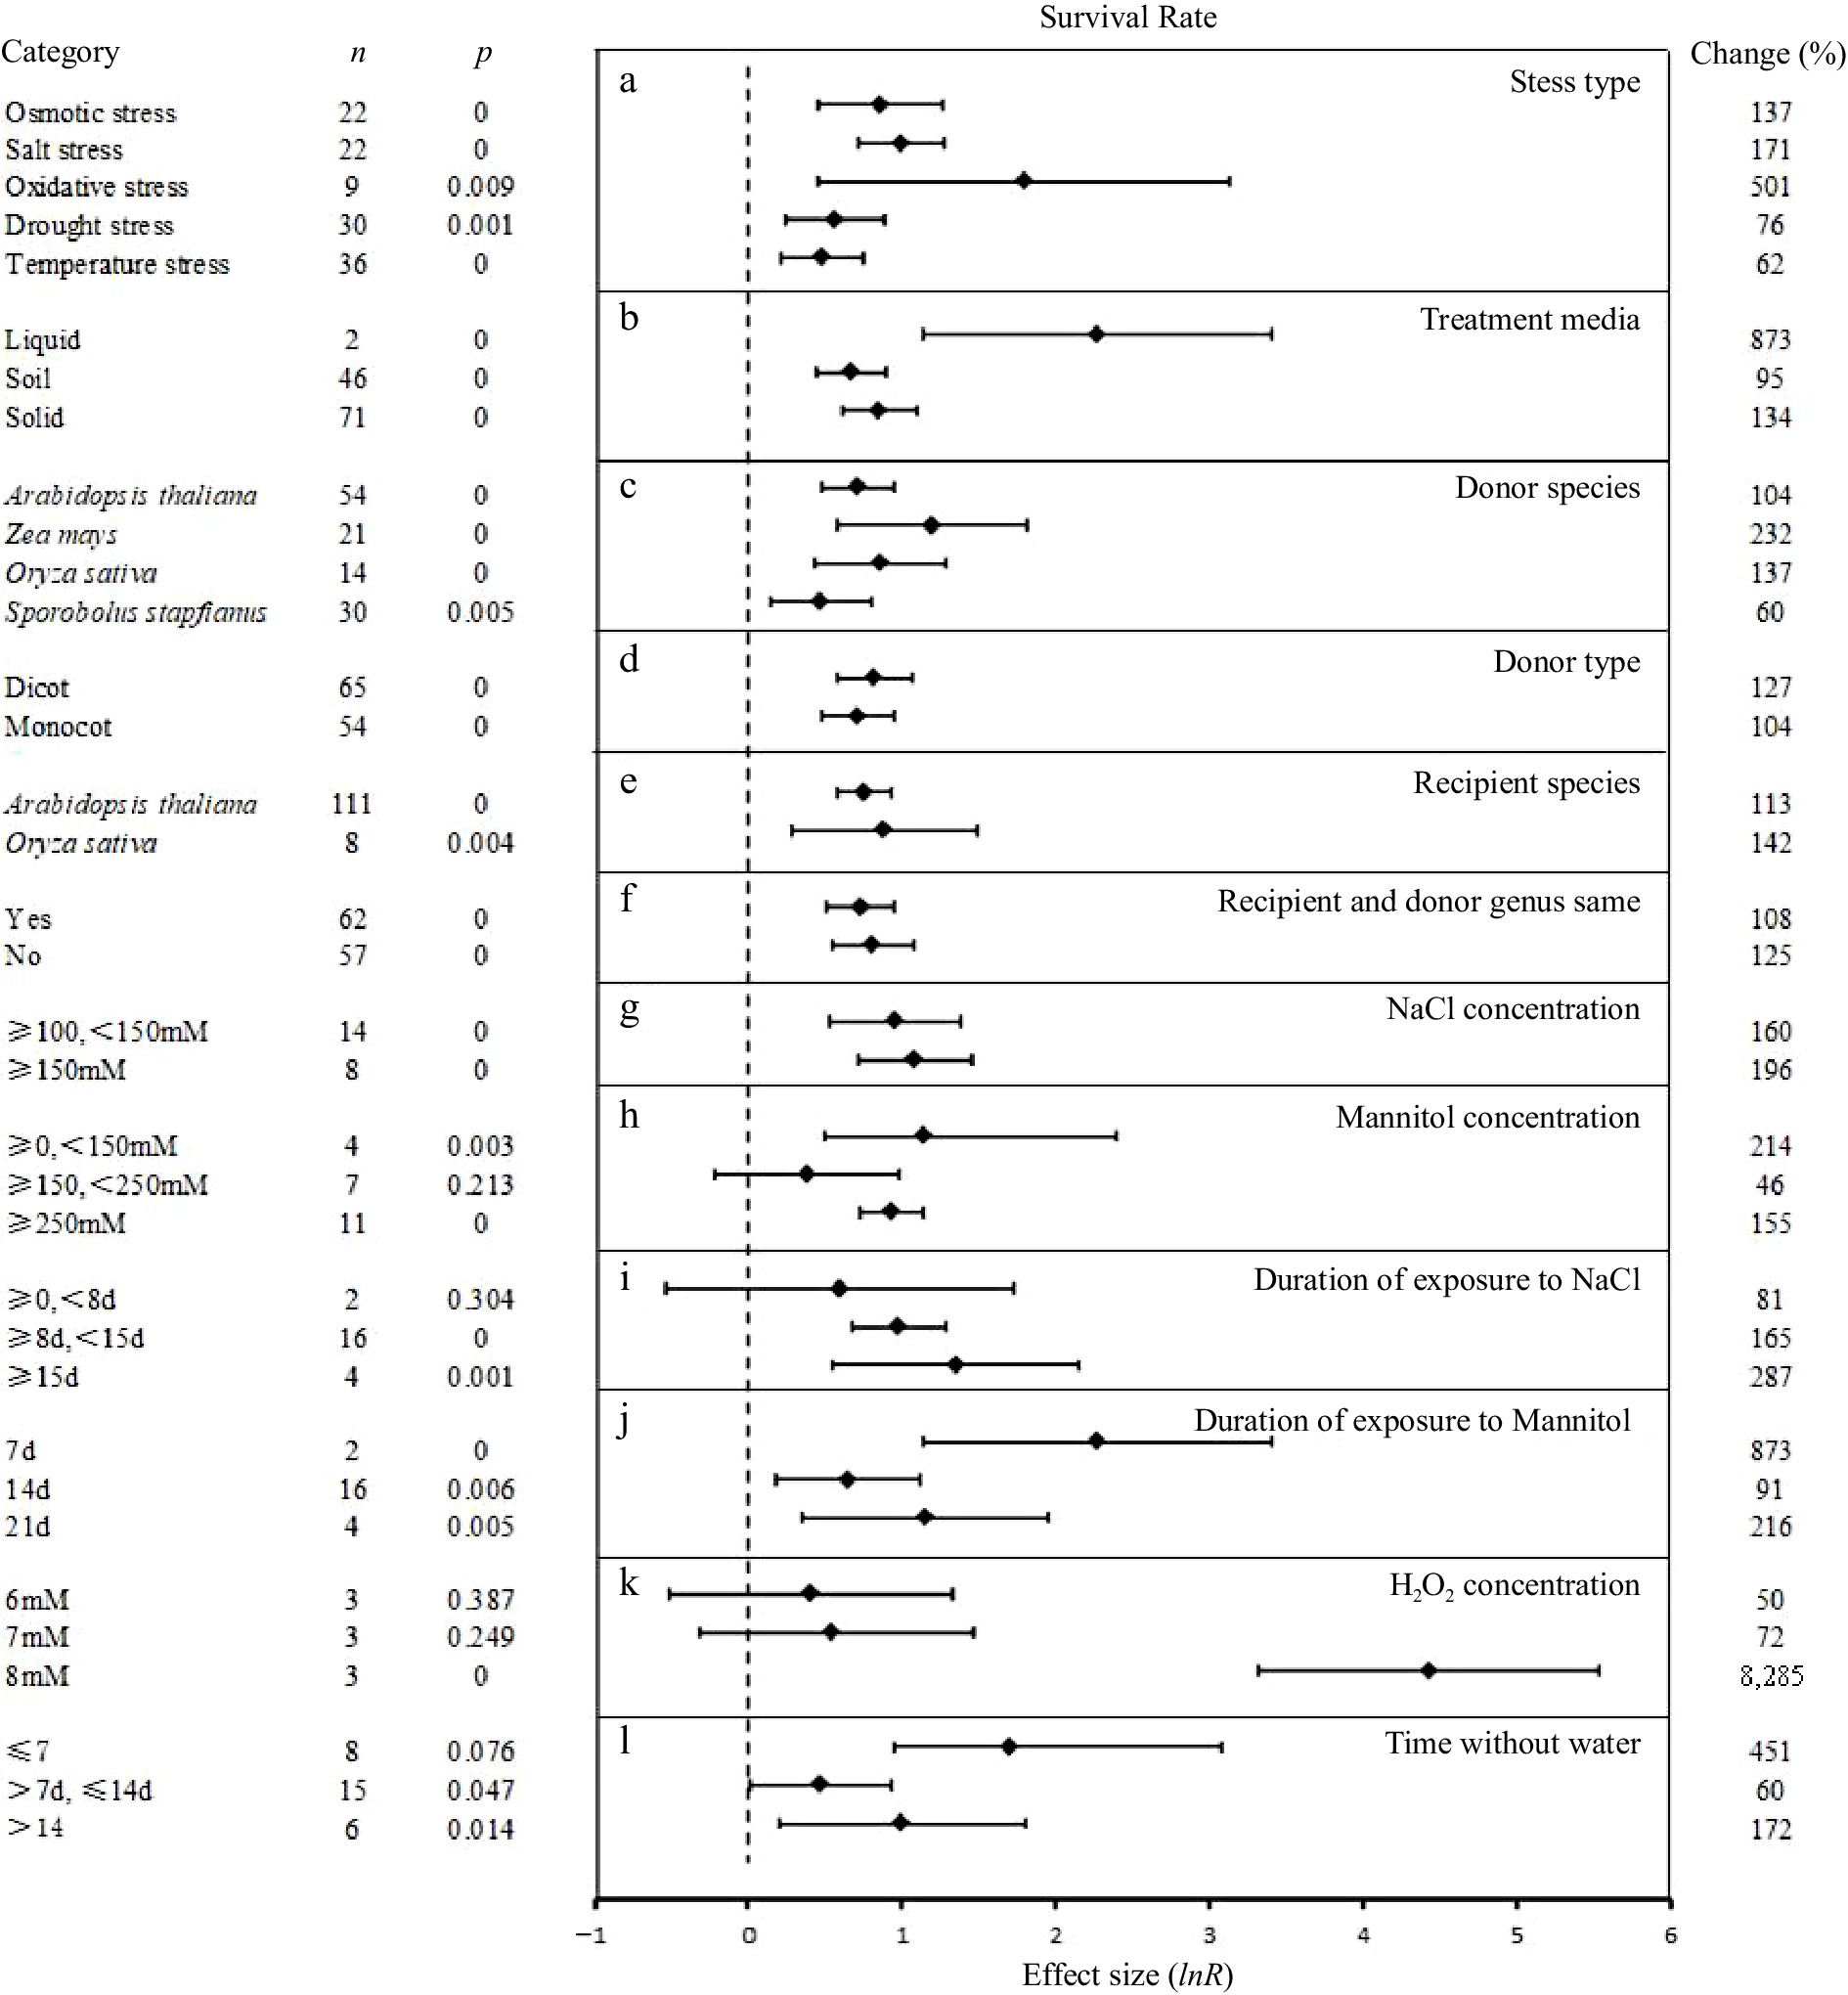
Figure 4.
The effect sizes of UGT overexpression on survival rate under different experimental conditions of abiotic stress. The horizontal error bars represent the 95% confidence interval..
-
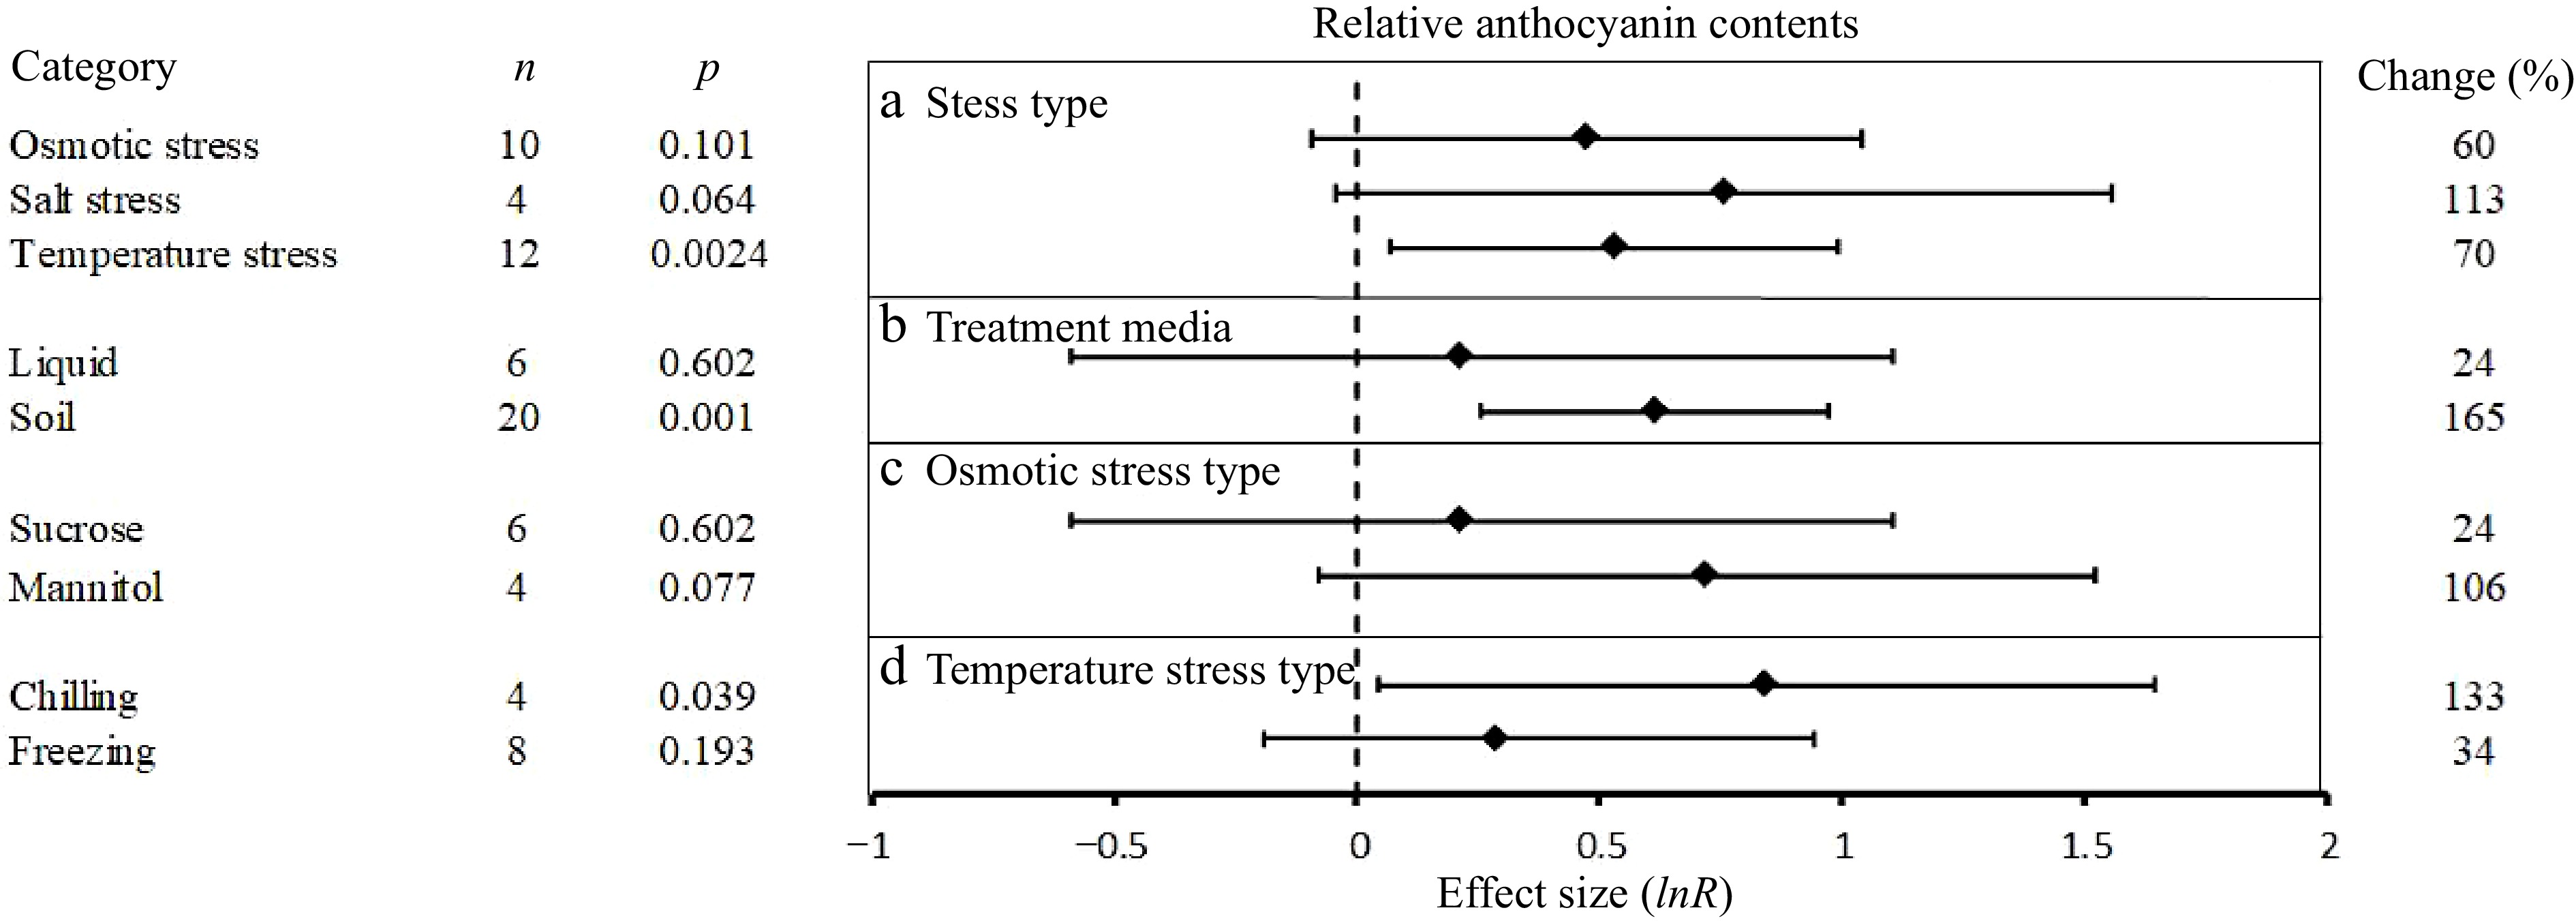
Figure 5.
The effect sizes of UGT overexpression on relative anthocyanin contents under different experimental conditions of abiotic stress. The horizontal error bars represent the 95% confidence interval.
-
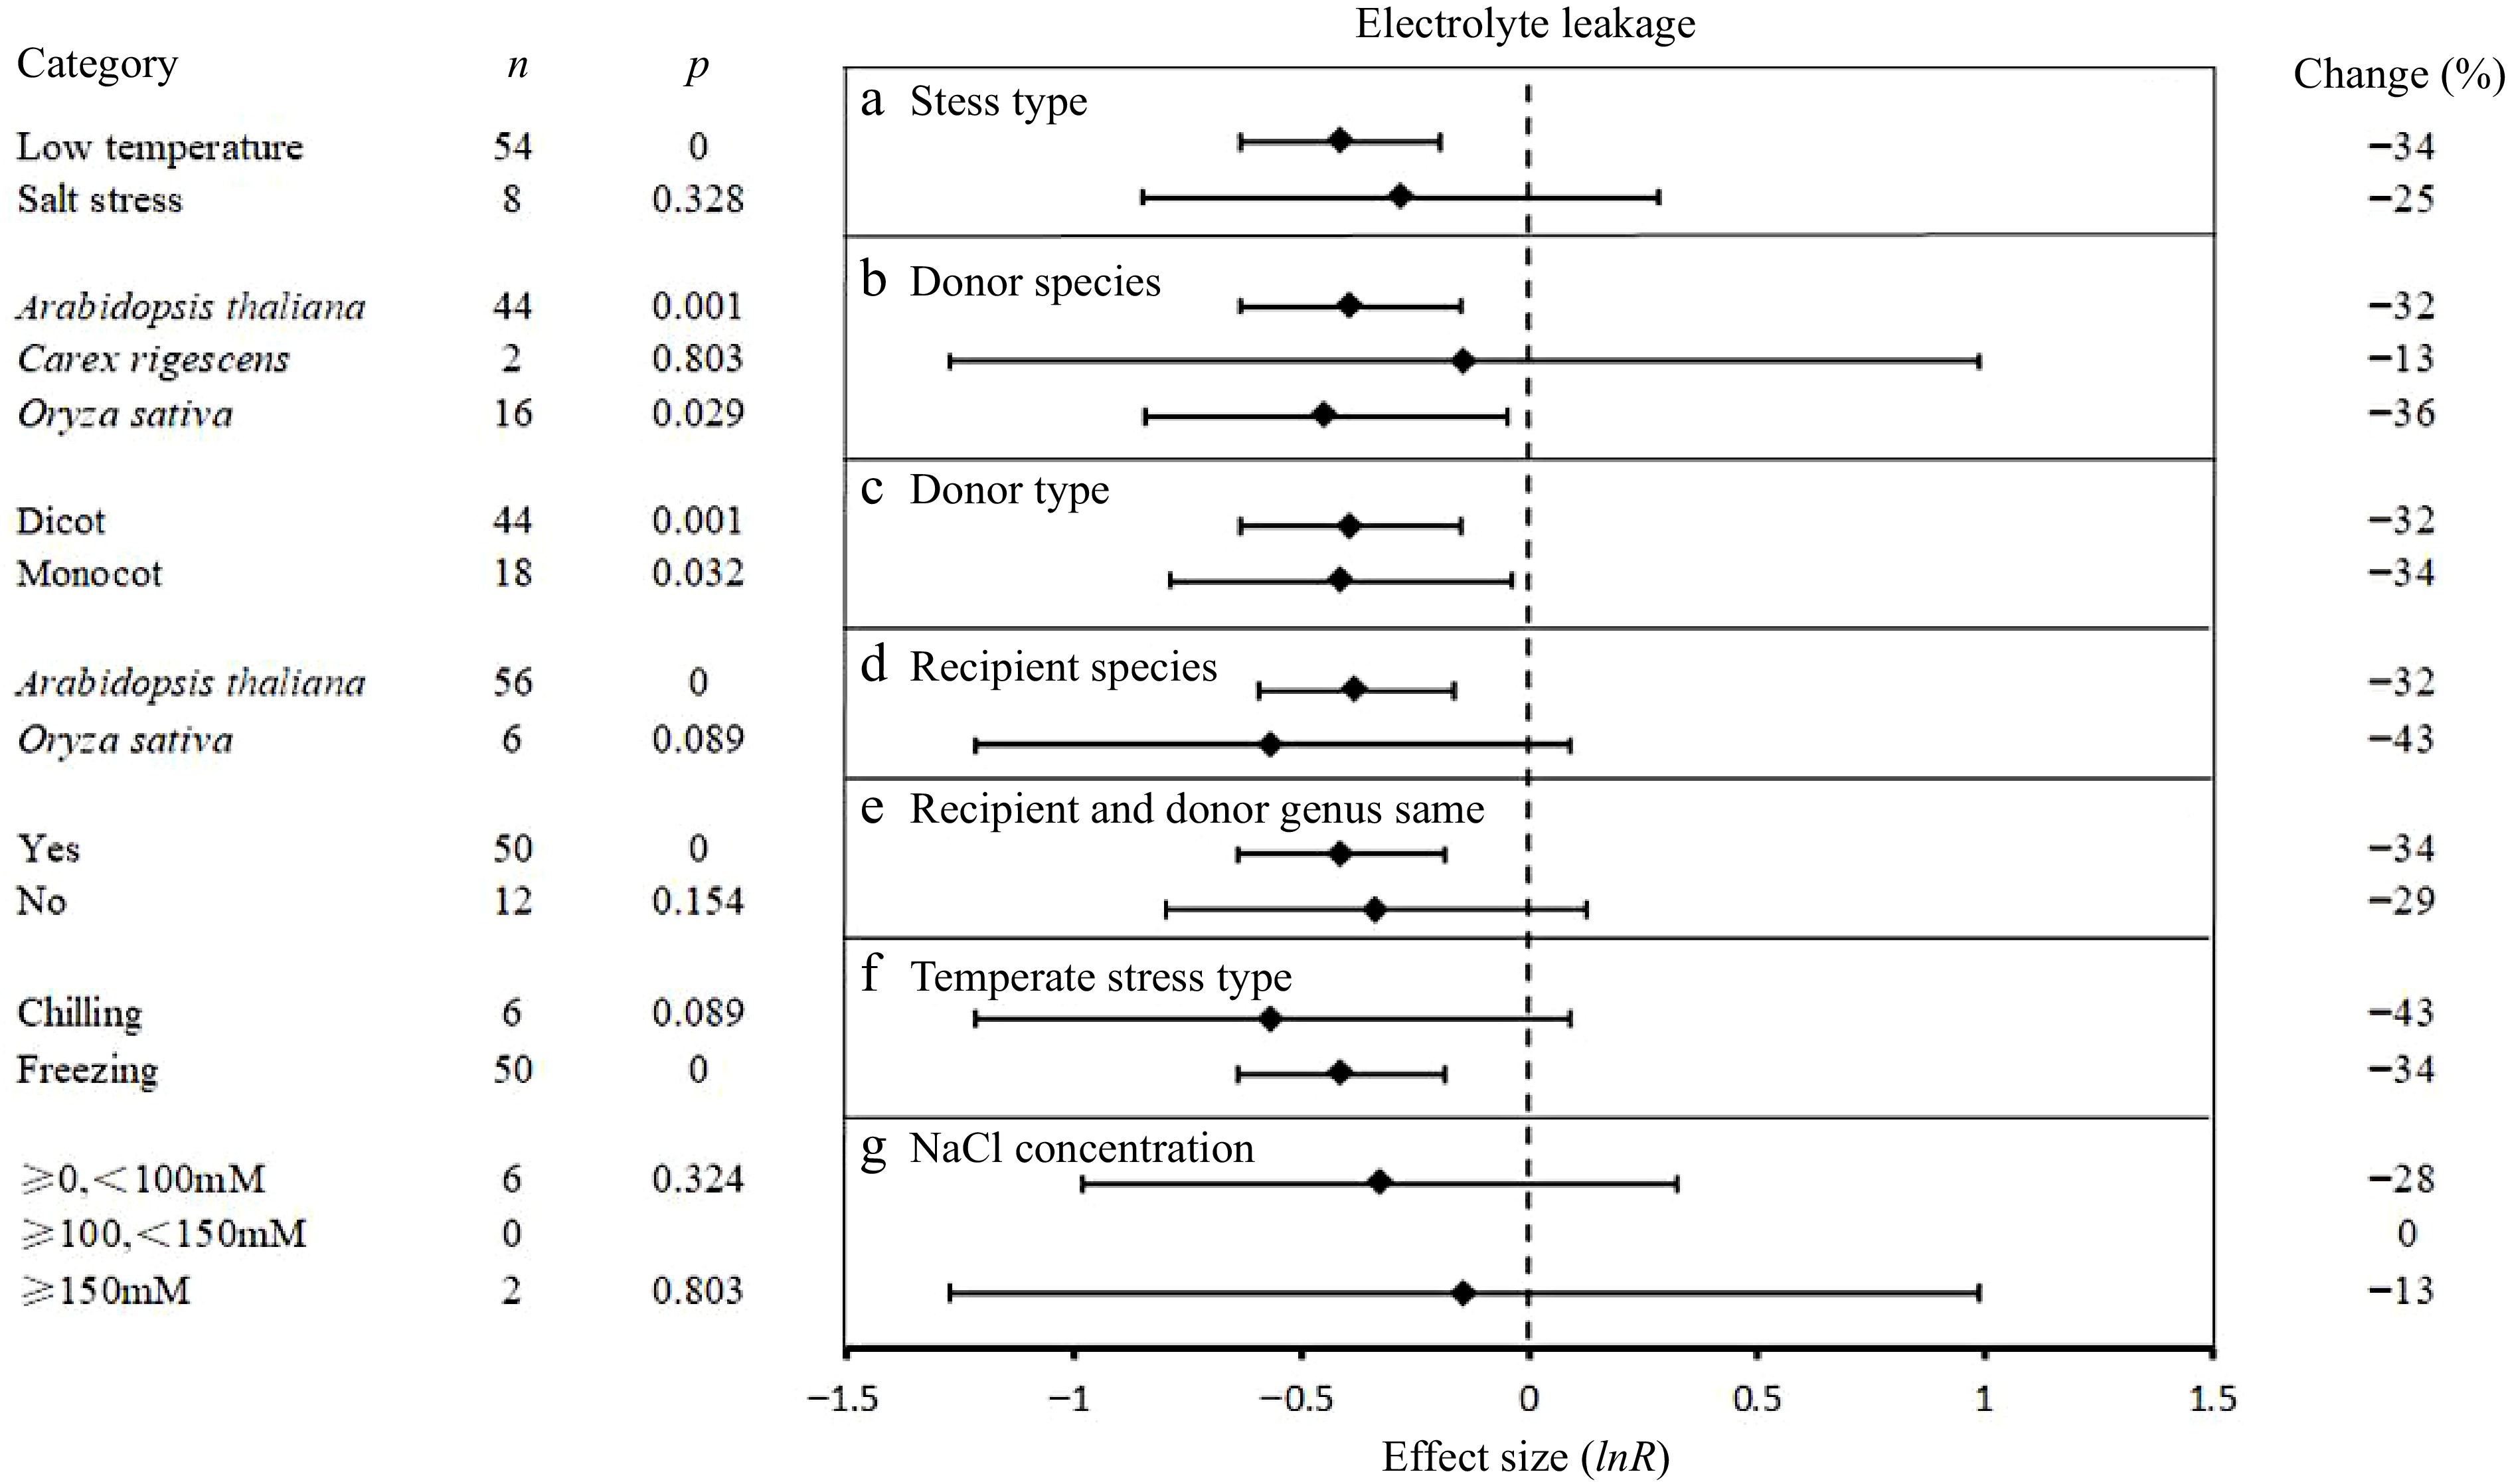
Figure 6.
The effect sizes of UGT overexpression on electrolyte leakage under different experimental conditions of abiotic stress. The horizontal error bars represent the 95% confidence interval.
-
Indicator effect size Summary Eeffecta Funnelb Kendallc Egger'sd Duval & Tweediee N LnR p plot tau p β p Adjusted #trim Relative anthocyanin contents 33 0.487 0.001 YES 0.39 0.00 −2.59 0.00 0.487 5 Root length 80 0.269 0 NO 0.02 0.77 0.64 0.00 −0.072 31 Germination rate 181 0.158 0 NO 0.12 0.03 −0.03 0.96 0.184 0 Survival rate 151 0.535 0 NO 0.04 0.49 0.46 0.00 0.255 37 Flavonols content 11 0.353 0.151 YES −0.15 0.59 −299.13 0.43 0.336 1 Water content 4 0.408 0.791 NO −0.60 0.50 −320.03 0.22 0.108 0 Water loss 48 0.014 0.9 NO −0.38 0.00 −6.71 0.00 0.014 0 Stomatal aperture 11 0.435 0 YES −0.36 0.14 −0.62 0.01 0.436 0 completely closed Stomatal 4 0.280 0.492 YES −0.50 0.31 −1277.39 0.05 0.280 0 Partially closed Stomatal 4 0.229 0.575 YES −0.50 0.50 −1851.04 0.04 0.229 0 completely open Stomatal 4 0.408 0.467 NO −0.17 1.00 −513.78 0.60 −0.392 1 Electrolyte leakage 78 −0.31 0.001 NO −0.01 0.87 −274.24 0.55 −0.413 18 chlorophyll content 12 0.164 0.488 NO −0.14 0.58 −382.07 0.14 0.164 0 Proline content 14 0.25 0.253 NO −0.01 1.00 −151.85 0.79 0.250 0 Soluble sugar contents 12 0.097 0.682 NO −0.17 0.49 −707.59 0.03 0.097 0 a Summary effect: N = number of studies, ln R = natural log of the overall summary effect, p = probability that the summary effect ≠ 0; b Funnel plot appears asymmetrical; c Begg and Mazumdar Kendall rank correlation: tau = rank correlation coefficient (with continuity correction), two-tailed p = probability that the study effect sizes are correlated with their sampling variances; d Egger's linear regression: β = intercept of the regression line, p = probability of significant asymmetry in the study effect size/study size association. The regression runs through zero if the funnel plot is symmetrical. The size of the deviation of the intercept from the origin is a measure of asymmetry, with a two-tailed p < 0.05 indicating significant asymmetry. e Duval and Tweedie trim and fill: adjusted summary effect after imputing missing studies using an iterative trim and fill procedure, #trim = number of studies imputed in the trim and fill exercise. Table 1.
Measures used in characterizing publication bias for each effect size.
-
Category Qta Pheterob I2c Change (%) Relative anthocyanin contents (S) 2.07 1 0 73 Root length (S) 112.47 0 45.763 44 Germination rate (S) 2303.961 0 93.747 23 Survival rate (S) 190.658 0 38.109 115 Flavonols content (S) 0.471 1 0 44 Water content (S) 0.07 0.995 0 50 Water loss (S) 11.917 1 0 2 Stomatal aperture (width/length) (S) 2.743 0.949 0 56 Completely closed stomatal (%) (S) 0.3 0.584 0 73 Partially closed stomatal (%) (S) 1.389 0.239 27.982 49 Completely open stomatal (%) (S) 0.498 0.48 0 −37 Electrolyte leakage (%) (S) 4.731 1 0 −33 Chlorophyll content (S) 0.291 1 0 21 Proline content (ug·g−1·FW) (S) 0.365 1 0 62 Soluble sugar contents (ug·g−1·FW) (S) 0.126 1 0 30 Relative anthocyanin contents (N) 0.662 0.995 0 28 Root length (N) 0.96 1 0 −1 Germination rate (N) 58.821 0.005 42.197 −4 Survival rate (N) 0 1 0 0 Flavonols content (N) 0.161 0.923 0 37 Water content (N) 0 Water loss (N) 0 1 0 0 Stomatal aperture (width/length) (N) 0 0.994 0 −3 Completely closed stomatal (N) 0.017 0.897 0 1 Partially closed stomatal (N) 0.02 0.887 0 6 Completely open stomatal (N) 0.039 0.844 0 −12 Electrolyte leakage (N) 0.684 1 0 4 Chlorophyll content (N) 0.003 0.957 0 2 Proline content (N) 0.088 1 0 −6 Soluble sugar contents (N) 0.062 1 0 −7 a Qt, total observed variation among studies; b phetro, probability that Qt was due entirely to sampling error and not to real variation among studies; c I2, percentage of heterogeneity due to variation among true effects. Positive values indicating UGT overexpression promotion and negative values indicating UGT overexpression inhibition. (S) represents the heterogeneity of stressed plant; (N) represents the heterogeneity of non-stressed plant. Table 2.
Heterogeneity statistics for the 30 summary effect sizes under overexpressing UGT genes.
Figures
(6)
Tables
(2)