-
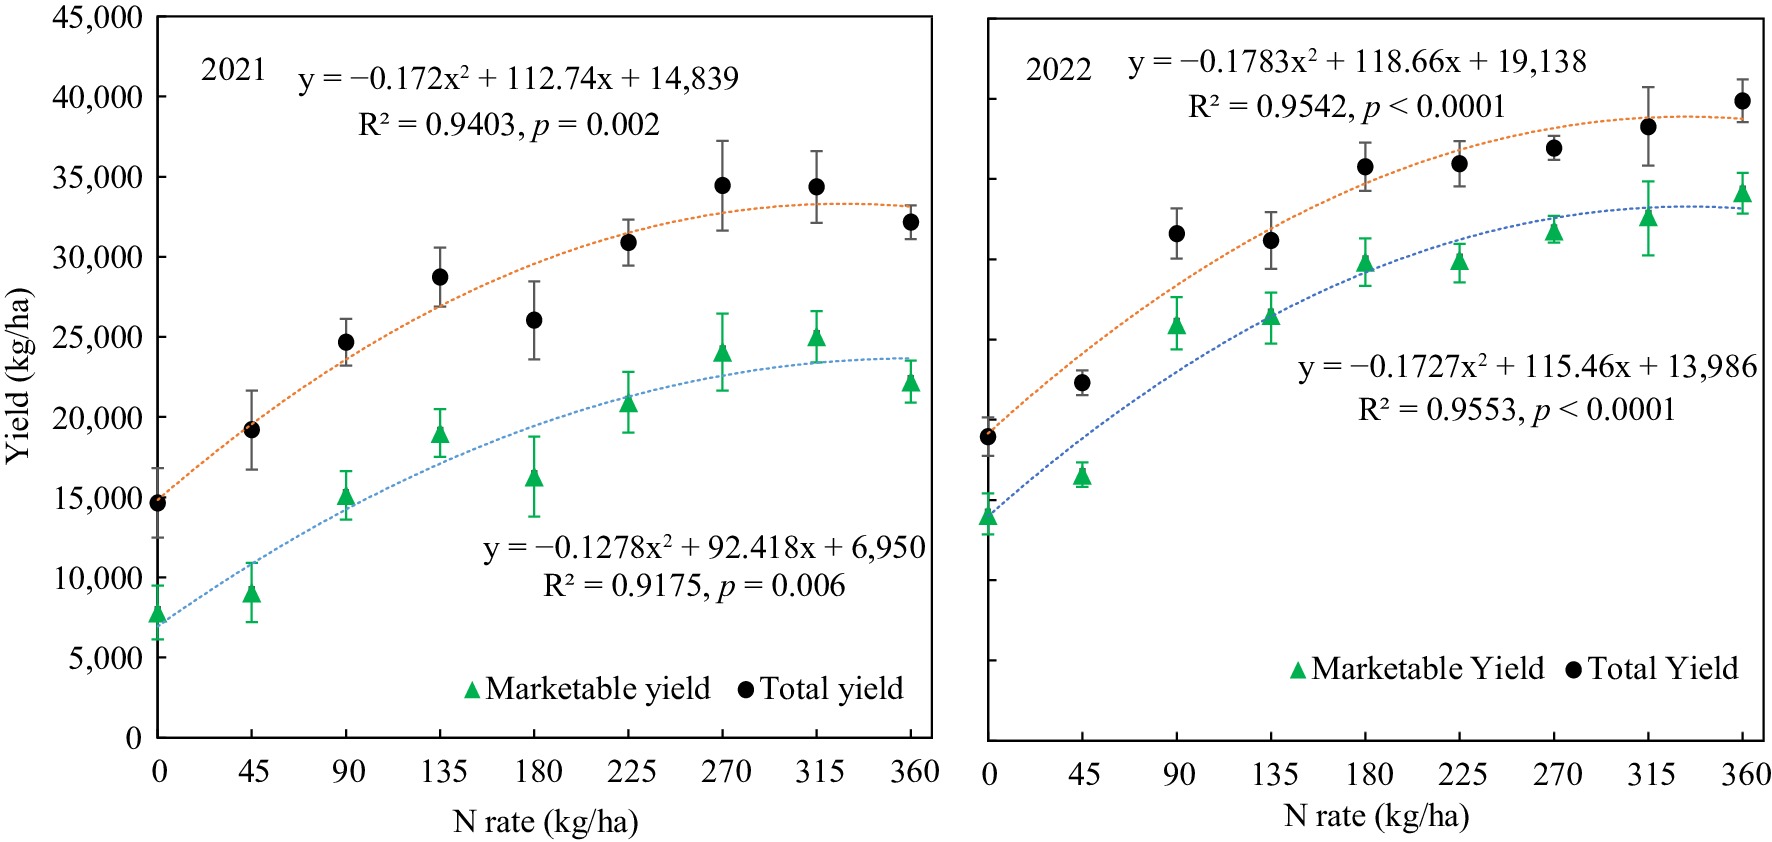
Figure 1.
Potato marketable tuber yield and total tuber yield response to nitrogen fertilizer application rate.
-
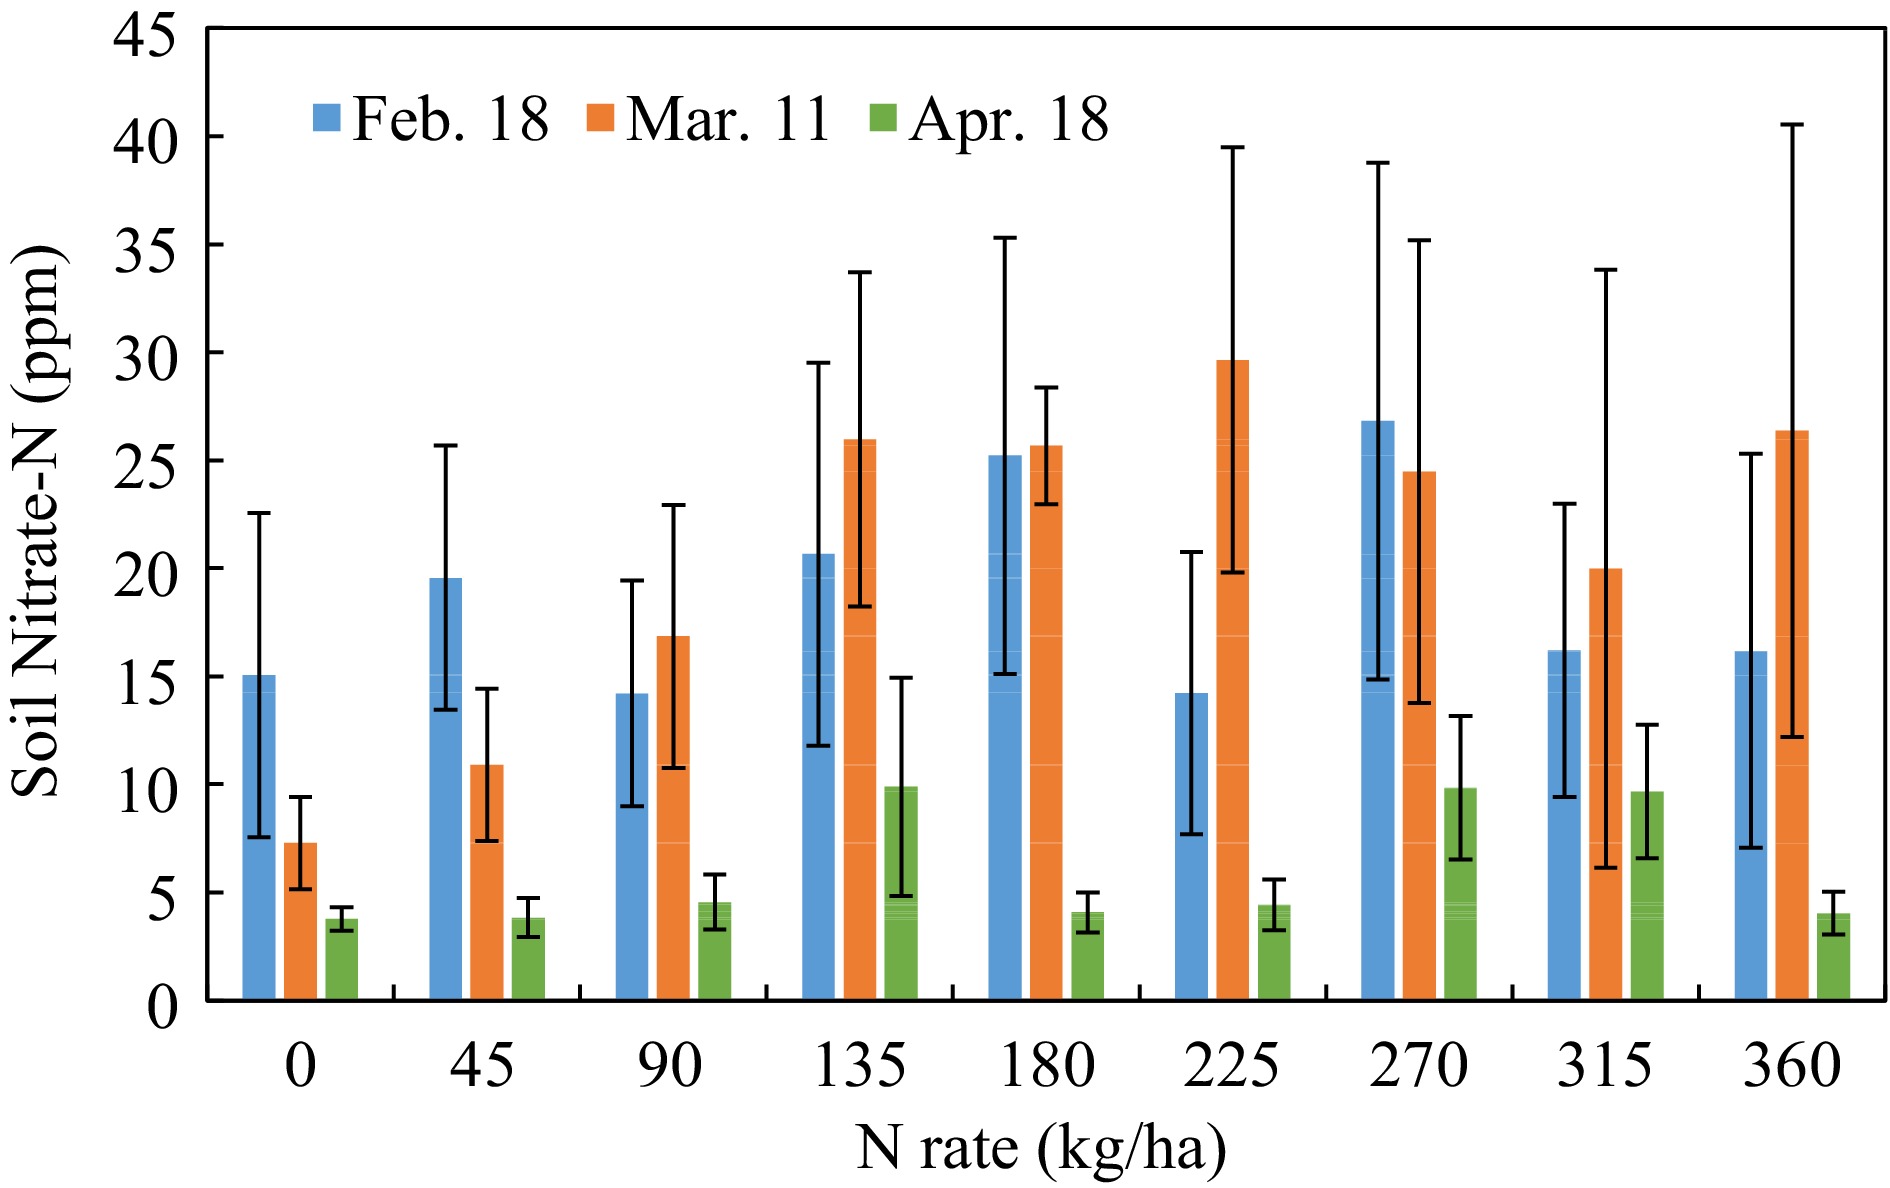
Figure 2.
Soil nitrate-N concentration response to N-rate in different growth stages. (Feb 18, Mar 11, Apr 18, 2022, that were 23, 44, and 82 d after planting).
-
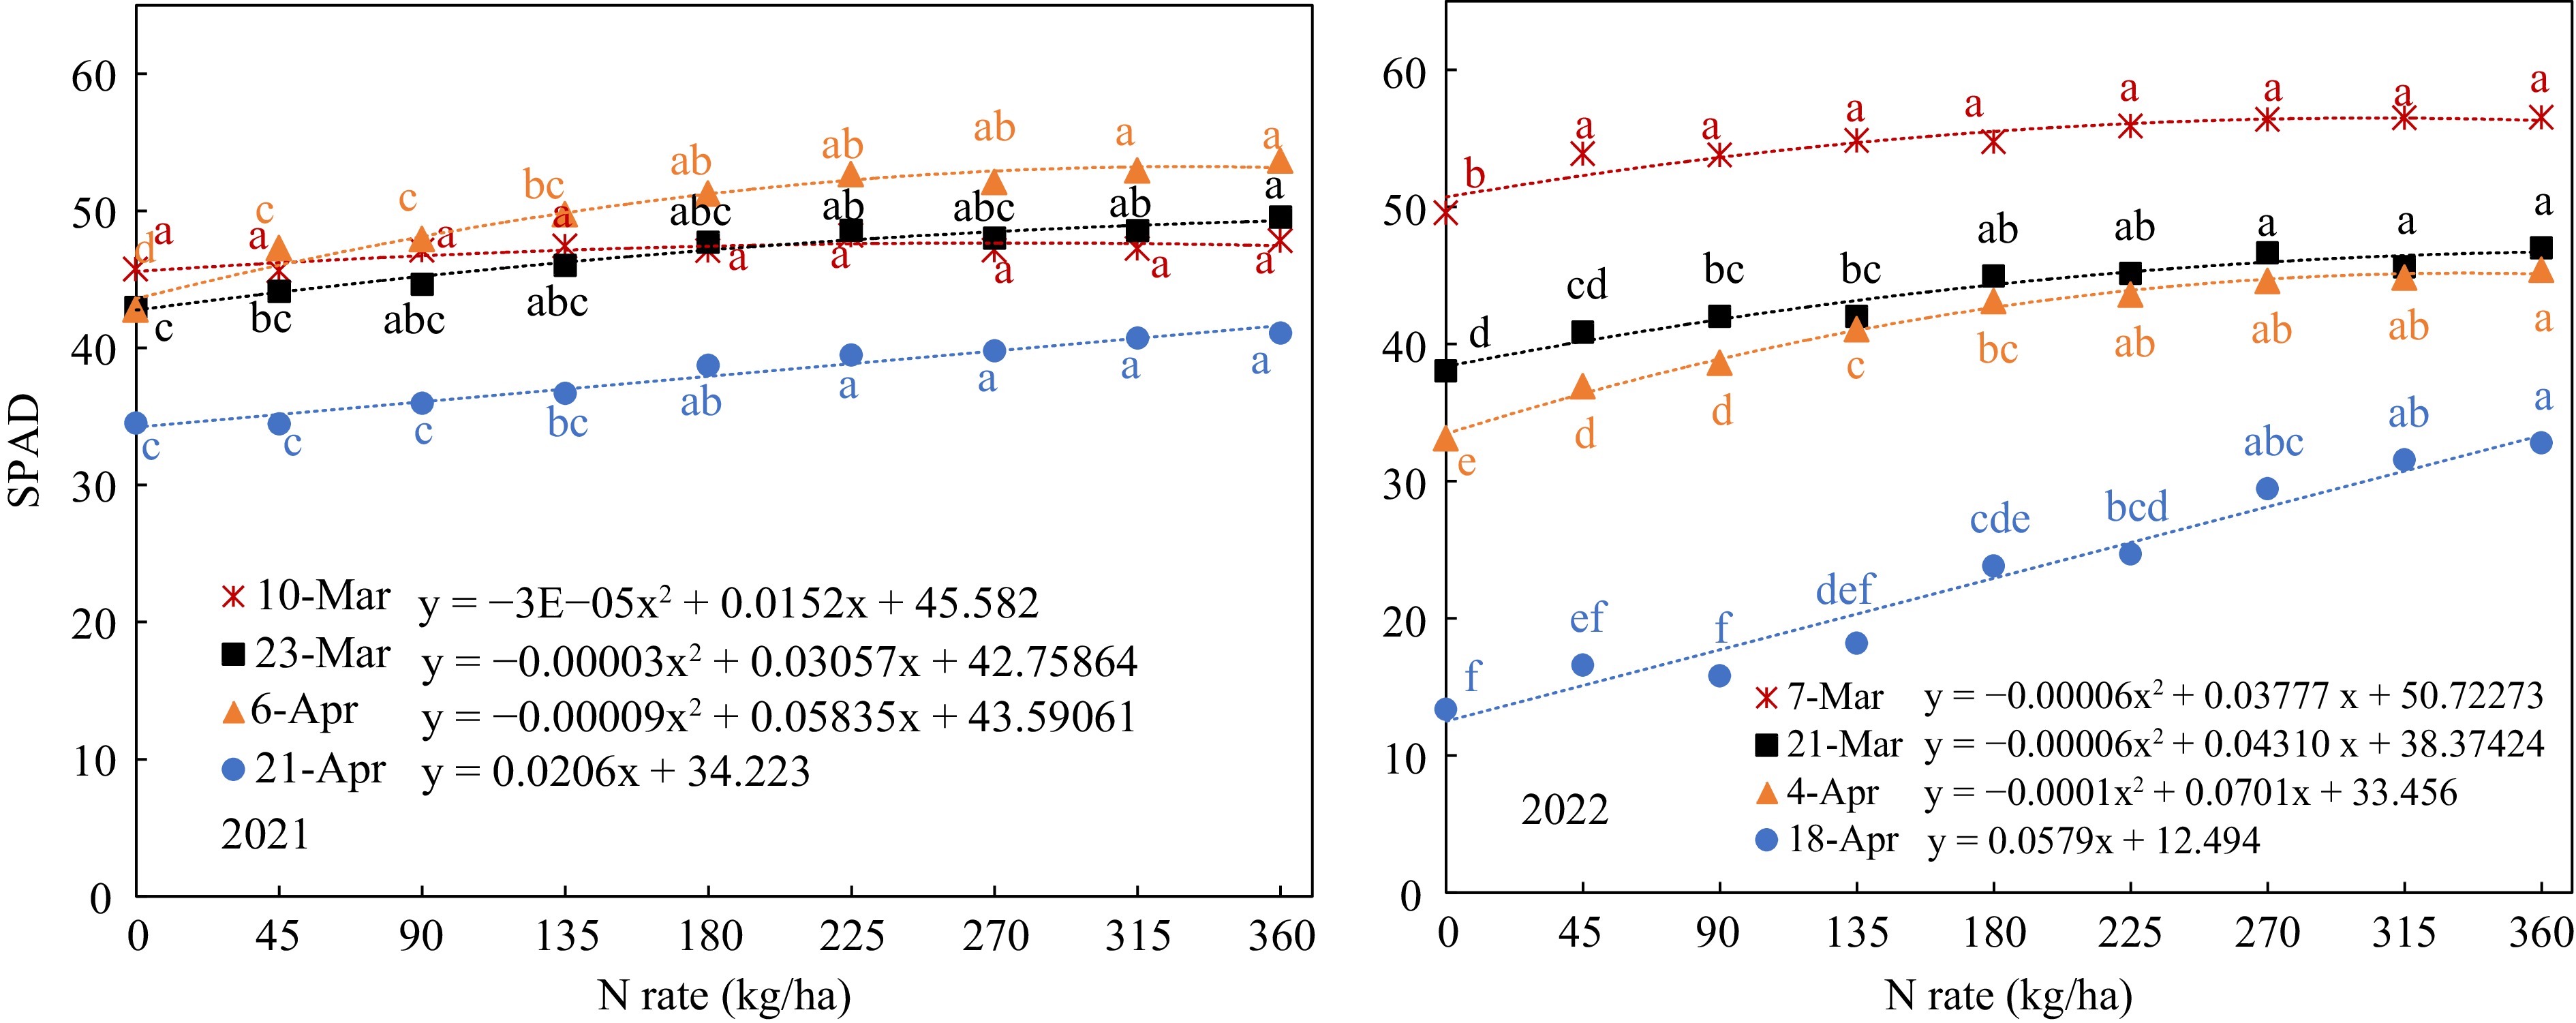
Figure 3.
SPAD value response to N-rate in different growth stages (Mar 7, Mar 21, Apr 4, and Apr 18, that were 40, 54, 68, and 82 d after planting).
-
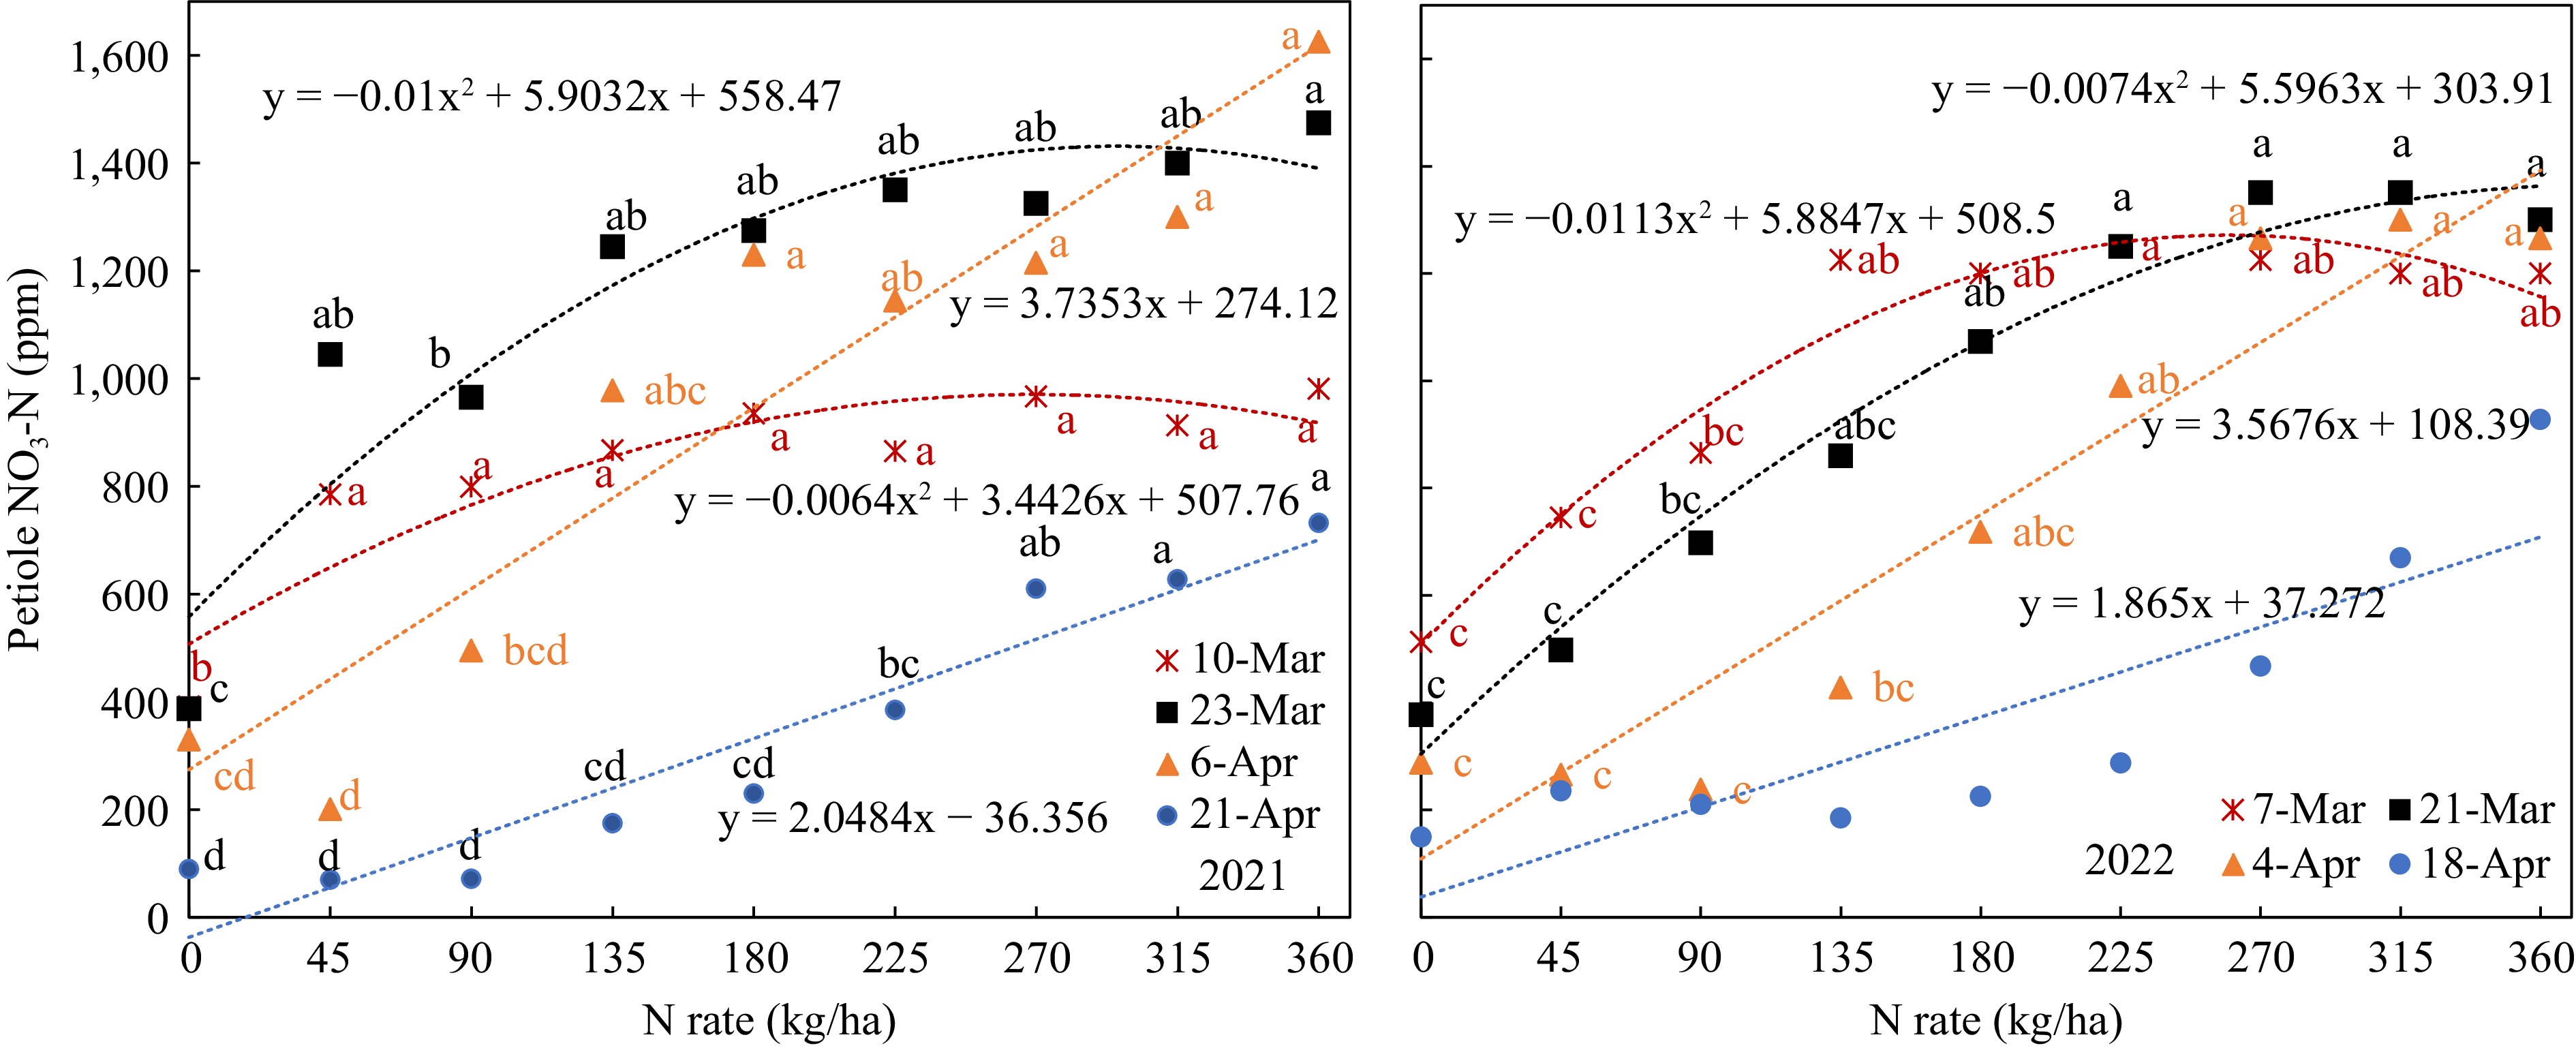
Figure 4.
Petiole sap nitrate-N response to N-rate in different growth stages. (Mar 7, Mar 21, Apr 4 that were 40, 54, 68 d after planting).
-
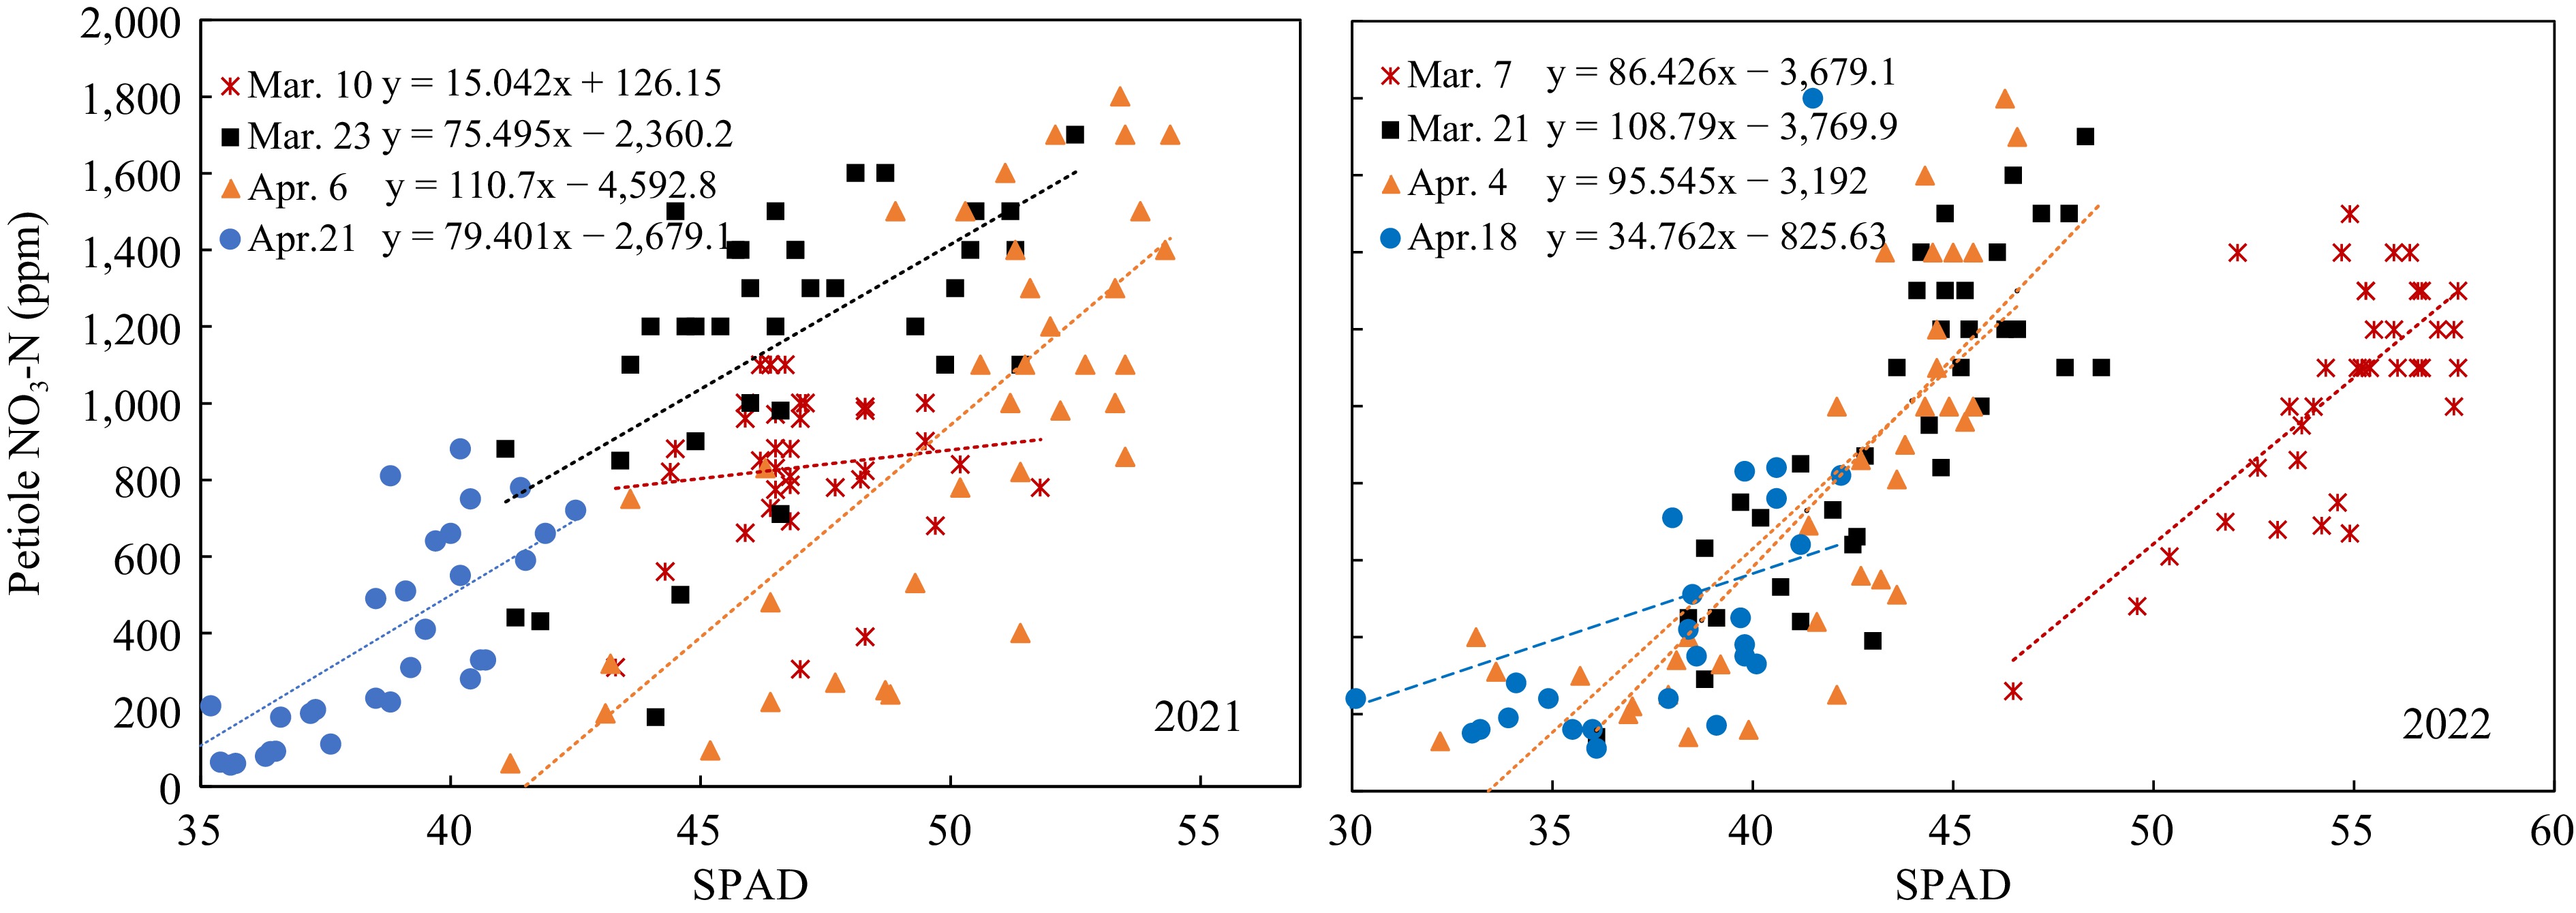
Figure 5.
Relation of petiole sap nitrate concentration to SPAD value.
-
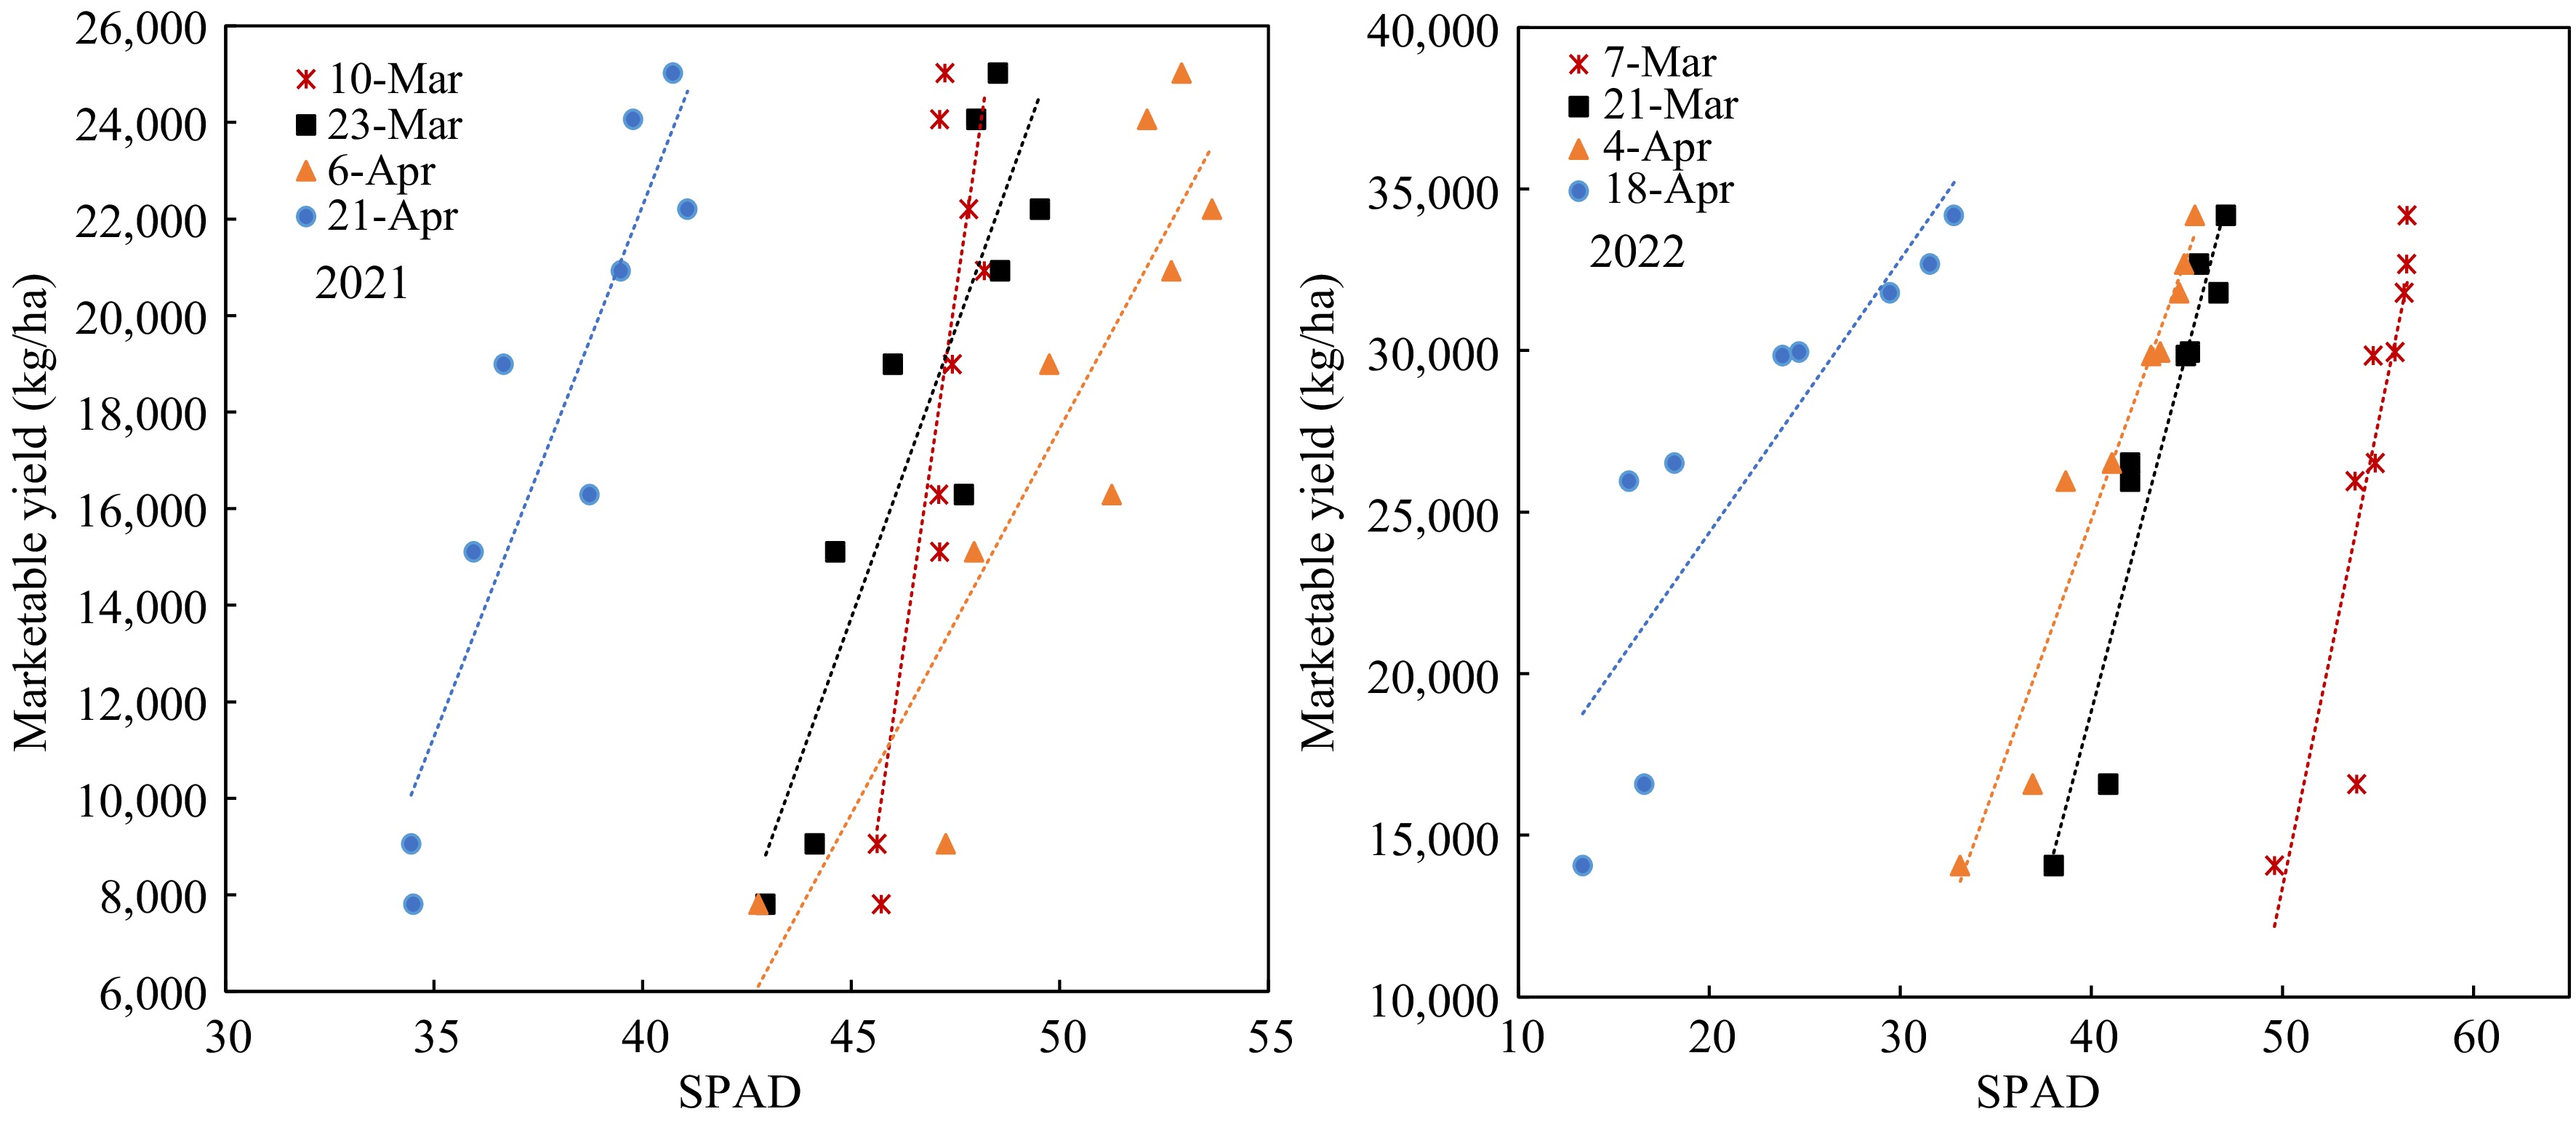
Figure 6.
Yield responses to SPAD value at different growth stages.
-
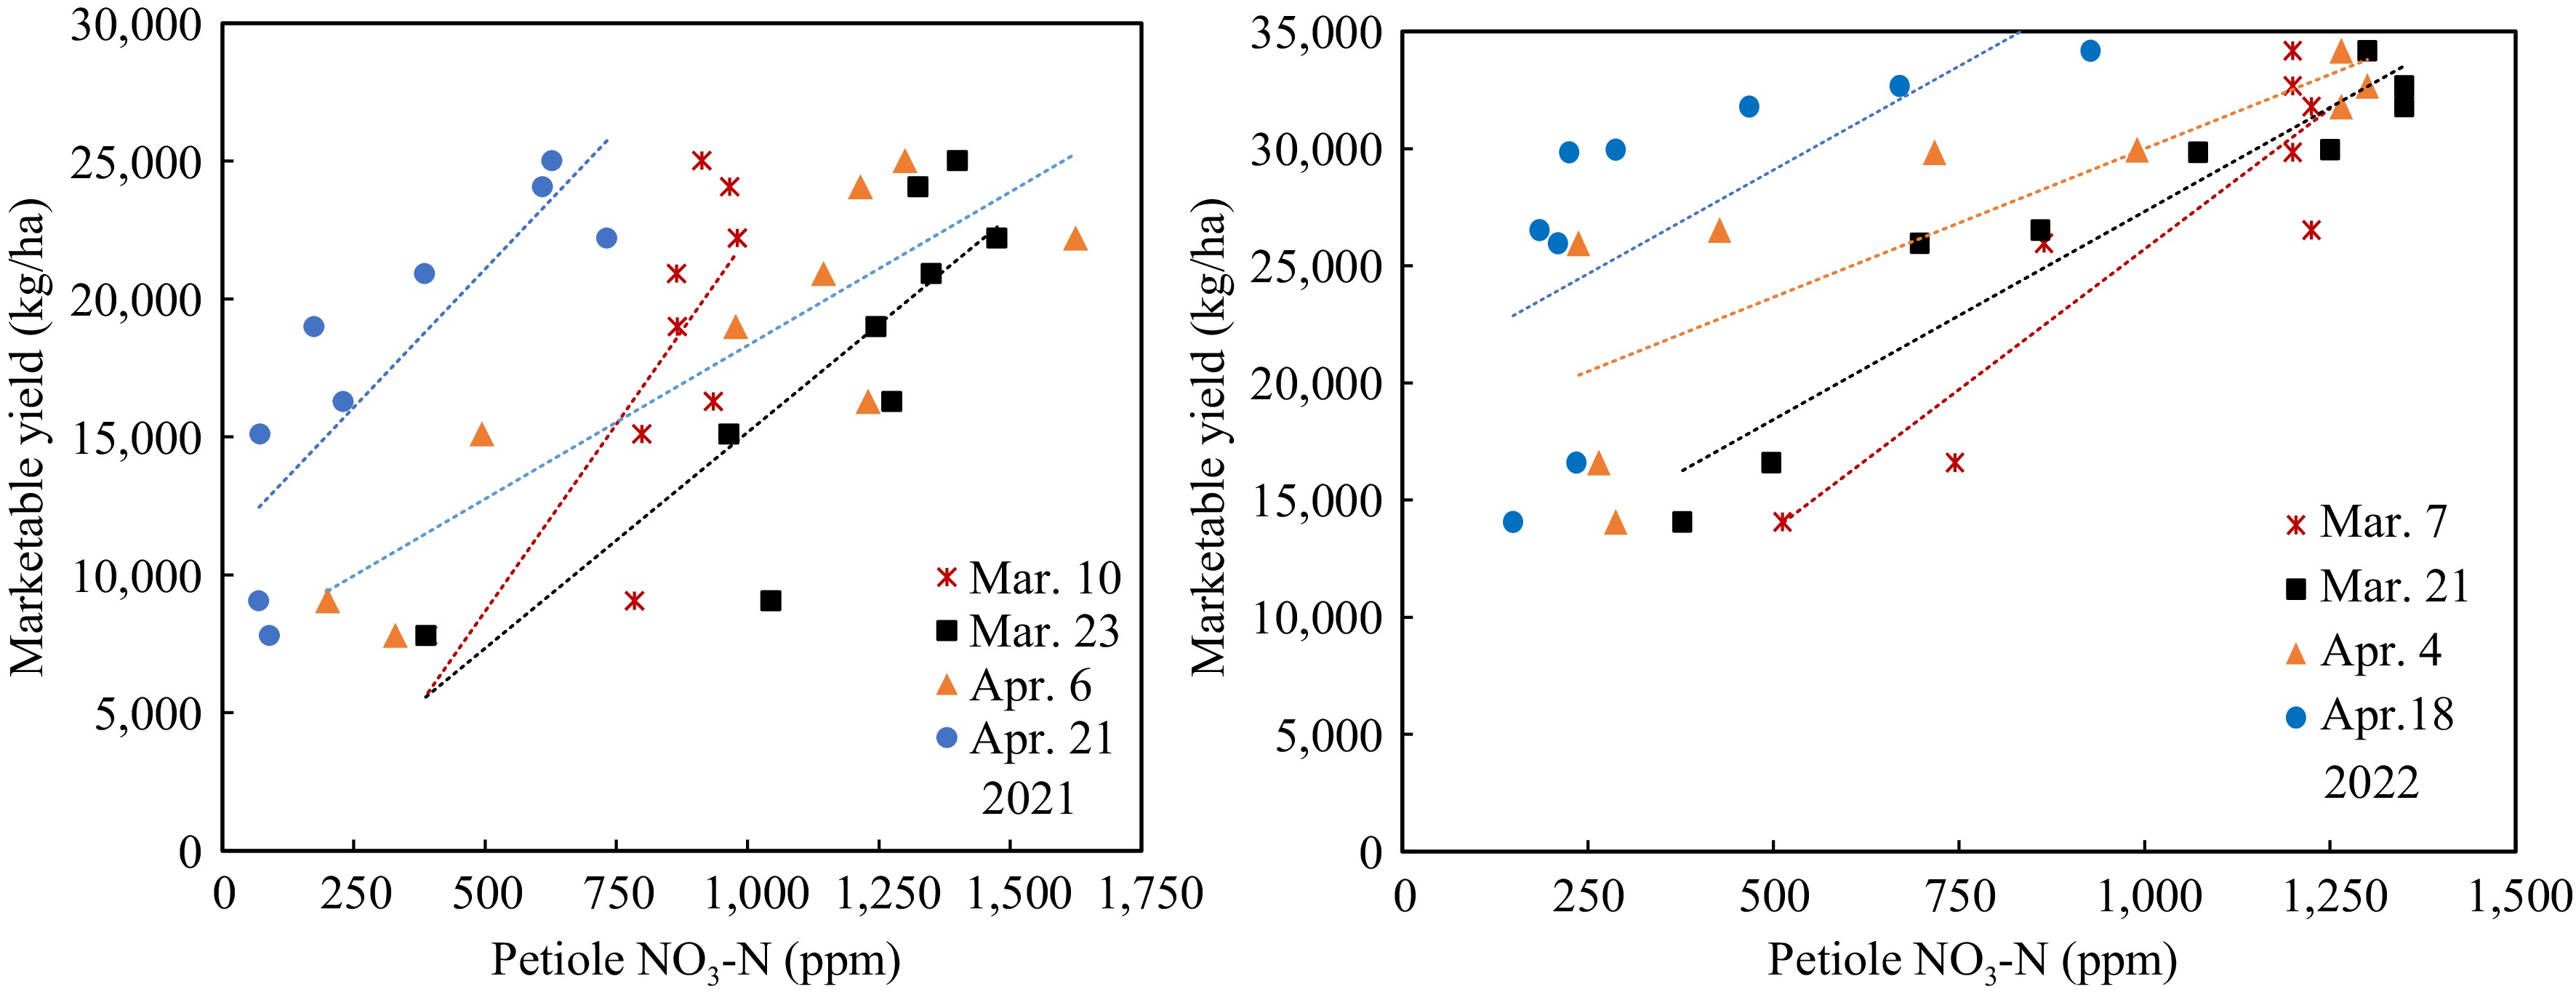
Figure 7.
Marketable yield response to petiole sap nitrate-N in 2021 and 2022 trials.
-
pH CEC P K Mg Ca Mn Fe 5.2 5.9 37.5 37.5 75.5 475.5 8 26 Table 1.
Soil properties of the trial field. All the essential elements (PPM) listed were extracted with Mehlich-III.
-
N rate
(kg/ha)Marketable yield
(kg/ha)Total yield
(kg/ha)Specific gravity
(g/cm3)Tuber hollow heart
(%)Corky ring spot
(%)Internal heat
(%)Brown center
(%)0 14,061 ± 1,363d 18,949 ± 1,204d 1.08 ± 0.00a 2.50 ± 1.64a 0.00 ± 0.00a 0.00 ± 0.00a 3.75 ± 1.83a 45 16,586 ± 755d 22,302 ± 776d 1.08 ± 0.00a 1.25 ± 1.25a 0.00 ± 0.00a 0.00 ± 0.00a 1.25 ± 1.25ab 90 25,957 ± 1,684c 31,594 ± 1,569bc 1.08 ± 0.00a 1.25 ± 1.25a 0.00 ± 0.00a 1.25 ± 1.25a 0.00 ± 0.00b 135 26,521 ± 1,404bc 31,168 ± 1,769c 1.08 ± 0.00a 2.50 ± 2.50a 0.00 ± 0.00a 0.00 ± 0.00a 0.00 ± 0.00b 180 29,841 ± 1,471abc 35,773 ± 1,499abc 1.09 ± 0.00a 2.50 ± 1.64a 0.00 ± 0.00a 1.25 ± 1.25a 0.00 ± 0.00b 225 29,956 ± 1,016abc 35,951 ± 1,401abc 1.09 ± 0.00a 0.00 ± 0.00a 0.00 ± 0.00a 0.00 ± 0.00a 0.00 ± 0.00b 270 31,784 ± 919abc 36,934 ± 751abc 1.08 ± 0.00a 5.00 ± 1.89a 1.25 ± 1.25a 0.00 ± 0.00a 0.00 ± 0.00b 315 32,680 ± 2,171ab 38,270 ± 2,440ab 1.08 ± 0.00a 6.25 ± 3.75a 0.00 ± 0.00a 0.00 ± 0.00a 0.00 ± 0.00b 360 34,181 ± 1,209a 39,875 ± 1,336a 1.08 ± 0.00a 3.75 ± 2.63a 0.00 ± 0.00a 0.00 ± 0.00a 0.00 ± 0.00b Data (mean ± SE, n = 4) followed with same letter in the same column were not significant different according to Tukey HSD at 0.05 level. Table 2.
The tuber yield and quality of potato grown under different nitrogen fertilizer rates.
Figures
(7)
Tables
(2)