


-
Florida produces spring potatoes mainly in the tri-county (St. Johns, Putnam, and Flagler Counties, FL, USA) agricultural area (TCAA), where the soil is mostly sandy[1,2]. Supplementing initial soil nitrates with nitrogen (N) fertilization remarkedly affect potato growth and tuber yield[3]. N-fertilizer application rate and timing influence uptake efficiency and tuber yield in this area[4,5]. However, accurate site-specific N recommendations have never been established for potato production due to variable weather, soil, and cultural practices[6]. It is critical to detect nitrogen deficiency as early as possible to estimate supplemental N requirements during the rest of the growing season. Leaf greenness meters (SPAD-502) and portable quick petiole sap nitrate-N meters are two convenient methods to monitor the nitrogen status for potato and other crops[6].
SPAD meters can be used to estimate leaf greenness content and detect N status under conducive environmental conditions and have optimized N management by reducing application rates for potato production[7]. SPAD readings were able to detect nitrogen deficiency one month after its emergence; petiole sap nitrate-N concentrations were able to be measured two weeks earlier[8] than SPAD readings. This can be explained by the time from nitrate nitrogen assimilation to chlorophyll biosynthesis. The threshold SPAD reading decreased within days after emergence but varied with cultivar and plant site[9,10]. It seems difficult to standardize SPAD threshold values for diagnosing the N status of a specific cultivar[9].
Petiole sap nitrate concentration is well correlated to potato N status between 20 to 60 d after N deficiency occurrence and has been widely investigated for potato production[6]. Low-cost, portable petiole sap nitrate meters such as Horiba Cardy meter have been used as a rapid field test method to improve nitrogen management[11]. However, the influences of cultivar and field condition on the petiole sap nitrate concentration make it difficult to propose standard sap concentration thresholds[6]. Solar radiation and wind may also affect field measurement accuracy[11]. Twenty petioles are required to increase the accuracy due to this variation, which is time- and labor-consuming for sampling and handling procedures[6]. These causations should be considered when using these measurements as guidance for N fertilization[12].
Though ground-based, airborne, and space-based remote sensing technologies are developing[13], hand-held greenness meters and portable petiole sap nitrate N meters are still two feasible methods to measure potato N status, particularly for small farms. However, the accuracy of both types of portable meters is influenced by the meter's hardware, as well as cultivar, growth stage, growing season, cultivation practices, and weather. Both methods have demonstrated merits and limitations. The objective of this study is to compare the suitability of the pocketable SPAD meter and portable Horiba Cardy nitrate meter to monitor the nitrogen status of potato grown in the tri-county agricultural area in Northeast Florida.
-
The experiments were carried out in 2021 and 2022 at the University of Florida/IFAS Hastings Agriculture Extension Center, Hastings, FL (USA), in the Northeast Florida potato production area. The soil properties of the trial field are shown in Table 1. The trials were completed with hilled rows. The hilled rows (0.35 m in height) were formed with 1-m distance between row centers. At planting, granular fertilizer was banded on the soil surface of each row and subsequently incorporated. The potassium and phosphorus fertilizer were applied two days before planting according to IFAS potato production guidelines. Nine nitrogen fertilizer levels were prepared and supplied as granular calcium nitrate (15-0-0) from 0 (control) to 360 kg/ha with a 45 kg/ha increment. Nitrogen fertilizer was distributed in three applications: 30% two days before planting, 30% at emergence, 40% 41 d after planting (DAP). The experiments were arranged in a randomized complete block design with four blocks each with nine plots, four rows in each block, and 12.2 m in length for each plot. There was a 1.5-m skip between plots, and the total area of each block was 198.1 m2. Commercial chipping potato (Solanum tuberosum 'Atlantic') seed pieces were planted on Feb 5, 2021, and Jan 26, 2022, respectively.
Table 1. Soil properties of the trial field. All the essential elements (PPM) listed were extracted with Mehlich-III.
pH CEC P K Mg Ca Mn Fe 5.2 5.9 37.5 37.5 75.5 475.5 8 26 Soil samples from each plot were collected 23, 44, and 82 DAP in 2022 and nitrate-N concentration was analyzed by Waters Agricultural Laboratories, Inc. (Camilla, GA, USA) SPAD readings were measured by the SPAD 502 C (Konica Minolta, Inc., Osaka, Japan) on the 4th leaf with 30 measurements on different plants, on Mar 10, Mar 23, Apr 6, and Apr 21 in 2021; and on Mar 7, Mar 21, Apr 4, and Apr 18 (40, 54, 68, and 82 DAP). Petiole sap nitrate-N concentrations were measured with a Horiba LAQUAT Cardy nitrate meter on the same day. At least, 10 petioles were sampled for each measurement, depending on sap availability per petiole.
Potato tubers were harvested on May 10, 2021, and May 6, 2022. The tubers from the middle 6.1 m of the two central rows in each plot were weighed and calculated for total and marketable yields. Specific gravity was measured with a specific gravity scale. Twenty marketable tubers were randomly picked from each plot and weighed in air and in water. The specific gravity was calculated as shown below:
Specific Gravity = weight in air ÷ (weight in air − weight in water)
Ten tubers from each plot were cut into quarters and the incidence of tuber hollow heart, corky ring spot, internal heat, and brown center were counted.
Differences in data between N-rates or growth stages were analyzed with one way ANOVA. Means were separated by Tukey HSD at 0.05 level for significant differences. Regression analyses between N-rate on yield, SPAD readings, petiole sap nitrate-N concentrations; SPAD readings and petiole sap nitrate-N concentrations on yield; Both of SPAD and petiole sap nitrate-N readings were conducted by using JMP pro 16.1 (SAS Institute, 2020). Figures were plotted in Excel.
-
Both the total yield and marketable yield were increased with nitrogen fertilizer application, and the relationship between yield and N-rate significantly fitted with quadratic regressions (Fig. 1). The tuber yields of 2022 at different N-rates were generally greater than that of 2021. The respective maximum total and marketable yields of 2021 reached 33,306 kg/ha with 326 kg/ha N and 23,659 kg/ha with 360 kg/ha N based on the calculation vertex of the quadratic regressions. The corresponding maximum total yield and marketable yields of 2022 achieved 38,885 kg/ha with 332 kg/ha and 33,286 kg/ha with 333 kg/ha, respectively. The maximum total and marketable yields were more consistent in 2022 than in 2021. Basically, nitrogen applications did not significantly affect the tuber quality indices such as incidence of hollow heart, corky ring spot, and internal heat, except that the brown center rate was significantly decreased with nitrogen fertilization (Table 2).
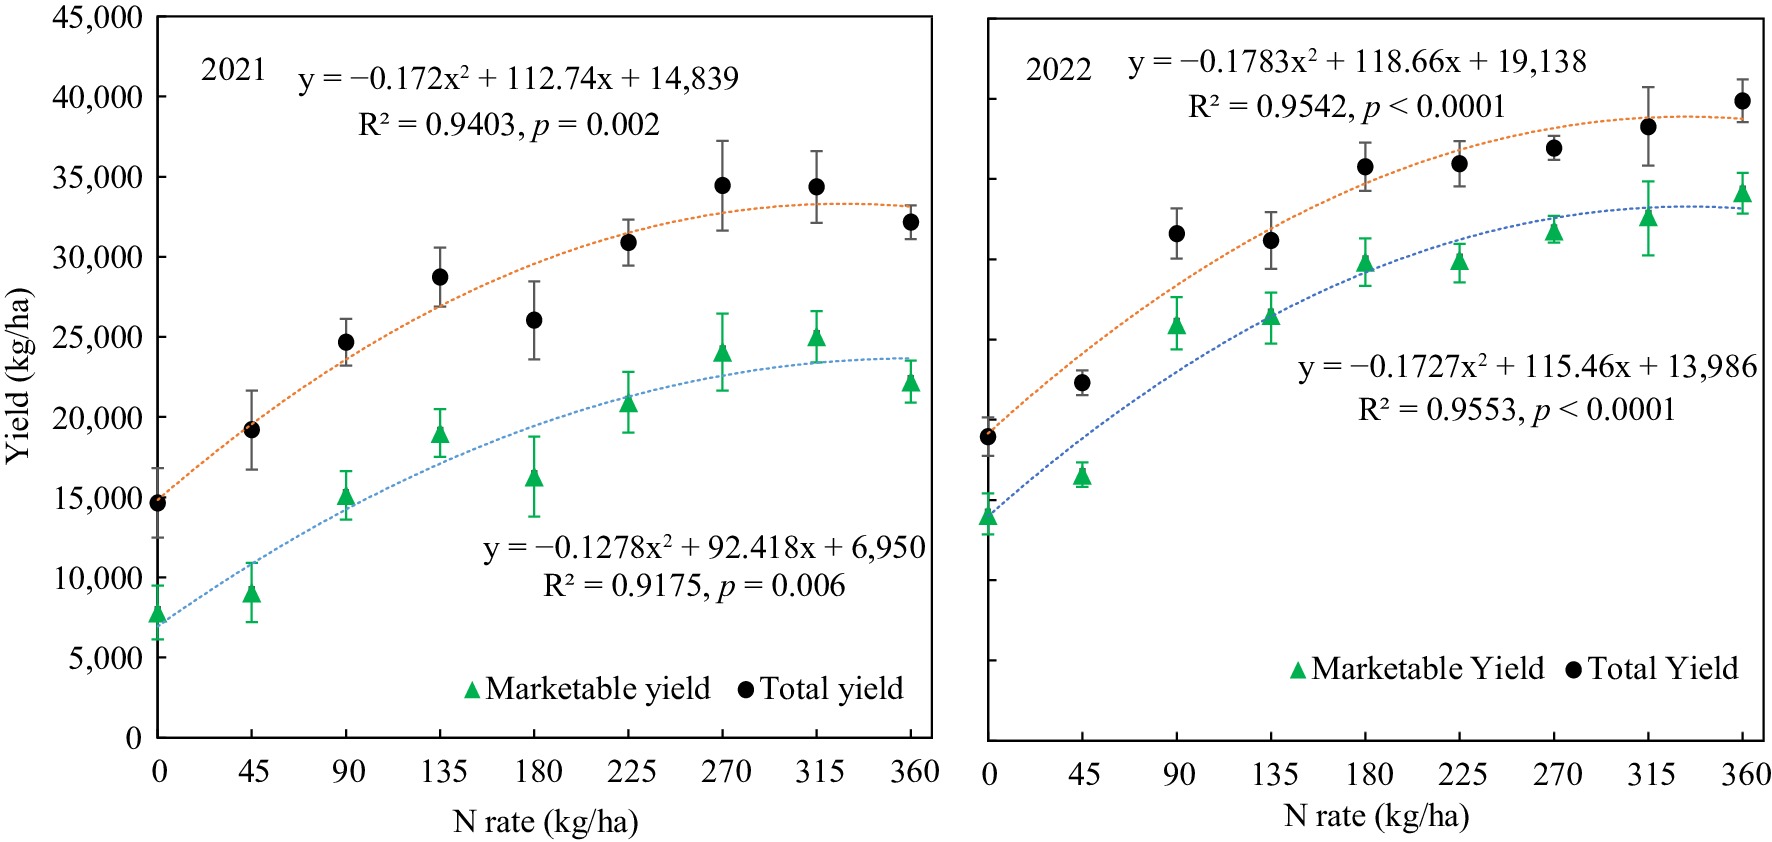
Figure 1.
Potato marketable tuber yield and total tuber yield response to nitrogen fertilizer application rate.
Table 2. The tuber yield and quality of potato grown under different nitrogen fertilizer rates.
N rate
(kg/ha)Marketable yield
(kg/ha)Total yield
(kg/ha)Specific gravity
(g/cm3)Tuber hollow heart
(%)Corky ring spot
(%)Internal heat
(%)Brown center
(%)0 14,061 ± 1,363d 18,949 ± 1,204d 1.08 ± 0.00a 2.50 ± 1.64a 0.00 ± 0.00a 0.00 ± 0.00a 3.75 ± 1.83a 45 16,586 ± 755d 22,302 ± 776d 1.08 ± 0.00a 1.25 ± 1.25a 0.00 ± 0.00a 0.00 ± 0.00a 1.25 ± 1.25ab 90 25,957 ± 1,684c 31,594 ± 1,569bc 1.08 ± 0.00a 1.25 ± 1.25a 0.00 ± 0.00a 1.25 ± 1.25a 0.00 ± 0.00b 135 26,521 ± 1,404bc 31,168 ± 1,769c 1.08 ± 0.00a 2.50 ± 2.50a 0.00 ± 0.00a 0.00 ± 0.00a 0.00 ± 0.00b 180 29,841 ± 1,471abc 35,773 ± 1,499abc 1.09 ± 0.00a 2.50 ± 1.64a 0.00 ± 0.00a 1.25 ± 1.25a 0.00 ± 0.00b 225 29,956 ± 1,016abc 35,951 ± 1,401abc 1.09 ± 0.00a 0.00 ± 0.00a 0.00 ± 0.00a 0.00 ± 0.00a 0.00 ± 0.00b 270 31,784 ± 919abc 36,934 ± 751abc 1.08 ± 0.00a 5.00 ± 1.89a 1.25 ± 1.25a 0.00 ± 0.00a 0.00 ± 0.00b 315 32,680 ± 2,171ab 38,270 ± 2,440ab 1.08 ± 0.00a 6.25 ± 3.75a 0.00 ± 0.00a 0.00 ± 0.00a 0.00 ± 0.00b 360 34,181 ± 1,209a 39,875 ± 1,336a 1.08 ± 0.00a 3.75 ± 2.63a 0.00 ± 0.00a 0.00 ± 0.00a 0.00 ± 0.00b Data (mean ± SE, n = 4) followed with same letter in the same column were not significant different according to Tukey HSD at 0.05 level. Soil nitrate-N concentration response to N-rate
-
In general, soil nitrate-N concentrations decreased within the growth stage, especially before harvest. However, due to the great variances within group, there was no statistical significance between the N-rates, or between soil sampling dates (Fig. 2).
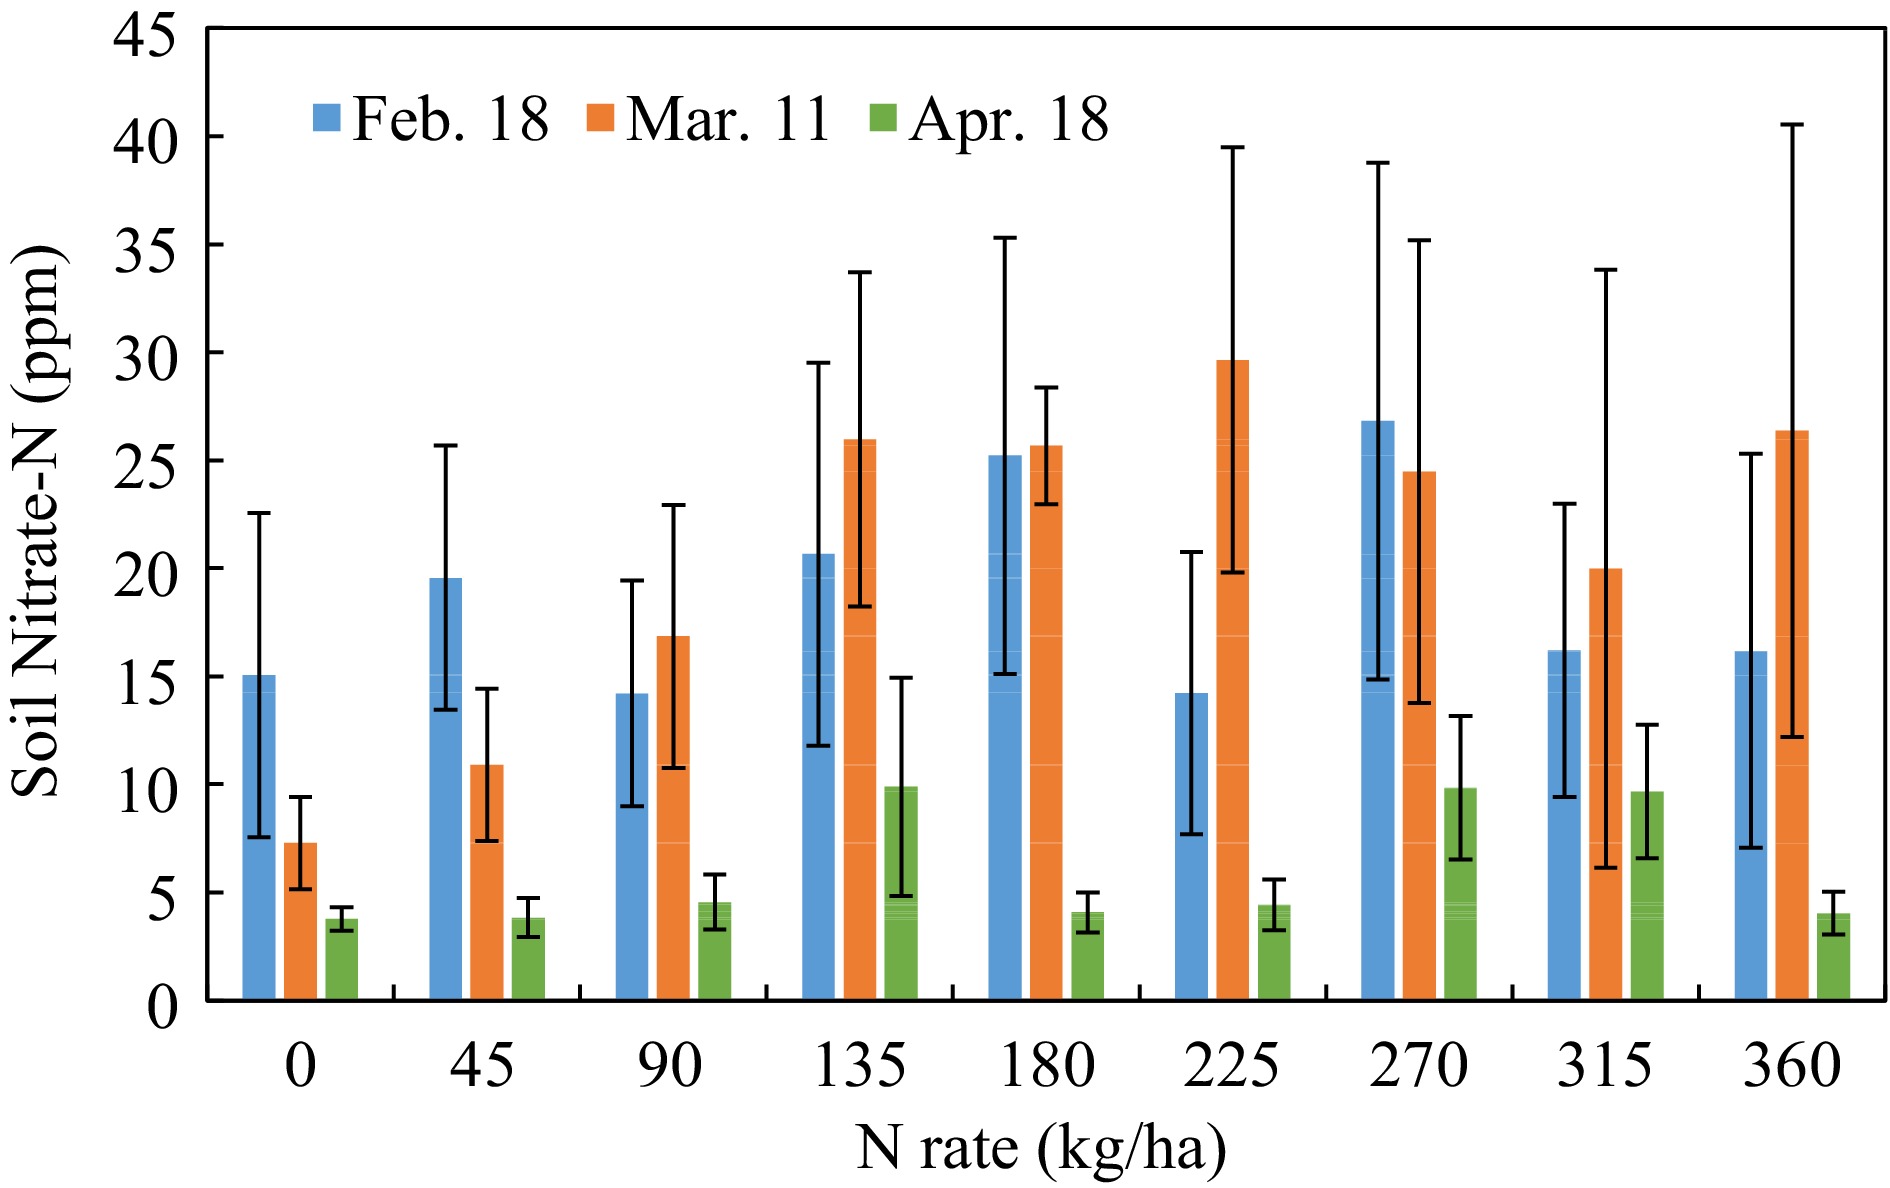
Figure 2.
Soil nitrate-N concentration response to N-rate in different growth stages. (Feb 18, Mar 11, Apr 18, 2022, that were 23, 44, and 82 d after planting).
SPAD and petiole sap nitrate-N response to N-rate
-
SPAD value and petiole sap nitrate-N concentration increased with the N-rate in all growth stages in both years (Figs 3 & 4); all the data fitted well with quadratic or linear regression.
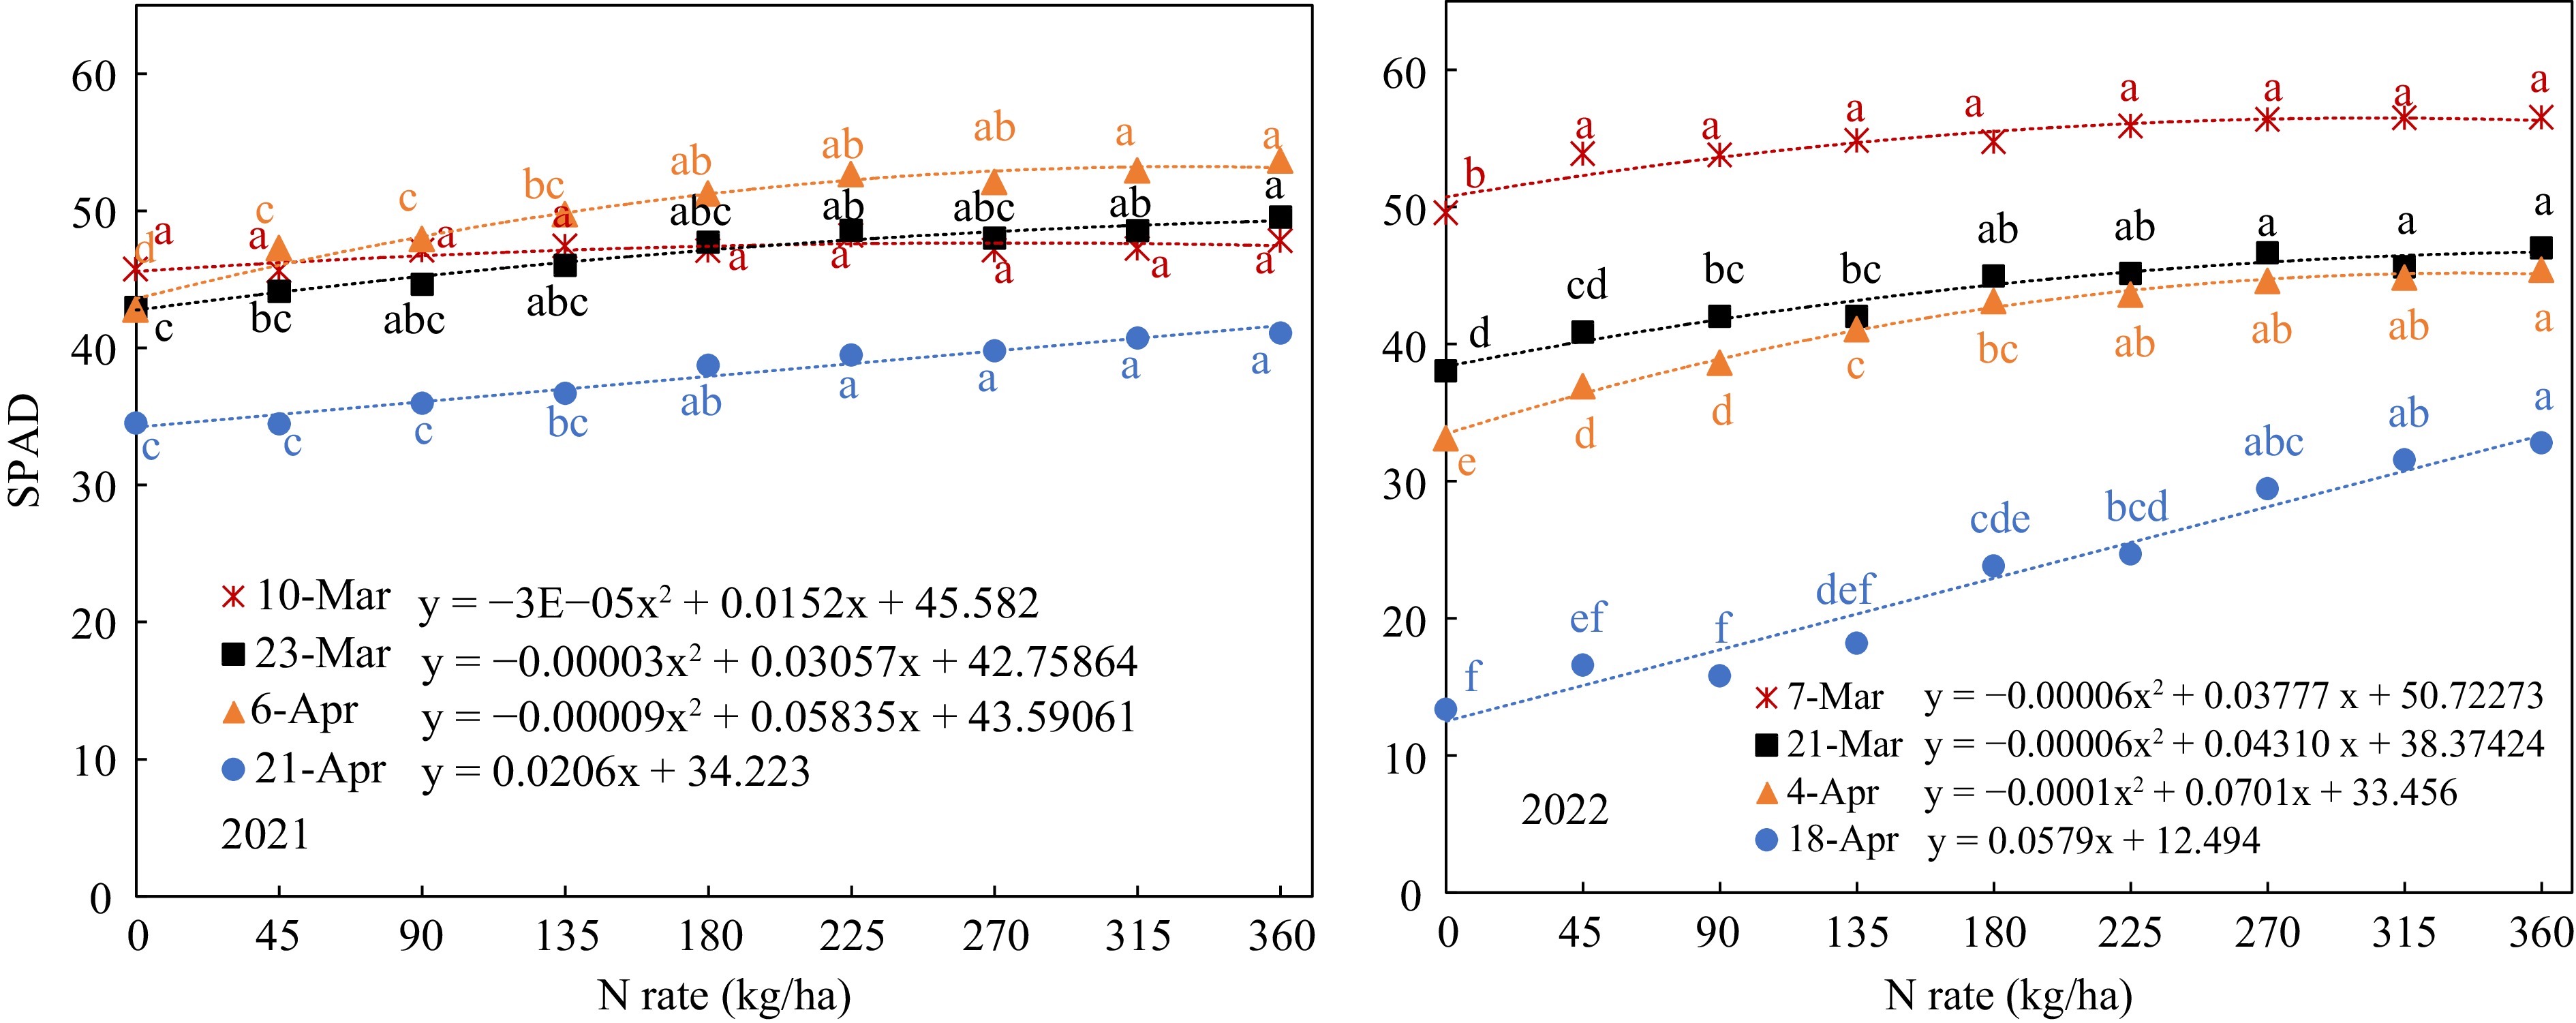
Figure 3.
SPAD value response to N-rate in different growth stages (Mar 7, Mar 21, Apr 4, and Apr 18, that were 40, 54, 68, and 82 d after planting).
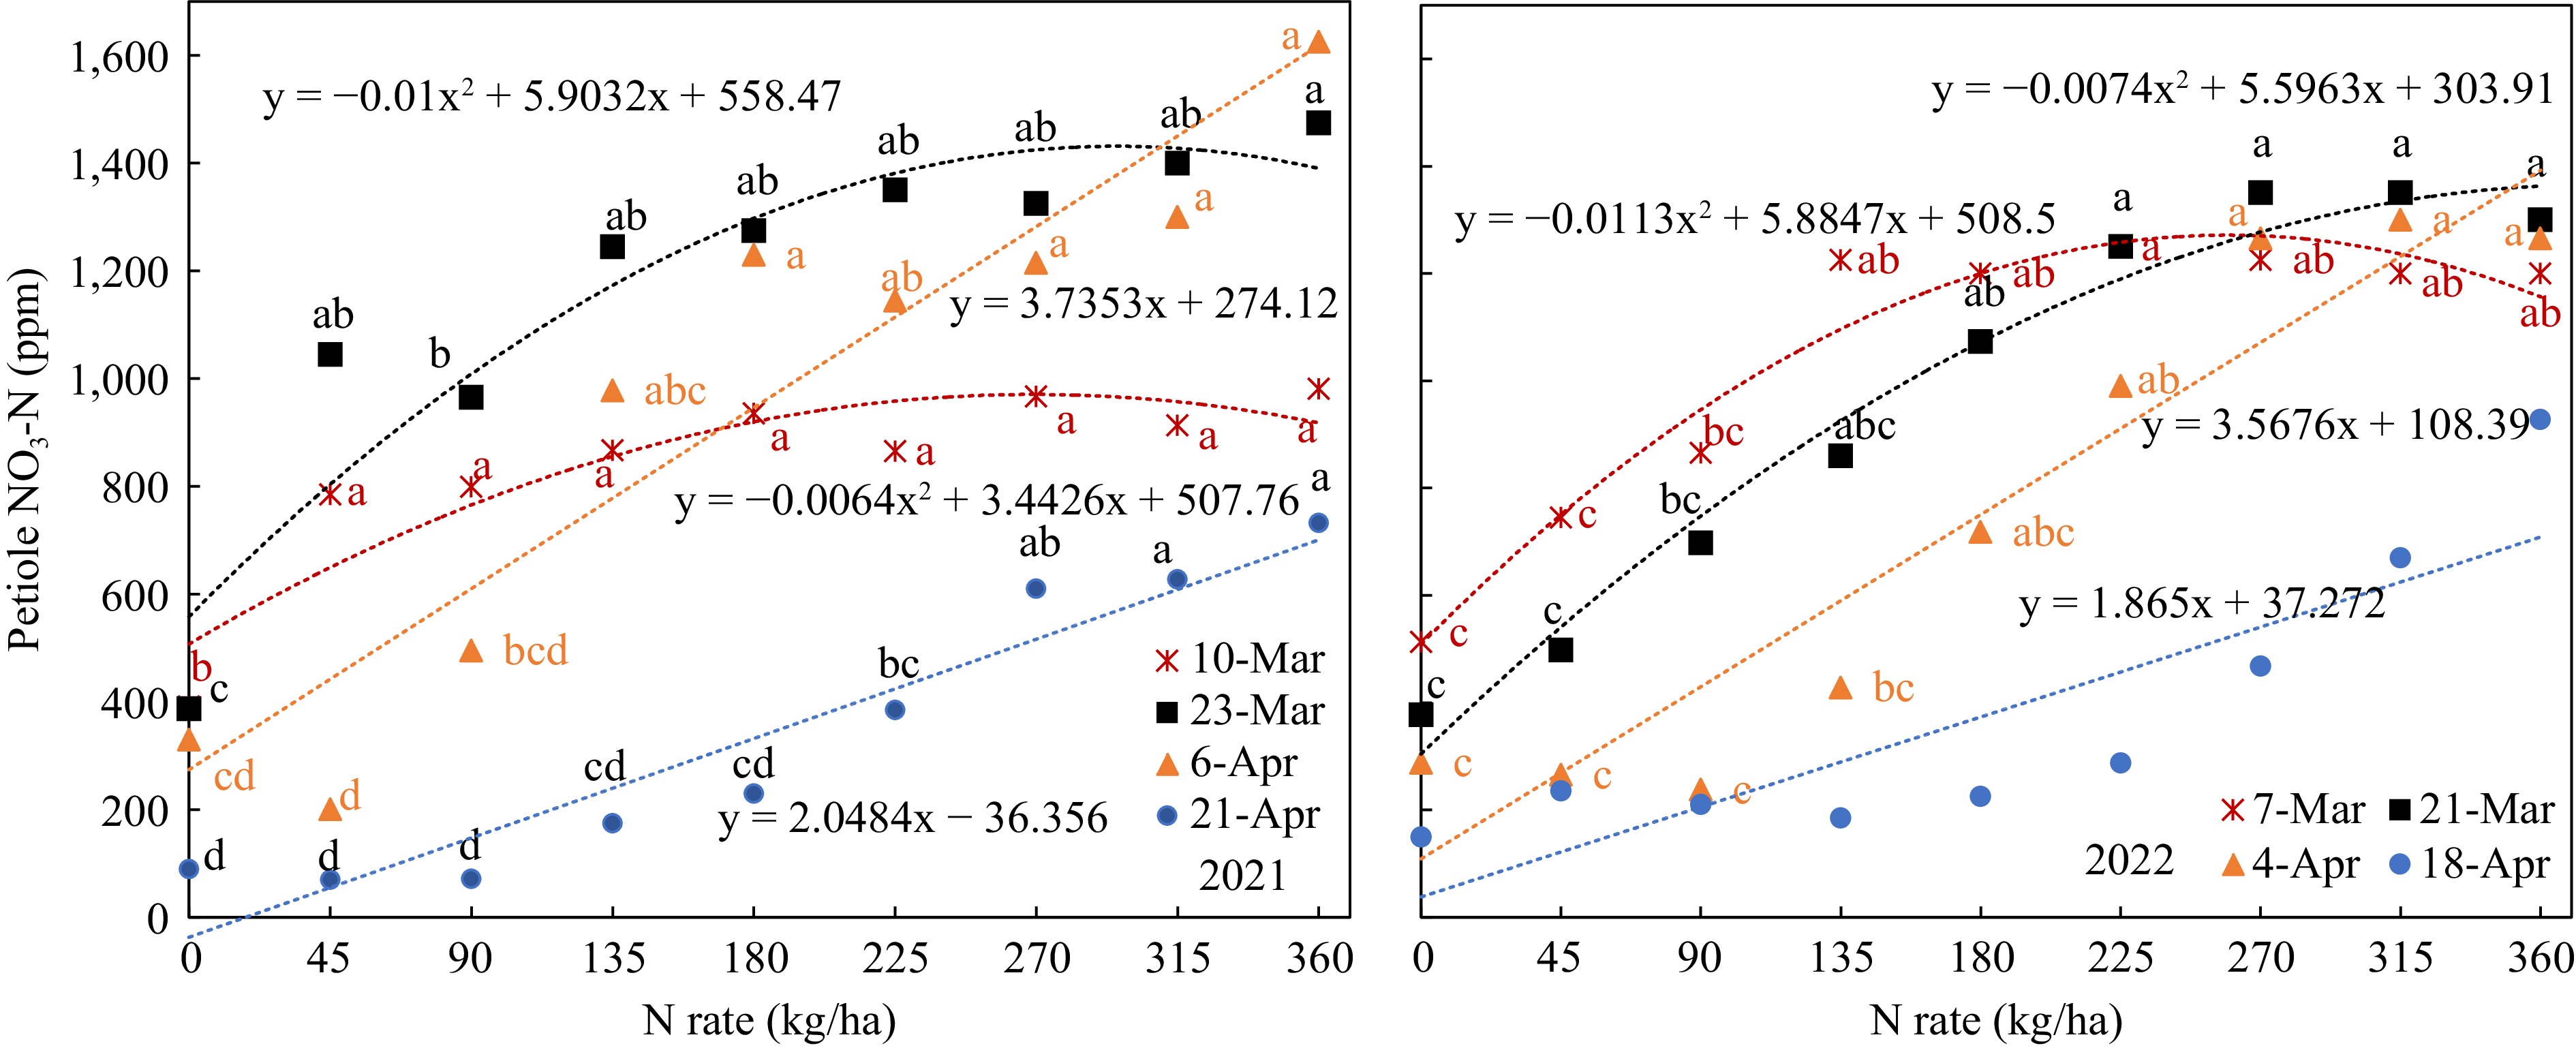
Figure 4.
Petiole sap nitrate-N response to N-rate in different growth stages. (Mar 7, Mar 21, Apr 4 that were 40, 54, 68 d after planting).
However, petiole sap Nitrate-N concentration showed more range of variation with a greater slope (Fig. 4). The SPAD values at early growth stage showed a smaller range of variation. On Mar 10, 2021, SPAD did not indicate any significant difference between all the N-rates except for the zero-N control. On Mar 7, 2022, only the SPAD reading was significantly lower with the control (0 kg/ha) than with all the other nitrogen levels, but all the SPAD readings at the N-rates from 45 to 360 kg/ha ranged narrowly from 53.8 to 56.5 without significant difference (Fig. 3). Thus, the SPAD value on the 40 DAP was not able to distinguish the difference in leaf nitrogen status according to the N-rate in this stage. For the second measurement in 2021, the SPAD readings ranged from 43 to 50, but there was no significant difference between N-rates from 45 kg/ha to 315 kg/ha. In 2022, the SPAD readings of the second measurements on Mar 21 ranged from 38 to 47 and showed significant differences between N-rates below 135 kg/ha and above 270 kg/ha. On Apr 6, the third measurements showed significant difference between the N-rate below 90 kg/ha and above 180 kg/ha and ranged from 43 to 54. In 2022, the SPAD values were lower with the range from 33 to 45 and showed significant differences between N-rates below 135 kg/ha and above 225 kg/ha. The regression between SPAD and N-rate in this growth stage also showed best fitting with a greater R2. It indicated that SPAD on the 68th DAP was more sensitive to distinguishing the differences of leaf N status caused by different N-rates. The SPAD values of last measurement near harvest also increased linearly with N-rate, but with much smaller values, it indicated that the soil N were used up and leaf N were transferred to the tubers.
In contrast, petiole sap nitrate-N concentration in all growth stages had a wider range and showed clear quadratic or linear relations to N-rate (Fig. 5). The wider range made it easier to separate the N status from different N-rates. However, there were still no significant differences between the N-rates. For example, the petiole sap nitrate-N of Mar 10, 2021, at N-rates from 45 kg/ha to 360 kg/ha had no significant difference. In the 2021 trial, only the petiole sap nitrate-N concentrations at N-rates of 360, 90, and 0 kg/ha had significant differences on 54 DAP. In 2022, when the N-rates were 135 kg/ha, 180 kg/ha, and 225 kg/ha, the petiole sap nitrate-N of 68 DAP were 427, 717, and 990 ppm respectively (Fig. 5). There was also no significant difference between the petiole sap nitrate-N concentrations from 180 kg/ha to 360 kg/ha, though the petiole sap nitrate-N concentrations ranged from 717 to 1,300 ppm.
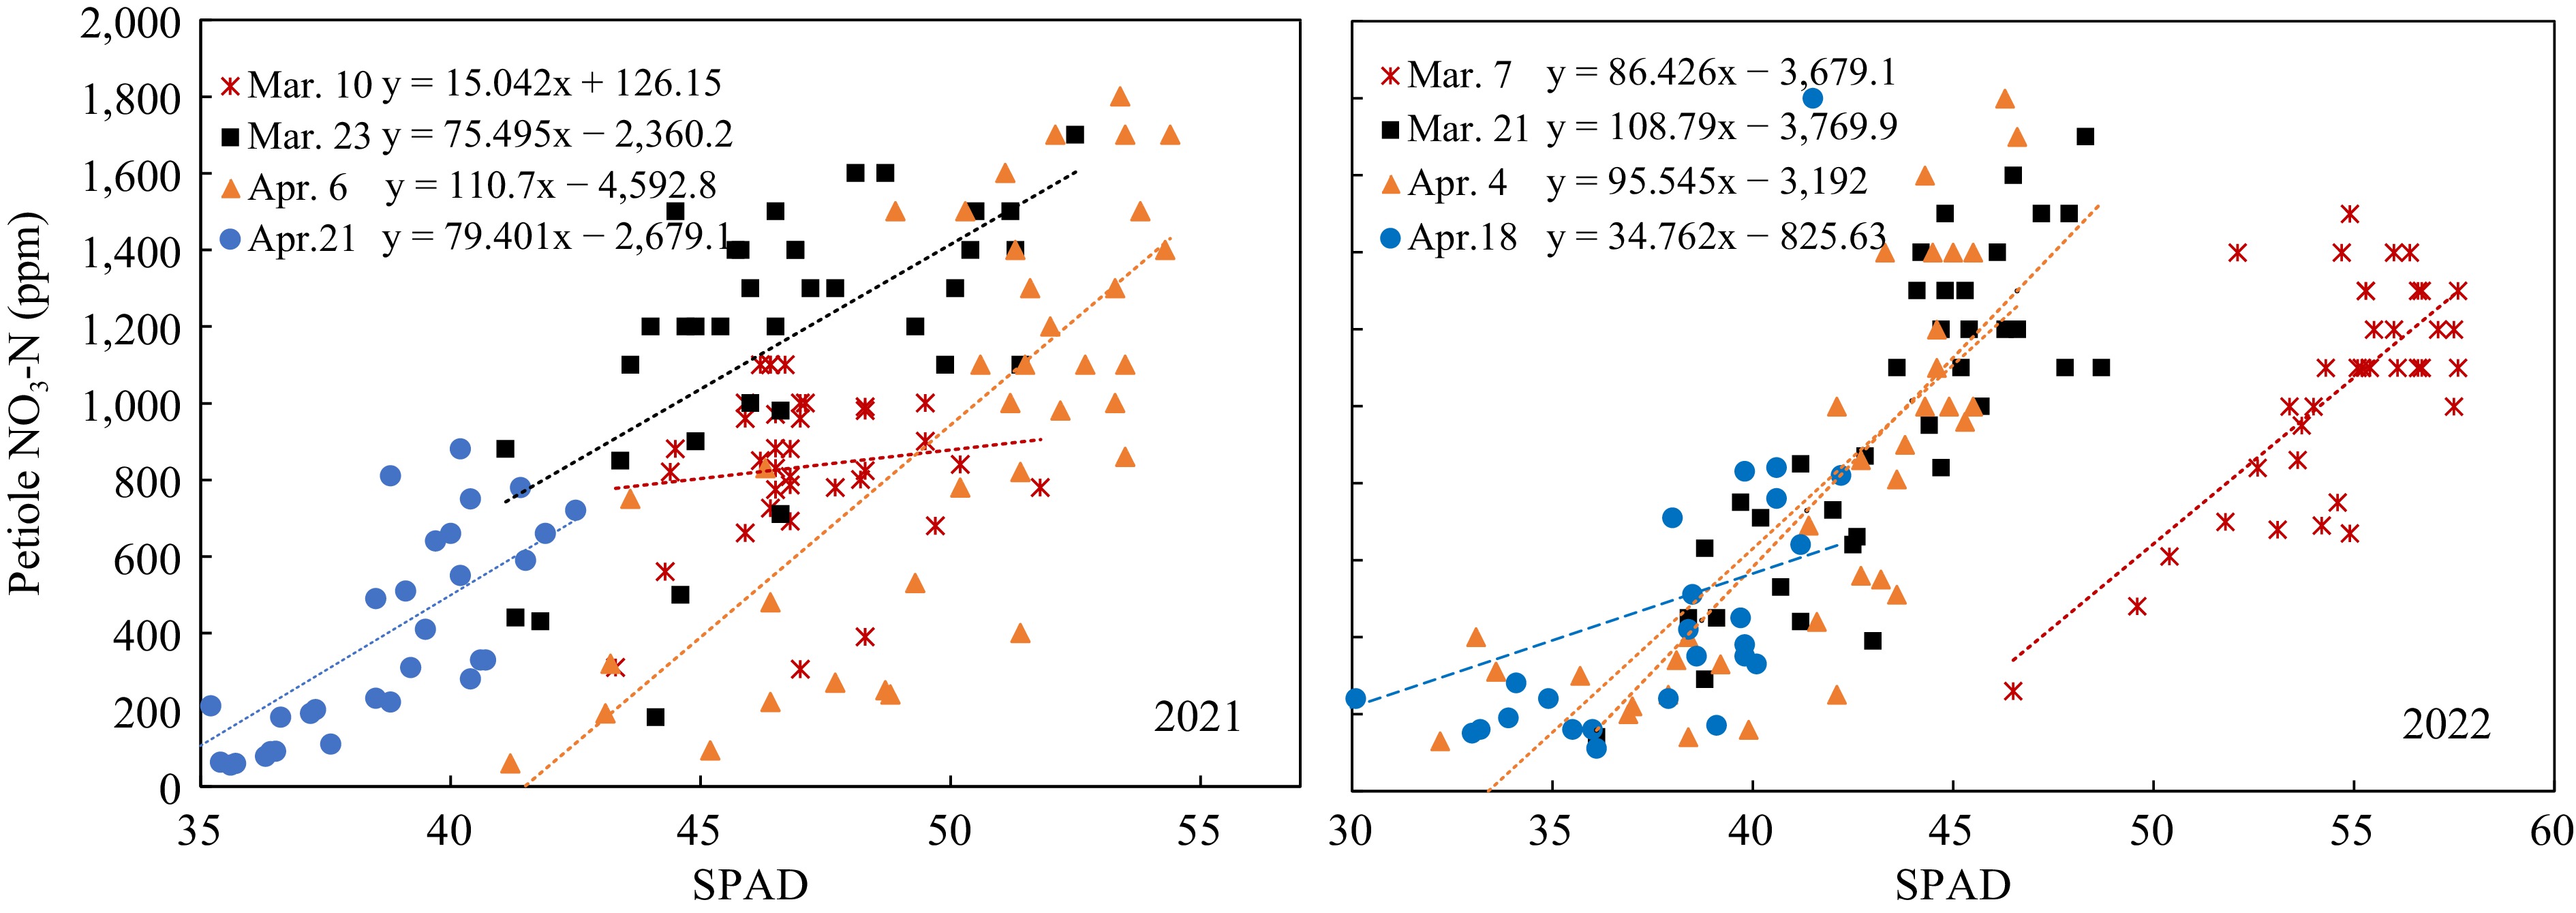
Figure 5.
Relation of petiole sap nitrate concentration to SPAD value.
Relation between the petiole sap nitrate-N concentration and SPAD value
-
In 2021, petiole sap nitrate-N and SPAD values of Mar 10 did not have any significant relationship. The data of 40 DAP and 68 DAP showed significant relations, but the linear regressions were not well-fitted and had low R2 (Fig. 5, left). Data of 2022 showed better linear relationships between petiole sap nitrate-N concentrations and SPAD value at 40, 54, 68 DAP, with R2 of 0.5084, 0.6246, and 0.7155, respectively (Fig. 5, right). The low R2 values indicated that it was not sufficient to predict petiole sap nitrate-N concentrations from the SPAD values.
Yield response to SPAD or petiole sap nitrate-N concentrations
-
The marketable yield had significant linearity relative to both the SPAD value and petiole sap nitrate-N in different growth stages of both years. However, the regressions of the two years were vastly different. The regressions between yields and SPAD readings on 68 DAP in 2022 were best fitting (Fig. 6). All the linear equations had large slopes, which means the yield changed significantly with a slight change of SPAD value. The SPAD value did not change significantly when the N-rate increased from 45 to 360 kg/ha in the early growth stage, consistent with the data of Fig. 3. On the other hand, the linear equations between yield and petiole sap nitrate-N showed smaller slopes (Fig. 7), meaning that yield increased gradually with the increase of petiole sap nitrate-N. The R2 were greater on 40 and 54 DAP. The petiole sap nitrate-N was more sensitive in distinguishing the yield difference at different N-rates than SPAD reading.
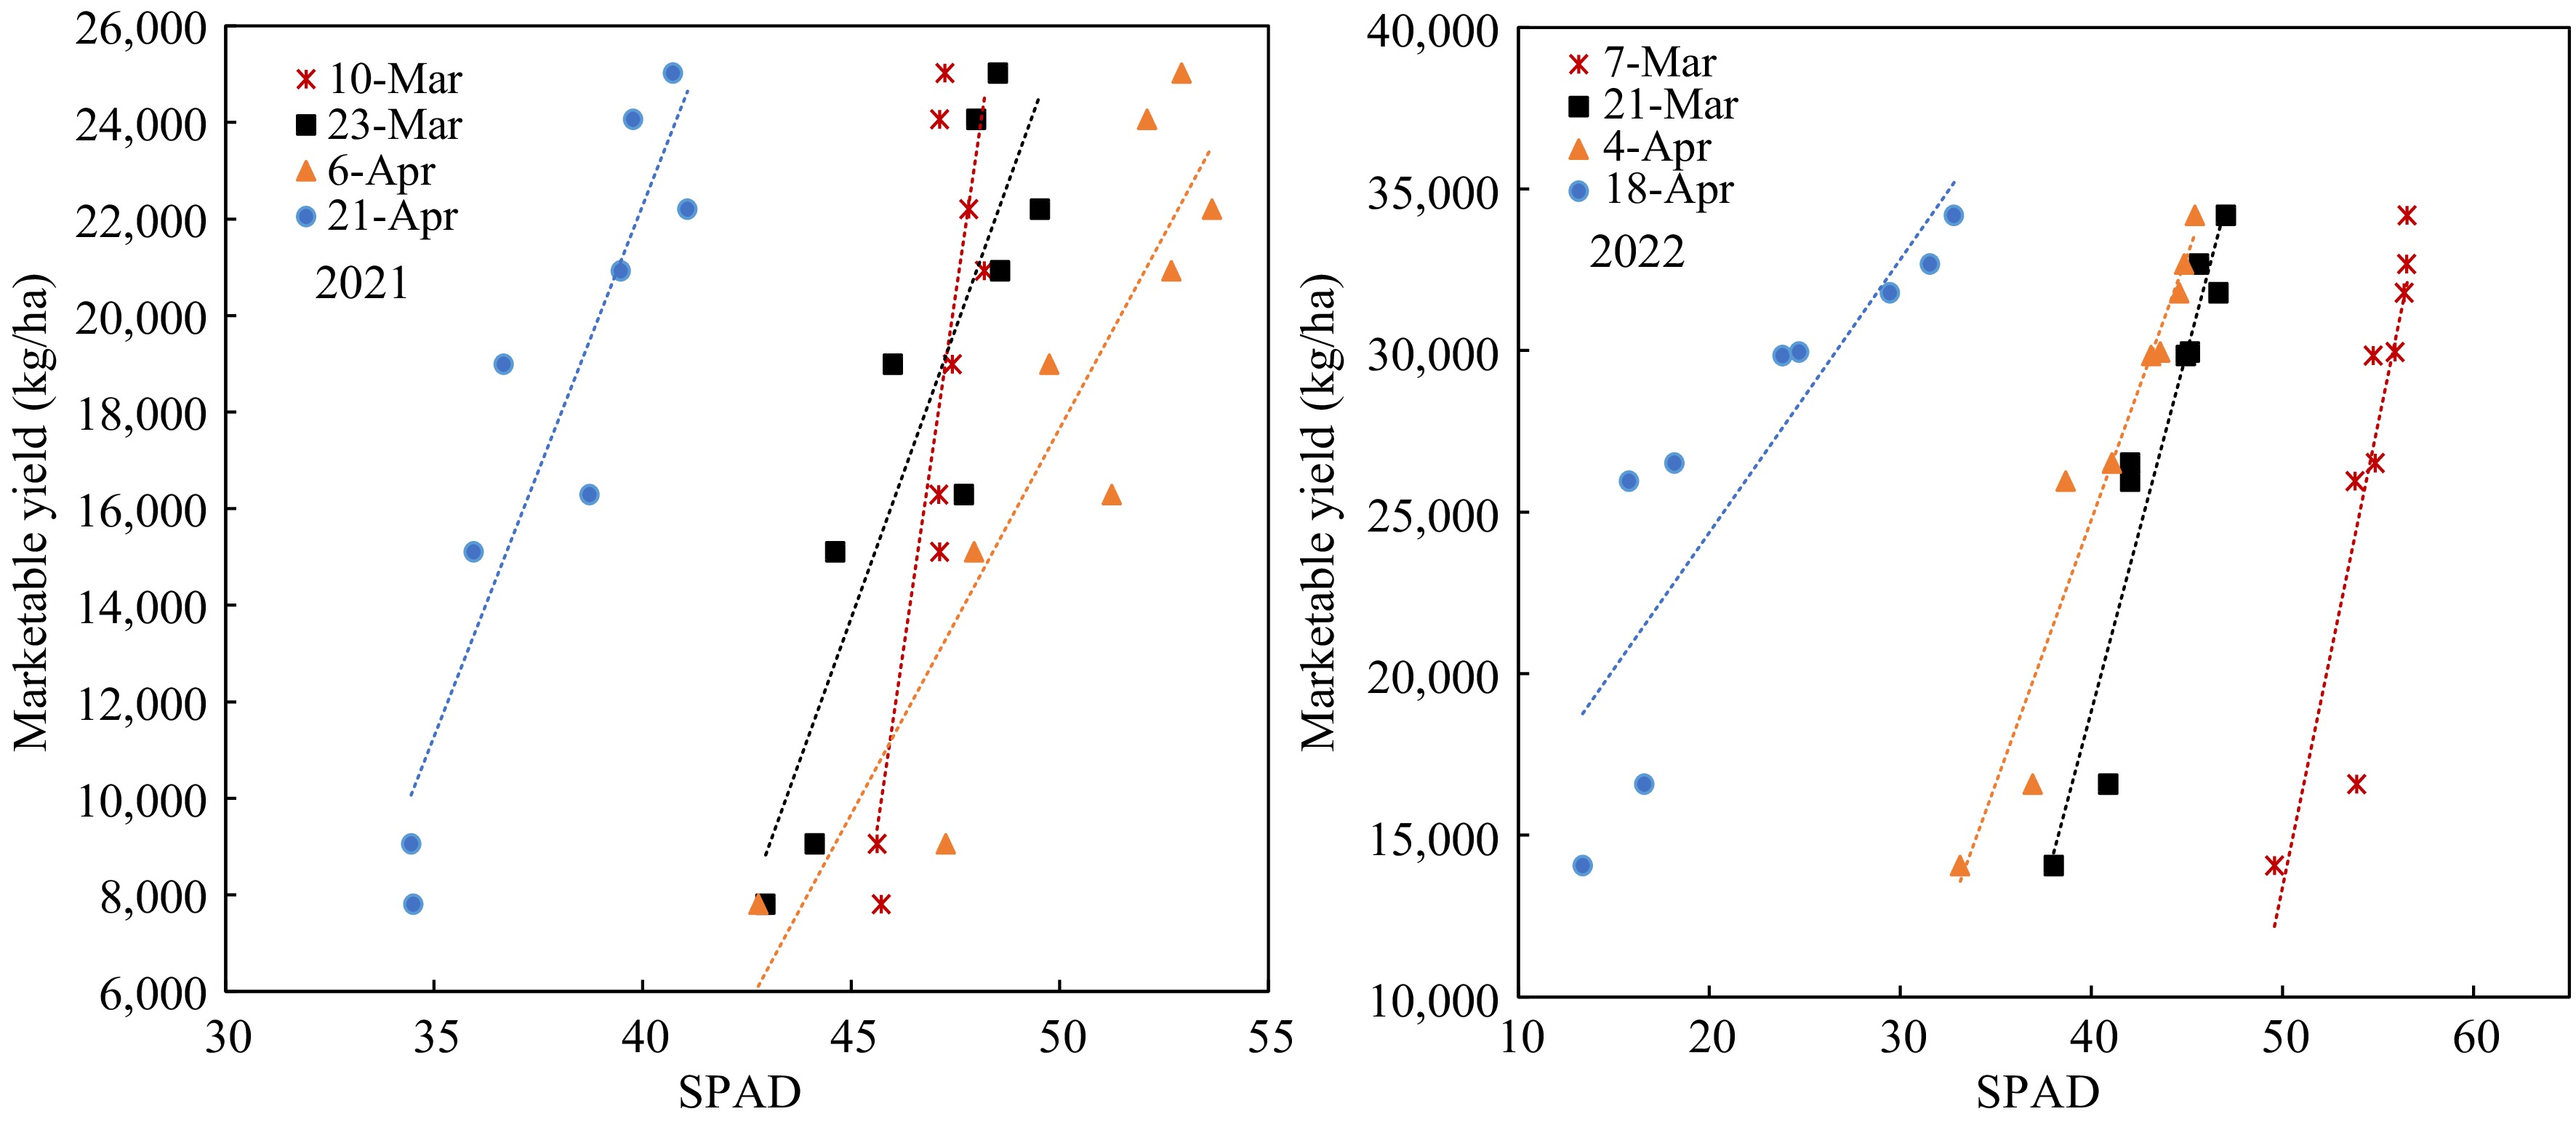
Figure 6.
Yield responses to SPAD value at different growth stages.
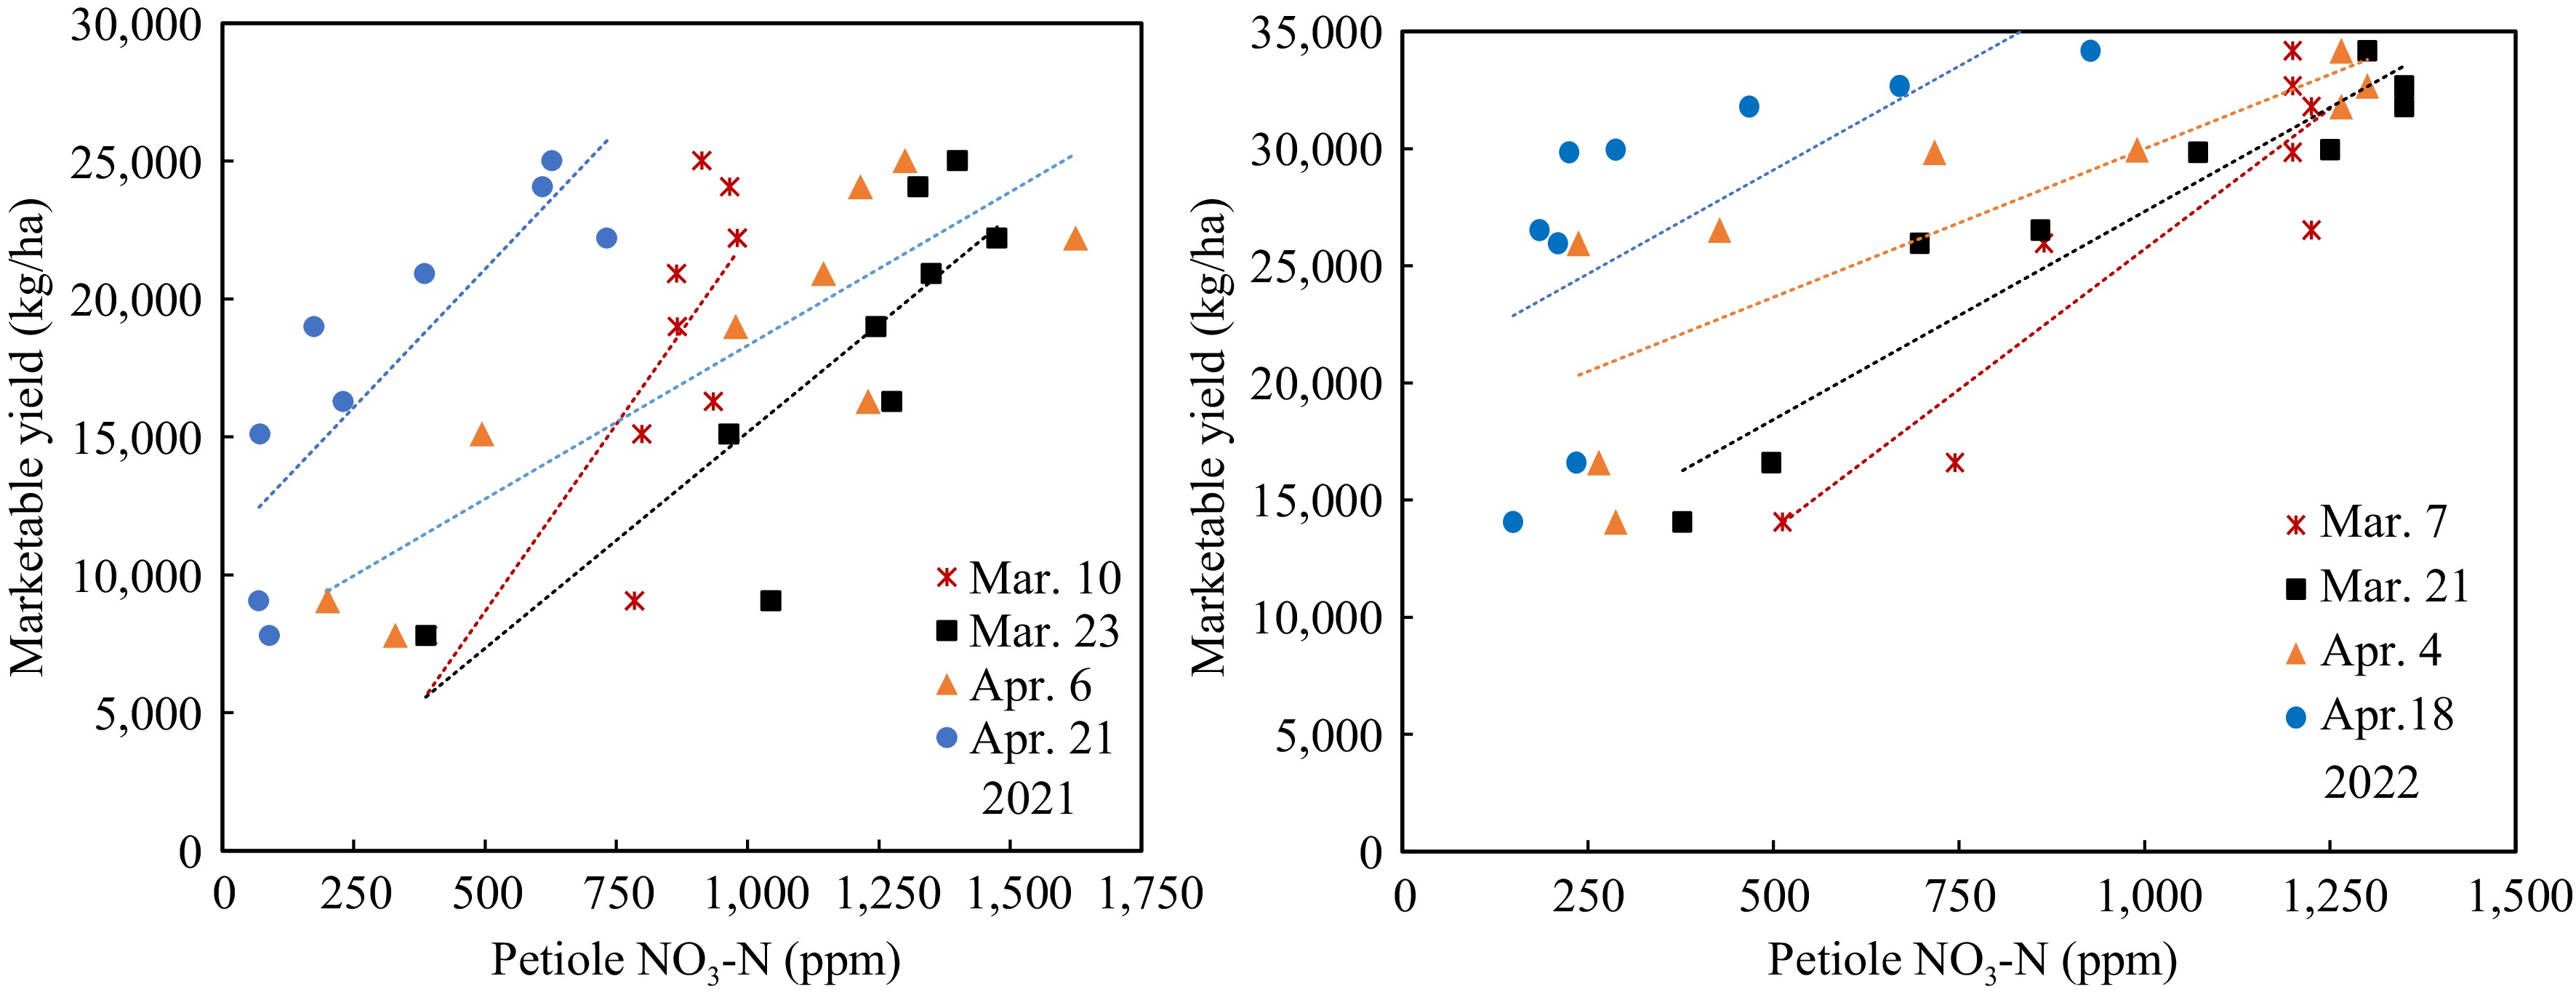
Figure 7.
Marketable yield response to petiole sap nitrate-N in 2021 and 2022 trials.
Potato tuber yield increased by increasing the N fertilization rate. In Brazil, the N fertilization rate was 175 kg/ha to achieve maximum marketable yield of potato 'Atlantic'[14]. In our two years trials, the N fertilization rates for maximum yield were 360 kg/ha and 333 kg/ha, which was approximately doubled as compared with the N rate in Brazil. This difference could be caused by differing soil types, weather, soil N, or cultivation practices. However, considering the potato tuber price and fertilizer price, the economic optimum N fertilization rates were 92%−95% of estimated N rates for maximum yield at low N fertilizer price and high potato price, or 86%−92% of the estimated N rates at high N fertilizer price and low potato price[14].
In the two years of trials, both SPAD readings and petiole sap nitrate-N concentrations had clear relations to N-rates. However, petiole sap nitrate-N concentration showed wider ranges and was therefore more sensitive for determining the plant N status difference between different N-rates. The SPAD readings were within narrower ranges regardless of N-rates, and besides the control values were not significantly different, especially in the early growth stage. SPAD readings could detect more separation between different N-rates in later growth stage, but that may be too late to side-dress the N fertilizer. It is difficult to define the threshold of SPAD values for N deficiency of specific potato cultivars due to differences in soil, weather, growth stage, growing season, and management practices[9]. Especially, when temperature, solar radiation, and intensive rainfall were less favorable for potato production, following N application by SPAD values did not guide proper N fertilization and resulted in reduced yield[7]. Minotti et al. reported that SPAD readings could identify severe N deficiency in potatoes but had limited value for identifying situations of marginal N deficiency[15]. Wu et al. also reported that petiole sap NO3-N concentrations were more sensitive than SPAD readings to N fertilization throughout the growing season[8]. Rodrigues in Portugal found that it was possible to know the N requirement by potato plants in the early growth stages[16]. The Portugal scientist emphasized that pre-side dress soil NO3-N and inorganic N were the best N indicators of the need of N application. Petiole sap nitrate-N concentration was more closely related to plant N-status between 20 to 60 d after emergence[6].
Our results showed that SPAD reading, and petiole sap nitrate-N concentration had weak linear relations, and there were great variations in different growth stages and between the two years. It was consistent with the report that SPAD values correlated well with the chlorophyll content and the nitrogen concentration in leaves but did not closely correlate with petiole sap nitrate concentration[17]. The error rates of N indicator by SPAD reading and petiole sap nitrate reading were greater than that of soil N and petiole nitrate by laboratory analysis[16]. The accuracy of the handheld meters also affected the results. For SPAD reading, leaf position on the plant stem affected the reliability of measurements. The 4th compound leaf is reportedly more suitable for estimating N by SPAD meter[18]. For petiole sap nitrate N concentration monitoring, 20 petioles are required for increased measurement accuracy[6].
Yields linearly increased with the increasing of the SPAD reading and petiole sap nitrate-N concentration, so it was unlike the quadratic regression of yield to N-rate, which can calculate the maximum yield according to the vertex point. As the equations changed much in different growth stages and growing seasons in Florida, it is hard to define the threshold of SPAD reading or petiole sap nitrate-N concentration. But SPAD meter is still considered as a good tool for diagnosis of nitrogen status as it is easier to use[17]. Individual dynamic threshold SPAD values in different growth stages should be established to using the SPAD readings as potato production guidance for N fertilization[10].
-
Potato yield increased quadratically with N-fertilizer rate from 0 to 360 kg/ha, without affecting the tuber quality except for the greater brown center incidence at 0 kg/ha. Both SPAD and petiole sap nitrate N readings had close relations with the N rate. However, SPAD could only distinguish the difference in plant N status in later growth stages, which can be too late to supplement the fertilizer as the shoots were too tall for a tractor to drive into the field and side-dress the rows. Petiole sap nitrate N concentration was more responsive and was able to start differentiating the plant N status between different N rates in early growth stages. It is important for sustainable N management for potato production by (1) improving the representativeness and accuracy of petiole sap nitrate nitrogen readings by testing more varieties of both chipping and table-stock potatoes and (2) establishing a dynamic threshold of petiole sap nitrate N reading for optimizing N application rates in individual growth stages for different potato cultivars.
-
The authors confirm contribution to the paper as follows: funding, study conception, experimental design, manuscript finalization: Liu G; performed the experiments, data collection, analysis and interpretation of results, and draft manuscript preparation: Li Q; performed the experiments, data collection, analysis and interpretation of results, and manuscript preparation: Denison J; data collection, and manuscript preparation: Gluck M. All authors reviewed the final version of this manuscript and granted approval for its publication.
-
The datasets generated during and/or analyzed during the current study are available from the corresponding author on reasonable request.
This work was financially supported by UF/IFA Extension Horticultural Sciences Department (Project Number: 60230065-103-3300-CRRNT). The UF/IFAS Hastings Agricultural Extension Center Crew supported and helped with the field trials conducted at HAEC, Hastings, Florida.
-
The authors declare that they have no conflict of interest.
- Copyright: © 2023 by the author(s). Published by Maximum Academic Press, Fayetteville, GA. This article is an open access article distributed under Creative Commons Attribution License (CC BY 4.0), visit https://creativecommons.org/licenses/by/4.0/.
-
About this article
Cite this article
Li Q, Denison J, Gluck M, Liu G. 2023. Comparison of SPAD-based leaf greenness and paralleled petiole sap nitrate concentrations for monitoring potato vine nitrogen status. Vegetable Research 3:30 doi: 10.48130/VR-2023-0030 

Comparison of SPAD-based leaf greenness and paralleled petiole sap nitrate concentrations for monitoring potato vine nitrogen status
- Received: 03 June 2023
- Accepted: 01 September 2023
- Published online: 09 November 2023
Abstract: Nitrogen status in potato vines plays an important role in potato production. Leaf greenness meters (SPAD-502) and portable petiole sap Cardy meters are two types of convenient and affordable handheld meters for nitrate-N testing to monitor nitrogen status. Two years of field trials were conducted to compare the feasibility and reliability of the two methods with either meter. 'Atlantic' Potato was grown at nine nitrogen rates from 0 (control) to 360 kg/ha with a 45 kg/ha increment. The nitrogen status was measured at 40, 54, 68, and 82 d after planting by using a SPAD-502 for leaf greenness and a Cardy meter for petiole sap nitrate nitrogen concentrations. Potato yield increased quadratically with the increasing of N fertilizer rate from 0 to 360 kg/ha. The result of this study shows both SPAD readings and petiole sap nitrate N concentrations had positive relationships with the N rates. The SPAD reading was able to distinguish the N status difference only in later growth stages. Petiole sap nitrate N concentration was more sensitive and started differentiating the plant growth with different N rates in early growth stage. Dynamic N fertilization guidance is imperative for optimizing yields with specific cultivars in different growth stages; more studies are needed to establish a dynamic threshold of SPAD reading for leaf greenness and petiole sap nitrate N concentration.
-
Key words:
- Nitrogen status monitoring /
- Tuber yield /
- Nitrogen application rate