-
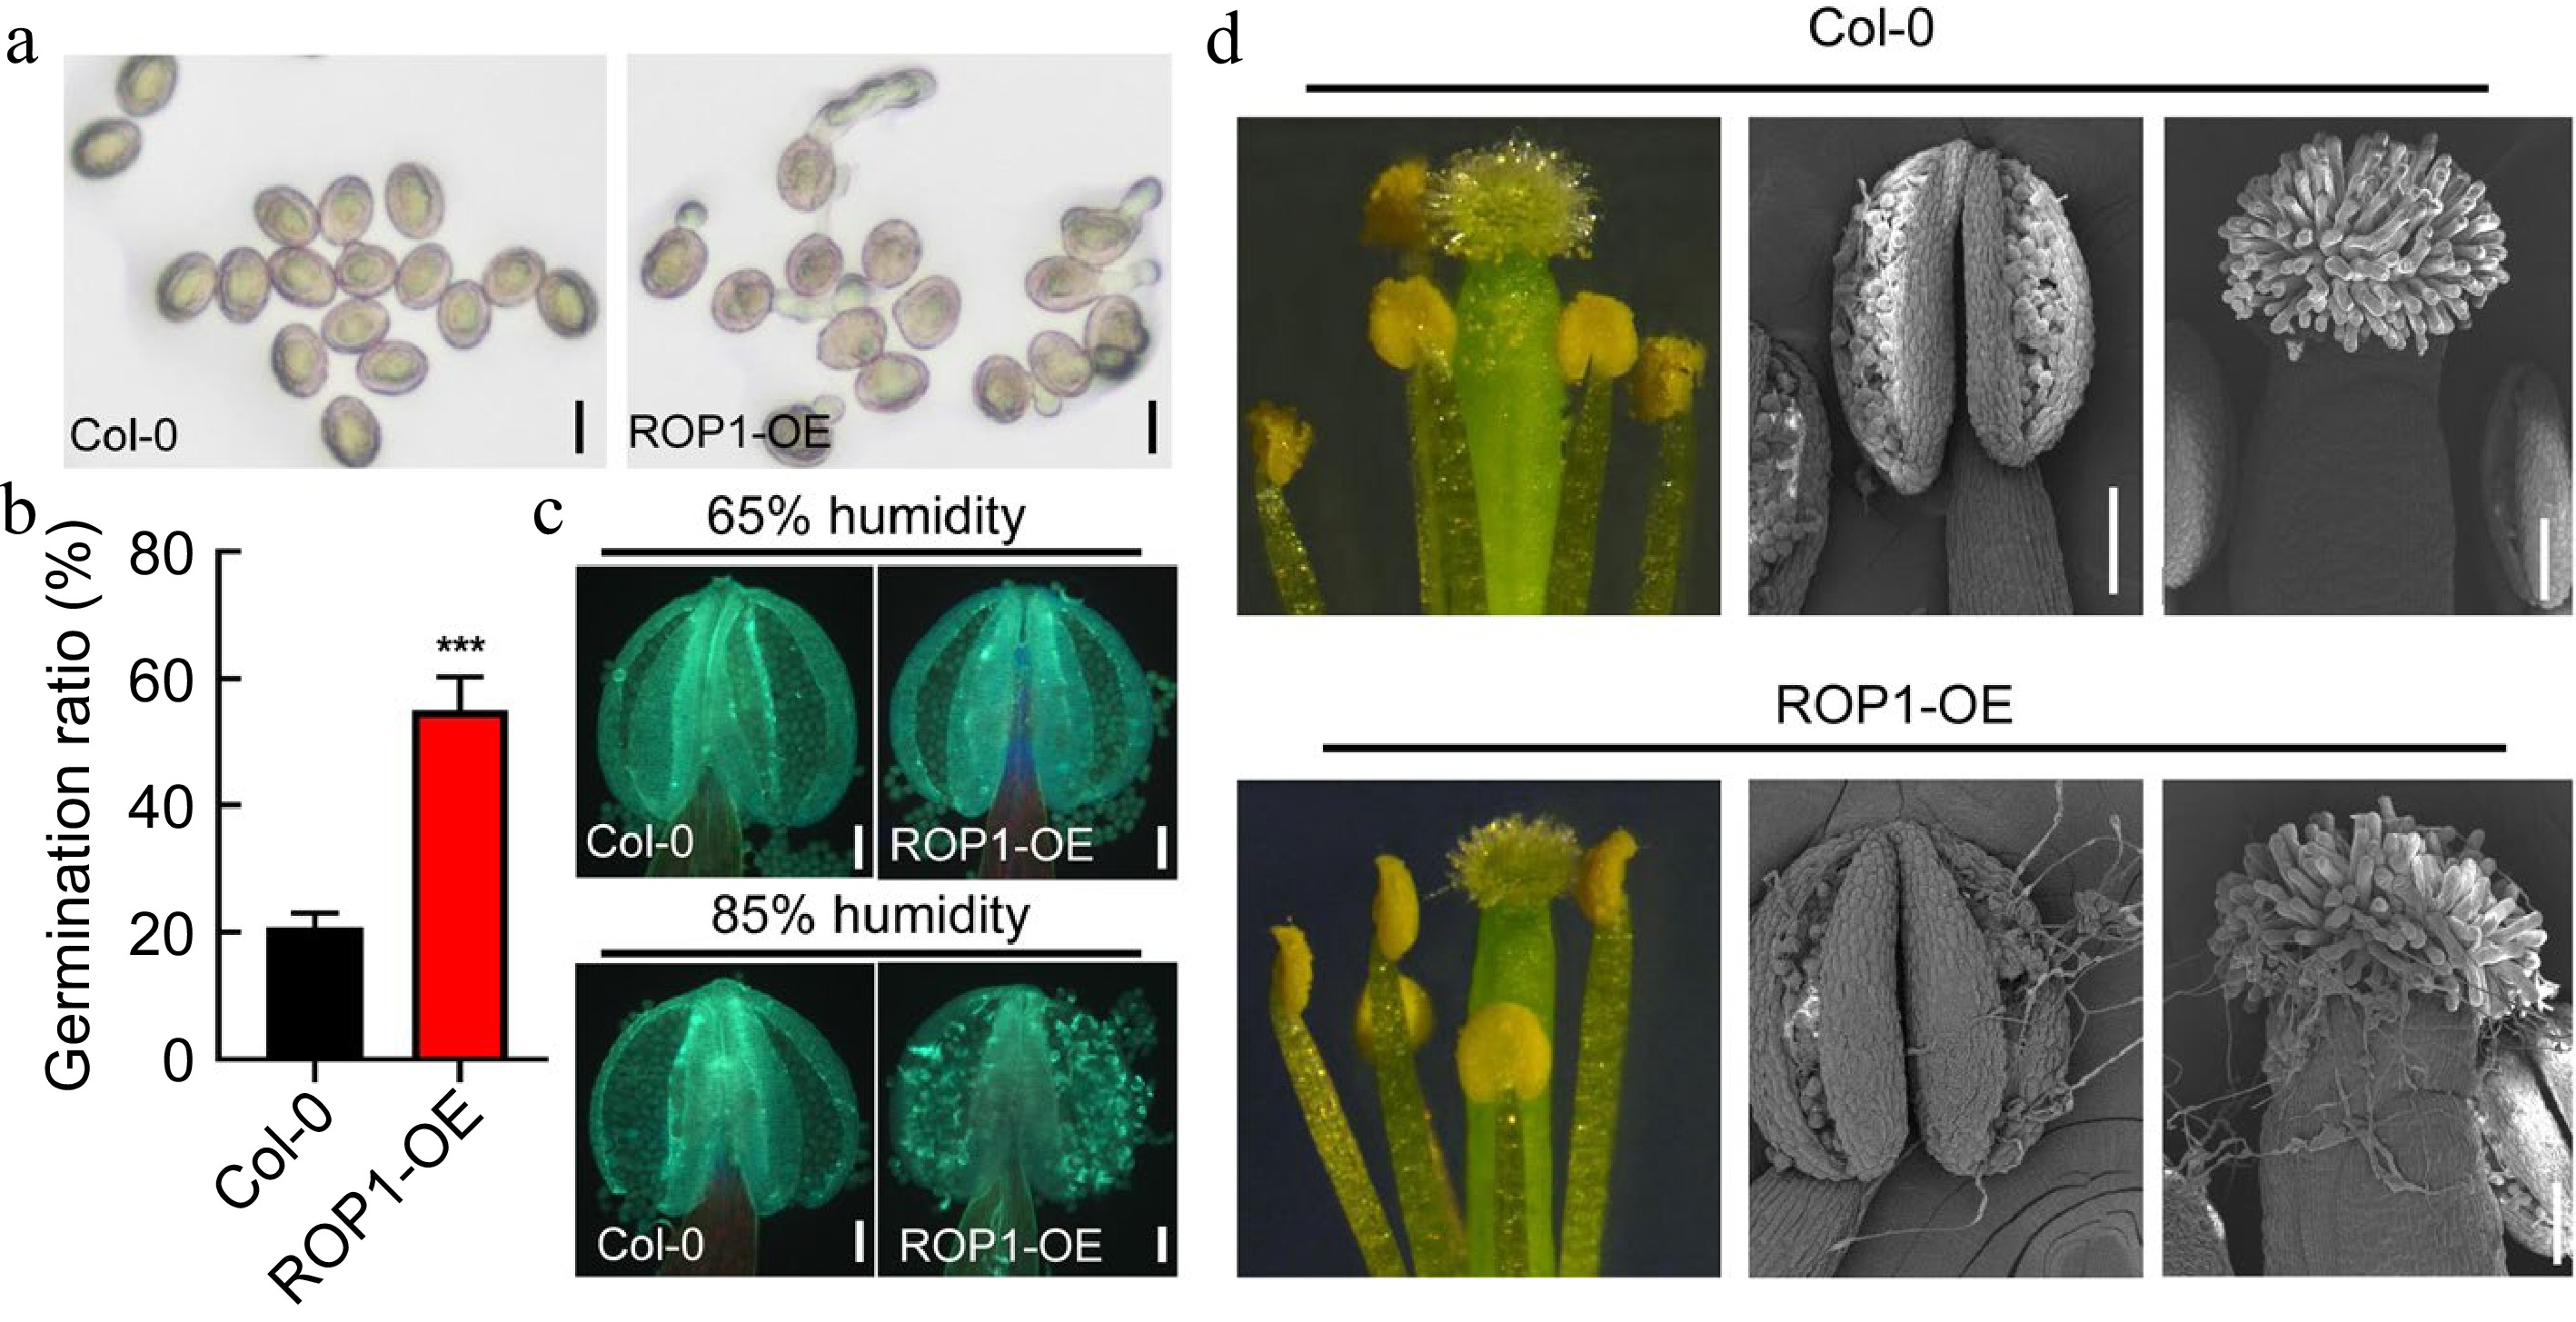
Figure 1.
ROP1 overexpression disrupts dormancy of pollen inside anther under moist environments. (a), (b) Images and germination ratio of Col-0 and ROP1-OE pollen 1 after imbibition. Scale bars = 20 μm. Error bars represent SD. Statistical significance was determined by Student's t-test (*** p < 0.001, n = 3). (c) Fluorescence images of Col-0 and ROP1-OE anther with or without pollen tubes stained with aniline blue. Scale bars = 100 μm. (d) Image of Col-0 and ROP1-OE anther and stigma under high humidity conditions. The red arrow points to the pollen tube. Scale bars = 500 μm in the left images. Scale bars = 100 μm in the images of the middle and right.
-
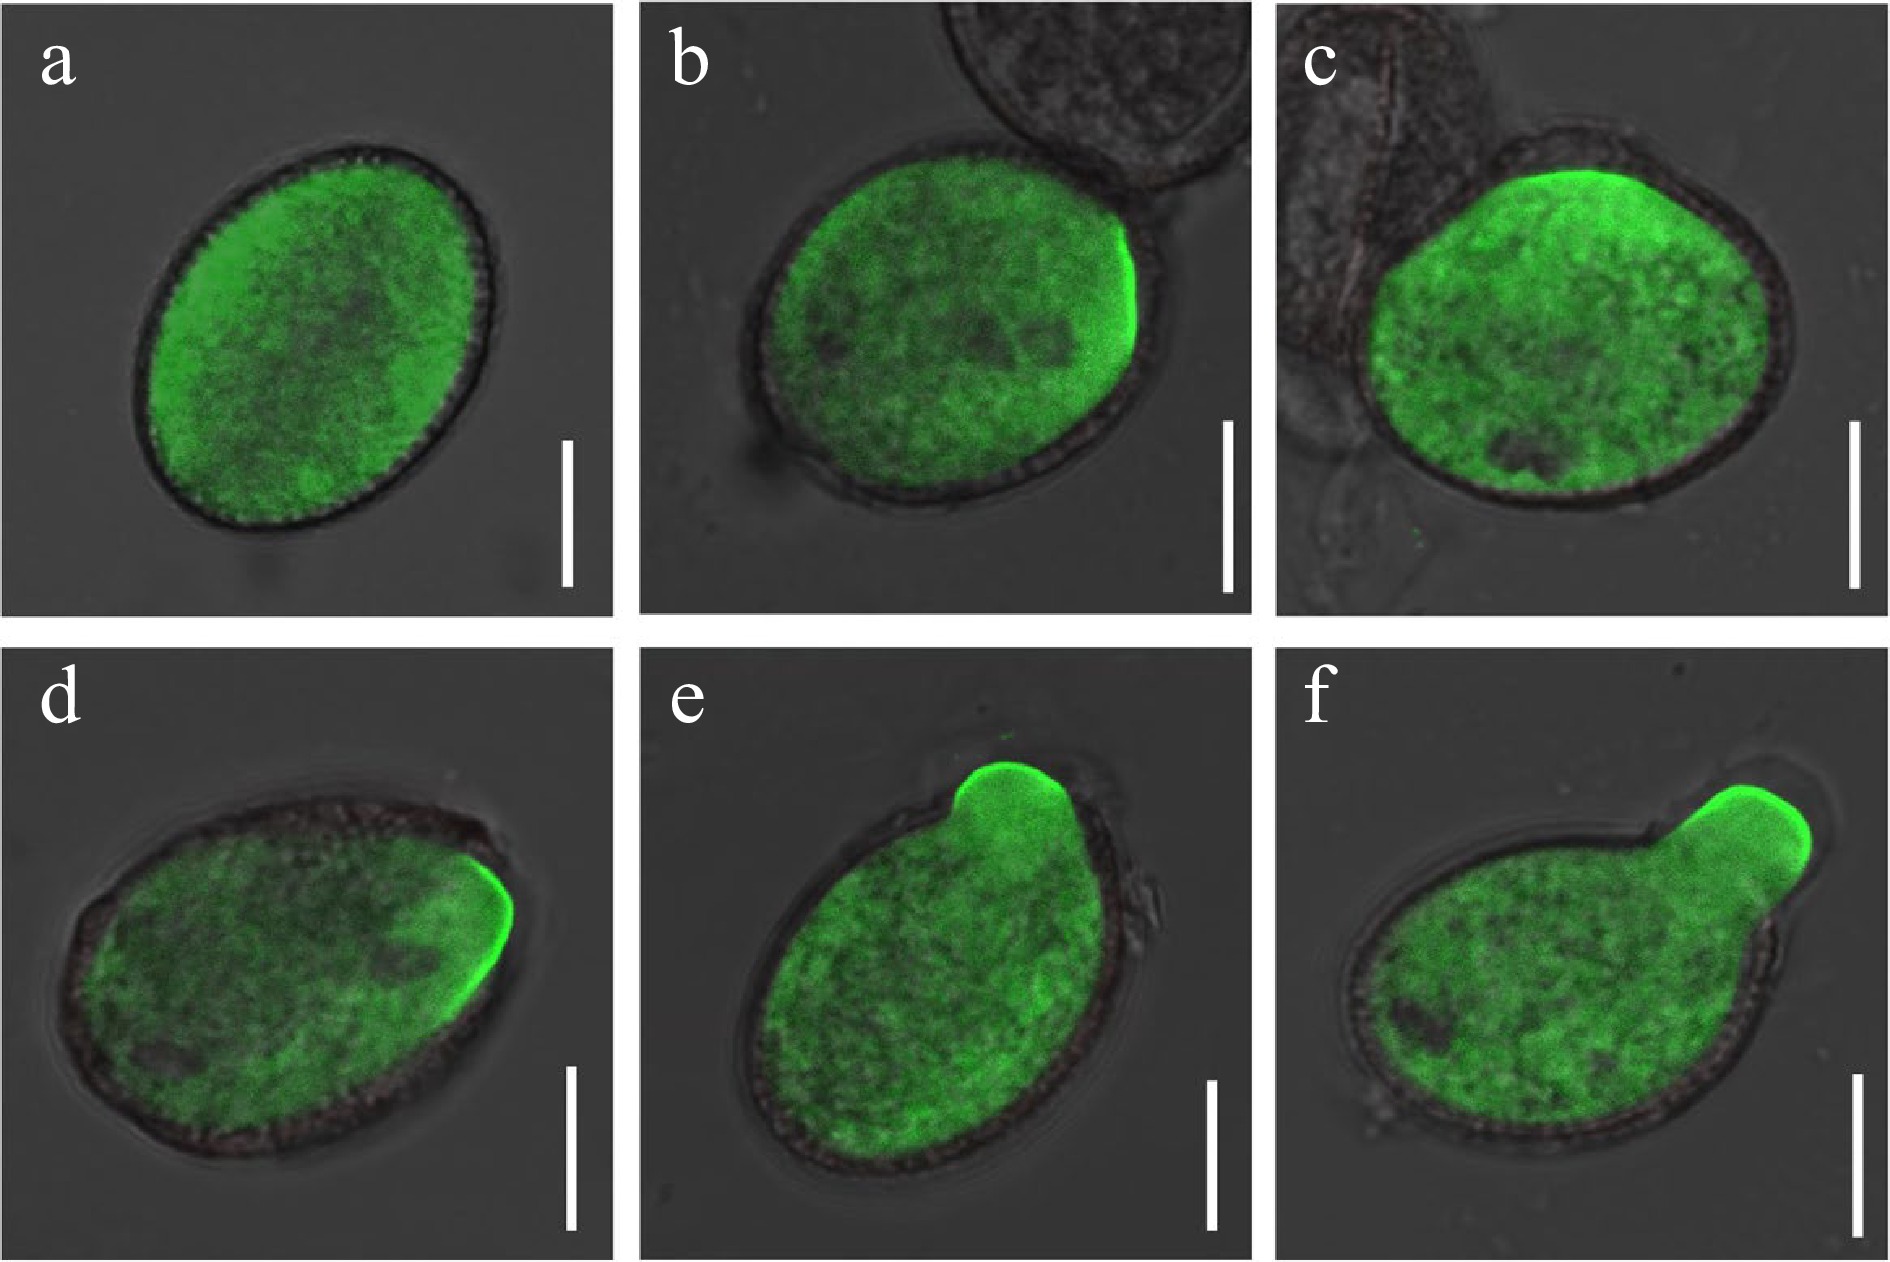
Figure 2.
Active ROP1 localization in the dormant pollen and germinated pollen of Arabidopsis. (a) CRIB4- GFP distribution in the dormancy mature pollen grain. (b)−(d) CRIB4-GFP polar distribution in the germinated site of pollen during germination. (e), (f) CRIB4-GFP polar distribution in the germinated and elongated pollen tube. Scale bars = 10 μm.
-
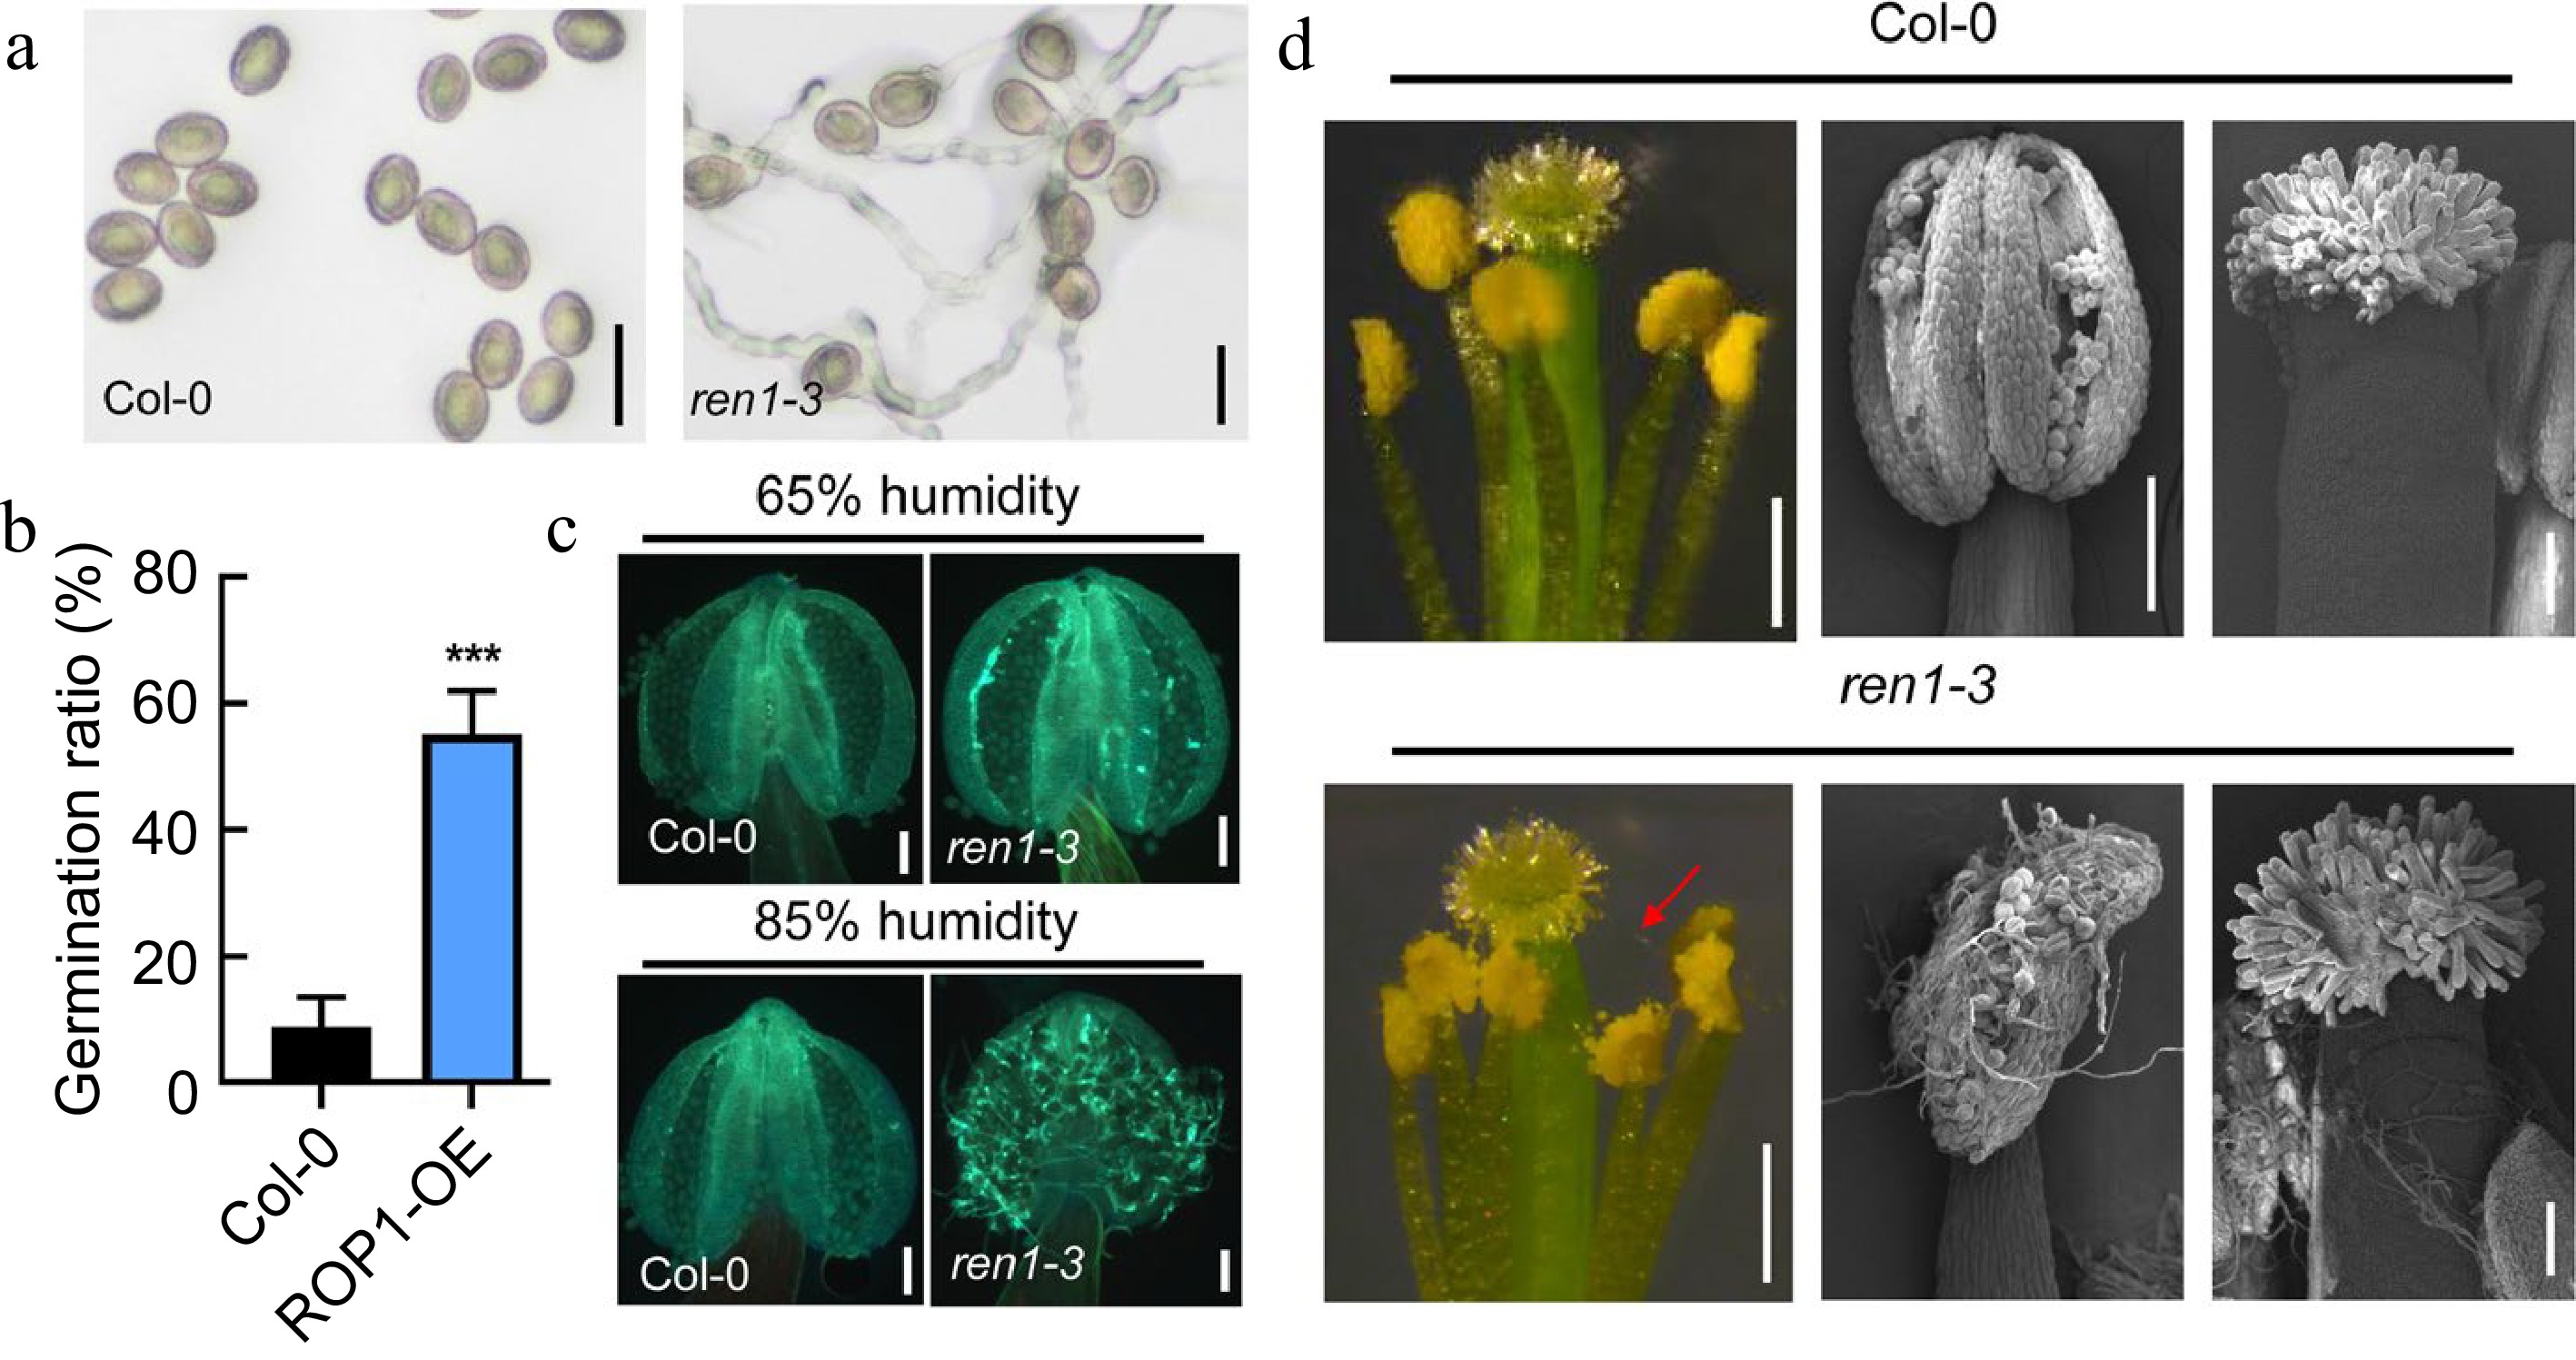
Figure 3.
Pollen dormancy was interrupted in the ren1 mutant under moist environments. (a), (b) Images and germination ratio of Col-0 and ren1-3 pollen 1 h after imbibition. Scale bars = 20 μm. Error bars represent SD. Statistical significance was determined by Student's t-test (*** p < 0.001, n = 3). (c) Fluorescence images of Col-0 and ren1-3 anther with or without pollen tubes stained with aniline blue. Scale bars = 100 μm. (d) Image of Col-0 and ren1-3 anther and stigma under high humidity conditions. The red arrow points to the pollen tube. Scale bars = 500 μm in the left images. Scale bars = 100 μm in the images of the middle and right.
-
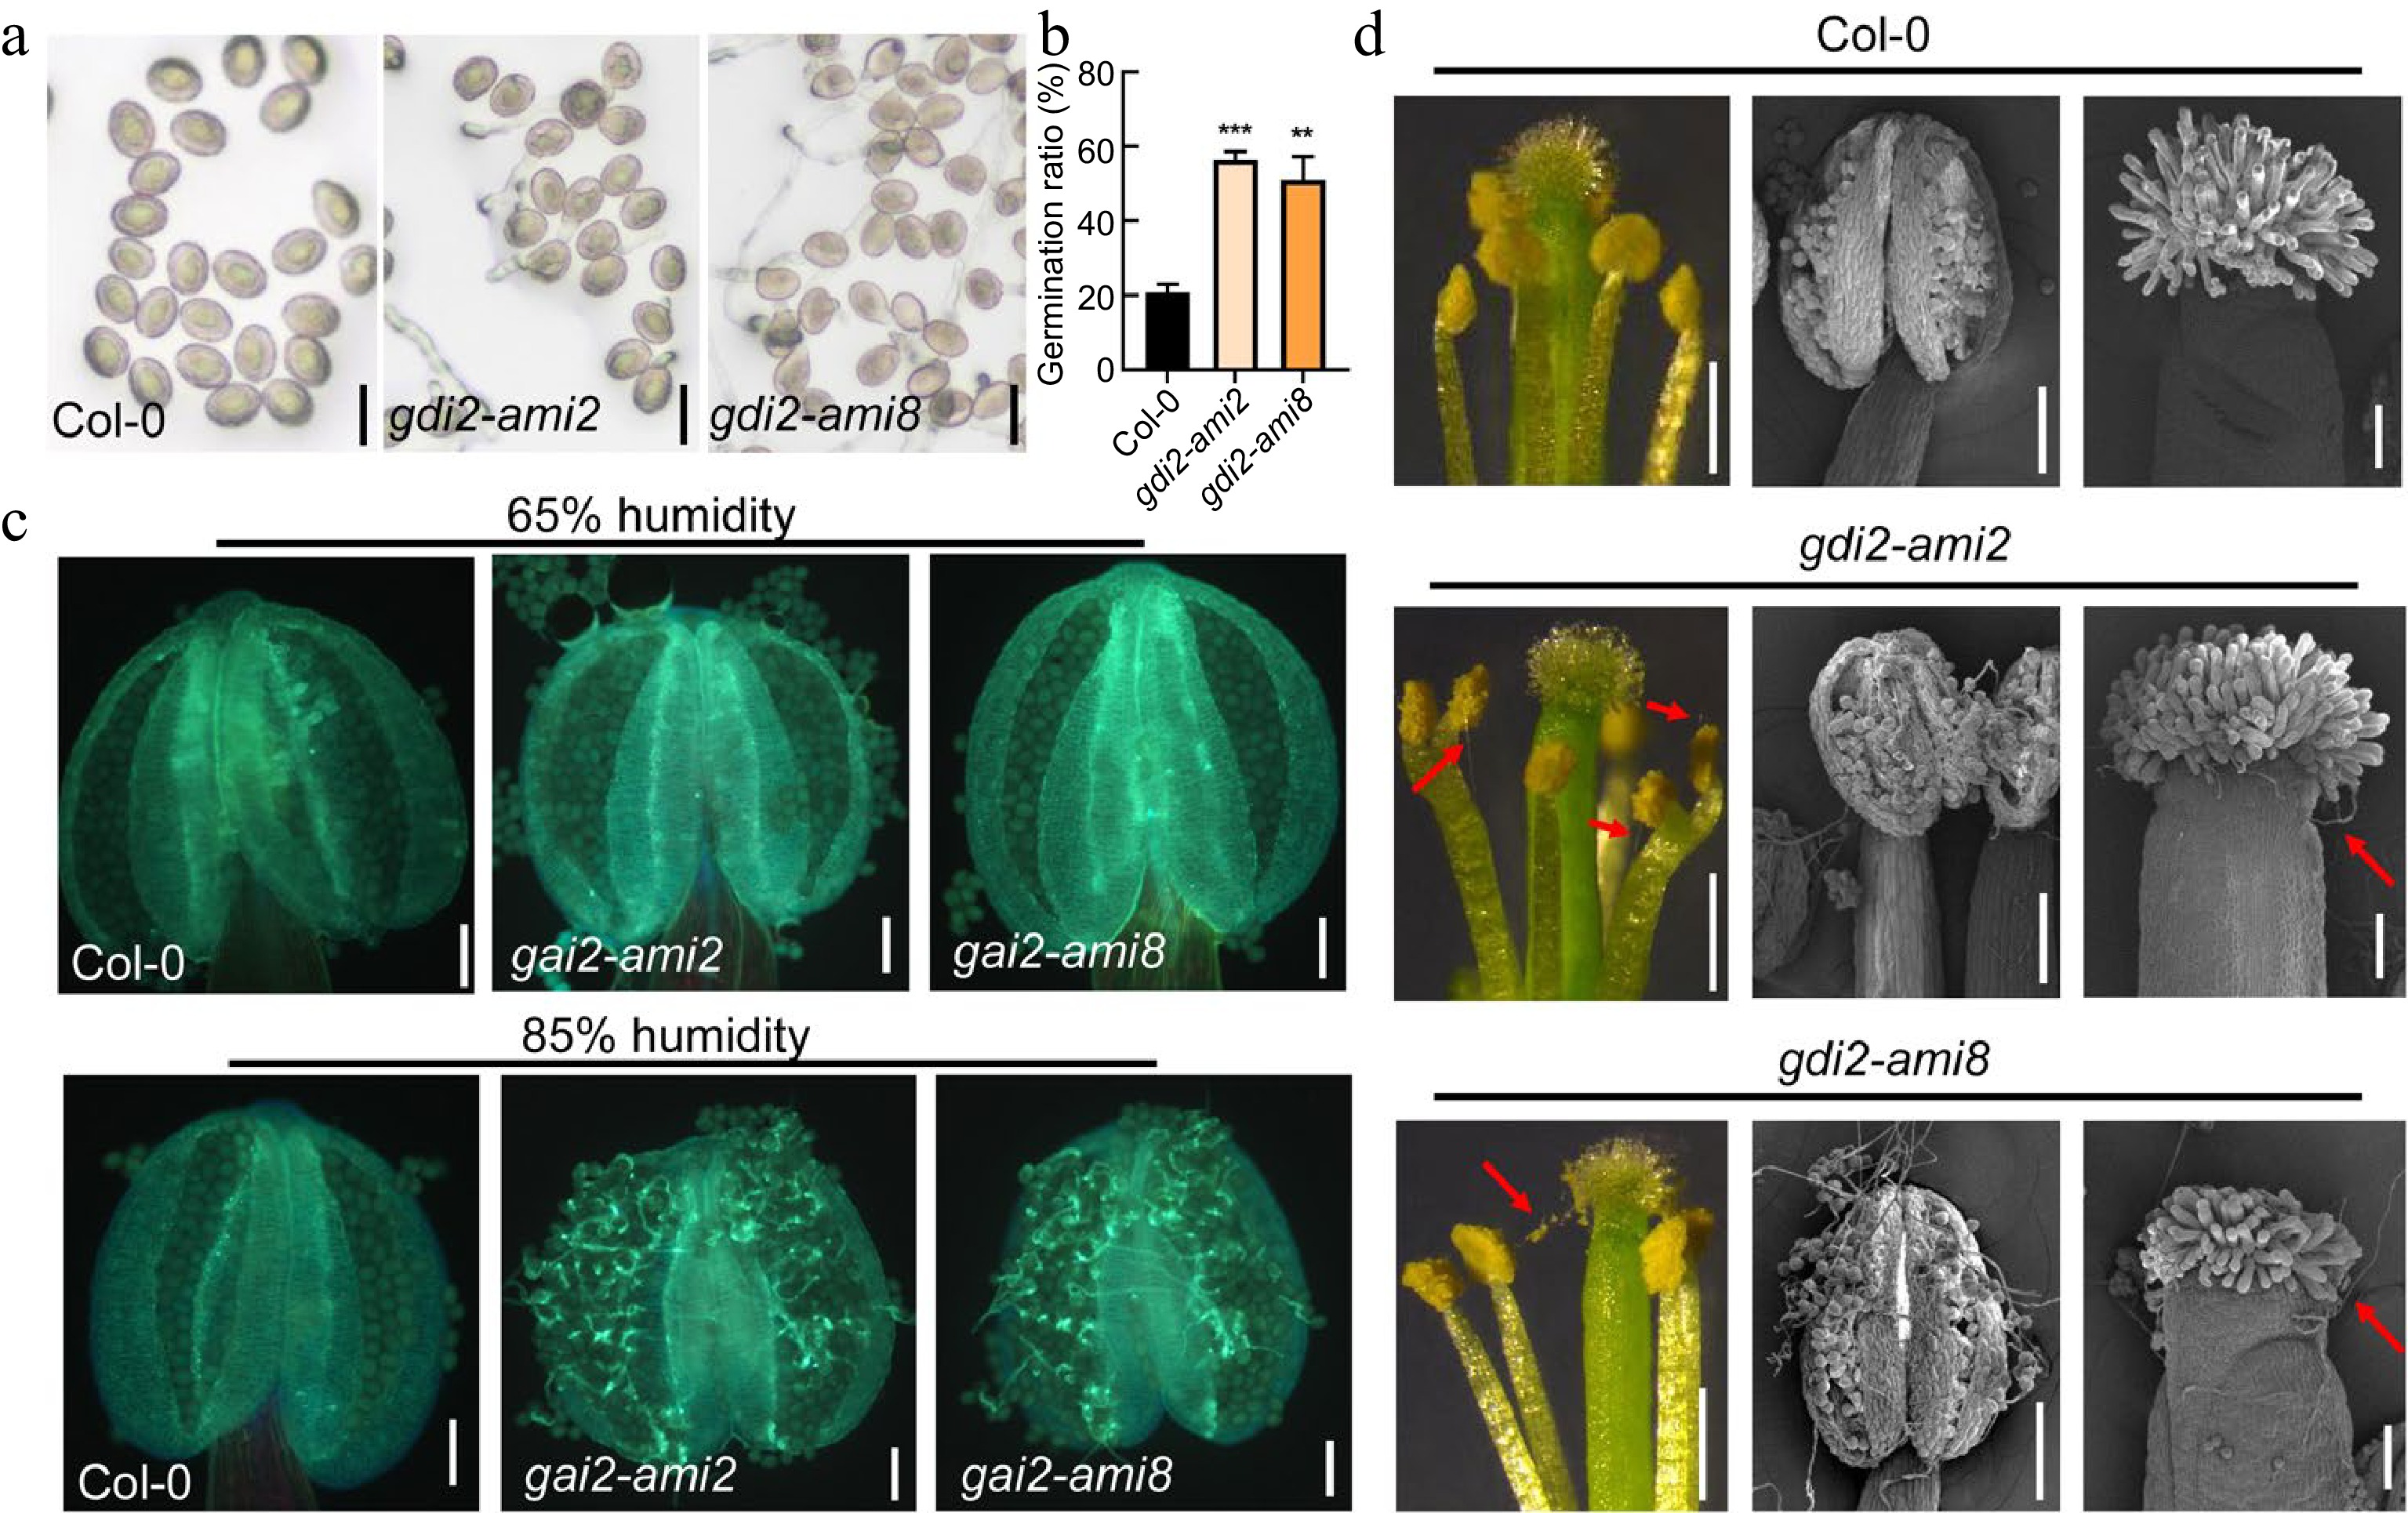
Figure 4.
Pollen dormancy was interrupted by the knockdown of GDI2 under moist environments. (a), (b) Images and germination ratio of Col-0, gdi2-ami2, and gdi2-ami8 pollen 1 hour after imbibition. Scale bars = 20 μm. Error bars represent SD. Statistical significance was determined by Student's t-test (*** p < 0.001, n = 3). (c) Fluorescence images of Col-0 and gdi2-ami anther with or without pollen tubes stained with aniline blue. Scale bars = 100 μm. (d) Image of Col-0, gdi2-ami2 and gdi2-ami8 anther and stigma under high humidity conditions. The red arrow points to the pollen tube. Scale bars = 500 μm in the left images. Scale bars = 100 μm in the images of middle and right.
-
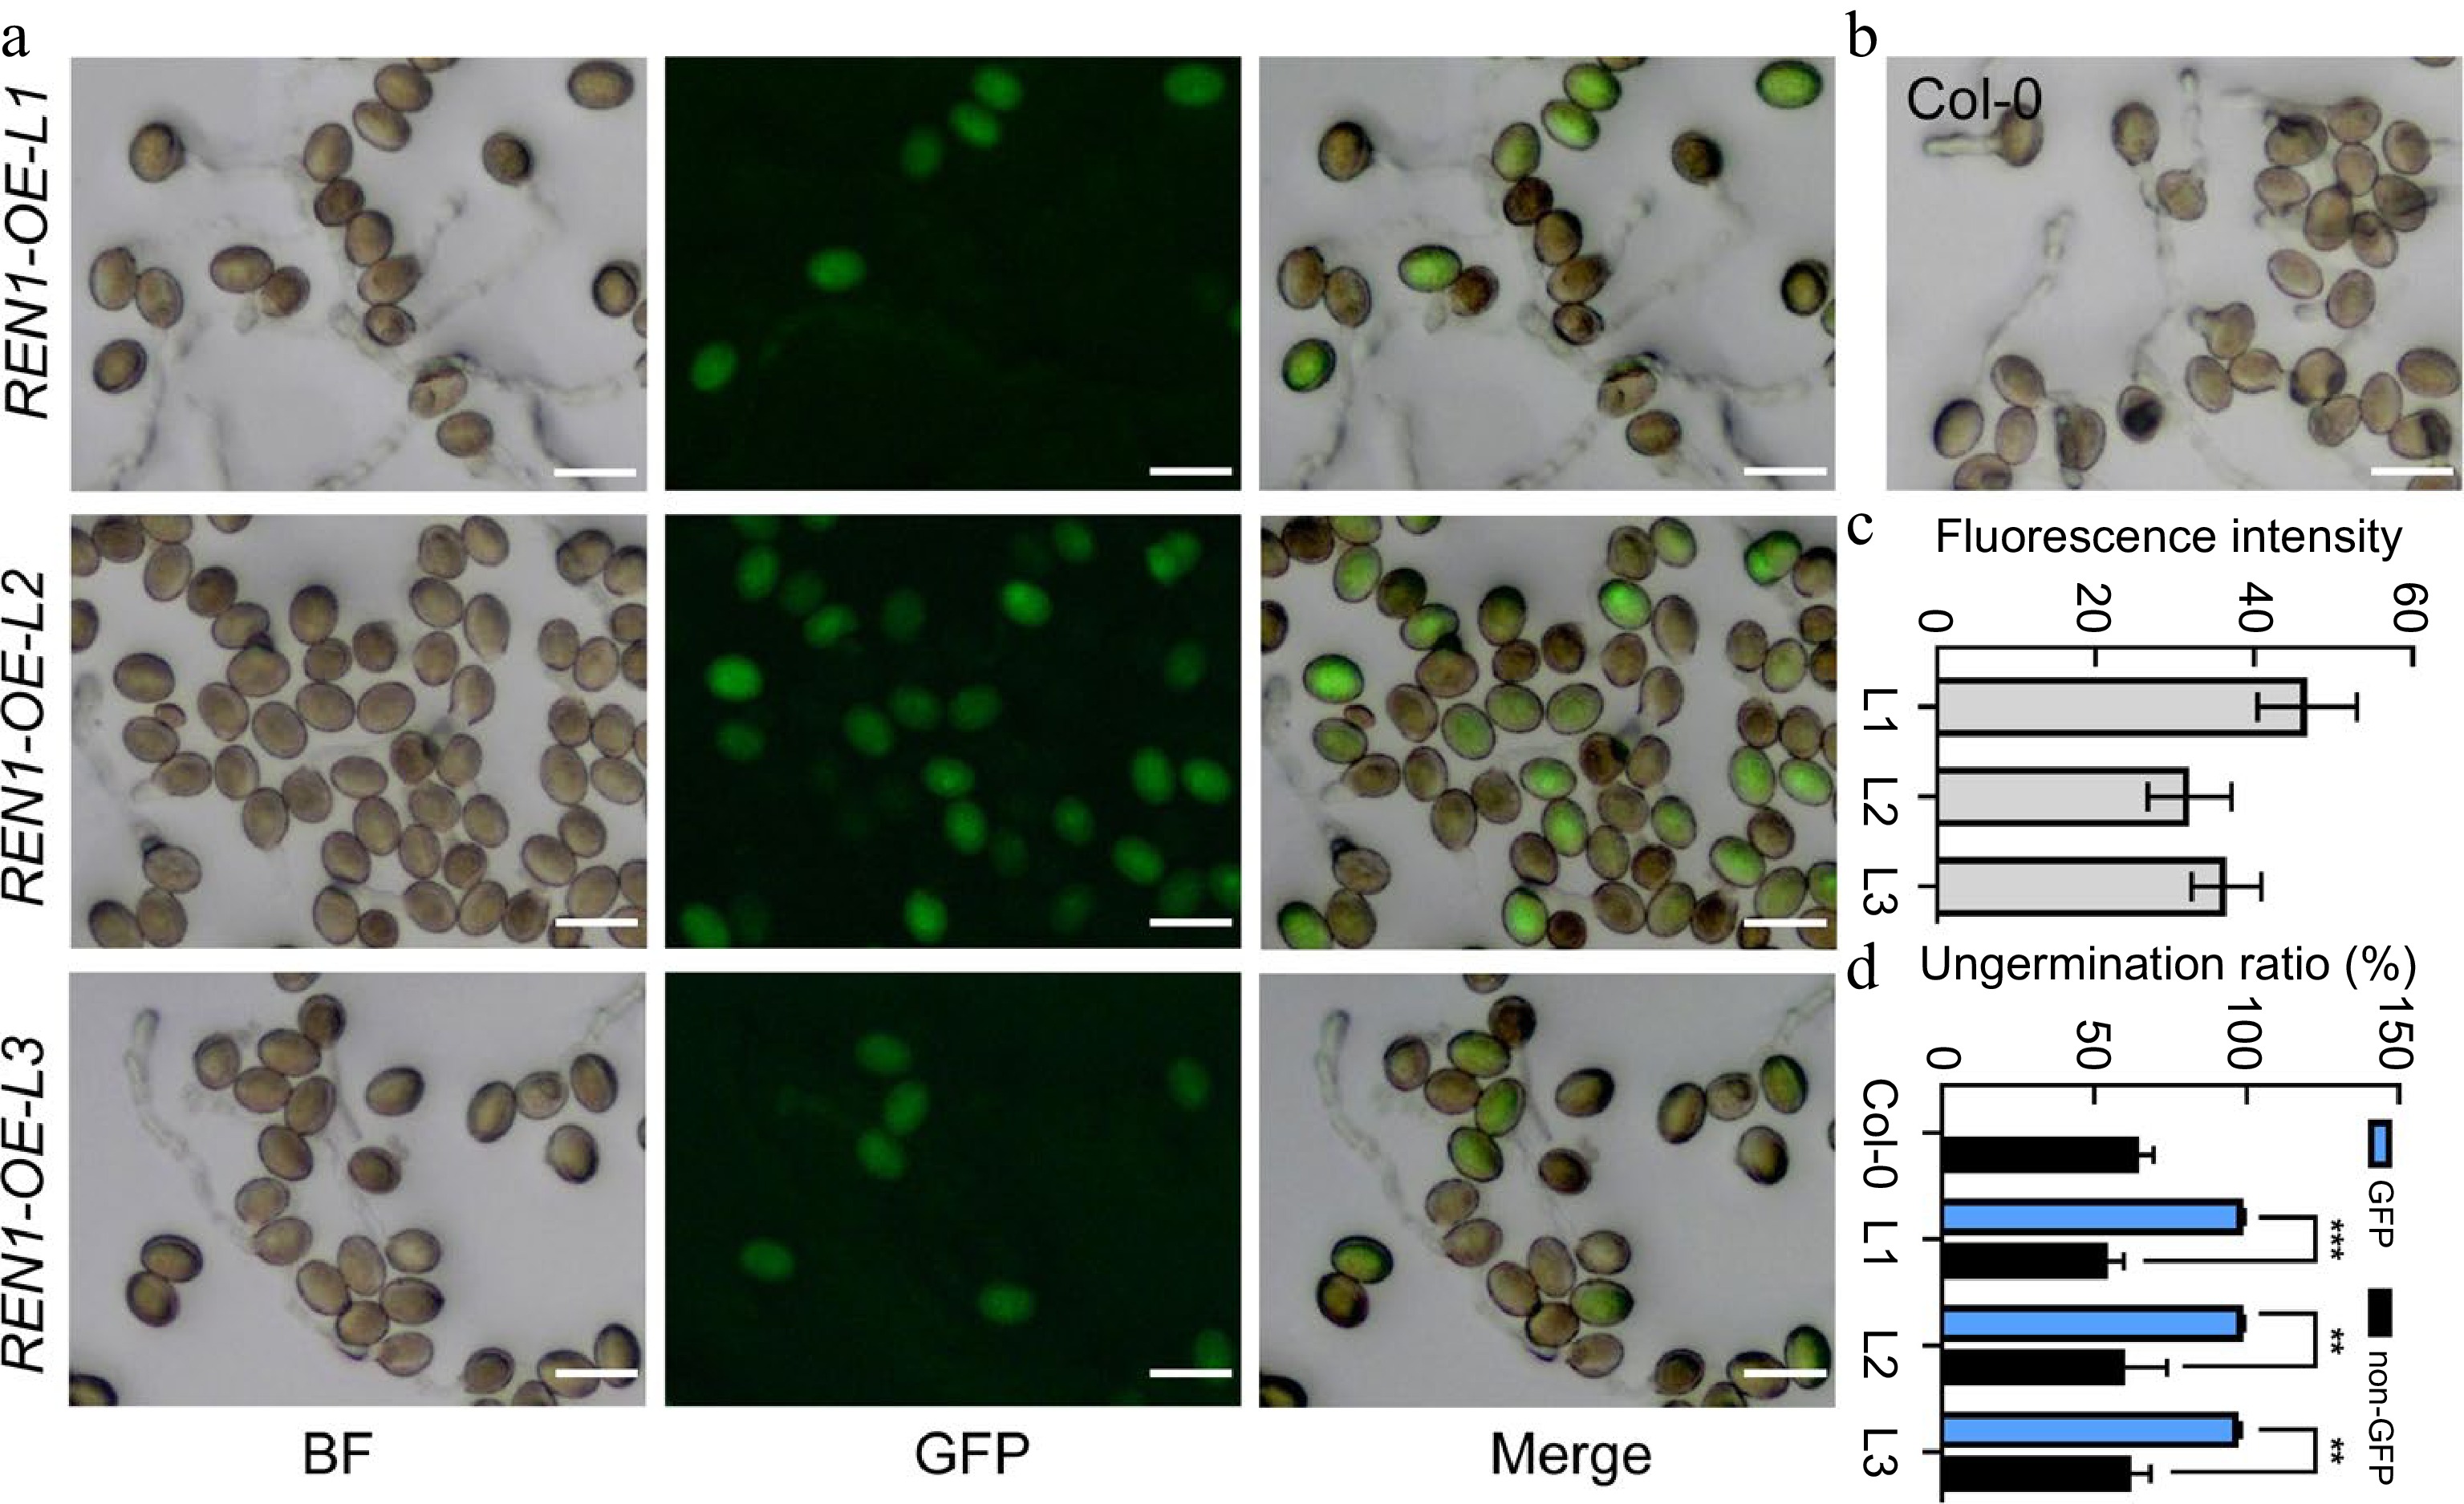
Figure 5.
Inhibition of pollen germination by REN1 overexpression. (a), (b) In vitro pollen germination of Col-0 and three REN1-OE transgenic lines (pREN1: GFP-REN1 CDS) after 3 h cultivation on PGM. Scale bars = 50 μm. (c) Fluorescence intensity assay of GFP-REN1 expressed pollens from three REN1-OE. (d) Germination ratio of Col-0 and REN1-OE pollens after 3 h cultivation on PGM. Statistical significance was determined by Student's t-test (** p < 0.01; *** p < 0.001), error bars represent SD, n = 3.
-
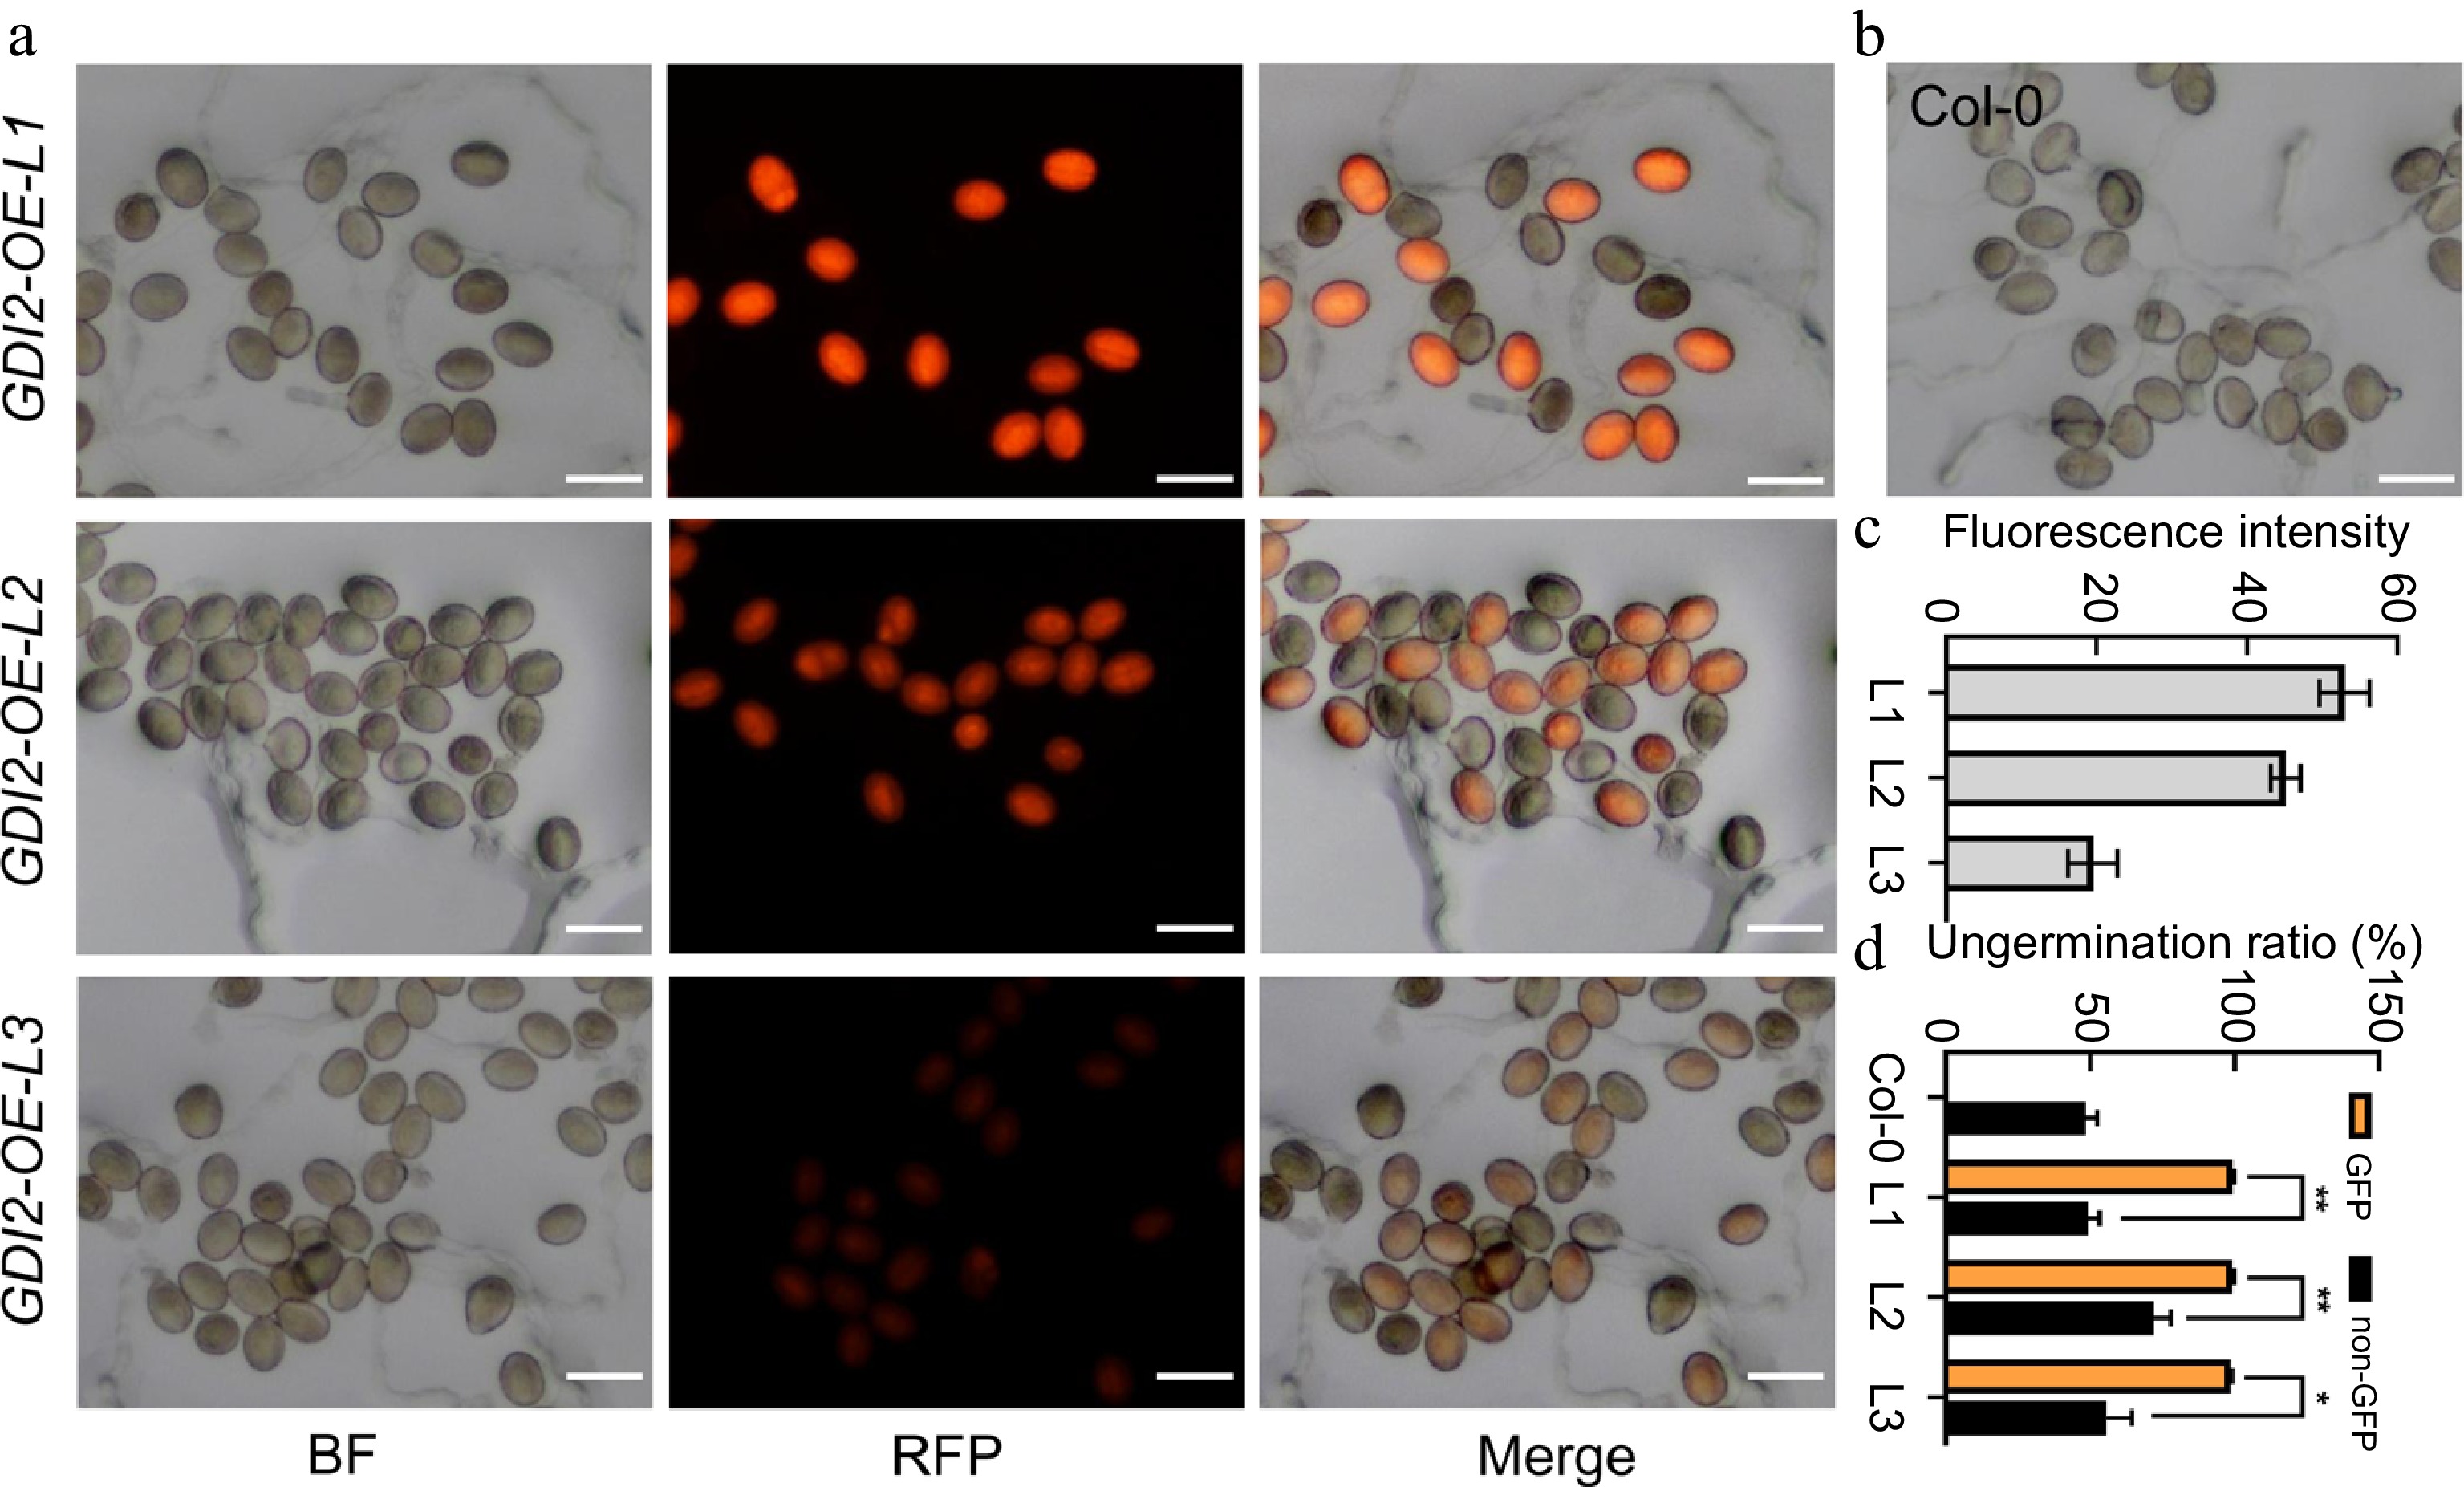
Figure 6.
Inhibition of pollen germination by GDI2 overexpression. (a), (b) In vitro pollen germination of Col-0 and three GDI2 OE transgenic lines (pGDI2:GDI2-RFP) after 3 h cultivation on PGM. Scale bars = 50 μm. (c) Fluorescence intensity assay of GDI2-RFP expressed pollens from three GDI2 OE transgenic lines. (d) Germination ratio of Col-0 and GDI2-OE pollens after 3 h cultivation on PGM. Statistical significance was determined by Student's t-test (* p < 0.05; ** p < 0.01; *** p < 0.001), error bars represent SD, n = 3.
-
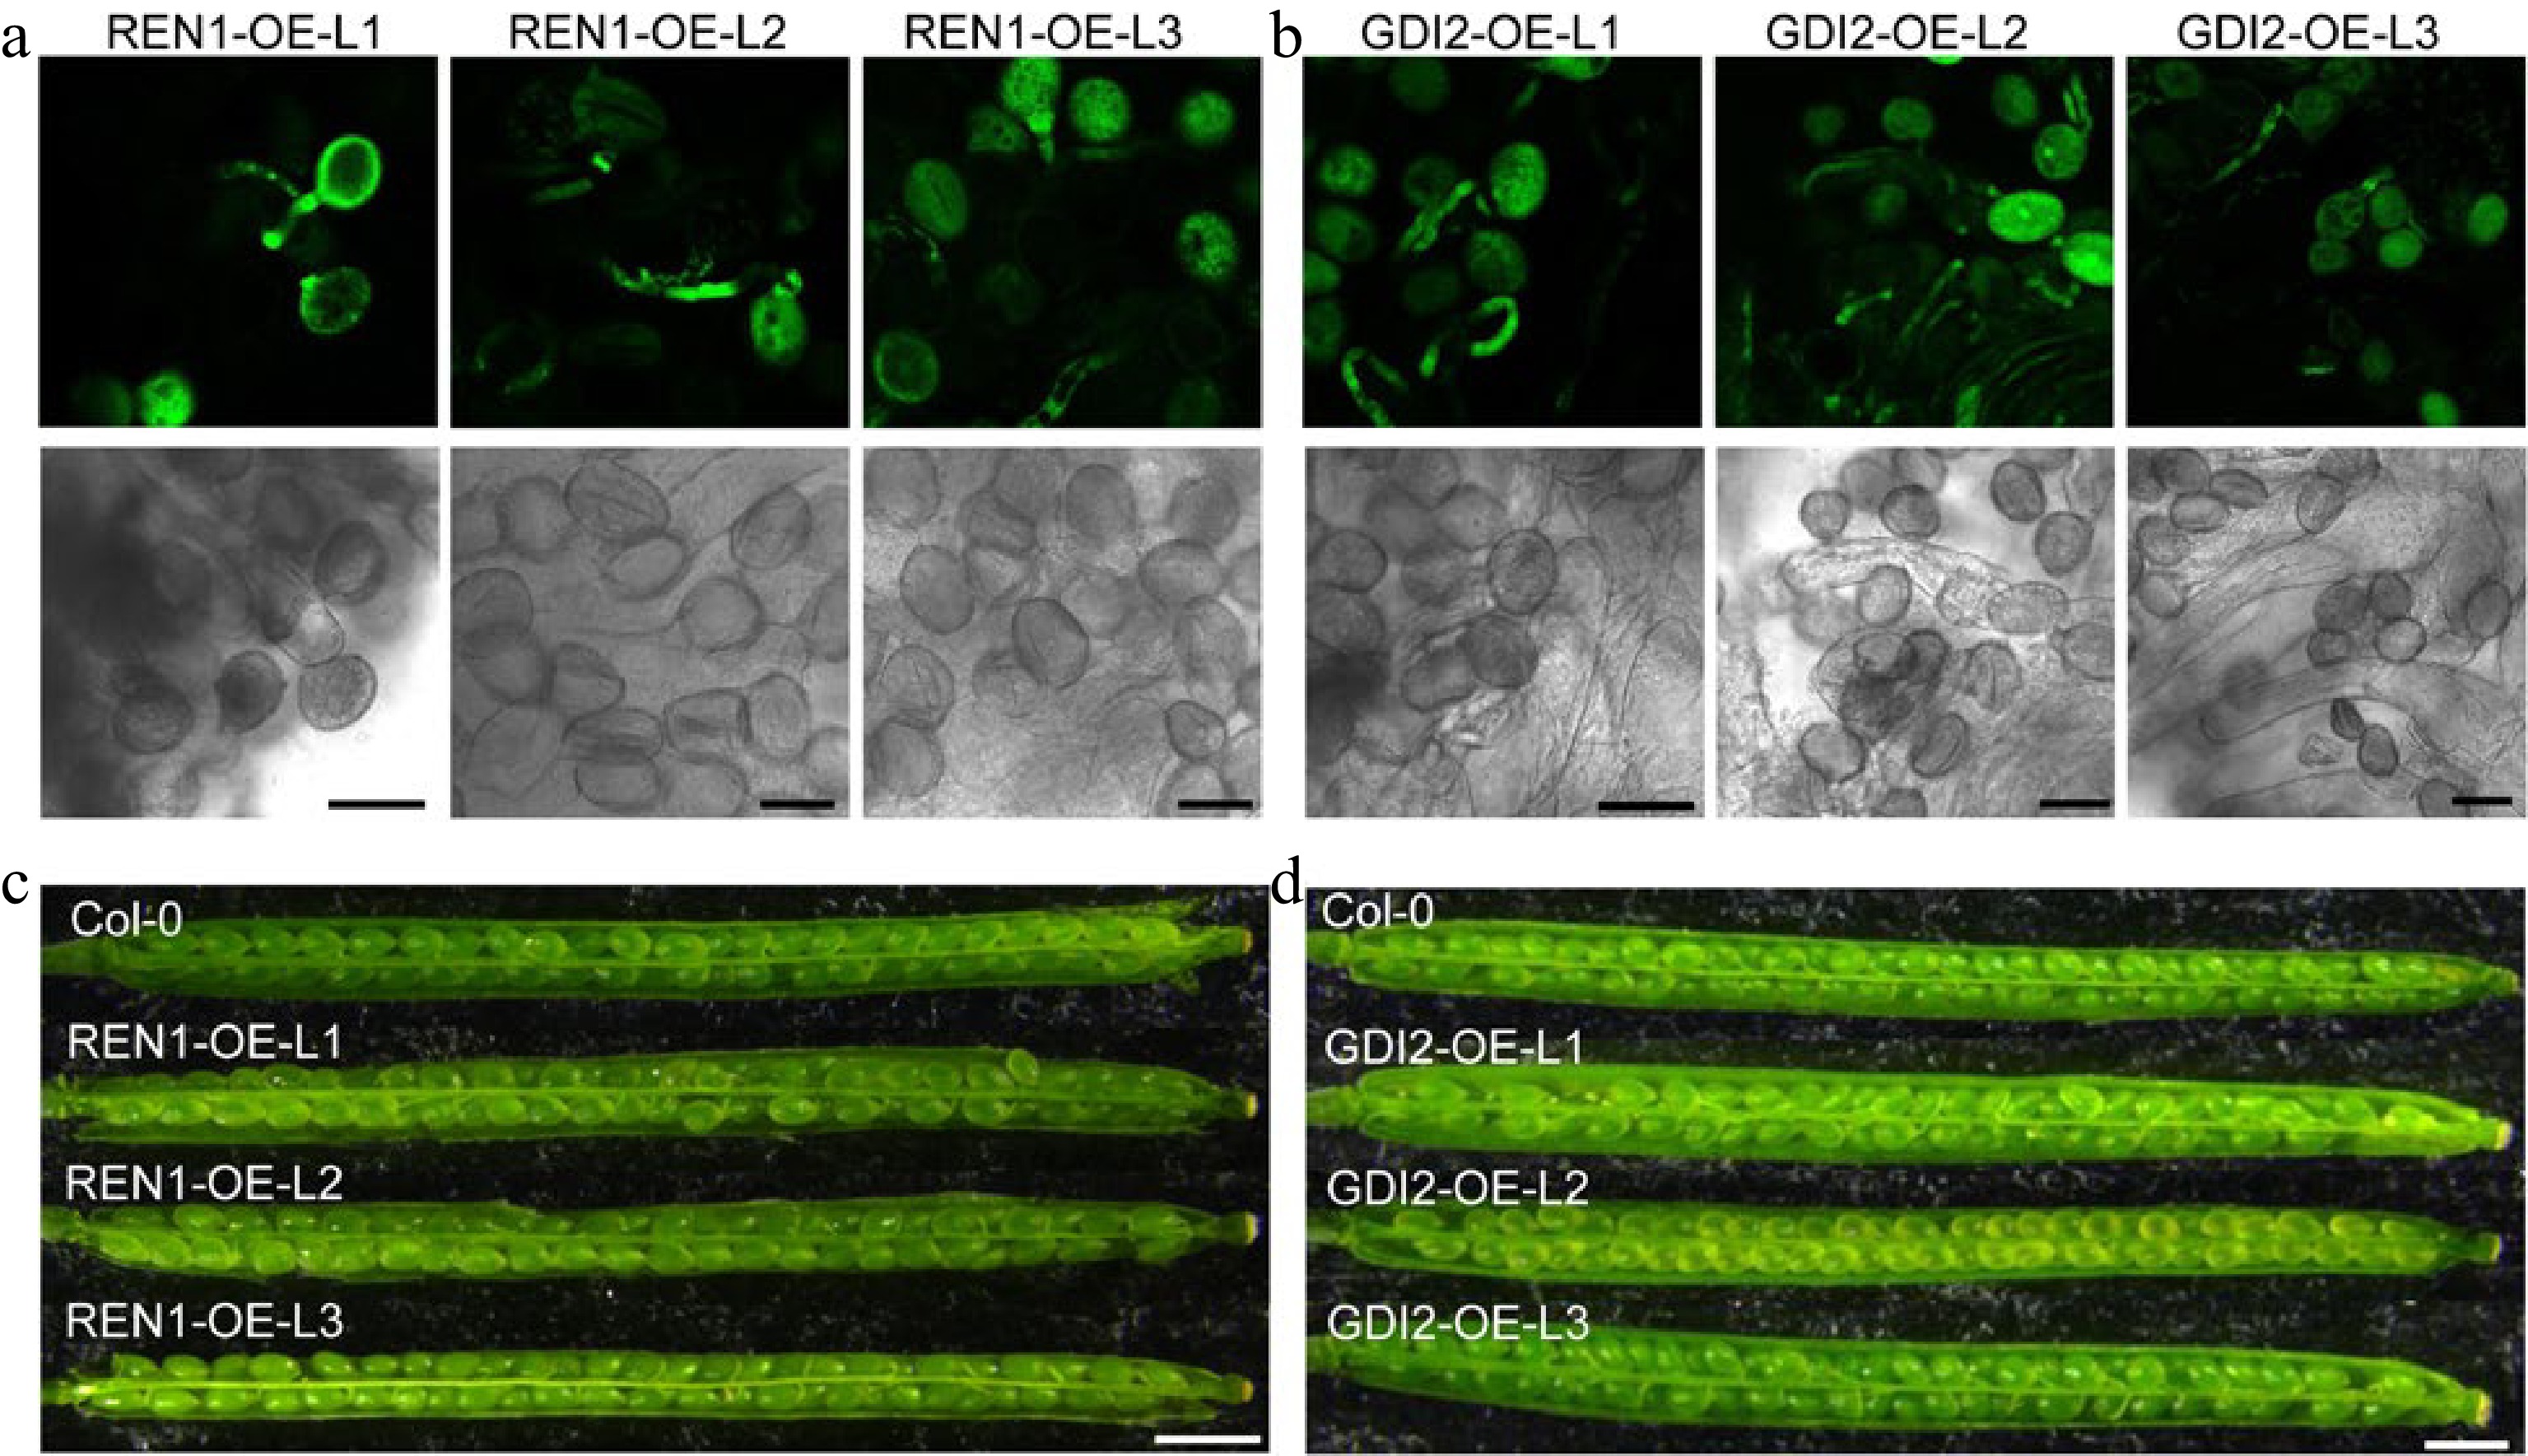
Figure 7.
Pollen germination on stigma and silique of REN1 or GDI2 overexpression lines. (a) Germination of GFP labeled REN1-overexpressed pollens on Arabidopsis stigma. Scale bars = 25 μm. (b) Germination of GFP labeled GDI2-overexpressed pollens on Arabidopsis stigma. Scale bars = 25 μm. (c) The developed silique of self-fertilized wild type and REN1-overexpressed lines. Scale bars = 2 mm. (d) The developed silique of self fertilized wild type and GDI2-overexpressed lines. Scale bars = 2 mm.
Figures
(7)
Tables
(0)