-
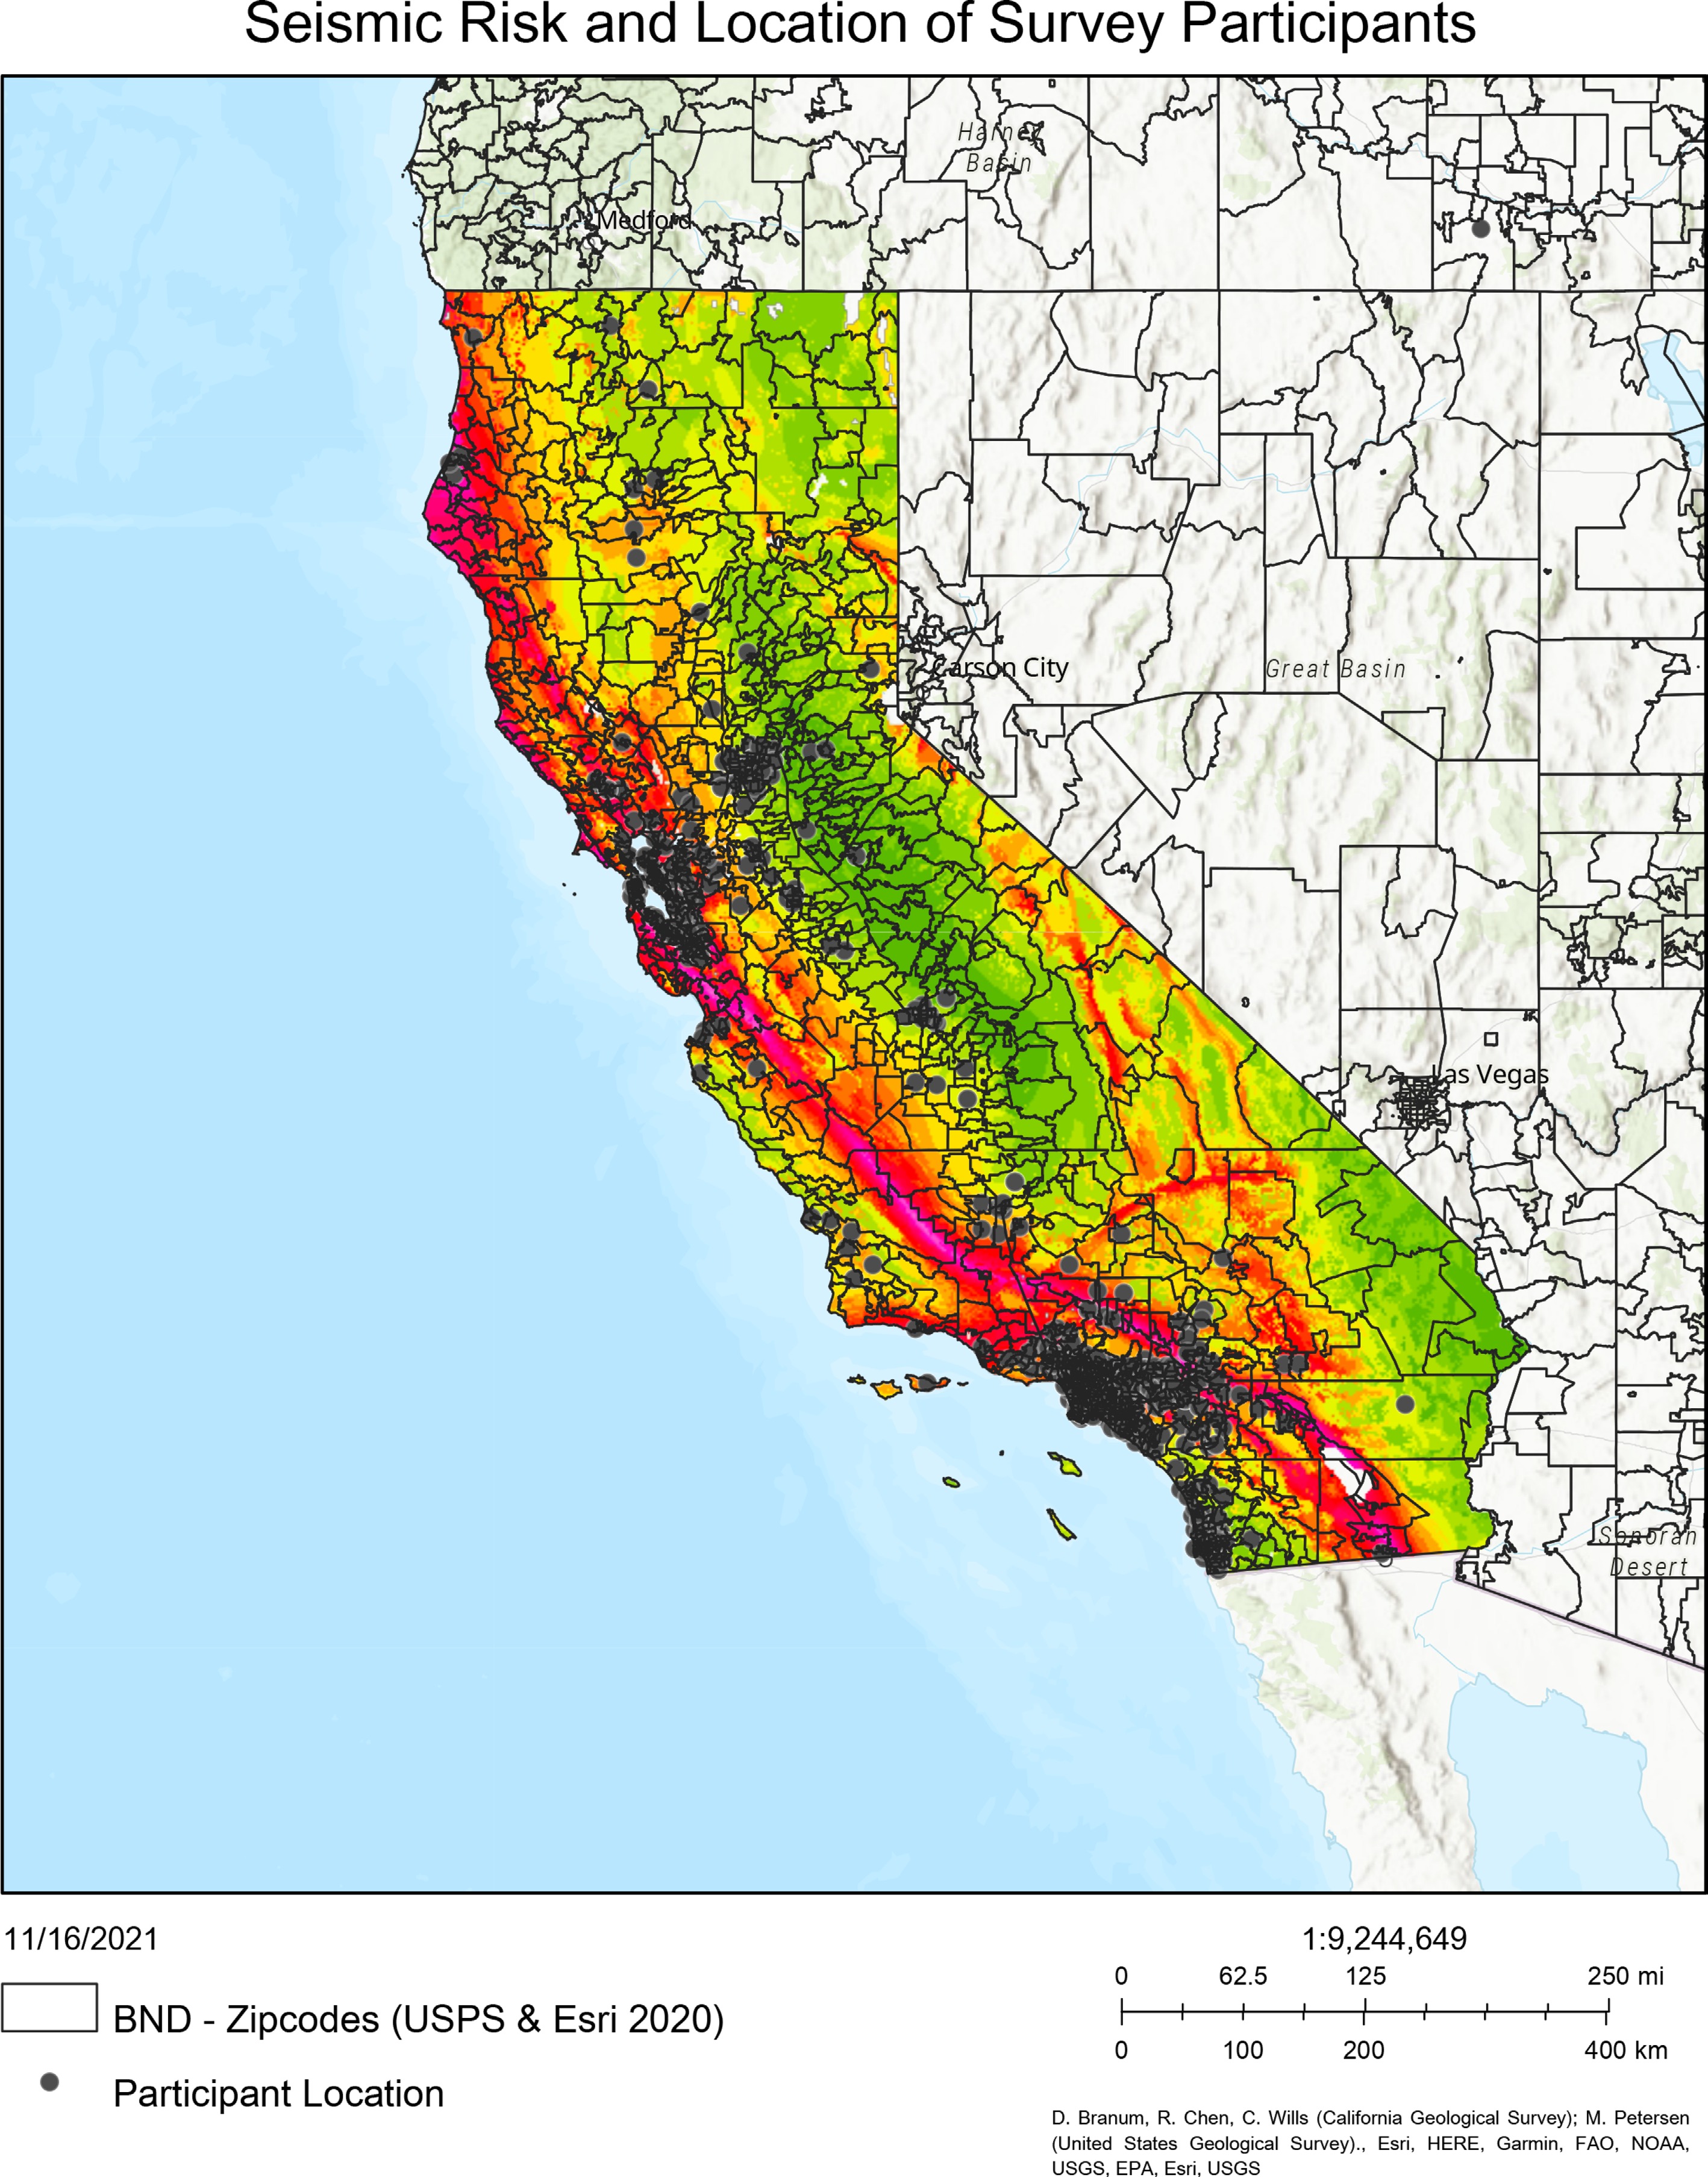
Figure 1.
Seismic risk and location of survey participants.
-
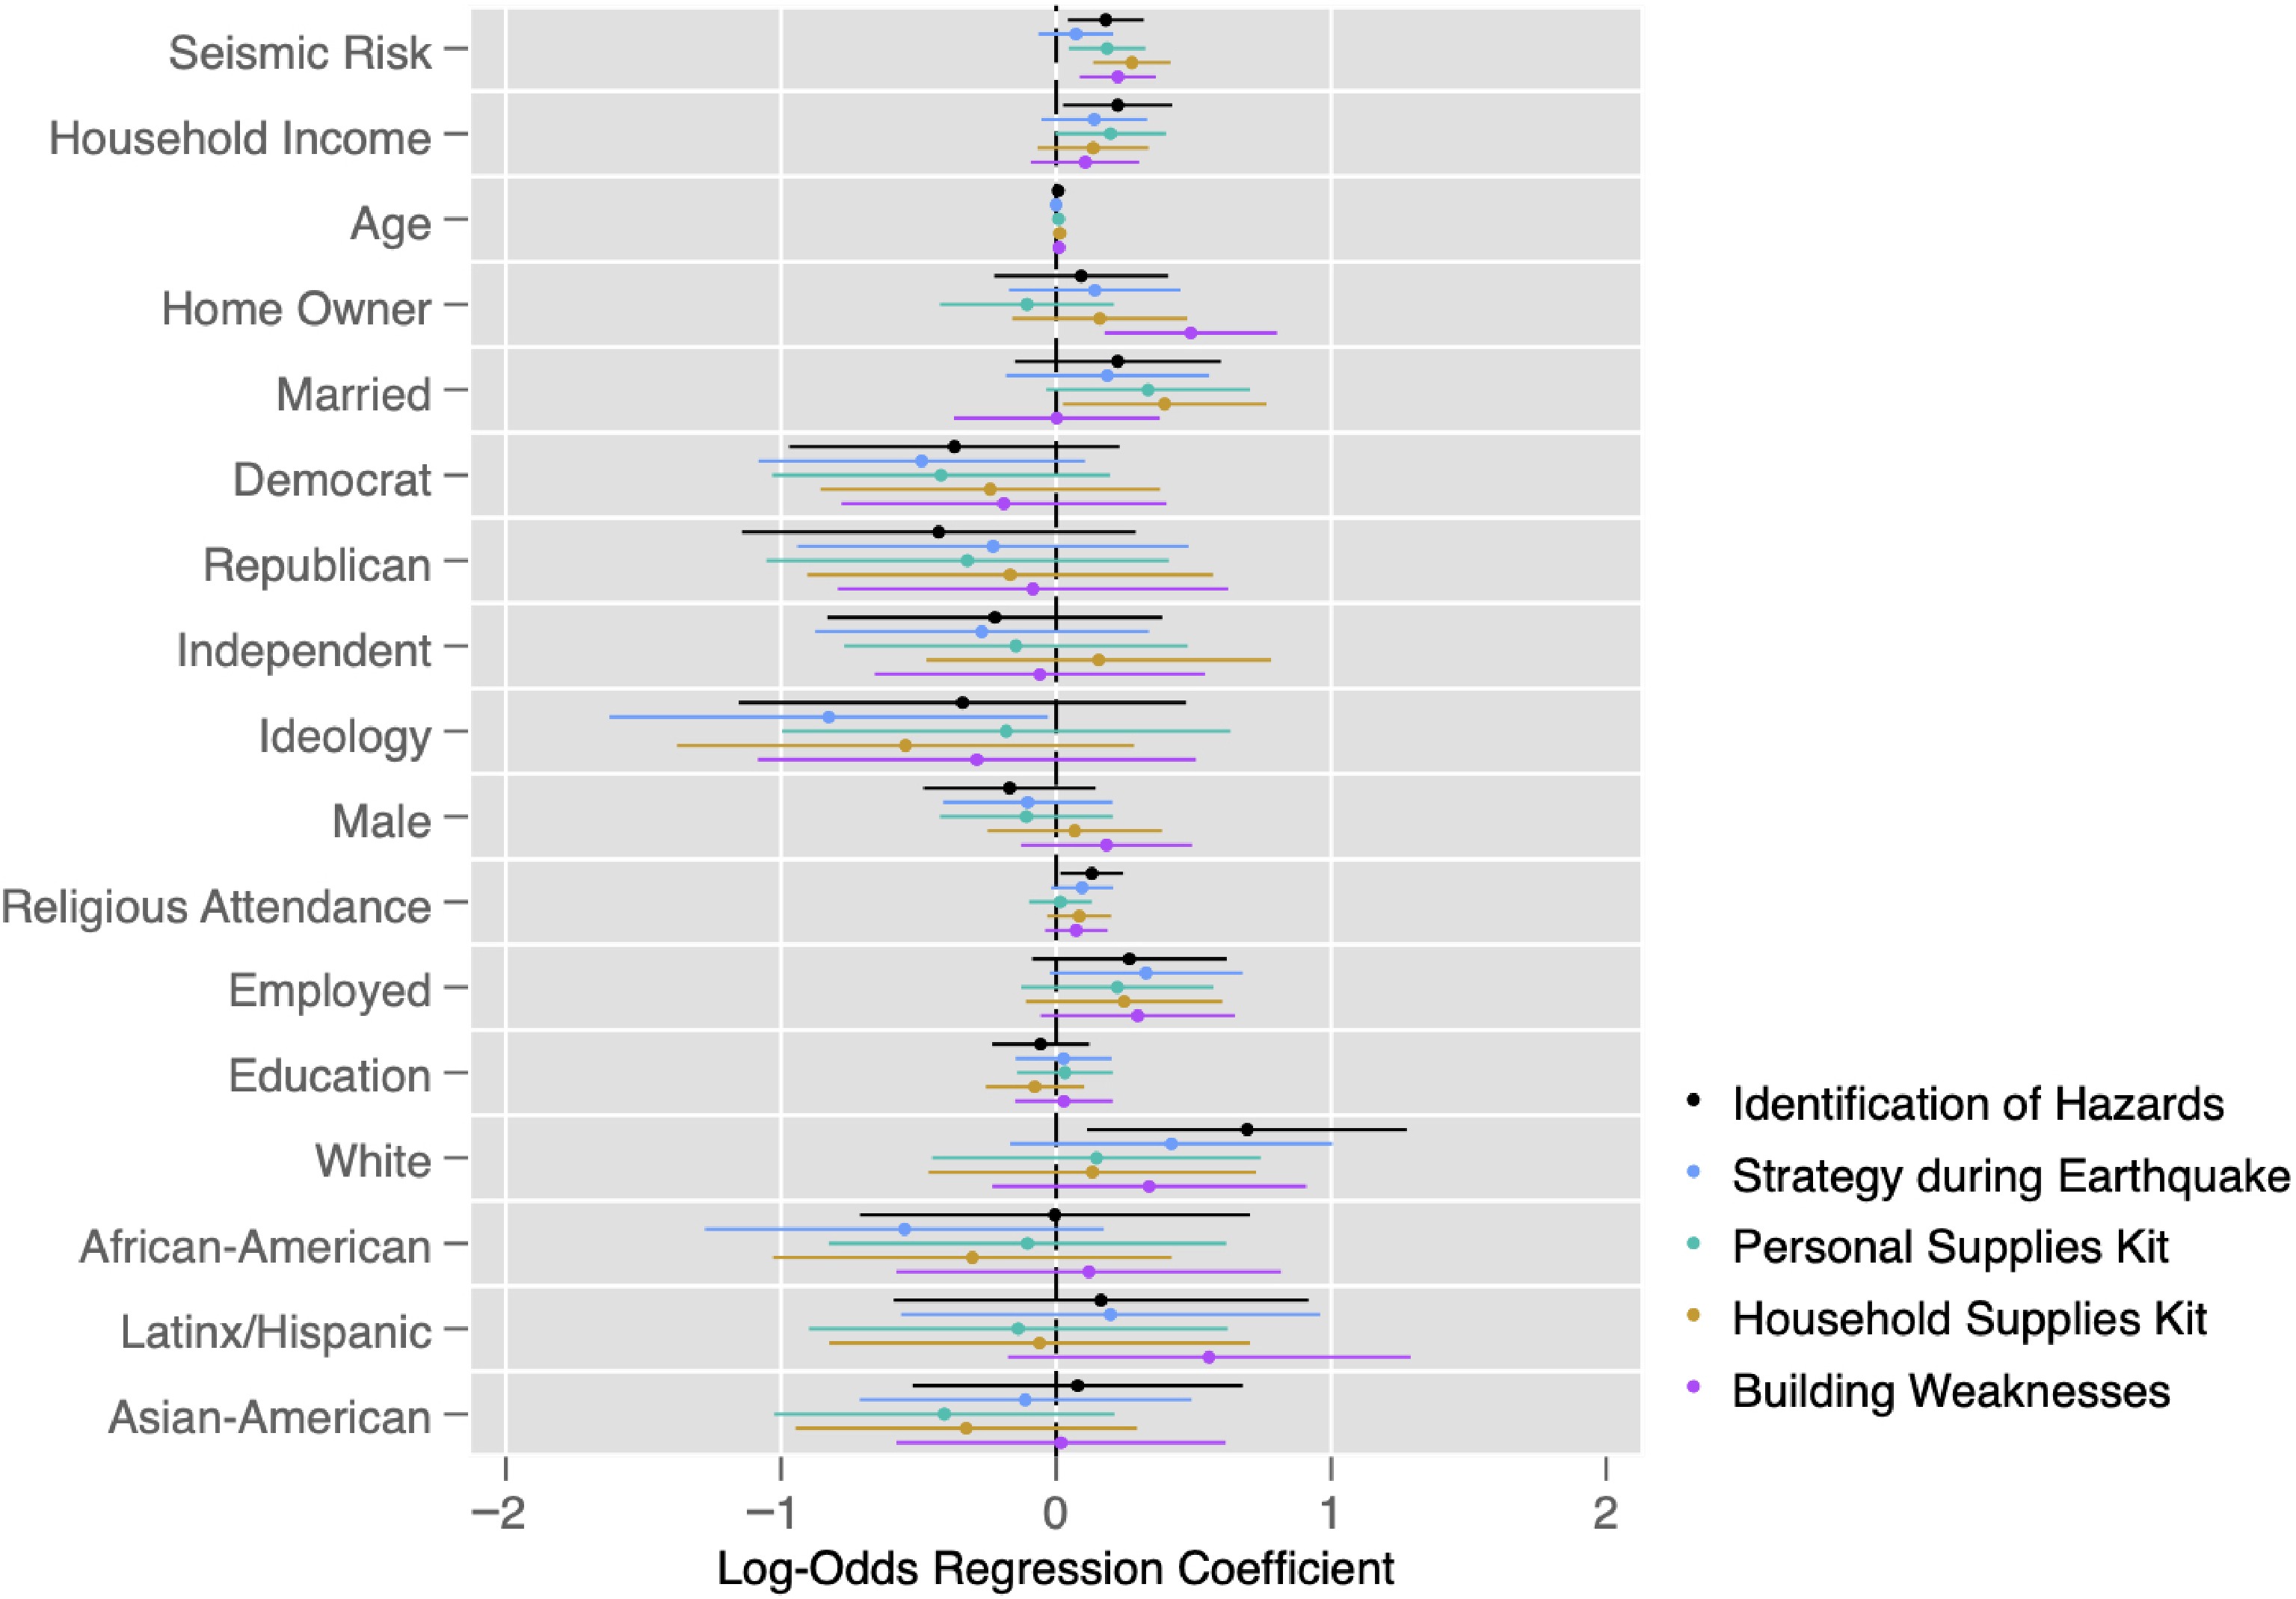
Figure 2.
Determinants of individual preparedness. Dependent variables: Indicators of individual preparedness. Point estimates indicate the ordered log-odds of fulfilling each indicator of individual earthquake preparedness with 95% confidence intervals using the coefplot package in Stata[50].
-
Variable Coding Mean Std. dev. Dependent variables Identification of Hazards 0 = Not aware; 1 = Awareness; 2 = Planning; 3 = Acting 1.486 0.968 Strategy 0 = Not aware; 1 = Awareness; 2 = Planning; 3 = Acting 1.693 0.931 Personal kit 0 = Not aware; 1 = Awareness; 2 = Planning; 3 = Acting 1.600 0.925 Household kit 0 = Not aware; 1 = Awareness; 2 = Planning; 3 = Acting 1.584 0.928 Building weaknesses 0 = Not aware; 1 = Awareness; 2 = Planning; 3 = Acting 1.090 0.977 Independent variables Seismic risk 1 = Low seismic risk; 2 = Moderate seismic risk; 3 = High seismic risk; 4 = Very high seismic risk 2.471 1.106 Household income 1 = Low income; 2 = Medium income; 3 = High income 1.923 0.844 Control variables Age Numeric without decimals (range from 18−79) 34.699 12.123 Homeowner 0 = Not homeowner; 1 = Homeowner 0.437 0.496 Married 0 = Not married; 1 = Married 0.297 0.457 Democrat 0 = Not democrat; 1 = Democrat 0.492 0.500 Republican 0 = Not republican; 1 = Republican 0.156 0.363 Independent 0 = Not independent; 1 = Independent 0.273 0.446 Ideology 1 = Extremely liberal; 2 = Liberal; 3 = Slightly liberal; 4 = Moderate, middle of the road;
5 = Slightly conservative; 6 = Conservative; 7 = Extremely conservative [transformed to 0−1 scale]0.376 0.265 Male 0 = Female; 1 = Male 0.494 0.500 Religious attendance 0 = Never; 1 = Once a year or less; 2 = A few times a year; 3 = Once or twice a month;
4 = Once a week; 5 = More than once a week1.063 1.408 Education 1 = Less than High School Diploma; 2 = High School Graduate; 3 = Some college, no degree;
4 = Bachelor's degree; 5 = Master's degree; 6 = Professional or Doctorate degree3.619 0.912 White 0 = Not white; 1 = White 0.756 0.430 African American 0 = Not African American; 1 = African American 0.076 0.265 Latinx/Hispanic 0 = Not Latinx; 1 = Latinx 0.059 0.237 Asian-American 0 = Not Asian; 1 = Asian 0.228 0.420 Table 1.
Operationalization, measurement, and descriptive statistics of variables.
Figures
(2)
Tables
(1)