


-
Natural hazards present risks to vulnerable communities around the world, threatening the lives and livelihoods of people living with these risks. Among other steps such as structural and non-structural mitigation, previous research demonstrates that individual preparedness can help reduce risks and increase people's ability to survive hazards when they occur[1]. However, an enduring puzzle for emergency management scholars is that individual and household preparedness behavior often lags behind scientific expertise, even in areas where hazard risks are widely known[1]. For emergency management scholars and practitioners interested in improving people's preparation for disaster in at-risk communities, a pressing question is: How do risks affect individual preparedness for natural hazards?
Previous research demonstrates that people's experience might influence their preparedness[2−4], where individuals interpret future risk through their memories of previous events. Individual preparedness for future hazards is also shaped by psychological and cognitive factors such as risk preferences[5,6], the use of cognitive biases and heuristics[7], and the availability of information and the sharing of knowledge about disasters[8,9].
Furthermore, preparedness could also be affected by individuals' perception of hazards[10−12], their assessment of the personal, social and institutional context[13], their beliefs and adjustments[14], and expected damage[15]. In terms of understanding and interpreting information and predictions, people are not very good at dealing with risk[16,17], or correctly understanding probability[15,18], which limits the ability of emergency managers, scientists, science communicators, and public officials to persuade members of the public to prepare for low-probability, high-impact hazards such as earthquakes.
These issues are particularly relevant when considering individual preparedness related to earthquakes − natural hazards that are low-probability, high-consequence events. Previous research demonstrates that individual preparedness might be affected by individuals' information consumption[19], trust in government and other stakeholders[20,21] and their hazard beliefs and social characteristics[22]. Further, individuals in already-vulnerable communities face additional barriers to preparedness[23,24], and communities may prepare differently for disasters depending on their knowledge and previous experiences[25].
The collective understanding about how individual-level factors shape disaster preparedness represents a considerable body of knowledge. However, less remains known about how localized seismic risk influences individual preparedness, especially in localized settings.
In this study, we present what we believe is the first analysis of publicly available information about localized seismic risk on individual preparedness, making a considerable contribution to the collective understanding of how risk influences individual preparedness. While some studies have explored the relationship between seismic risk and individual preparedness, to our knowledge these studies have not used publicly available information about seismic risk at the zip code level[26−28]. We also explore the role of household income, as resource availability could conceivably influence individual preparedness[29].
Through combining data from Temblor − a novel seismic risk app − and an original survey, we aim to contribute to this body of research through a study of individual behavior in California. California represents an excellent case because it is a state well known for high risk of seismic activity and if an earthquake strikes, the damage could be catastrophic. The 2008 ShakeOut Scenario projected that a Magnitude-7.8 earthquake on the San Andreas Fault could lead to 50,000 injuries, 1,800 deaths and US
${\$}$ In this paper, we present novel data from a survey of 680 Californian residents to test how individuals' seismic risks influence their individual earthquake preparedness. Through ordinal logit regression, we demonstrate that seismic risk is positively associated with individual preparedness in California, while controlling for alternative explanations. Results for household income are more mixed, suggesting that income is not necessarily a determining factor in driving individual preparedness. Our results have implications for the understanding of individual disaster preparedness, demonstrating that people respond to the risks in their environment to prepare for disasters. We hope that future work builds on the findings to study the use of information about risks and hazards on individual preparedness for a variety of natural hazards.
This paper proceeds in five further sections. First, we briefly describe our theoretical expectations and provide the reasoning behind our two hypotheses − that both seismic risk and household income are positively associated with individual earthquake preparedness. Second, we walk through our data and methods, including case selection, sampling, survey procedure, the operationalization of variables, and the means of analysis. Next, we turn to our results, presenting results from ordered logit regression. Fourth, we discuss the implications of our findings and put them in perspective, providing a discussion about how this could benefit practitioners and policymakers, before turning to limitations of this study that can be addressed in future scholarship. Finally, the paper concludes with a brief concluding section.
Seismic risk and individual preparedness
-
Previous research indicates that people are not very good at making sense of seismic hazards and models that can often be too technical or inaccessible for non-experts to assess risk[31]. However, recent technological innovations might be able to communicate risk to the public in ways that make seismic risk more intuitive, encouraging individuals to respond to the risks they face in their area. While we do not have the data on individuals' use of these tools, we can assess whether seismic risk broadly translates into increased preparedness at the individual level.
Building on previous research that suggests a link between perceptions of risk and individual preparedness[26−28], we expect to find that estimates of seismic risk are positively related to individual preparedness among participants in our study. As people are more exposed to seismic vulnerability, it is likely that individuals are aware of those risks, and ultimately take steps to prepare for hazards that are more likely to affect them in their locality than if they live in a location with few seismic risks.
As seismic vulnerability may vary markedly across cities, we utilize zip code-level data to estimate seismic risks for individuals. We expect that individuals living in areas with greater seismic risks are more prepared for earthquakes, as measured by a few simple indicators of preparedness such as identifying hazards in the home, devising a strategy for an earthquake, preparing individual and household emergency kits, and identifying structural weaknesses in one's home. As a result, our hypothesis is:
Hypothesis 1 Hazards Hypothesis
As seismic risk increases, individuals' preparedness increases.
Household income and individual preparedness
-
However, of course, seismic risk may not explain variation in individual preparedness alone. Having the resources available to adopt and implement measures to prepare for disasters can prove to be an insurmountable barrier for many people.
For households with lower levels of income, especially in the case of preparing for low-incidence, high-cost events like earthquakes, the financial costs associated with developing preparedness are too high given more immediate concerns like paying rent or making mortgage payments, putting food on the table, and generally making ends meet. For individuals with higher levels of income, they might be less concerned with making ends meet, and instead their focus might turn to protecting assets they already hold[32].
In essence, people with higher levels of income might have more to lose in the event of an earthquake and they might take more actions to prevent these losses such as purchasing earthquake insurance or implementing measures to reduce damage and the risk of injury[33]. As a result, our second hypothesis is:
Hypothesis 2 Income Hypothesis
As household income increases, individuals' preparedness increases.
-
In this section, we describe the case selection, sample, survey procedure, variables, and methods of analysis employed in this study to examine the association between seismic risk, income, and individual preparedness.
Case selection: individual preparedness in California
-
To examine the factors that contribute to individual preparedness, we collected a sample of participants from California. California is the state with the largest population[34], and the largest economy in the US[35]. It also has significant seismic hazards, with major historical earthquakes including the 1906 San Francisco earthquake, the 1933 Long Beach earthquake, the 1971 Sylmar earthquake, the 1989 Loma Prieta earthquake, and the 1994 Northridge earthquake, among others.
Further, the risk of future earthquakes in the state is significant as 'more than 70% of the state's 40 million people reside within 30 miles of a known fault where strong ground shaking could occur in the next 30 years'[36].
Adding to the seismic risk, millions of Californians routinely participate in statewide earthquake drills through the ShakeOut program, and over 1.1 million people are insured by the state's earthquake insurance provider[37]. In short, California is a good case to study due to the state's size, the distribution of seismic risk across the state, and the widespread awareness of these vulnerabilities among Californians.
Sample
-
To examine the relationship between seismic risk, income, and individual preparedness in California, we recruited a convenience sample of 702 Californian residents from Amazon's Mechanical Turk (MTurk) marketplace to complete an online survey. This survey was embedded in an online survey experiment that examined individuals' response to news coverage of an overseas earthquake and their support and willingness to act in support of statewide mandatory retrofitting policies in California[38,39].
Although MTurk samples typically vary from national probability samples of the US population, previous studies demonstrate the validity of using these convenience samples, especially as they are more representative and higher performing than alternative convenience samples[40−44]. While the results do not allow for generalizing from this study to the broader Californian population, they do constitute a valid sample to estimate the relationship between seismic risk, income, and individual preparedness.
Upon completion of the study, participants were compensated US
${\$} $ 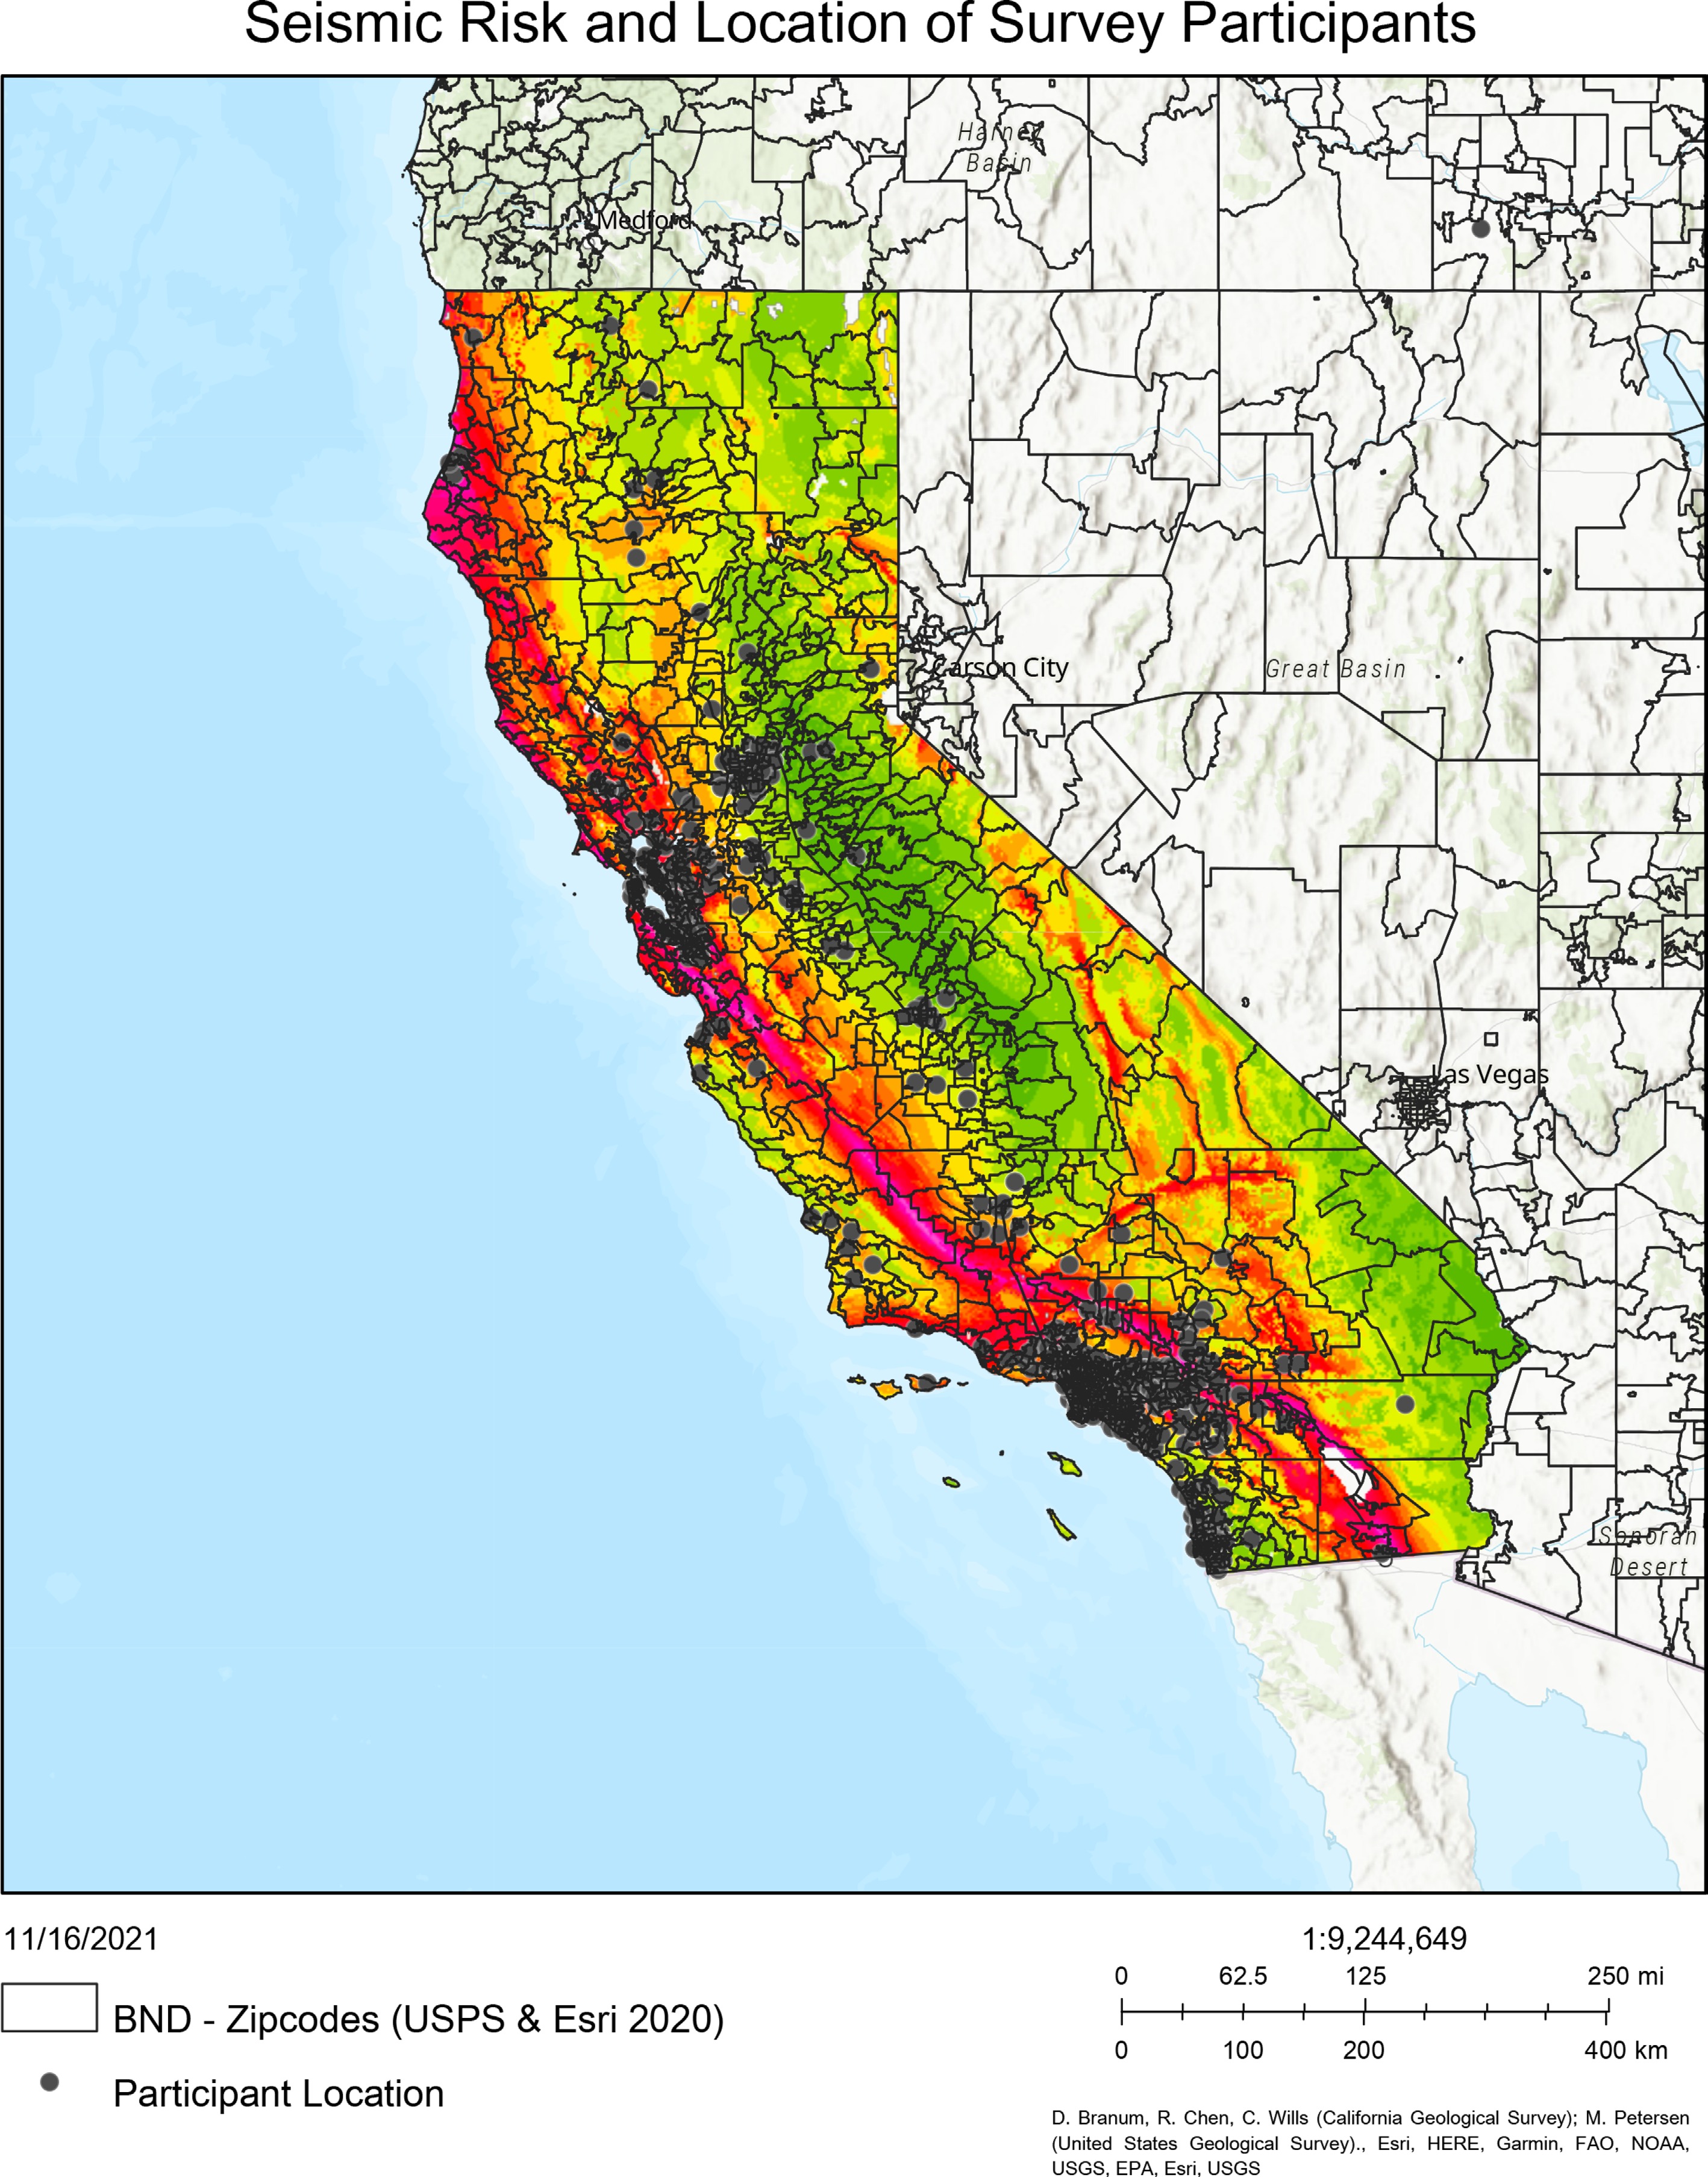
Figure 1.
Seismic risk and location of survey participants.
Survey procedure
-
All participants were assessed to determine their eligibility for the survey, including checks that they were at least 18 years old, that they lived in California, that their Human Intelligence Task (HIT) approval rate was at least 98%, and that they had previously completed at least 50 HITs on MTurk.
If they met the eligibility requirements, participants completed a series of questions related to their age, education, race and ethnicity, gender, household income, marital status, home ownership, employment, party ID, political ideology, religious affiliation, and religious attendance.
Then, participants were asked to assess their level of preparedness according to five areas of individual preparedness for earthquakes: the identification of hazards, the formation of a strategy in the event of an earthquake, the assembly of a personal disaster supplies kit, the assembly of a household disaster supplies kit, and the identification and action to mitigate their building's weaknesses. As with previous studies, we found that the general level of preparedness was low, with fewer than 5% of all participants having completed all five measures of individual preparedness[45].
Finally, after completing these questions, participants were provided with a code to enter on MTurk to ensure they received compensation for their time.
Operationalization and conceptualization
Dependent variables
-
Our outcome of interest is individual earthquake preparedness. For our survey, we operationalized individual earthquake preparedness into five distinct indicators from the Earthquake Country Alliance's Seven Steps to Earthquake Safety[46]. These five indicators are: 1) the identification and prevention of potential hazards in the home; 2) having a strategy about what to do during an earthquake; 3) having an individual disaster supplies kit; 4) having a household disaster supplies kit; and 5) the identification and prevention of their building's seismic weaknesses. For each indicator, participants were asked to indicate whether they were unaware of this requirement (0), they were aware of this requirement but have not yet completed it (1), they had formed a plan to take this action, but had not yet completed it (2), or if they had completed this action (3).
Independent variables
-
We use seismic risk as our first independent variable. Given people's difficulty with interpreting probability and scientific explanations of risk, we use Temblor to supplement the survey data. Founded by two former USGS scientists, the Temblor app adopts seismic risk modeling based on peer-reviewed research to produce free, easily-understood estimates of seismic risk based on data provided by the user on a scale from 0−100[47]. We employ this data at the zip code level to protect the privacy of our participants, while maintaining all other variables in the inputs constant. Jacobson & Lotto[48] describe the tool:
One of the most unique aspects about Temblor is its seismic hazard ranking system. For each location in the US, a hazard rank between zero and 100 is calculated based on that location's proximity to faults, likelihood of experiencing significant earthquake shaking, past earthquakes and soil conditions. Combining such data makes a user's hazard rank highly location dependent.
As a result, residents in seismically vulnerable communities can check their risk at a granular level at the click of a finger. As mobile applications and user-friendly electronic tools continue to be developed, they could become important purveyors of information about preparedness.
We collected hazard data from Temblor for all zip codes included in our analysis. There was a large amount of variation in our sample, with the Temblor estimate of seismic risk ranging from 8 to 100 in our sample, with a mean of 60.46. Once collected, we transform these scores into quartiles for analysis to allow for more intuitive interpretation of the results and because we consider it is substantively important to analyze the effects of increasing seismic risk by quartile rather than an increase in seismic risk from 99 to 100, for example. We transformed seismic risk to quartiles because this made the distribution much more similar to a normal distribution, and also because it made more intuitive sense for the interpretation of results. However, our results are robust to alternative transformations of seismic risk, including transforming the variable into thirds or quintiles (not reported).
Our second independent variable is household income. This was collected in the survey by asking participants to select the range of their household income before taxes in the previous 12 months from 12 choices ranging from less than US
${\$} $ ${\$} $ Control variables
-
Previous research has shown that a range of other factors are associated with individual earthquake preparedness[10]. To take these into account and control for alternative explanations, we include a range of different control variables in our analysis. Demographic variables include items such as age, home ownership, marital status, gender on a dichotomous basis, religious attendance, and education. As political ideology and party affiliation could conceivably affect people's attitudes and willingness to engage in preparedness activities, we also include variables such as political ideology and whether the participant identifies as a Democrat, Republican, or as an Independent.
Finally, race and ethnicity could influence individual preparedness, so we also include control variables for whether a participant identified as White (455 participants), African American (57 participants), Latinx (40 participants), and Asian-American (157 participants). We based these measures on the 16 race/ethnicity options for identity from the US Census, and participants were asked to indicate all racial and ethnic groups they identified with on a binary basis.
Table 1 presents the operationalization, coding scheme and descriptive statistics for all variables used in this analysis.
Table 1. Operationalization, measurement, and descriptive statistics of variables.
Variable Coding Mean Std. dev. Dependent variables Identification of Hazards 0 = Not aware; 1 = Awareness; 2 = Planning; 3 = Acting 1.486 0.968 Strategy 0 = Not aware; 1 = Awareness; 2 = Planning; 3 = Acting 1.693 0.931 Personal kit 0 = Not aware; 1 = Awareness; 2 = Planning; 3 = Acting 1.600 0.925 Household kit 0 = Not aware; 1 = Awareness; 2 = Planning; 3 = Acting 1.584 0.928 Building weaknesses 0 = Not aware; 1 = Awareness; 2 = Planning; 3 = Acting 1.090 0.977 Independent variables Seismic risk 1 = Low seismic risk; 2 = Moderate seismic risk; 3 = High seismic risk; 4 = Very high seismic risk 2.471 1.106 Household income 1 = Low income; 2 = Medium income; 3 = High income 1.923 0.844 Control variables Age Numeric without decimals (range from 18−79) 34.699 12.123 Homeowner 0 = Not homeowner; 1 = Homeowner 0.437 0.496 Married 0 = Not married; 1 = Married 0.297 0.457 Democrat 0 = Not democrat; 1 = Democrat 0.492 0.500 Republican 0 = Not republican; 1 = Republican 0.156 0.363 Independent 0 = Not independent; 1 = Independent 0.273 0.446 Ideology 1 = Extremely liberal; 2 = Liberal; 3 = Slightly liberal; 4 = Moderate, middle of the road;
5 = Slightly conservative; 6 = Conservative; 7 = Extremely conservative [transformed to 0−1 scale]0.376 0.265 Male 0 = Female; 1 = Male 0.494 0.500 Religious attendance 0 = Never; 1 = Once a year or less; 2 = A few times a year; 3 = Once or twice a month;
4 = Once a week; 5 = More than once a week1.063 1.408 Education 1 = Less than High School Diploma; 2 = High School Graduate; 3 = Some college, no degree;
4 = Bachelor's degree; 5 = Master's degree; 6 = Professional or Doctorate degree3.619 0.912 White 0 = Not white; 1 = White 0.756 0.430 African American 0 = Not African American; 1 = African American 0.076 0.265 Latinx/Hispanic 0 = Not Latinx; 1 = Latinx 0.059 0.237 Asian-American 0 = Not Asian; 1 = Asian 0.228 0.420 Methods
-
Once the data was collected, we conducted analysis to examine the relationship between seismic risk, household income, and individual earthquake preparedness. Broadly, statistical tests of this relationship involve ordered logit regression because of our use of discrete outcome data which is categorical and ordered. Our results are robust to using ordinary least squares (OLS) regression, but we adopt ordered logit regression because of the ordered categorical nature of our dependent variable which makes the interpretation of the distance between points somewhat problematic.
Each of our five indicators of individual earthquake preparedness can be considered as an underlying latent variable capturing each participant's propensity to identify themselves as having completed each particular element of individual earthquake preparedness[49]. In other words, for an individual to indicate that they have completing acting for a particular indicator of preparedness, they first must have become aware and completed planning for that part of preparing for earthquakes.
Ordered logit regression was performed using Stata statistical software. The results of these tests are presented in the following section. Additional tests and robustness checks are reported in the Supplementary Materials.
-
The results from our analysis broadly indicate support for the hypotheses introduced in this paper. Figure 2 presents results of our ordered logit regression plotting the relationship between our two independent variables, seismic risk and household income, and five indicators of individual earthquake preparedness, with log odds regression coefficients plotted on the figure for each of the five outcomes of interest with 95% confidence intervals.
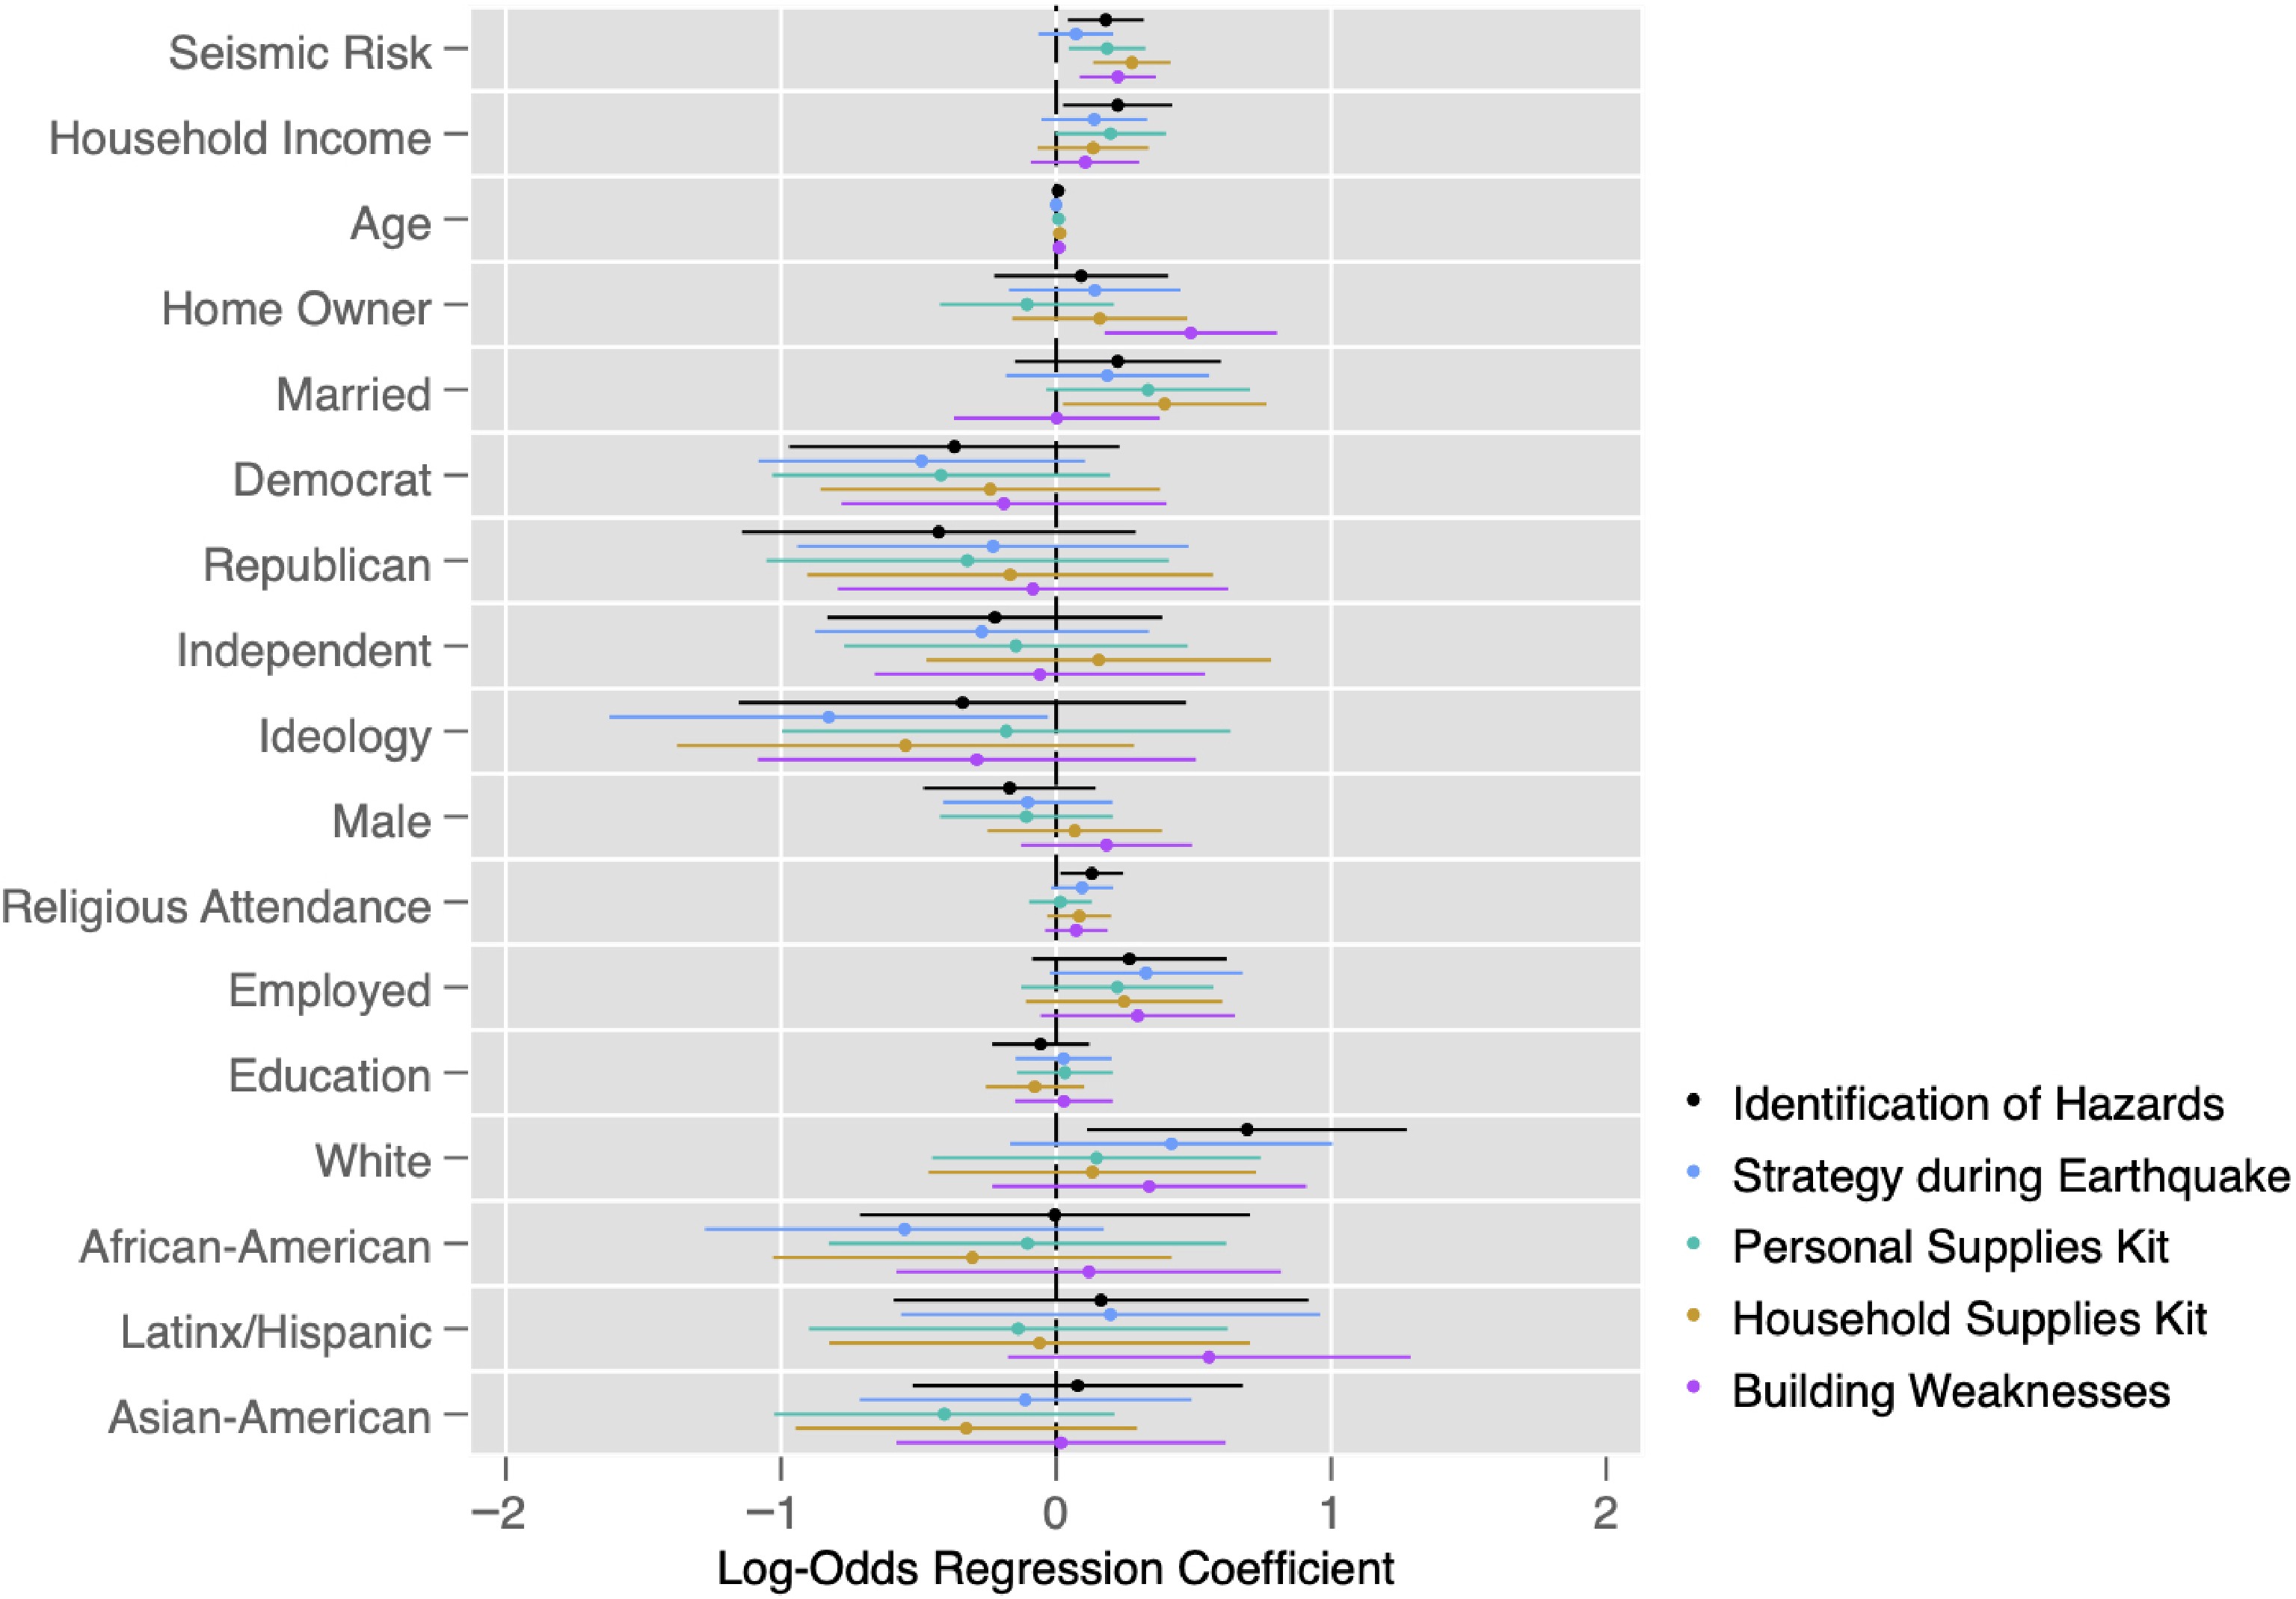
Figure 2.
Determinants of individual preparedness. Dependent variables: Indicators of individual preparedness. Point estimates indicate the ordered log-odds of fulfilling each indicator of individual earthquake preparedness with 95% confidence intervals using the coefplot package in Stata[50].
First, seismic risk is positively related to the identification of hazards in the home. Moving from one quartile of seismic risk leads to a 0.180 increase (p = 0.010) in the ordered log-odds of having completed this element of individual preparedness, while holding other variables constant. Second, the results suggest there is no statistically significant relationship between seismic risk (p = 0.295) on having a strategy for what to do during an earthquake. This absence of a meaningful relationship between seismic risk and having a strategy for what do to during an earthquake is counter to our expectations.
Turning to the three remaining indicators measured in our survey, we find that seismic risk is a good predictor of individual earthquake preparedness. While holding other covariates constant, increasing one quartile of seismic risk is associated with a 0.185 increase (p = 0.009) in the ordered log-odds of having a personal disaster supplies kit, a 0.275 increase (p = 0.000) in the ordered log-odds of having a household disaster supplies kit, and a 0.225 increase (p = 0.001) in the ordered log-odds of having addressed weaknesses of their building.
Results for our second independent variable, household income, are more mixed. First, household income does appear to be related to the identification of hazards in the home. Advancing one quantile of household income is associated with a 0.225 increase (p = 0.027) in the ordered log-odds of identifying hazards in the home when all other variables in the model are held constant. Further, household income is associated with a 0.198 (p = 0.054) increase in the ordered log-odds of having a personal supplies kit, while holding all other variables constant. However, this result is not statistically significant at standard thresholds for statistical significance at p < 0.05. Finally, household income does not appear to be related to either having a strategy during an earthquake, having a household supplies kit nor identifying and addressing building weaknesses.
Among the control variables included in our models to account for alternative explanations, no single variable appears to consistently account for variation in individual earthquake preparedness. As a result, we are confident that our independent variables, and seismic risk in particular, explain variation in individual preparedness to a greater extent than these plausible alternative explanations.
Overall, except for having a strategy about what to do in the event of an earthquake, seismic risk is a good predictor of different indicators of individual earthquake preparedness. These results suggest that the amount of preparedness completed is broadly proportional to the seismic risks of the zip code where people live. On the other hand, household income has mixed results as a predictor of individual preparedness.
-
The results from this analysis present several different implications for our collective understanding of individual preparedness in earthquake-prone areas. In this final section, we discuss some implications of these results for DRR practitioners and policymakers, as well as describe limitations of this research and directions for future research to build upon this study.
Policy implications
-
First, our results suggest that seismic risk is an important factor in determining whether individuals invest in individual earthquake preparedness activities. Normatively, this is an encouraging result suggesting that people are broadly responsive to the seismic risks in their neighborhood, making greater progress on preparedness initiatives as seismic risk increases. For practitioners and policymakers interested in improving individual earthquake preparedness, publicizing tools such as Temblor and other intuitive tools so that individuals can see their seismic risk and initiate preparedness activities to address their vulnerability. Complementing already-popular campaigns such as the ShakeOut drills, this localized information might be powerful in helping people prepare for future earthquakes in areas of high seismic risk.
Second, household income does not appear to have meaningful effects on most indicators of individual preparedness, suggesting that individual preparedness is not driven solely by resource availability. Of course, investing in costly preparedness initiatives might be burdensome to many individuals, but our results suggest that income is a poor explanatory factor for individual preparedness, meaning that low-income individuals are no less prepared than wealthier peers. Future studies could build on our findings to determine whether interventions such as information campaigns could help persuade people about the value in preparing for disasters, especially as preparing for hazards before they occur may have considerable economic and safety benefits for individuals when disaster strikes.
Finally, the results from our survey suggest a departure from some previous studies in that common alternative explanations do not appear to explain variation in individual preparedness in our sample. With a few exceptions, our results broadly indicate that race and ethnicity, political ideology or Party ID, home ownership, age, marital status, employment, or education are not good predictors of individual preparedness. From a normative perspective, policymakers and practitioners might be encouraged that these structural factors do not explain preparedness in our results. If people instead can improve their preparedness based on information, campaigns like ShakeOut might be successful in encouraging this behavior in at-risk communities. While we do not directly test the effects of tools such as Temblor or information campaigns on individual preparedness, our results suggest that this might be a fruitful avenue for future interventions aimed at improving earthquake preparedness in seismically vulnerable communities.
Limitations and future research
-
While our results indicate support for the theory that seismic risk influences individual earthquake preparedness, there are several limitations of our research that future research can address to further build upon this study.
First, our study is not a statewide probability sample, drawing instead from participants on MTurk. While this does not necessarily affect the validity of our findings, it does mean that generalizing from our results to the broader population is problematic, so we cannot make plausible claims about how our findings translate to the entire state of California. Similarly, our results draw from a survey of 680 participants, providing a large enough sample to test our hypotheses in the survey. However, future research can build on our findings by drawing from a larger sample and using a probability sample of Californian residents to see how our results generalize to the entire state.
Second, future research can address the relationship between seismic risk and individual earthquake preparedness in other settings. As mentioned earlier, California is a good case for analyzing this relationship given its size, its recent history of earthquakes, and the well-publicized risks of earthquakes in major cities such as San Francisco and Los Angeles, but it is also a case where knowledge and awareness of seismic risk might be higher than other areas that have not been recently affected by earthquakes. Future research should address how our results translate to other settings, both within the US and in other countries.
Third, our survey did not directly address individuals' knowledge of earthquake risk, instead matching Temblor data with individual responses to the survey. This means that we do not directly know the extent to which participants were aware of their seismic risk in our study. Previous research in other settings suggests that perceived incentives for knowledge accuracy lead to improved knowledge[51,52], so people living in high-risk areas might be more knowledgeable about preparedness, but this is not tested in our data. Further research in both surveys and experiments should both explore to what extent people accurately report seismic risk in their area, and how people respond to information about seismic risk in their intentions to prepare and ultimately on preparedness activities.
Of course, it is important to note that any use of tools such as Temblor are contingent on people having access to this technology, and the ability to interpret the results if this information is to improve individuals' preparedness. This is an important concern and limitation of Temblor and similar apps that should be tackled by policymakers interested in using such tools to enhance individual preparedness.
Fourth, given the relatively small sample of participants in our study, we were unable to conduct statistical tests that examined how different explanatory factors interact with each other to explain variation in individual preparedness. However, this kind of interactive and intersectional research could provide further insight into the determinants of individual preparedness, future research should explore how a combination of explanatory variables could predict individual preparedness in greater depth, especially using large datasets.
Finally, an important consideration is that people's choice to live in particular neighborhoods is not necessarily random. While previous research suggests there are significant health and environmental hazards associated with historical redlining[53−56], to our knowledge less is known about how these policies are related to seismic risk. Further research should be completed to understand how historical discrimination is related to seismic risk, and the extent to which information campaigns can overcome these practices and foster preparedness in at-risk communities.
-
Individual earthquake preparedness continues to be an important challenge for at-risk communities around the world, with rates of individual preparedness falling short of what emergency managers and policymakers might hope for. In this paper, we provide some reasons for optimism about improving individual preparedness in the future, with our results suggesting that seismic risk affects individuals' preparedness for earthquakes, while controlling for other explanations.
Our results indicate that seismic risk is positively associated with individual preparedness, while household income fails to predict most indicators of individual earthquake preparedness. These findings have important implications for the understanding of individual preparedness, demonstrating that individuals are generally responsive to the risks in their environment, and that preparedness is not solely driven by the resources available to individuals to undertake these activities. Given our findings, there are important avenues for future campaigns to make people aware of their localized seismic risk, which may lead to more preparedness activities among people living in seismically vulnerable neighborhoods.
-
The authors confirm contribution to the paper as follows: study conception and design: Reyes-Nunez RL, Jamieson T; data collection: Jamieson T; analysis and interpretation of results: Reyes-Nunez RL, Jamieson T; draft manuscript preparation: Reyes-Nunez RL, Jamieson T. All authors reviewed the results and approved the final version of the manuscript.
-
The data that support the findings of this study are available in the authors' Harvard Dataverse repository which have been available in the public domain at the following link:
https://doi.org/10.7910/DVN/Z6YM1H . We are grateful to the Center for International Studies and the School of International Relations at the University of Southern California for funding the survey. This study was approved by the USC Institutional Review Board and received approval number UP-16-00306 on 16 May 2016.
-
The authors declare that they have no conflict of interest.
- Supplemental Materials Who Prepares? Seismic Risk, Household Income, and Individual Earthquake Preparedness in California.
- Copyright: © 2023 by the author(s). Published by Maximum Academic Press on behalf of Nanjing Tech University. This article is an open access article distributed under Creative Commons Attribution License (CC BY 4.0), visit https://creativecommons.org/licenses/by/4.0/.
-
About this article
Cite this article
Reyes-Nunez RL, Jamieson T. 2023. Who prepares? Seismic risk, household income, and individual earthquake preparedness in California. Emergency Management Science and Technology 3:13 doi: 10.48130/EMST-2023-0013 

Who prepares? Seismic risk, household income, and individual earthquake preparedness in California
- Received: 11 April 2023
- Accepted: 14 September 2023
- Published online: 30 October 2023
Abstract: How does seismic risk influence individual disaster preparedness? Previous research demonstrates that differences in individual preparedness in at-risk communities can be attributed to a variety of individual-level characteristics such as disaster experience, risk perception and risk preferences, cognitive heuristics and biases, perception of hazards, and their ability to interpret information and understand probabilistic forecasts. However, less is known about how localized seismic risk affects individuals' preparedness for earthquakes. In this paper, we combine localized data about seismic risk with novel survey data from a sample of 680 Californian residents to test how individuals' seismic risks influence their individual preparedness for earthquakes. Our results demonstrate that seismic risk is positively associated with individual preparedness, while controlling for alternative explanations. On the other hand, household income is not a good predictor of individual earthquake preparedness. Our results demonstrate that individuals are generally responsive to the risks in their environment, while also providing several avenues for information campaigns to implement lessons from this study to further encourage preparedness.
-
Key words:
- Individual preparedness /
- Earthquakes /
- Seismic risk /
- Hazards /
- Survey /
- California