-
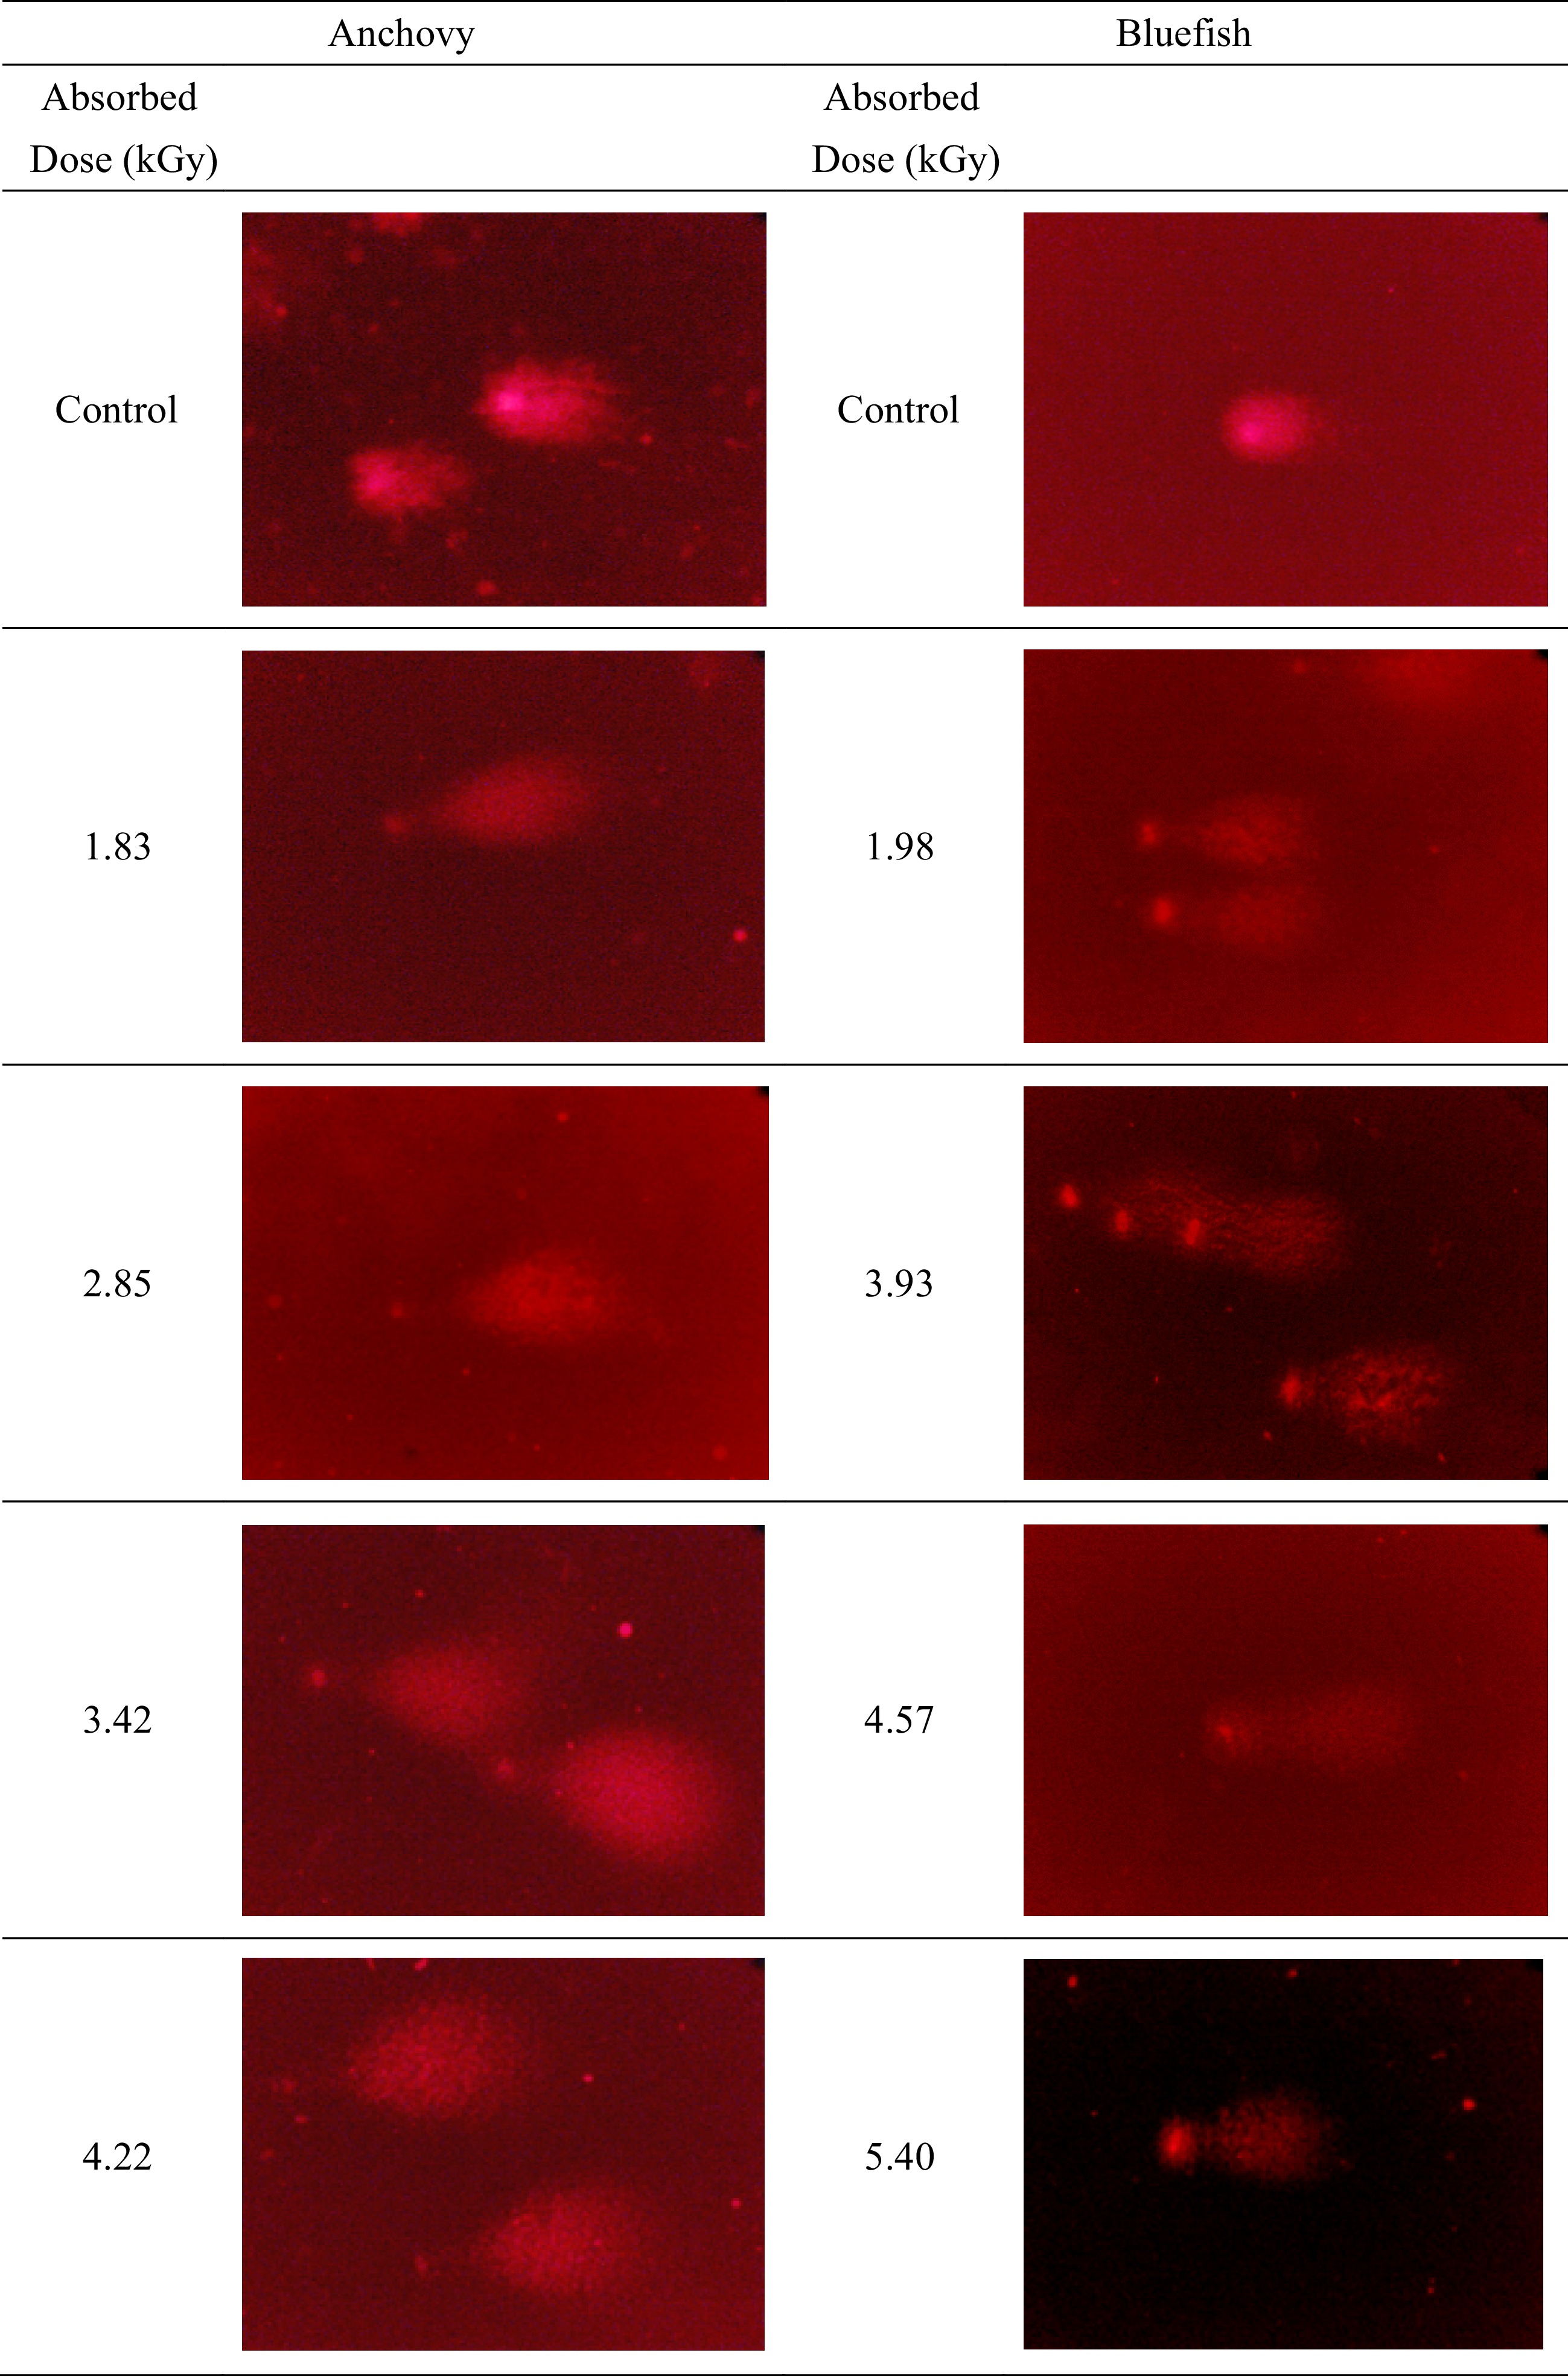
Figure 1.
Typical DNA comets are from anchovy and bluefish. Electrophoresis conditions: 2 V/cm for 2 min, propidium iodide staining. All slides were examined at a magnification of 20×.
-
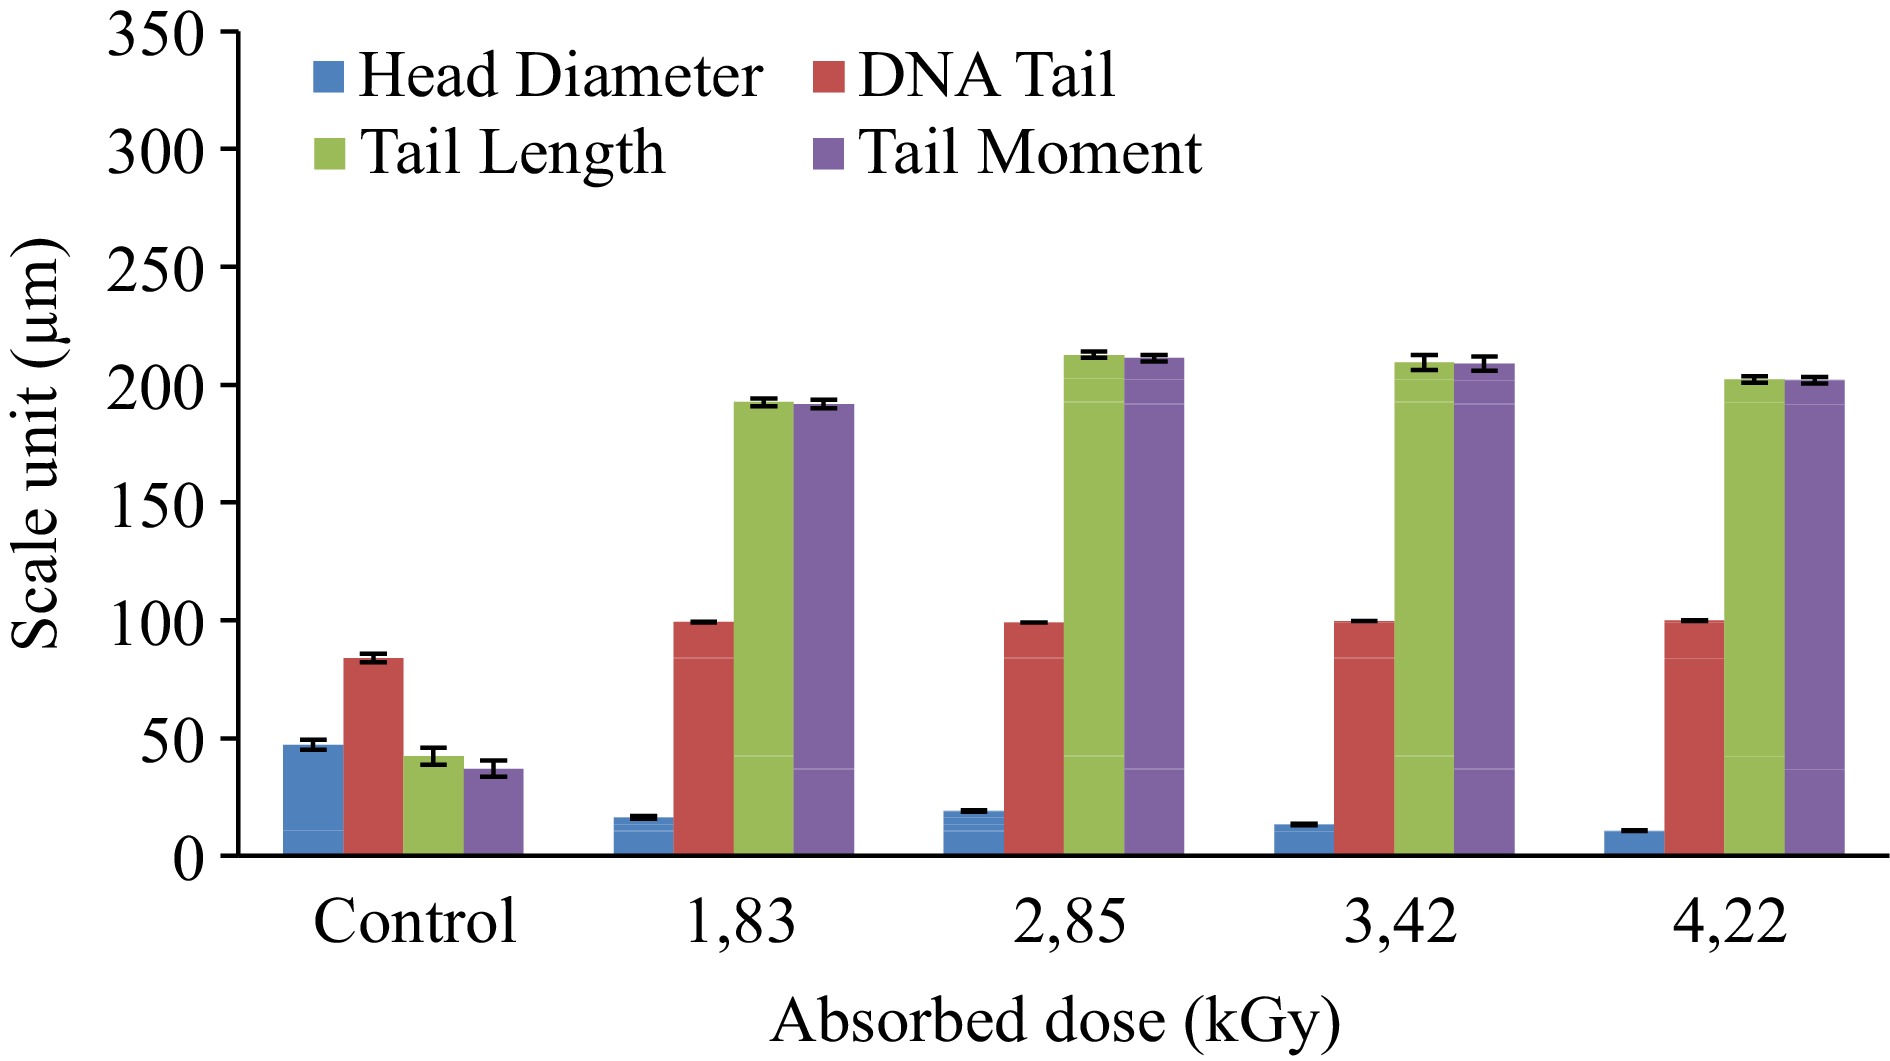
Figure 2.
Changes in measured DNA comet parameters in anchovy samples.
-
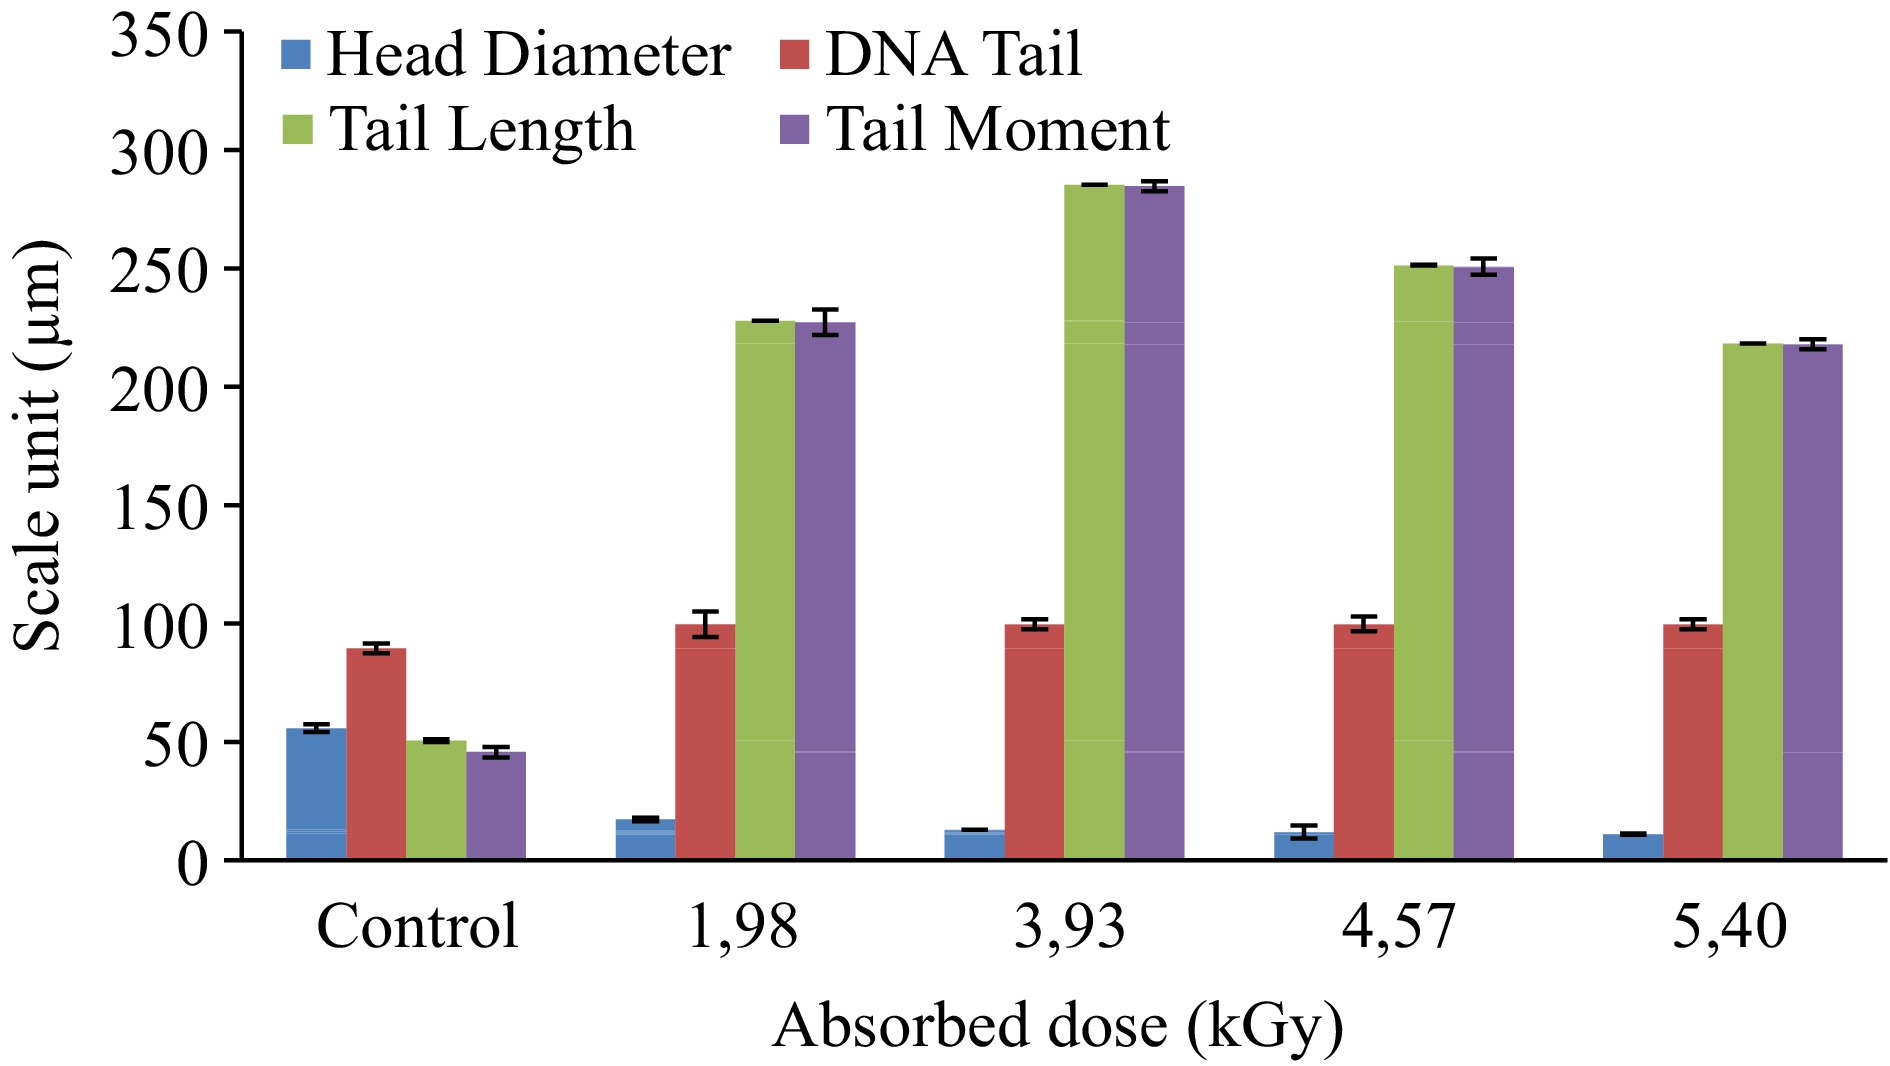
Figure 3.
Changes in measured DNA comet parameters in bluefish samples.
-
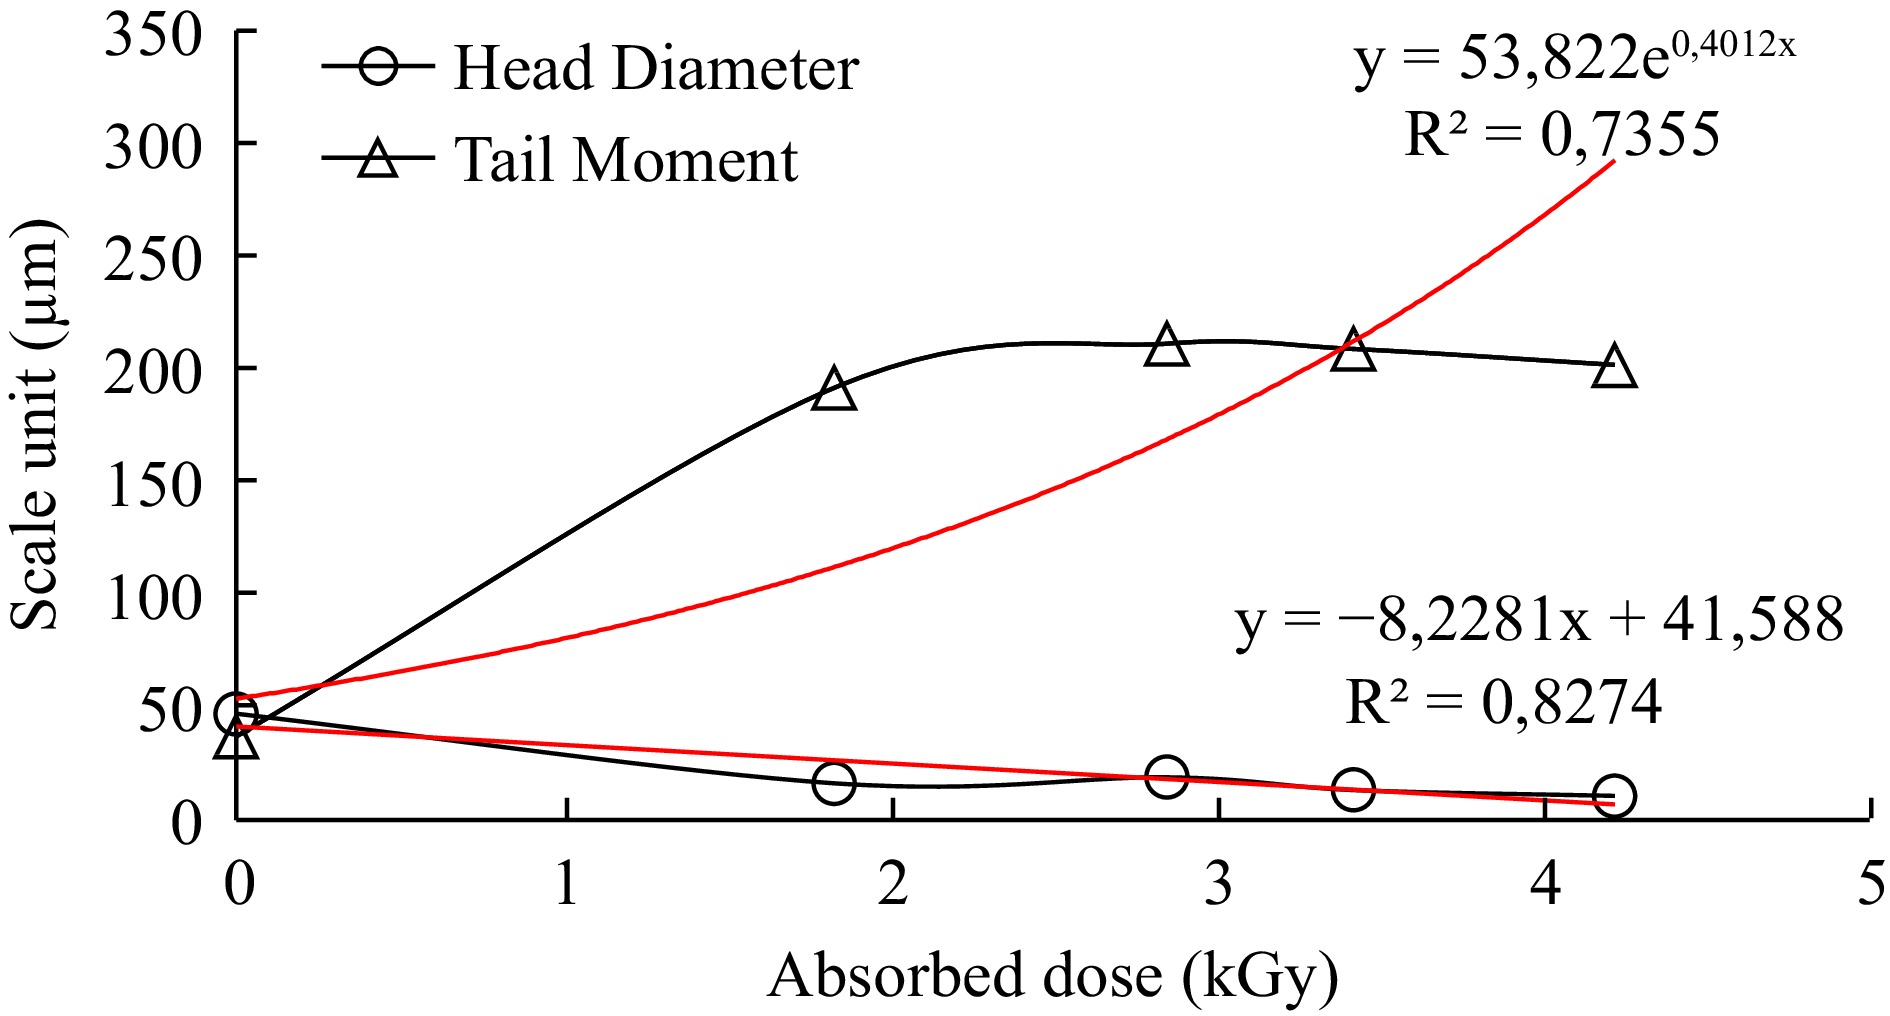
Figure 4.
Dose dependent response curve of head diameter and tail moment for anchovy.
-
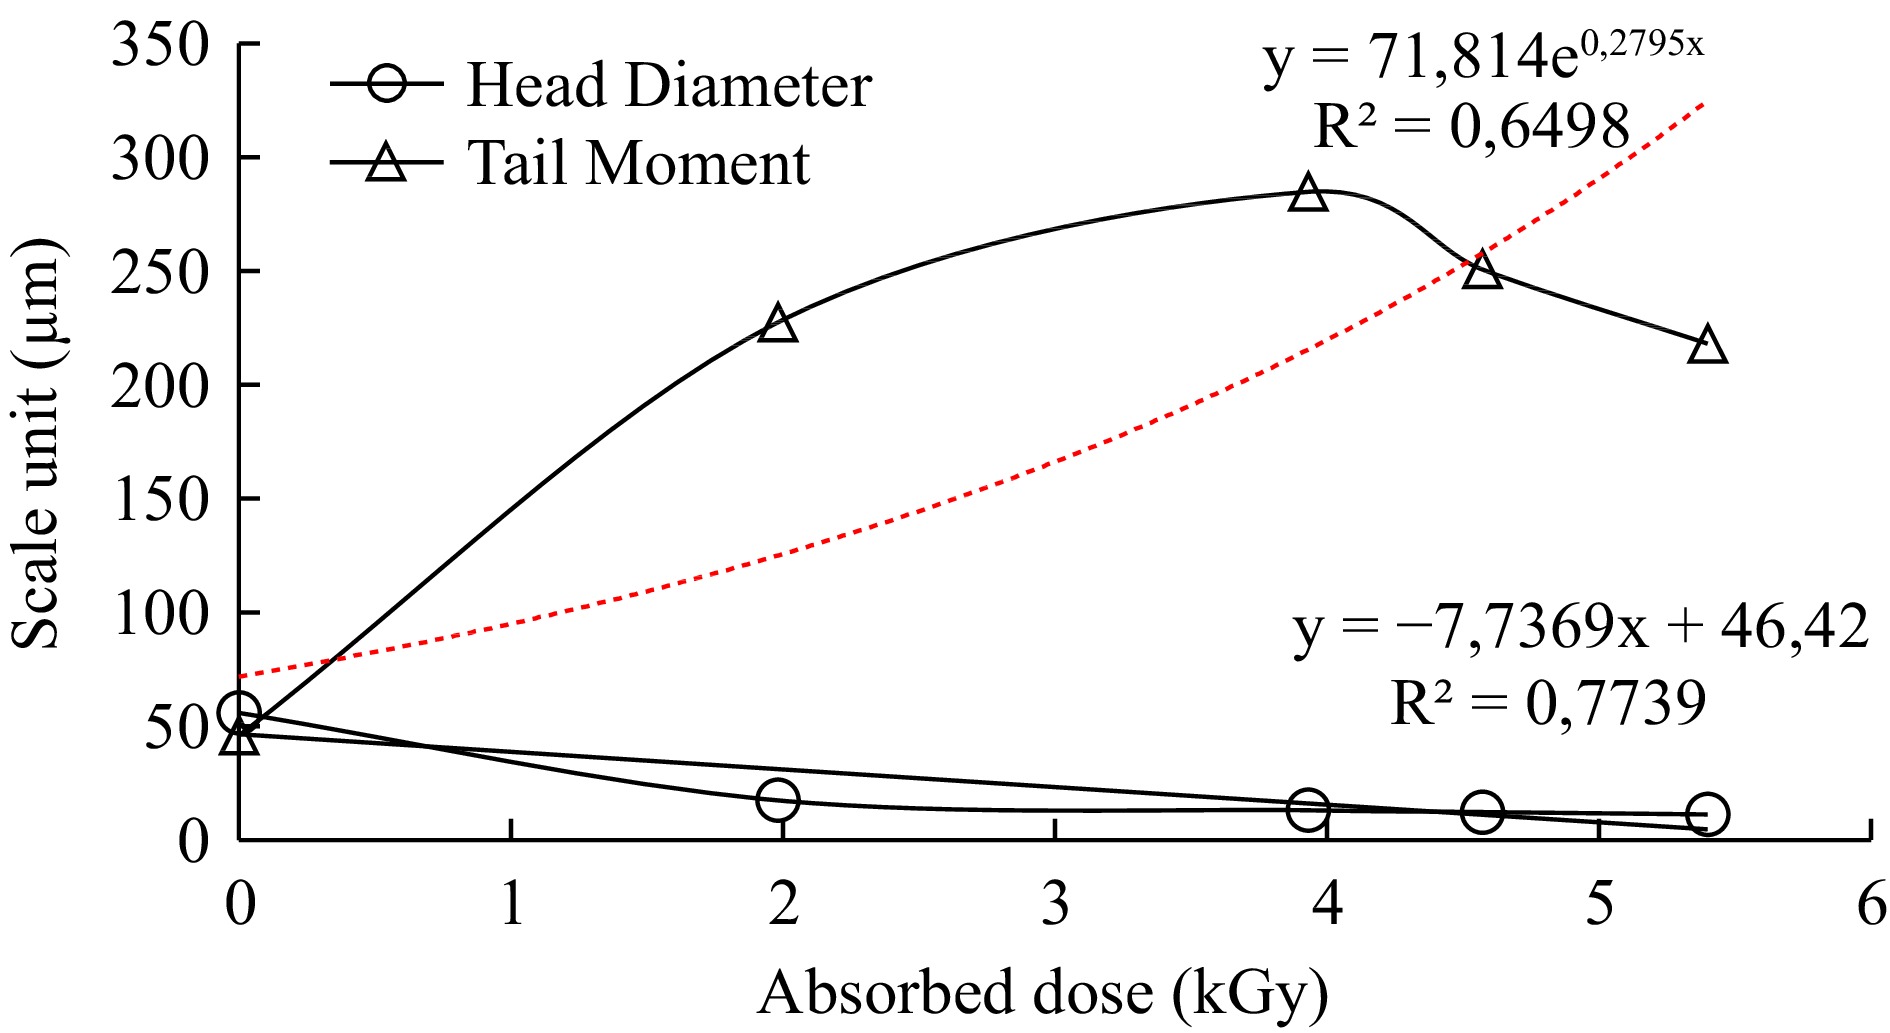
Figure 5.
Dose dependent response curve of head diameter and tail moment for bluefish.
-
Sample Treatment Number of treatment groups Anchovy Control, 1.83, 2.85, 3.42, 4.22 kGy Bluefish Control, 1.98, 3.93, 4.57, 5.40 kGy Number of samples for each group Anchovy 30 Bluefish 3 Number of parallels Anchovy Control
1.83 kGy
2.85 kGy
3.42 kGy
4.22 kGy3
3
3
3
3Bluefish Control
1.98 kGy
3.93 kGy
4.57 kGy
5.40 kGy3
3
3
3
3Table 1.
Sampling and treatment plan.
-
Absorbed dose (kGy) Measured parameters (Mean ± Std. error) HDa HDNAb TDNAc TLd TMe Anchovy Control 47.09 ± 2.07 15.92 ± 1.83 84.08 ± 1.83 42.23 ± 3.64 37.05 ± 3.40 1.83 16.35 ± 0.61 0.70 ± 0.08 99.30 ± 0.08 192.52 ± 1.72 191.68 ± 1.74 2.85 19.00 ± 0.32 0.80 ± 0.04 99.20 ± 0.04 212.58 ± 1.34 211.31 ± 1.35 3.42 13.36 ± 0.18 0.26 ± 0.07 99.74 ± 0.07 209.43 ± 3.13 208.94 ± 3.14 4.22 10.77 ± 0.10 0.13 ± 0.03 99.87 ± 0.03 202.16 ± 1.34 201.88 ± 1.35 Bluefish Control 55.85 ± 1.59 10.52 ± 0.54 89.48 ± 2.07 50.55 ± 0.54 45.76 ± 2.22 1.98 17.29 ± 0.75 0.28 ± 0.04 99.72 ± 5.39 227.88 ± 0.04 227.23 ± 5.39 3.93 12.91 ± 0.12 0.19 ± 0.02 99.81 ± 2.15 285.21 ± 0.02 284.69 ± 2.15 4.57 12.12 ± 2.66 0.25 ± 0.18 99.75 ± 3.15 251.32 ± 0.18 250.69 ± 3.49 5.40 11.07 ± 0.24 0.16 ± 0.02 99.84 ± 2.13 218.35 ± 0.02 217.98 ± 2.13 a HD: Head diameter. b HDNA: Head DNA. c TDNA: Tail DNA% = percent of DNA in the comet tail. d TL: Tail length = length of the comet tail measured from right border of head area to end of tail (micron = pixels). e TM: Tail moment = Tail DNA% × Tail length (DNA% in the tail). Table 2.
The mean values of measured parameters of comets derived from irradiated anchovy and bluefish.
Figures
(5)
Tables
(2)