


-
Anchovy and bluefish are widely consumed and very popular in Türkiye. Considering total fishery production in Türkiye, its volume was about 630,000 tones and shared as: marine capture, 51%; aquaculture, 44% and inland capture, 5% in 2017[1]. The most important habitats of anchovies (commonly, 12−15 cm in length) are the Eastern North and Central Atlantic, Black and Azov Seas. Bluefish (approximately, 20−60 cm in length) are a vigorous, fast, greedy predator, attacking other fish such as anchovies and this fish species finds a habitat in tropical and subtropical seas such as the Western and Eastern Atlantic Ocean, the Mediterranean and the Black Sea[2]. Sea food is extremely perishable products with a narrow shelf life. However, several days lengthening of the shelf life leads to the industry's viability and marketing capacity of sea food[3]. It is recommended that these products can be irradiated at doses of up to 3 kGy which results in a marked drop (app. 2−5 Log10 reduction) of vegetative bacterial pathogen count in fish[4]. During this process, the type of radiation and the energy level, as well as the composition, physical condition, temperature and atmospheric conditions of the food are seen as the main factors determining the effectiveness of the application. While primary radiolysis effects cause chemical changes, highly reactive intermediates undergo various reactions to form stable chemical products. Chemical changes in living materials, on the other hand, produce biological results[5]. Following ionization, physical injury and/or chemical changes occur first, followed by DNA damage, which results in cell death (early effects) and sublethal cellular changes (genetic effects and cancer), respectively[6]. According to Zanardi et al.[7] the flavor-related secondary modifications in irradiated food are those that occur. Lipid oxidation, the emergence of mercaptans, and the depletion of antioxidant vitamins C and E are all factors that contribute to this outcome. The primary radiolytic byproducts include certain cholesterol oxides and furans, as well as 2-alkylcyclobutanones (2-ACBs) made from the principal fatty acids in foods.
Comet assay or single cell gel electrophoresis assay (SCGE) has become an adaptable method to detect DNA damage in cells and tissues since its ability to measure DNA damage in the form of strand breaks generated by the action of different processes such as irradiation, due to its various advantages, including sensitivity, speed, simplicity, and cost effectiveness[8−11]. Specifically, the comet assay name is derived from the detection of DNA strand breaks and the resulting 'comet' formation in cell DNA as a result of various factors and is based on the principle that damaged DNA migrates at a different rate than undamaged DNA during electrophoresis. That is, when a single cell suspension containing damaged DNA embedded in low-melting agarose is subjected to electrophoresis, the damaged DNA resembling the structure of a comet migrates at a different rate away from the nucleoid body containing undamaged DNA[12]. While this situation is seen in irradiated samples, if the untreated samples do not undergo any DNA fragmentation processes, they always contain intact cells that are not identified as 'comets'. Whereas, unharmed cells can not be observed in an irradiated sample, and the shape of the 'comet' can be used as an indicator of the increase in the applied dose value[13]. After intensive research programs, the European Committee of Standardization (CEN) adopted the DNA comet assay as EN 13784 for the detection of irradiated foods -screening method[14]. In recent years, comet assay has been recognized by different authors[15−19] as a valuable method for detection of irradiation in sea foods. Cerda et al.[20] firmly stated that the development of simple and rapid tests to detect irradiated foods will facilitate food control, and, as a result, consumers will be more confident that radiation processing is properly supervised.
In this context, the DNA comet assay has an important feature as a simple, low-cost, and fast screening test for qualitative detection of various irradiated foods. Therefore, the purpose of this research was to quantify the applied radiation doses by using the DNA comet assay together with image analysis in irradiated anchovies and bluefishes where quantification of DNA comet analysis parameters was not encountered in these fish in previous articles.
-
Anchovy (Engraulis encrasicolus) samples were obtained in November and bluefish (smaller) (Pomatomus saltarix) in September from the Black Sea coast of Türkiye and transferred to the Nuclear Energy Research Institute (Ankara) on dry ice in a non-air-tight insulated container (cooler). After about 8 h of transport, collected dead fish samples were prepared for irradiation treatments according to the following sampling plan: i) number of treatment groups: five (control and four different irradiation doses); ii) the number of samples for each group: three (bluefish), 30 (anchovy); iii) the number of parallels: three in every treated sample (Table 1). Anchovy and bluefish samples for each dose level were packed in labelled polyethylene bags, and identified with their respective irradiation doses.
Table 1. Sampling and treatment plan.
Sample Treatment Number of treatment groups Anchovy Control, 1.83, 2.85, 3.42, 4.22 kGy Bluefish Control, 1.98, 3.93, 4.57, 5.40 kGy Number of samples for each group Anchovy 30 Bluefish 3 Number of parallels Anchovy Control
1.83 kGy
2.85 kGy
3.42 kGy
4.22 kGy3
3
3
3
3Bluefish Control
1.98 kGy
3.93 kGy
4.57 kGy
5.40 kGy3
3
3
3
3Sample irradiation
-
Whole anchovy and bluefish samples were irradiated in a gamma cell (60Co, dose rates were 1.29 and 1.32 kGy/h, respectively) at Nuclear Energy Research Institute, Ankara, Türkiye. Harwell Amber 3042 dosimeters were used for the measurement of radiation dose. Absorbed doses were determined in anchovy and bluefish samples with the dose of 1.83, 2.85, 3.42, 4.22 kGy and 1.98, 3.93, 4.57, 5.40 kGy, respectively (Table 1). Just after irradiation, samples were analyzed by DNA Comet Assay[21].
DNA comet assay
-
Randomly selected 1 g fillet meat slices was transferred into a beaker; 5 mL of ice-cold phosphate-buffered saline (PBS) was added and stirred (5 min, 500 rpm). The formed suspension was filtered through 500 and 200 µm cloth sieves, respectively, and left on ice for about 5 min. The obtained supernatant was used as a cell suspension (100 µL) which was mixed with 1 mL of low-melting agarose (0.8% in PBS). One hundred µL of this mixture was spread on precoated slides. Then, immersion of coated slides was conducted in a lysis buffer (0.045 M TBE, pH 8.4, containing 2.5% SDS) for 2−9 min. Next, electrophoresis was carried out at 2 V/cm for 2 min using a buffer with the same properties but without SDS. Propidium iodide was used to visualize DNA as described in TS EN 13784 TR[21].
Evaluation of comets by image analysis
-
Observed comets from the DNA comet assay were evaluated by image analysis in terms of the comet parameters to interpret and estimate the applied doses. Prepared slides were examined with a standard transmission microscope (Olympus BX 51) at 20 X and featured/quantified by a digital color video camera (Pixera) with software image analysis (BS200 ProP, BAB Imaging System, Ankara, Türkiye). Applied image analysis software provides automatic and semi-automatic analysis opportunities. Measured comet parameters were available immediately after 3 s[22−24].
-
It is well known that ionizing radiation causes DNA breakage[25]. The pattern formed by the DNA and its apparent fragments (comet) depends on the applied radiation dose[15]. The comet assay technique is based on determination of DNA breaks and it has been applied to several meat tissue samples such as fish[15−19]. Previous confirmed that comet assay is a valuable method for the determination of irradiation in seafood. Therefore, the main goals of the current study were to quantify and evaluate some critical parameters of comet assay analysis in the irradiated anchovy and bluefish samples for official market checks for consumer health concerns.
This research covered estimation of the effect of gamma irradiation in different doses on DNA of anchovy and bluefish by using comet assay and measurements of the values of different comet as quantified with BS 200 ProP, BAB Imaging System software. The generated data is shown in Table 2.
Table 2. The mean values of measured parameters of comets derived from irradiated anchovy and bluefish.
Absorbed dose (kGy) Measured parameters (Mean ± Std. error) HDa HDNAb TDNAc TLd TMe Anchovy Control 47.09 ± 2.07 15.92 ± 1.83 84.08 ± 1.83 42.23 ± 3.64 37.05 ± 3.40 1.83 16.35 ± 0.61 0.70 ± 0.08 99.30 ± 0.08 192.52 ± 1.72 191.68 ± 1.74 2.85 19.00 ± 0.32 0.80 ± 0.04 99.20 ± 0.04 212.58 ± 1.34 211.31 ± 1.35 3.42 13.36 ± 0.18 0.26 ± 0.07 99.74 ± 0.07 209.43 ± 3.13 208.94 ± 3.14 4.22 10.77 ± 0.10 0.13 ± 0.03 99.87 ± 0.03 202.16 ± 1.34 201.88 ± 1.35 Bluefish Control 55.85 ± 1.59 10.52 ± 0.54 89.48 ± 2.07 50.55 ± 0.54 45.76 ± 2.22 1.98 17.29 ± 0.75 0.28 ± 0.04 99.72 ± 5.39 227.88 ± 0.04 227.23 ± 5.39 3.93 12.91 ± 0.12 0.19 ± 0.02 99.81 ± 2.15 285.21 ± 0.02 284.69 ± 2.15 4.57 12.12 ± 2.66 0.25 ± 0.18 99.75 ± 3.15 251.32 ± 0.18 250.69 ± 3.49 5.40 11.07 ± 0.24 0.16 ± 0.02 99.84 ± 2.13 218.35 ± 0.02 217.98 ± 2.13 a HD: Head diameter. b HDNA: Head DNA. c TDNA: Tail DNA% = percent of DNA in the comet tail. d TL: Tail length = length of the comet tail measured from right border of head area to end of tail (micron = pixels). e TM: Tail moment = Tail DNA% × Tail length (DNA% in the tail). During analysis, it was found that the cells' thread breaks appeared like the tails of a comet. In the classification made by eye under the microscope before image analysis and based on a morphological basis, the criteria reported by Marín-Huachaca et al.[17] were taken into consideration. After microgel electrophoresis of cells from control and irradiated fishes, observed images of DNA comets were shown in Fig. 1. The measured parameters were obtained as a result of the evaluation of the detected comets with image analysis and are shown in Table 2, Figs 2 & 3.
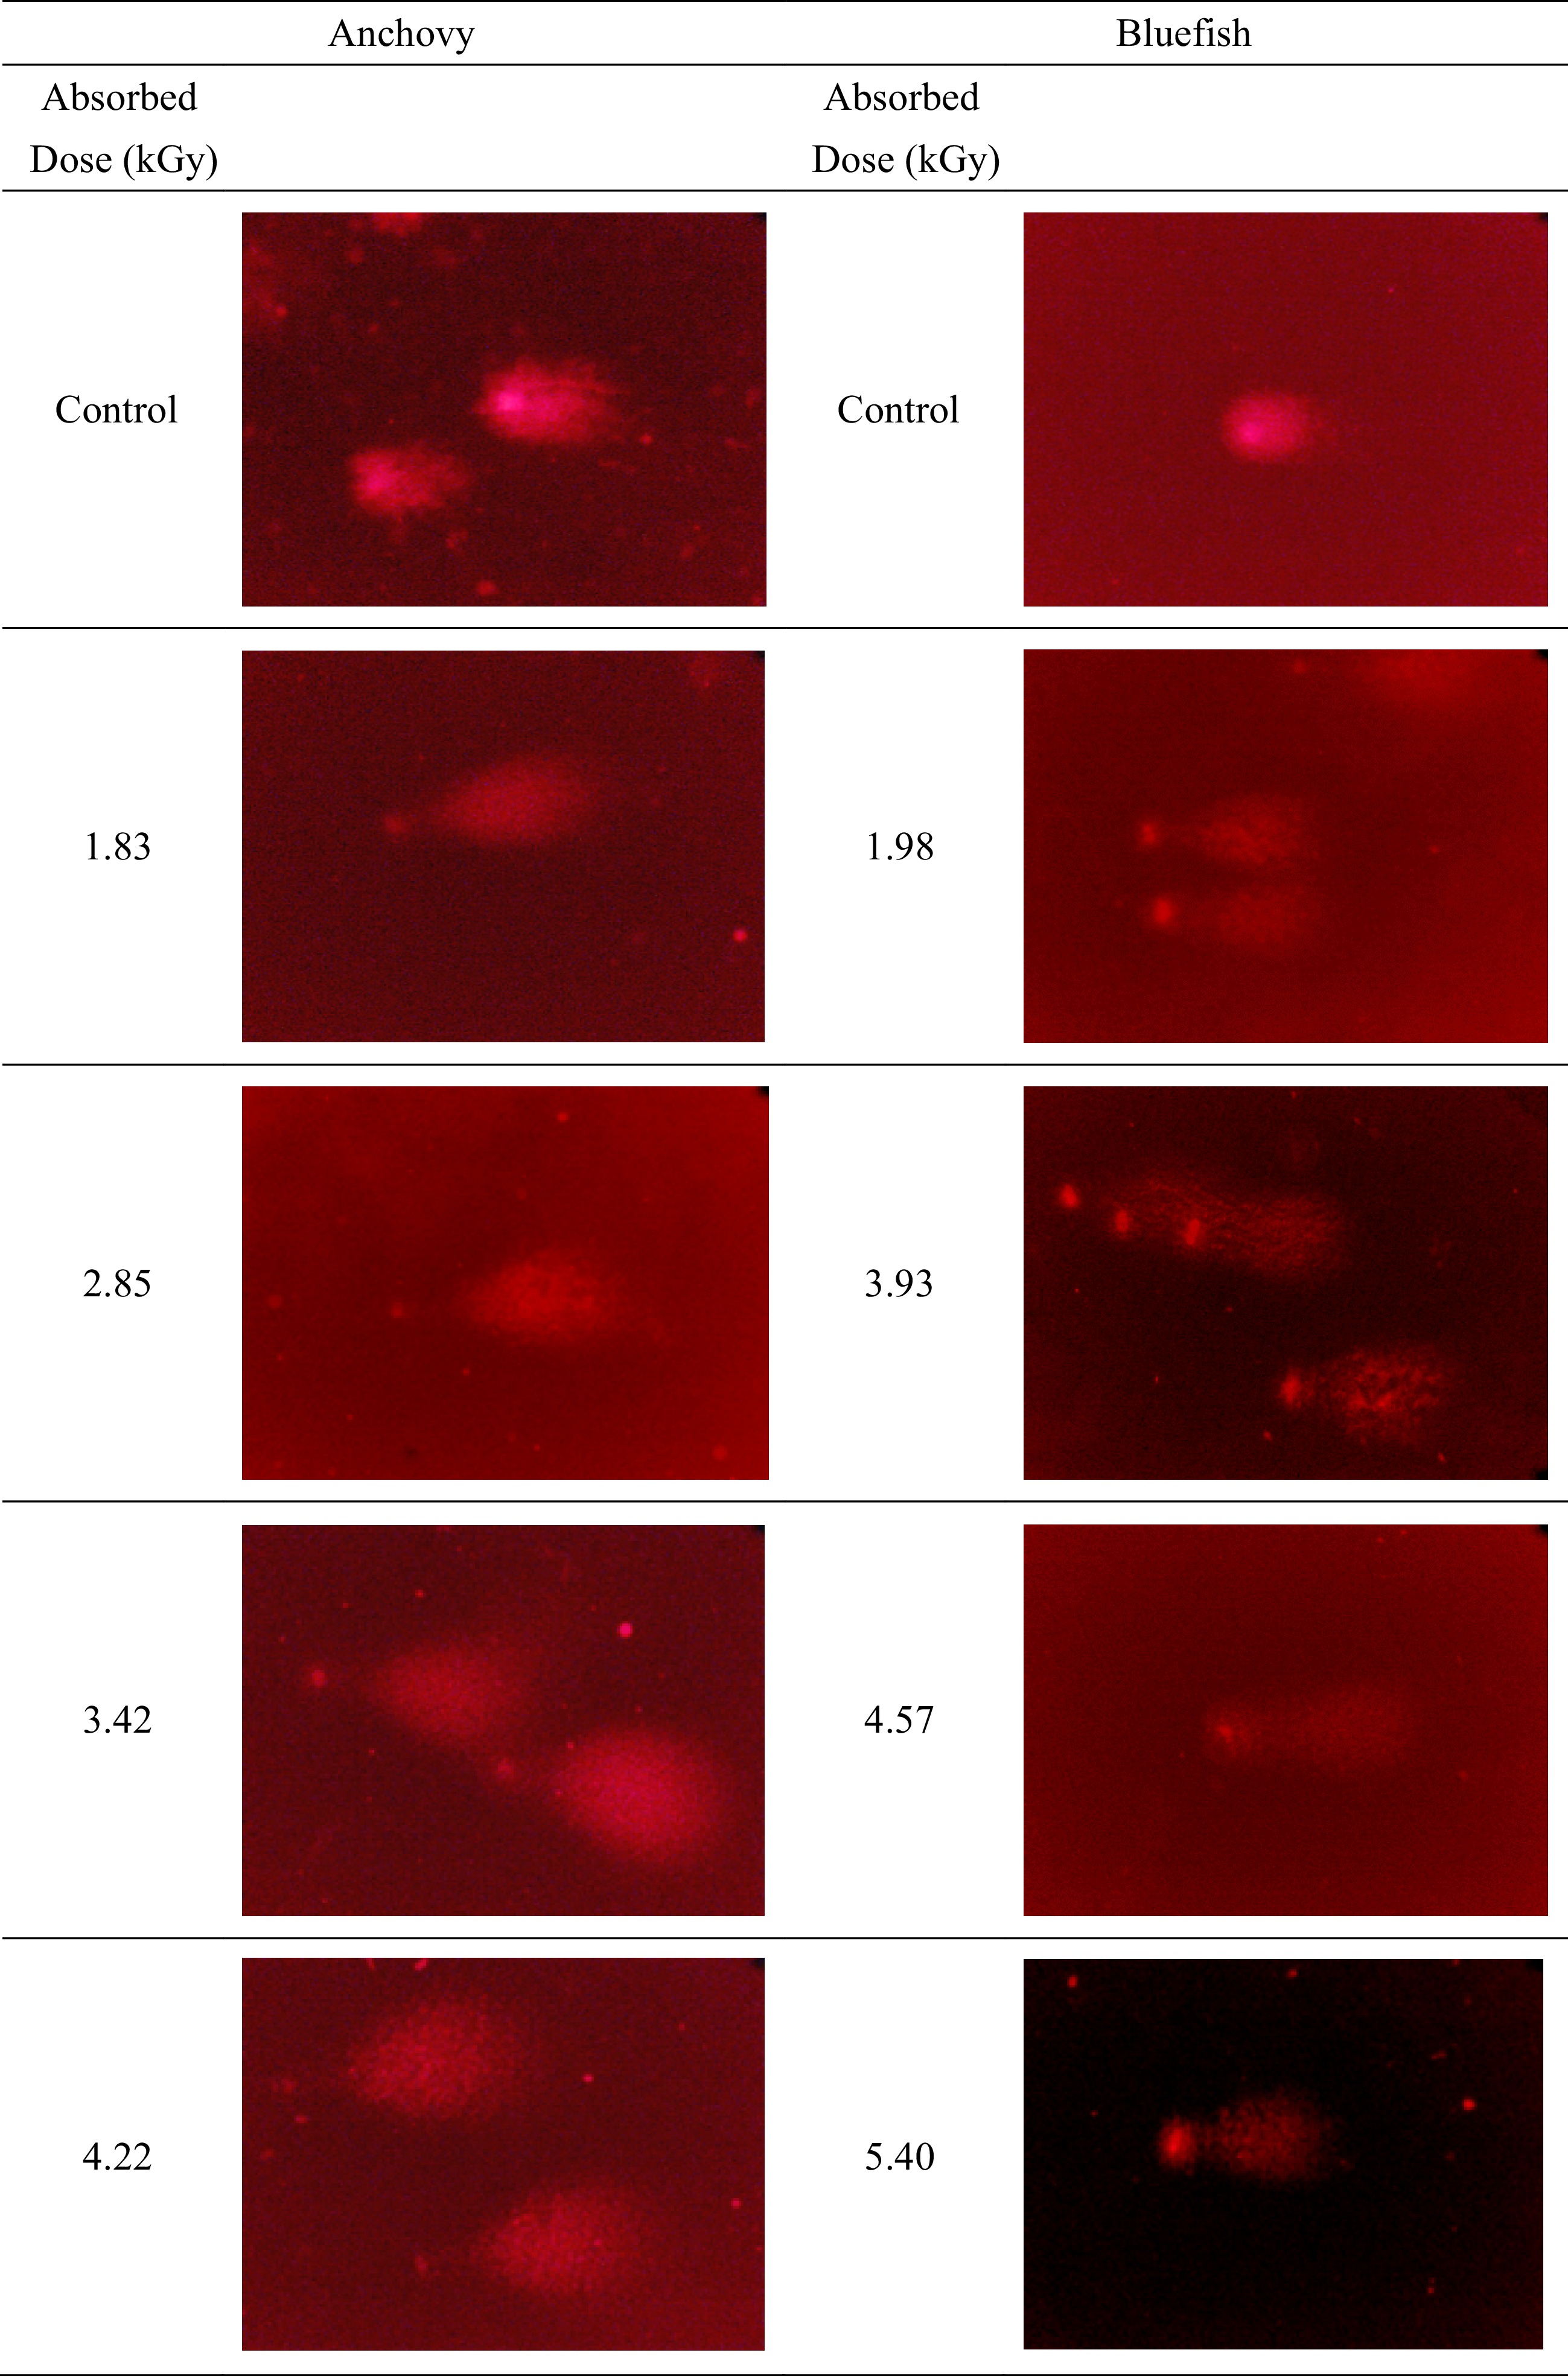
Figure 1.
Typical DNA comets are from anchovy and bluefish. Electrophoresis conditions: 2 V/cm for 2 min, propidium iodide staining. All slides were examined at a magnification of 20×.
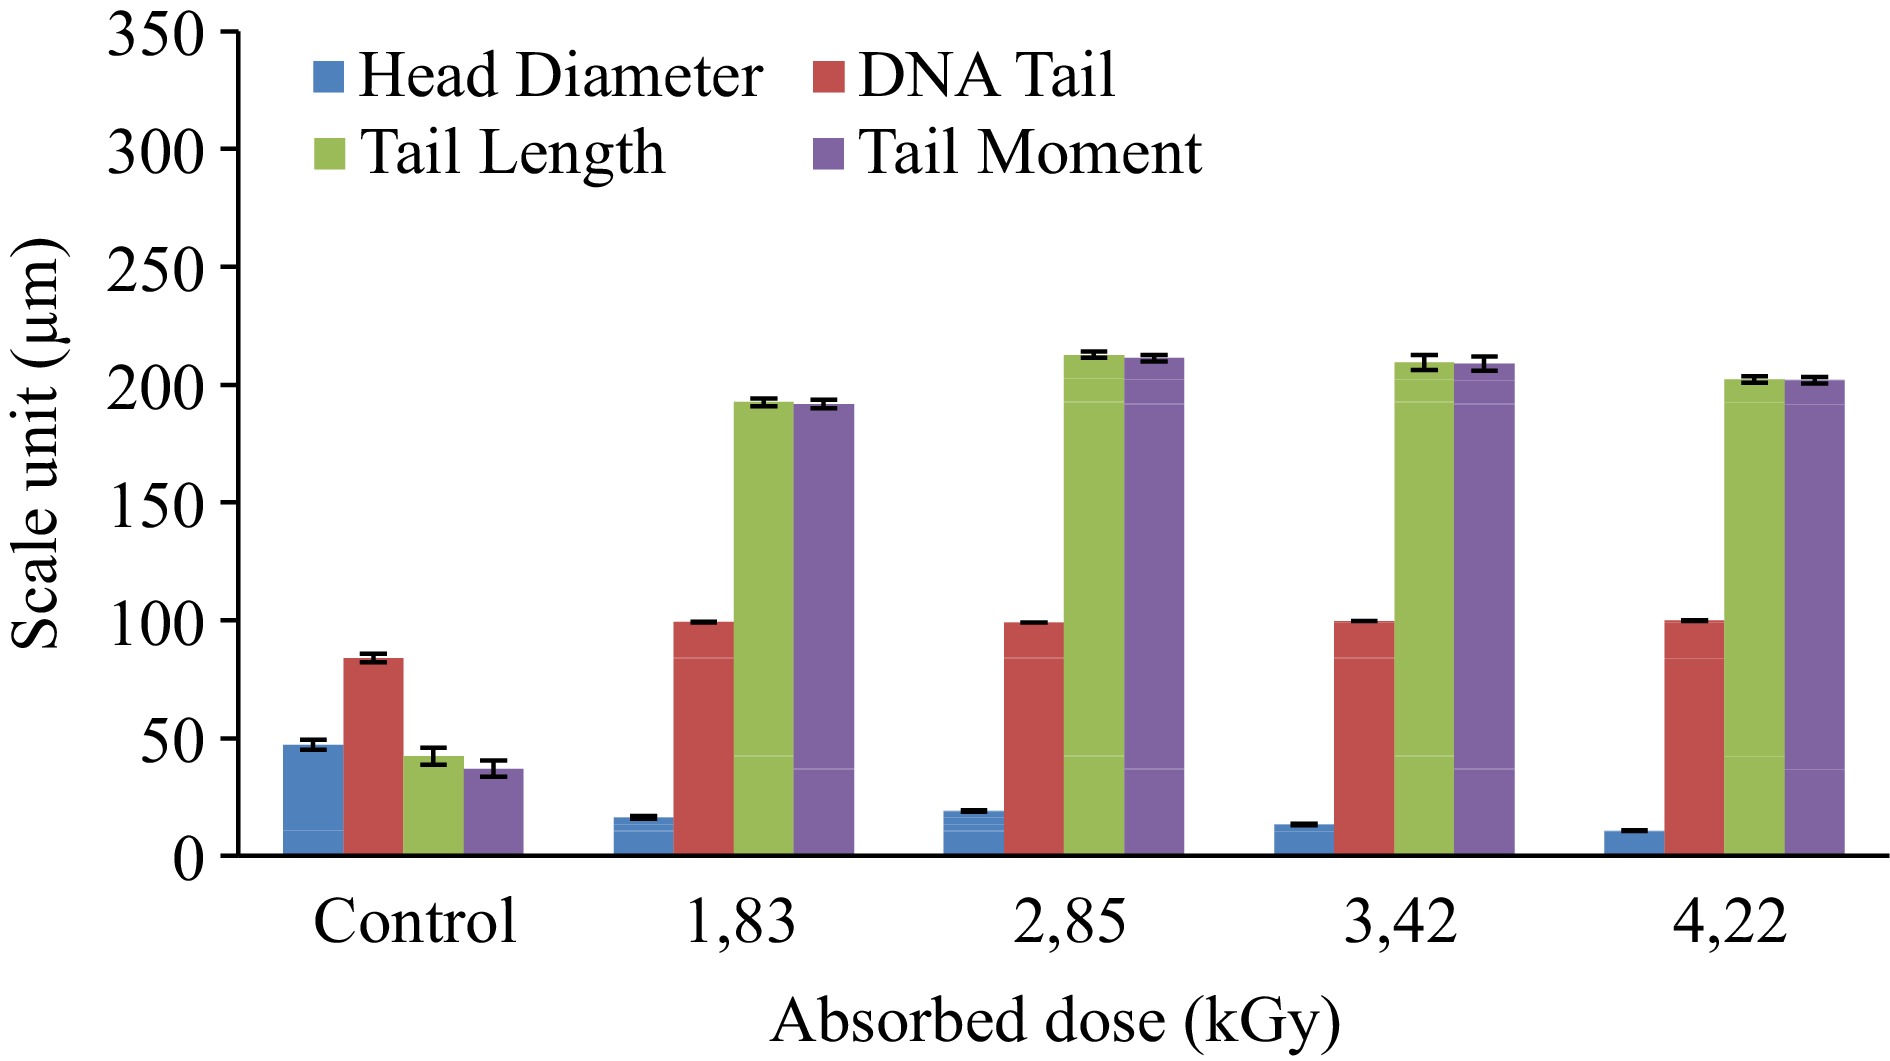
Figure 2.
Changes in measured DNA comet parameters in anchovy samples.
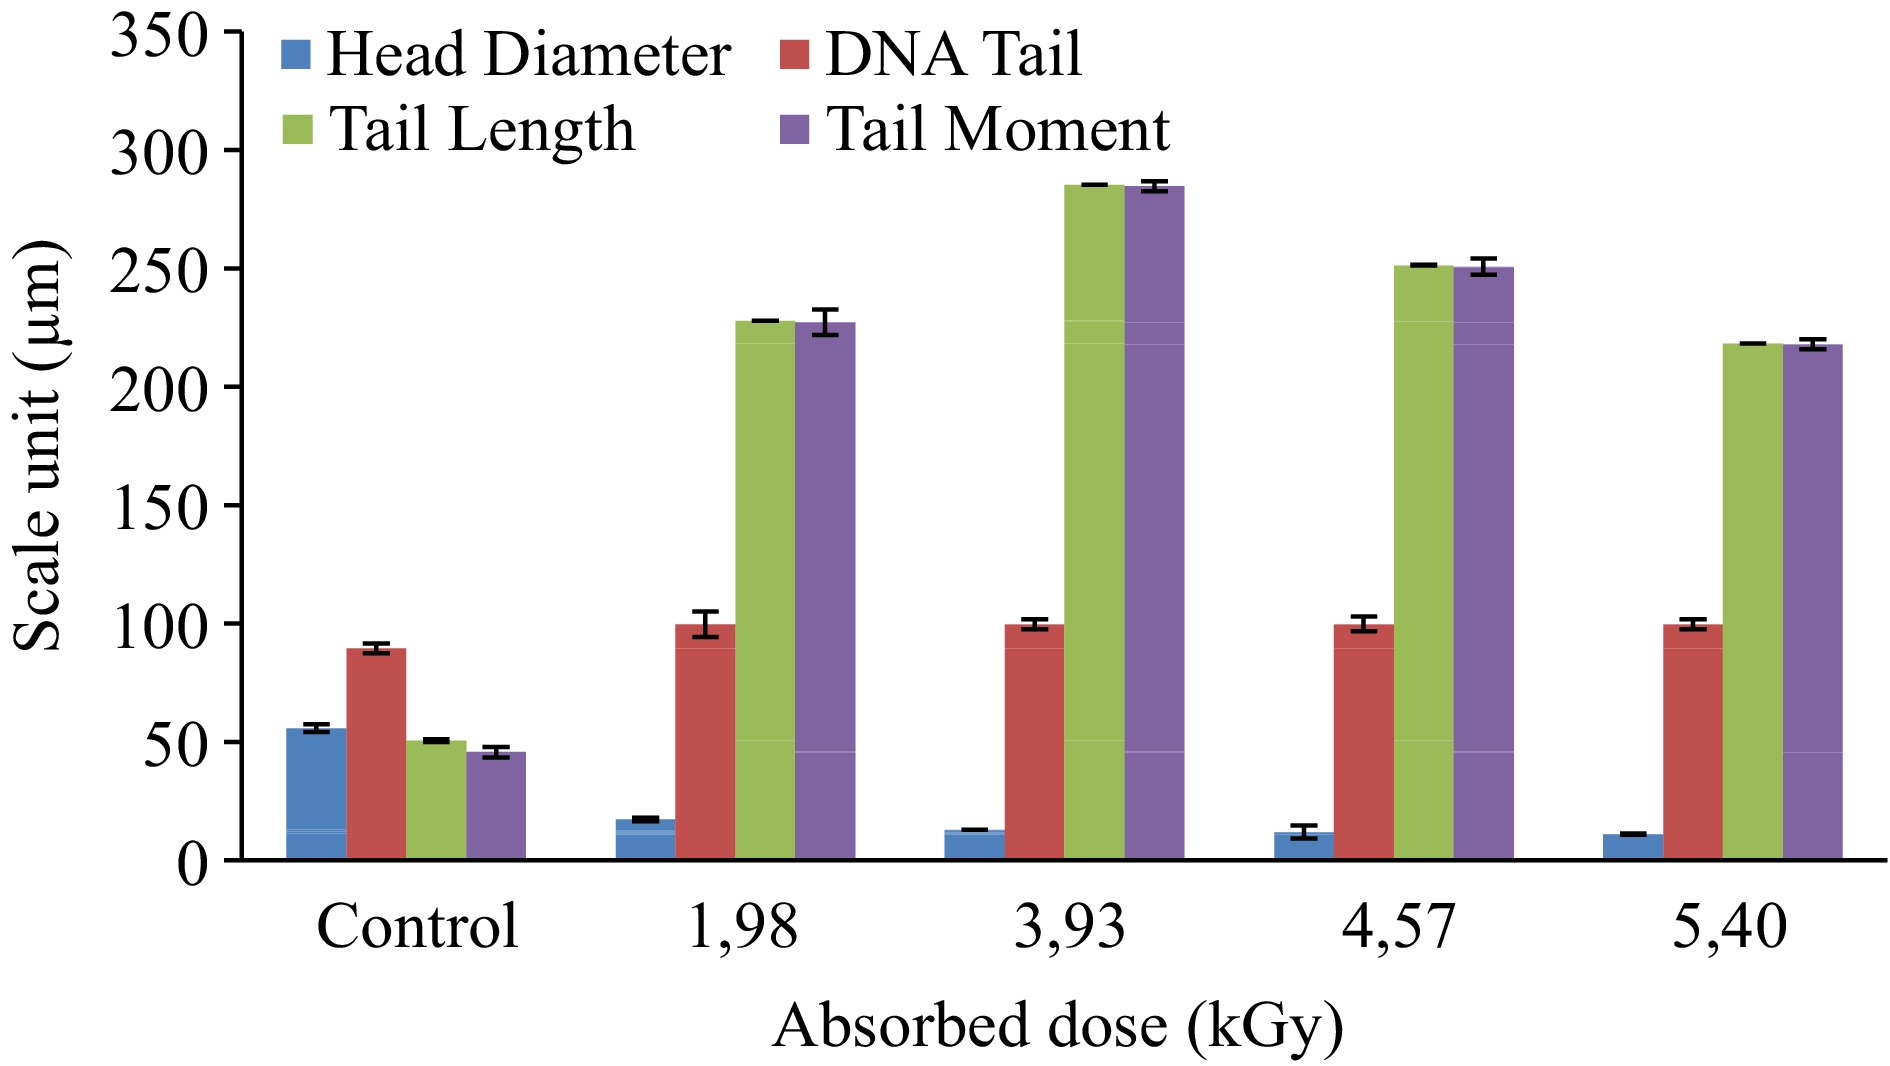
Figure 3.
Changes in measured DNA comet parameters in bluefish samples.
The visual examinations allowed rapid sorting and characterization since untreated tissue samples generally have intact structure, but irradiated samples demonstrated increased DNA degradation in terms of increased irradiation doses.
Such as the comet head parameter, the important parameters in fish samples were markedly changed depending on the dose. Measurement of fragmented DNA migration from the nucleoid body determines its comet head parameters[26]. Increased irradiation doses for anchovy samples resulted in a decrease in head diameter and head DNA parameters from 47.09 to 10.77 µm and from 15.92 to 0.13 µm, respectively. These parameters in bluefish samples declined from 55.85 to 11.07 µm and from 10.52 to 0.16 µm, respectively. Furthermore, tail length and tail moment are commonly used parameters[27]. The tail length (TL) expresses the difference between the greatest movement size of a single tail and the diameter of the comet's head. Furthermore, this parameter reveals the change in tail morphology very clearly. The rotational fluorescence intensity in the tail can be expressed accurately as the tail moment (TM)[28].
The percentage of DNA in the comet's tail (Tail DNA) is another commonly used parameter for DNA damage. According to Collins et al.[29], 1 Gy of X- or γ-irradiation induces 0.31 breaks per 109 Daltons of DNA. Similar results were found when comparing doses of the detected DNA with the comet assay. Considering our results are related to these parameters in irradiated fish tissues, a significant dose-dependent increase was noticed in tail DNA%, tail length and tail moment parameters (Table 2, Figs 2 & 3).
The head diameter and tail moment parameter measurements were gathered after exposure to different levels of radiation, correlated with the radiation dose and the square of the correlation coefficient (R2) values calculated for the parameters. Dose dependent response curves of samples were shown in Figs 4 & 5.
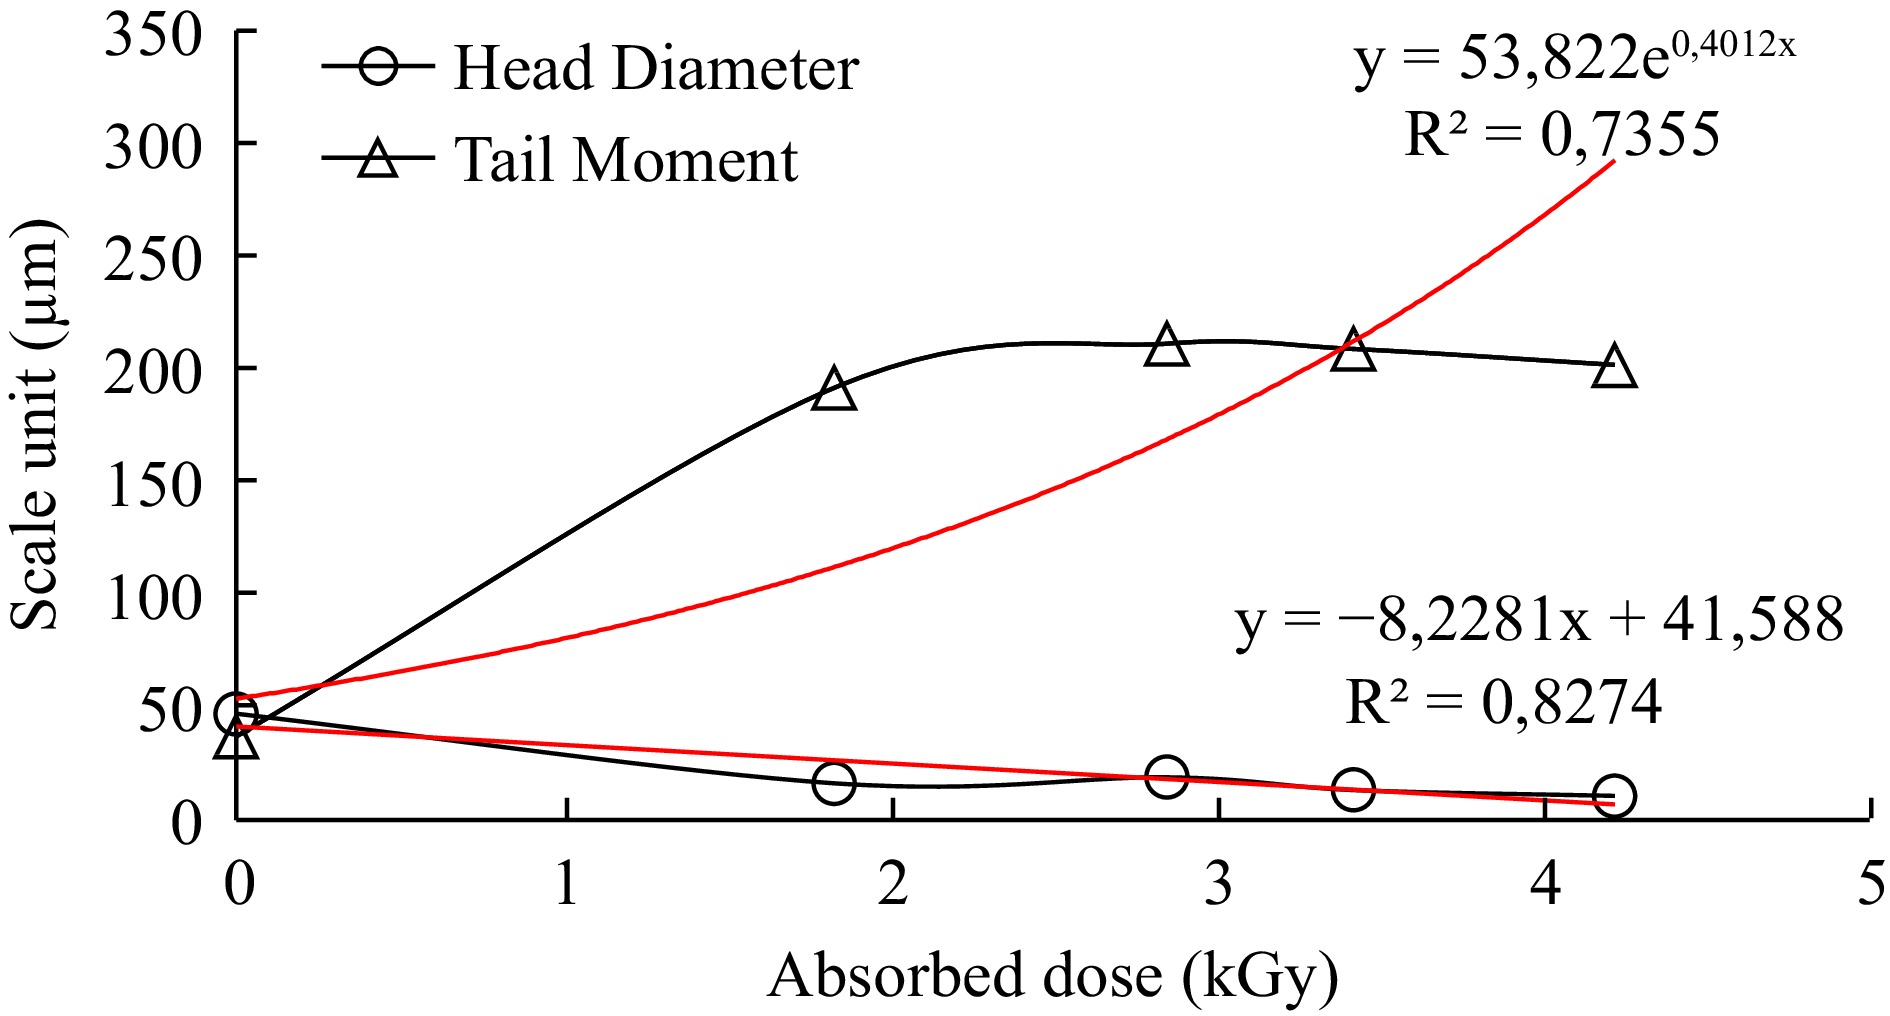
Figure 4.
Dose dependent response curve of head diameter and tail moment for anchovy.
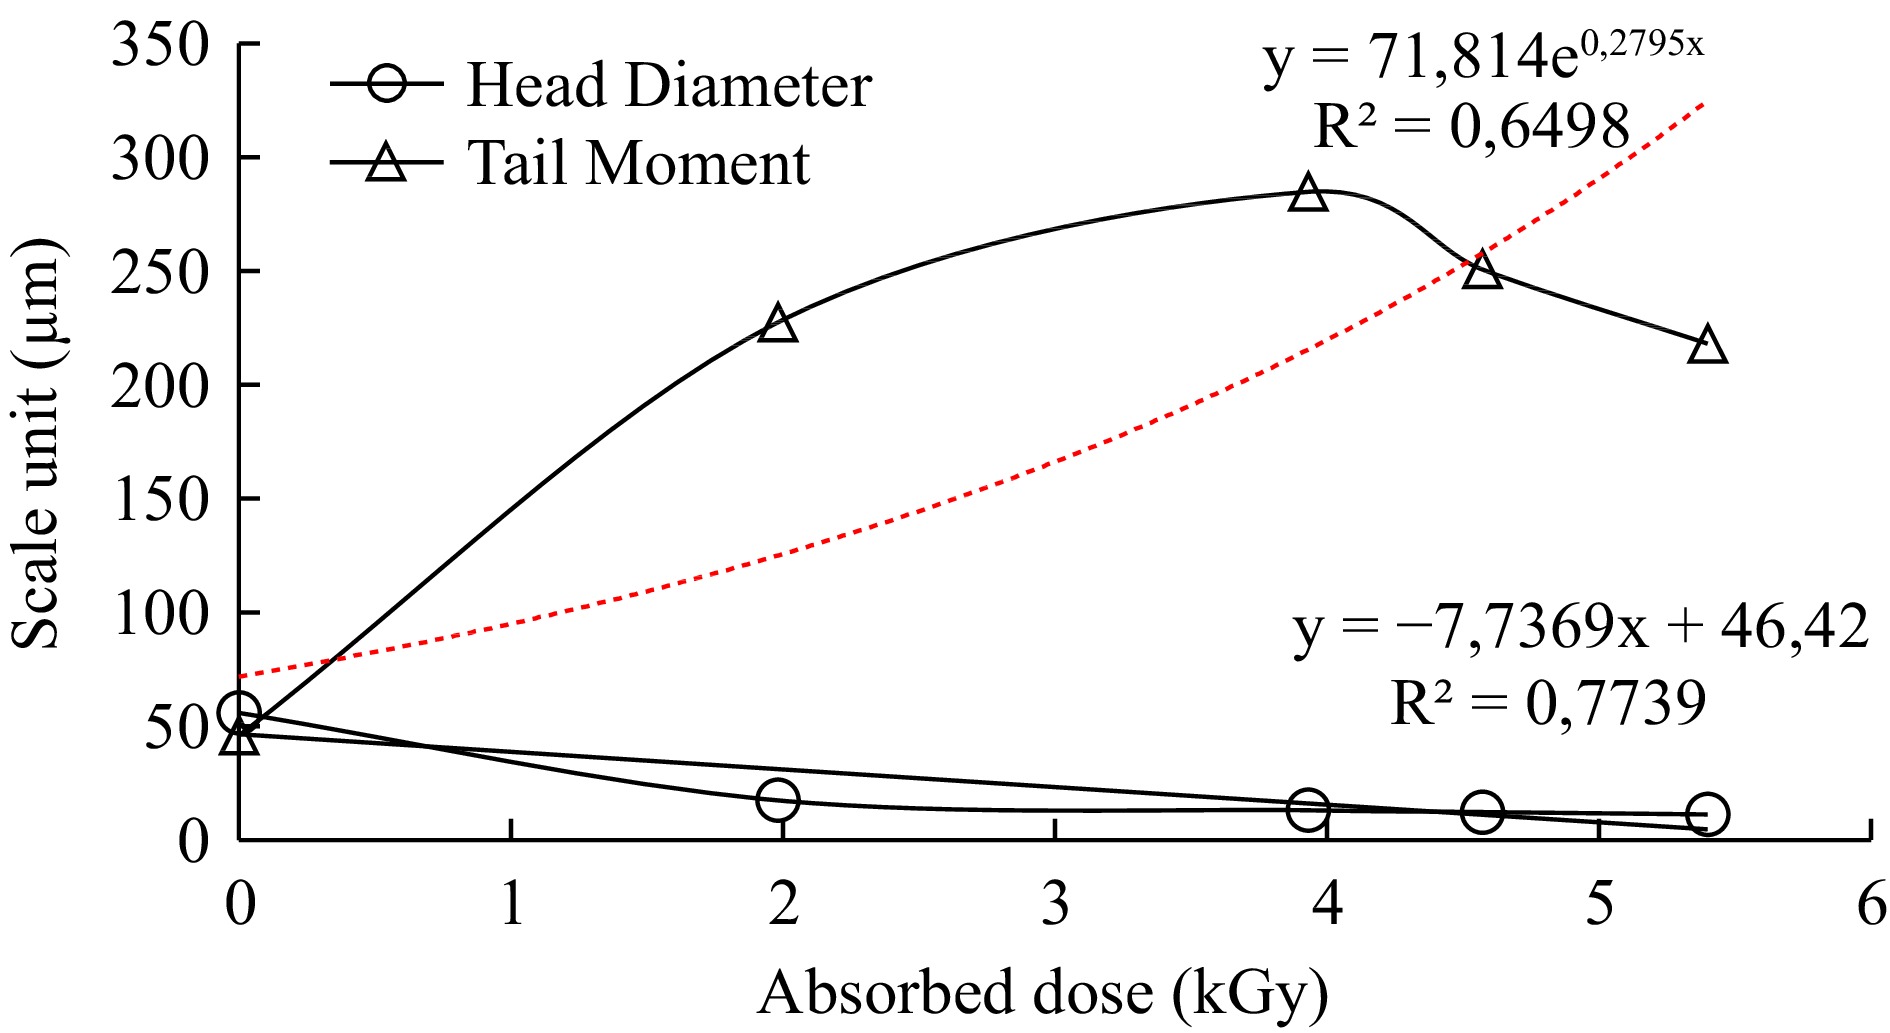
Figure 5.
Dose dependent response curve of head diameter and tail moment for bluefish.
The ratio of the density of the tail of the comet to the head of the comet reveals DNA damage[27]. The tail moment was significantly increased in anchovy and bluefish samples in a dose-dependent manner in response to radiation, with R2 values of 0.74 and 0.65, respectively. Furthermore, the R2 values of the determined Head Diameter parameters were 0.83 and 0.77, respectively. They showed a linear dose-response relationship with DNA damage in increased dose ranges.
Quantification of comets was carried out by image analysis to evaluate changed parameters in terms of exposed doses. First of all, the results revealed that no comets in untreated fish samples were determined since there was no DNA damage at 0 kGy as shown in Fig. 1. Determined comets were compared to irradiated ones with a round shape, a large and intense head and a short tail in untreated tissues. Whereas, the results of irradiated anchovy (1.83, 2.85, 3.42, 4.22 kGy) and bluefish (1.98, 3.93, 4.57, 5.40 kGy) samples all showed comets depending on DNA damage (Fig. 1). In a previous study, irradiated (0, 2.5 and 5 kGy) and cold stored (2 °C) salmon samples were analyzed by Cerda[15]. One day after irradiation, the typical pattern of irradiated cells (2−3 times longer than comets compared to untreated ones) was determined. Secondly, a decrease in head diameter and head DNA parameters suggests that DNA damage occurred after an increased irradiation dose. Some DNA comet assay parameters investigated in a wide range of radiation doses (0.25, 0.50, 1, 3, 5, 7, and 9 kGy) for rainbow trout samples and reported that proportionally with increasing irradiation dose, the comet's tail length increased while the amount in the comet's head decreased[18]. Thirdly, tail moment also changed exponentially with increasing doses in both anchovy and bluefish R2 = 0.74, R2 = 0.65, respectively. Head diameter values of samples declined linearly R2 = 0.83, R2 = 0.77, respectively (Figs 2 & 3). These results revealed that irradiation treatments up to 5 kGy induced a significant increase in DNA damage in treated fish samples. In another study, the fish samples (salmon, sardine, halibut, herring, plaice, saithe and squid) were irradiated (0.5−5 kGy and in the presence of ice) and stored (−20 °C and 1, 3 and 7 d).
Khan et al.[16] stated that this assay could be used properly for determining radiation processing at low doses, such as 0.5 kGy for salmon fish. On the other hand, this analysis has failed for halibut, herring, plaice (due to fast natural degradation of DNA), saithe and squid (since there is nonisolation of DNA material).
Consequently, radiation-processing leads to an extensive molecular size reduction of DNA in treated samples. Our findings are consistent with previous DNA comet studies on animal-origin foods, specifically different fish samples.
-
The identification of irradiated foods using the analytical method is considered as an important tool in terms of both national and international market control. It permits consumers to buy irradiated foods for eating that have been inspected with oversight by public health agencies. This paper covered the DNA comet assay with image analysis that was carried out to reveal DNA damage levels in anchovy and bluefish samples at applied irradiation doses. Regarding the identification of critical assay parameters (head diameter, head DNA, tail DNA%, tail length and tail moment) and the interpretation of results, irradiation treatment up to 5 kGy induced a significant increase in DNA damage in fish meat. Radiation treated fish tissues were easily distinguished from unirradiated (control) samples after irradiation. Therefore, it is highly feasible that irradiated fish samples will be determined by this screening technique together with image analysis and it can be put into application as a precise routine checking method. As a result, it is fundamentally preferable to rely on a solid and proven, already configured analysis system.
-
The authors confirm contribution to the paper as follows: study conception and design: Cetinkaya N, Erel Y, Ercin D, Ozvatan S, Yazici N; data collection: Erel Y, Ercin D, Ozvatan S, Yazici N, Ic E; analysis and interpretation of results: Yazici N, Ic E; draft manuscript preparation: Cetinkaya N, Ic E. All authors reviewed the results and approved the final version of the manuscript.
-
To be supplied by author.
The authors gratefully thank the Turkish Energy, Nuclear and Mineral Research Agency, Nuclear Energy Research Institute for the financial support (Project No. A3.H1.P5.01).
-
The authors declare that they have no conflict of interest.
- Copyright: © 2023 by the author(s). Published by Maximum Academic Press on behalf of Nanjing Agricultural University. This article is an open access article distributed under Creative Commons Attribution License (CC BY 4.0), visit https://creativecommons.org/licenses/by/4.0/.
-
About this article
Cite this article
Cetinkaya N, Ic E, Erel Y, Ercin D, Ozvatan S, et al. 2023. Estimation of the applied doses in irradiated anchovy and bluefish for shelf-life extension using image analysis in combination with DNA comet assay. Food Materials Research 3:32 doi: 10.48130/fmr-0023-0032 

Estimation of the applied doses in irradiated anchovy and bluefish for shelf-life extension using image analysis in combination with DNA comet assay
- Received: 16 June 2023
- Accepted: 08 September 2023
- Published online: 10 November 2023
Abstract: The objective of the present study was to estimate applied doses of irradiated anchovy (1.83−4.22 kGy) and bluefish (1.98−5.40 kGy) for shelf-life extension by using image analysis in combination with comet assay for trading irradiated fish, especially for public health concerns. Comet assay was carried out considering the EN 13784 protocol. Observed comets were evaluated and recorded by the use of image analysis software (BS 200 ProP). Comets with long tails were observed in the irradiated anchovy and bluefish tissues. However, limited numbers of comets in intact cells were determined in the unirradiated samples. The obtained results clearly indicated that head diameter, head DNA, tail DNA, tail length, and tail moment parameters showed very good correlation (R2 = 0.82 and 0.77 for anchovy and bluefish respectively) with the applied doses of irradiation. Using image analysis in combination with comet assay may be a very useful tool for quantification of absorbed doses for local market checks and also in imported irradiated fish for official control at customs.
-
Key words:
- Anchovy /
- Bluefish /
- DNA /
- Comet assay /
- Irradiation.