-
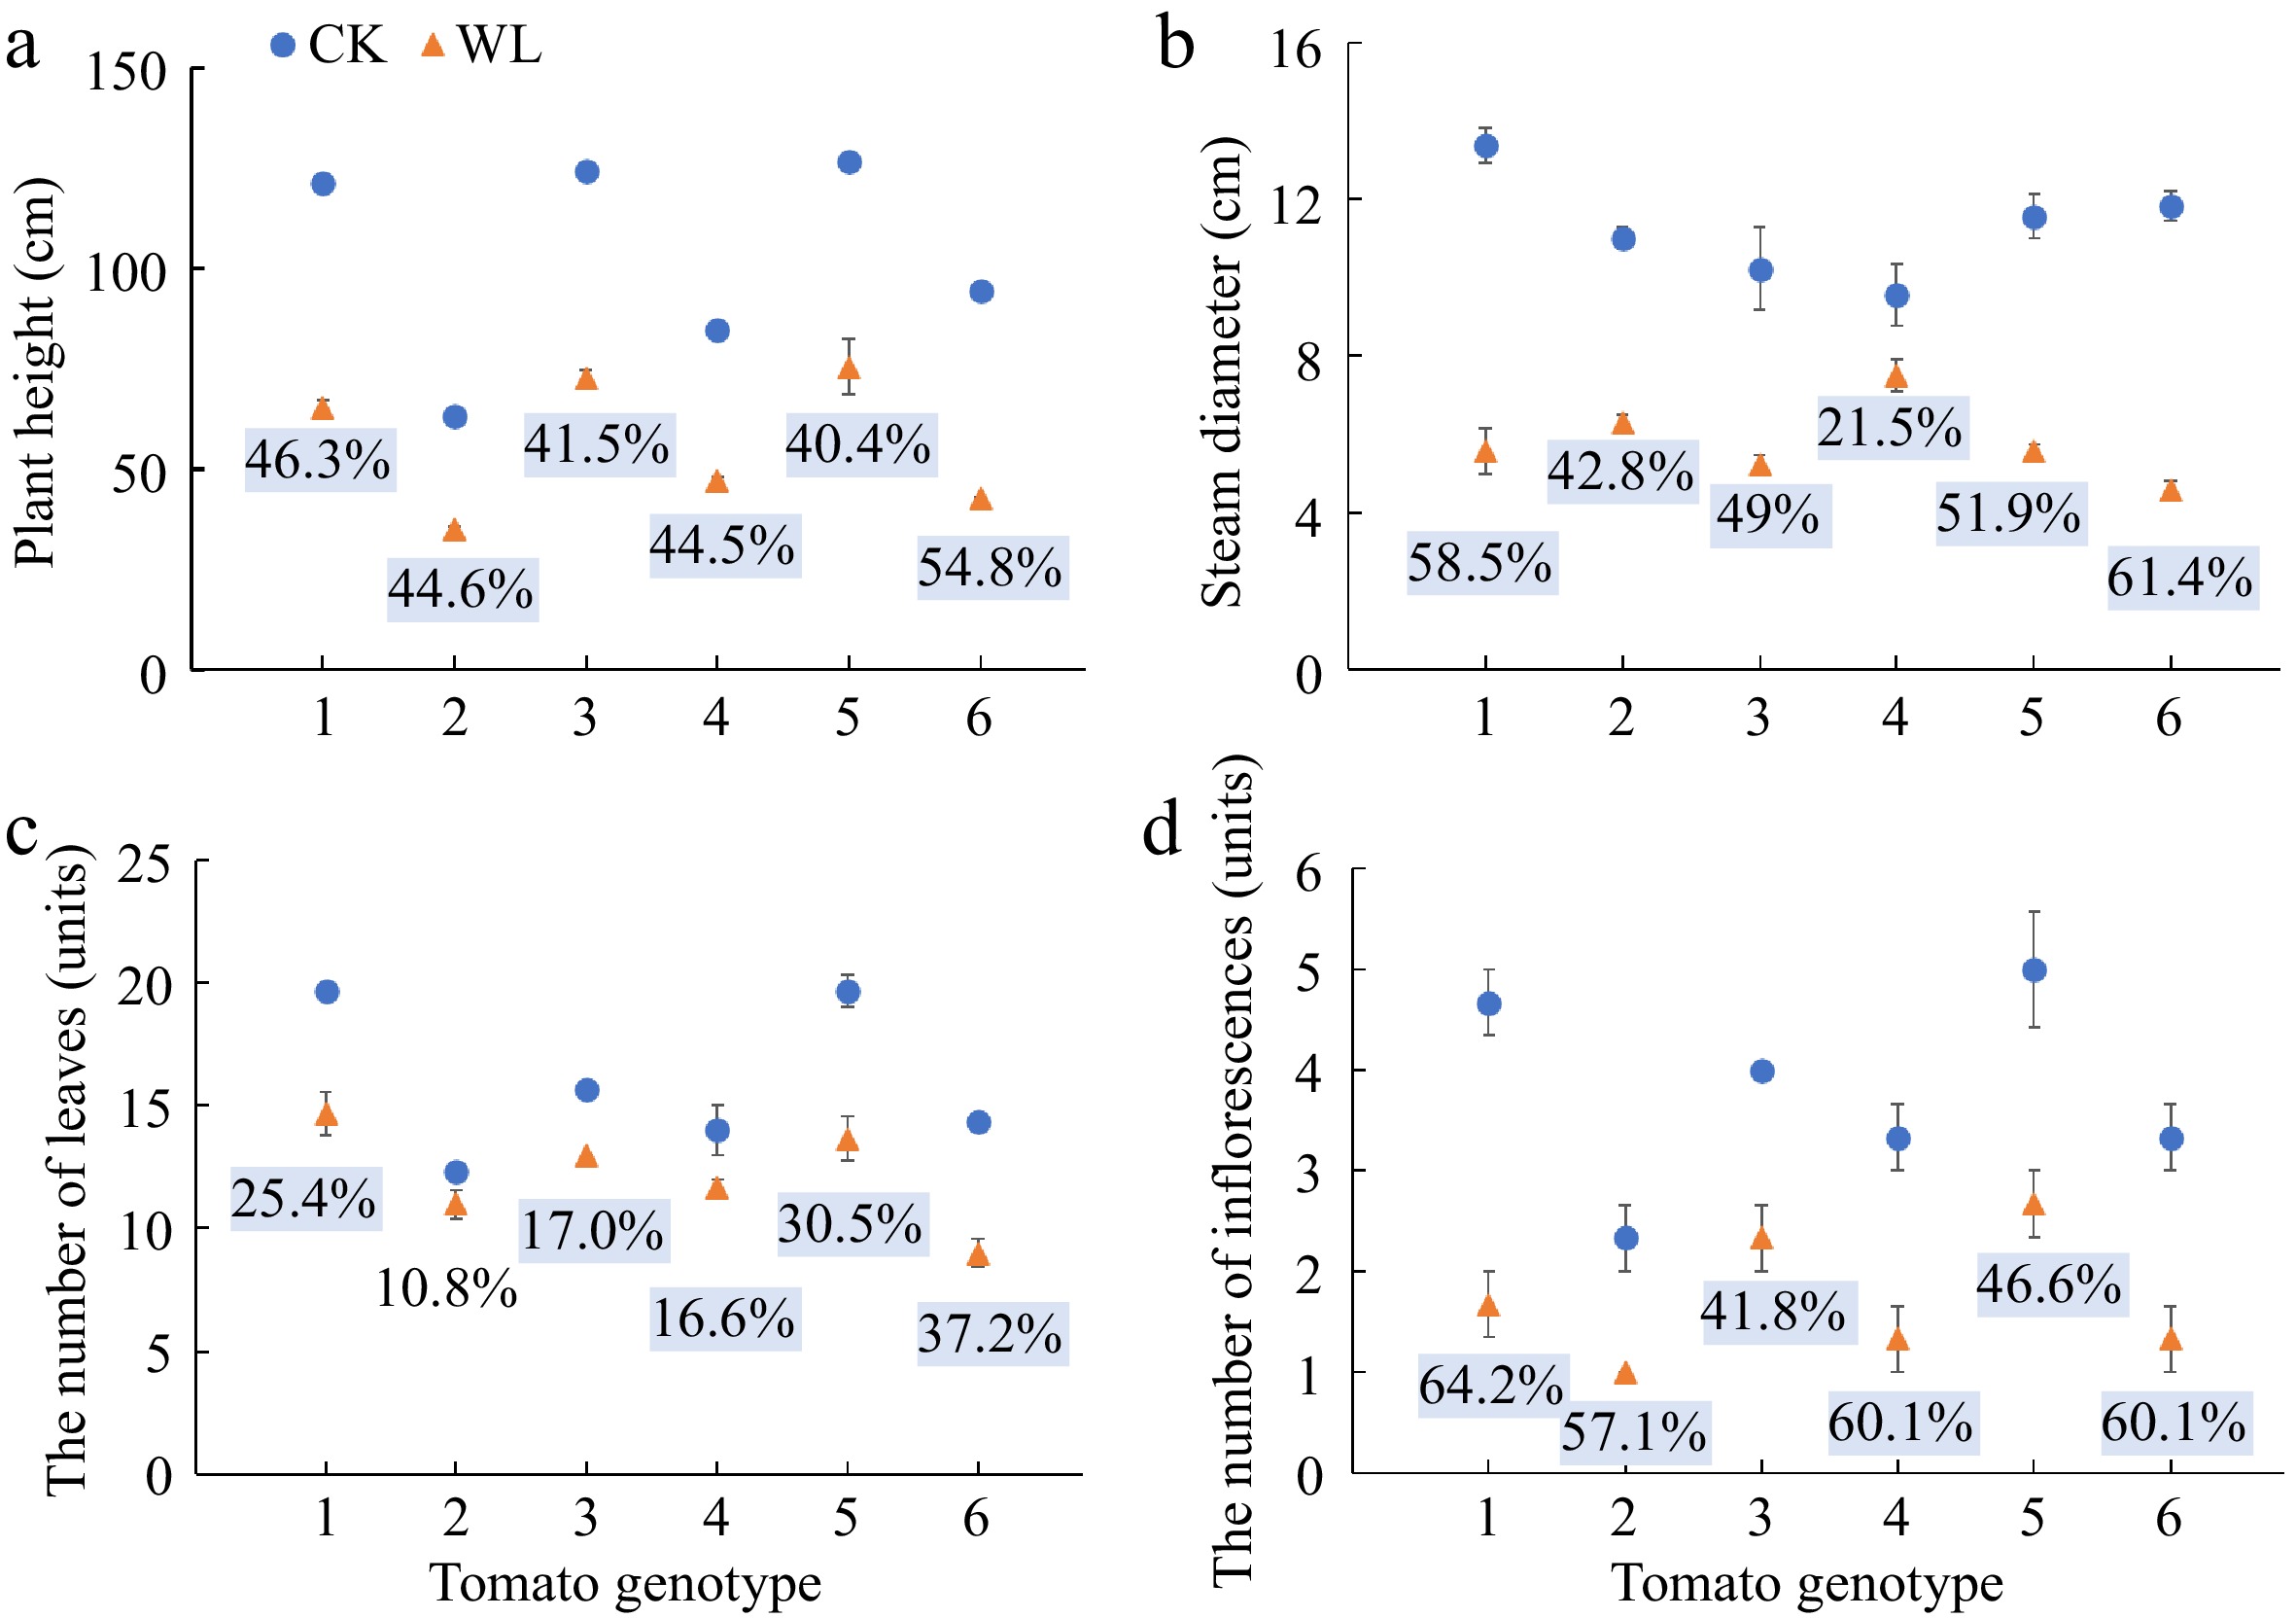
Figure 1.
(a) Plant height, (b) stem diameter, (c) number of leaves, and (d) number of inflorescences of six tomato genotypes at anthesis stage under CK and WL. The CK and WL indicated control and waterlogging treatment, respectively. The values indicated mean ± SEM (n = 3). The percentages (blue square) referred to significantly decreased percentages of the parameters in each genotype under waterlogging treatment as compared with the respective controls (p < 0.05). The percentages without color indicated no significant difference (p < 0.05).
-
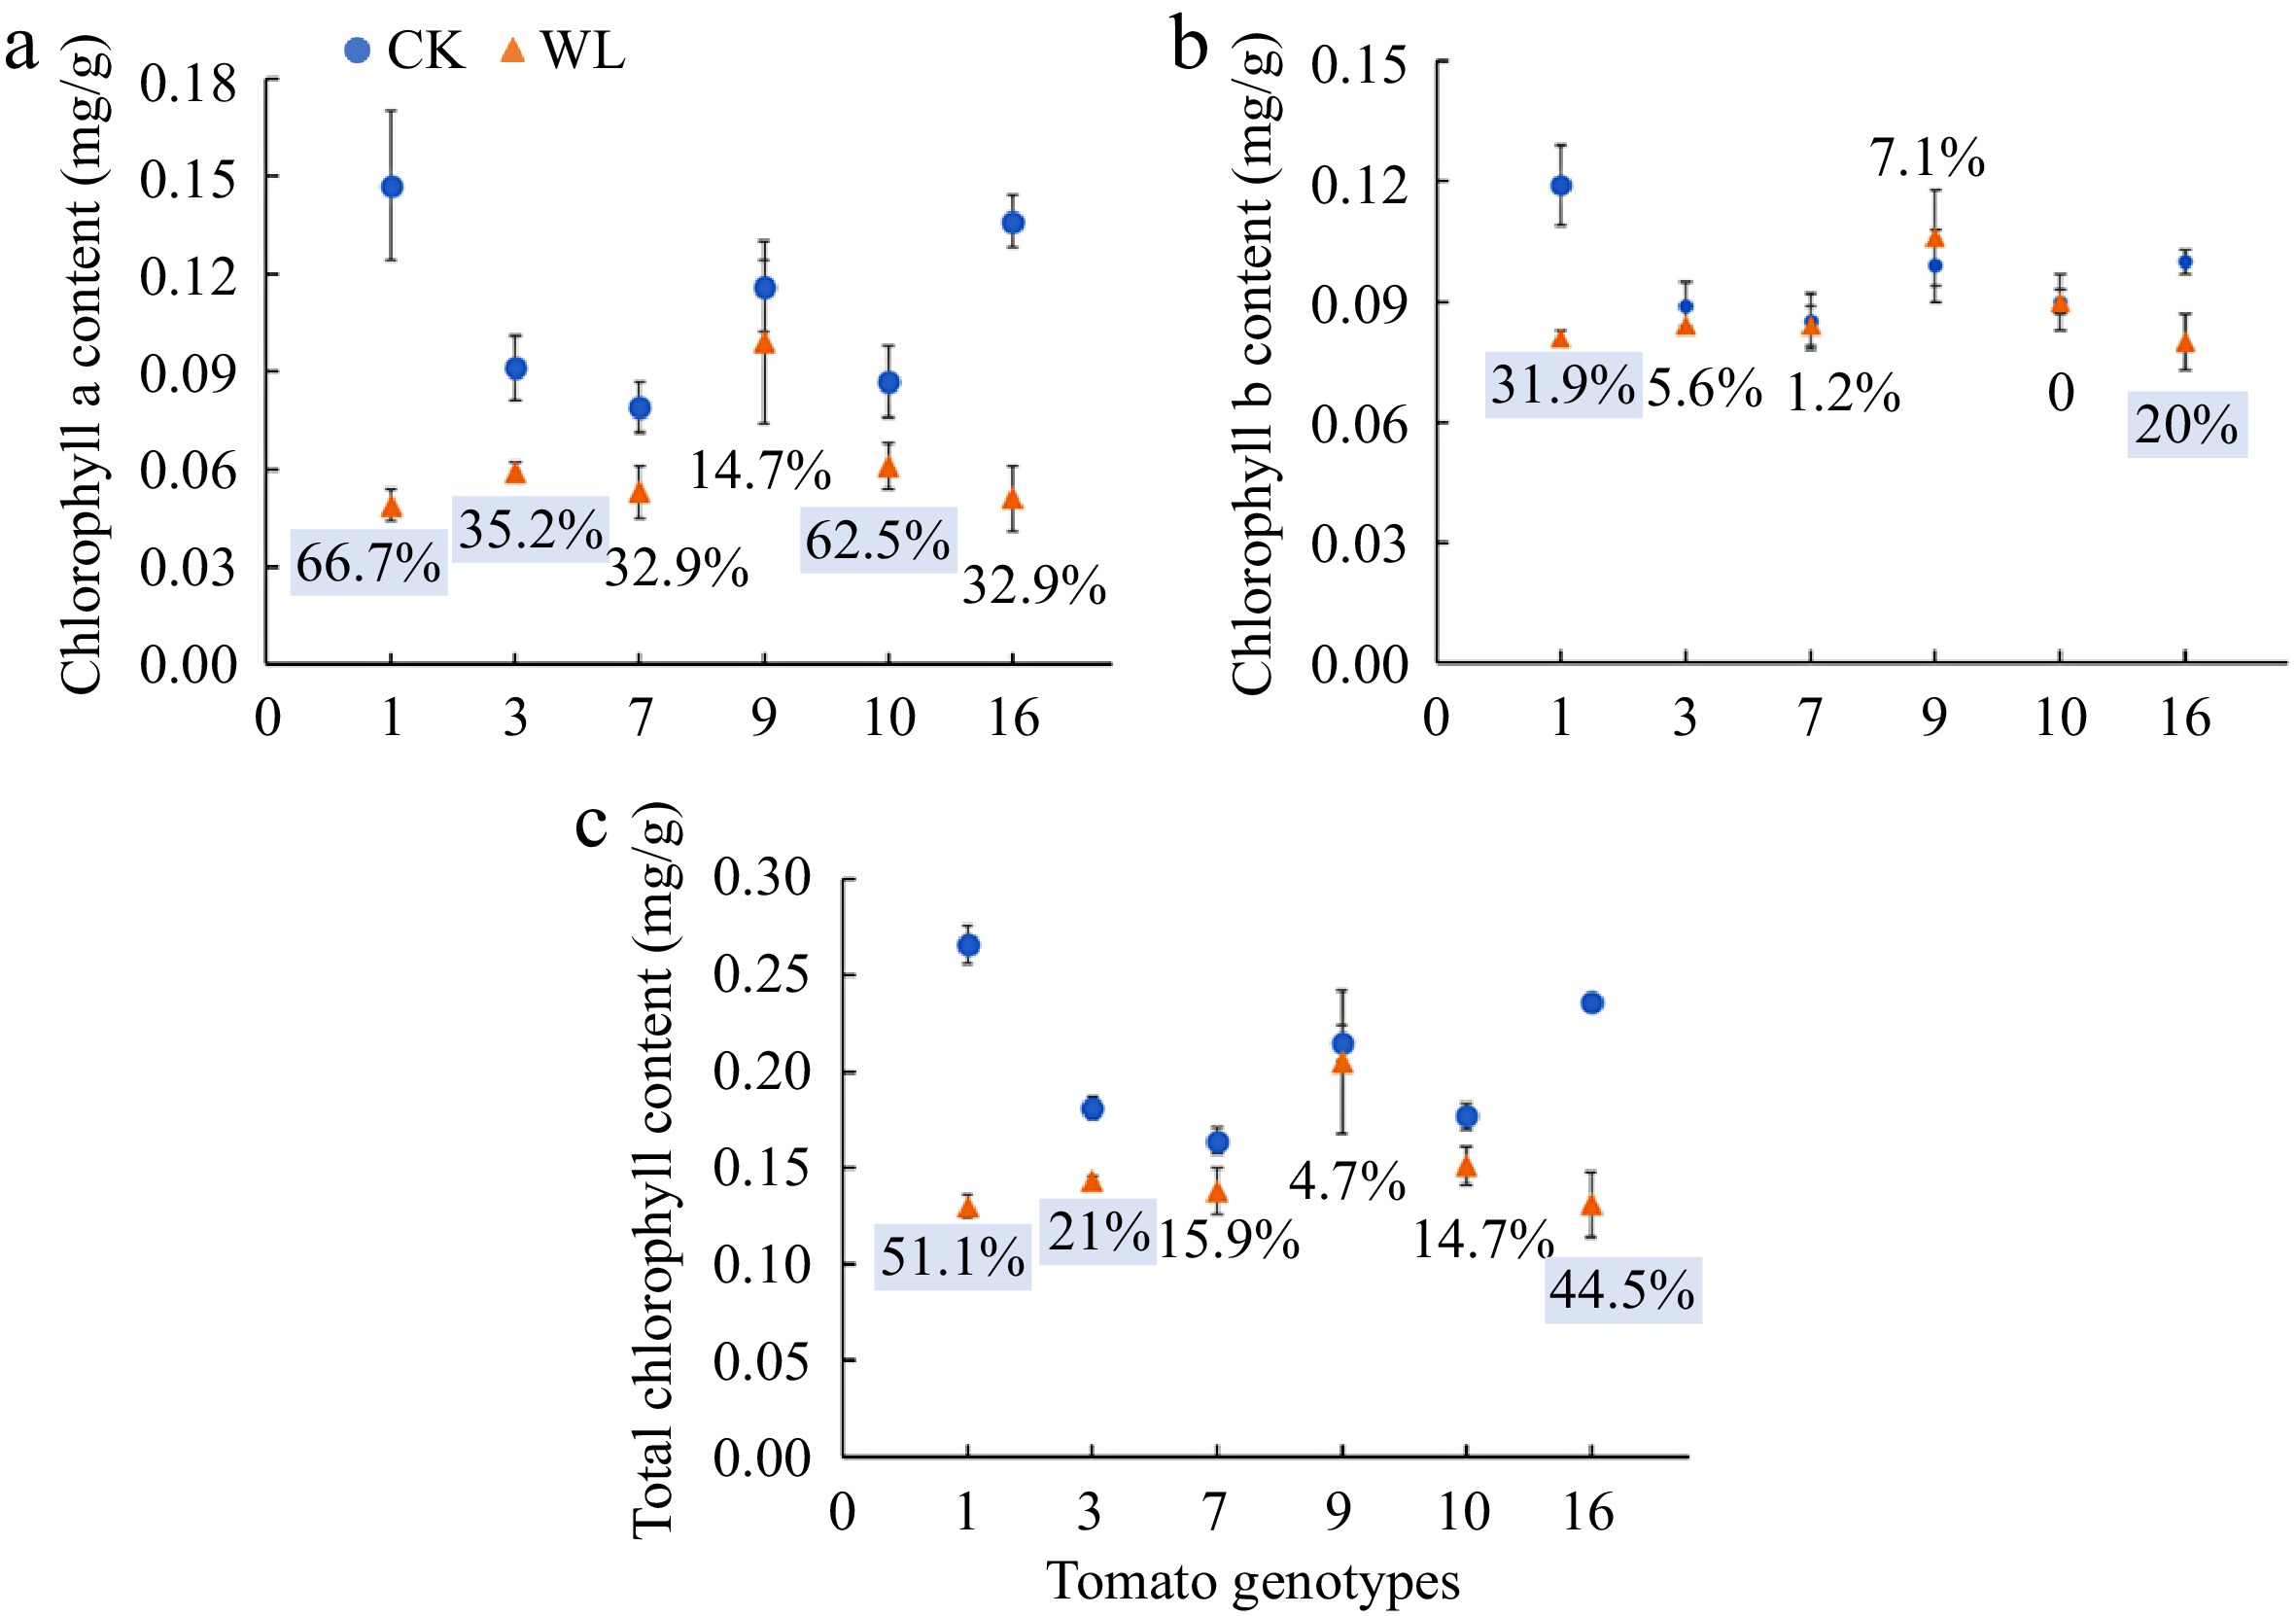
Figure 2.
(a) Chlorophyll a content, (b) chlorophyll b content, (c) total chlorophyll content of six tomato genotypes at anthesis stage under CK and WL. The CK and WL indicated control and waterlogging treatment, respectively. The values indicated mean ± SEM (n = 3). The percentages (blue square) referred to significantly decreased percentages of the parameters in each genotype under waterlogging treatment as compared with the respective controls (p < 0.05). The percentages without color indicated no significant difference (p < 0.05).
-
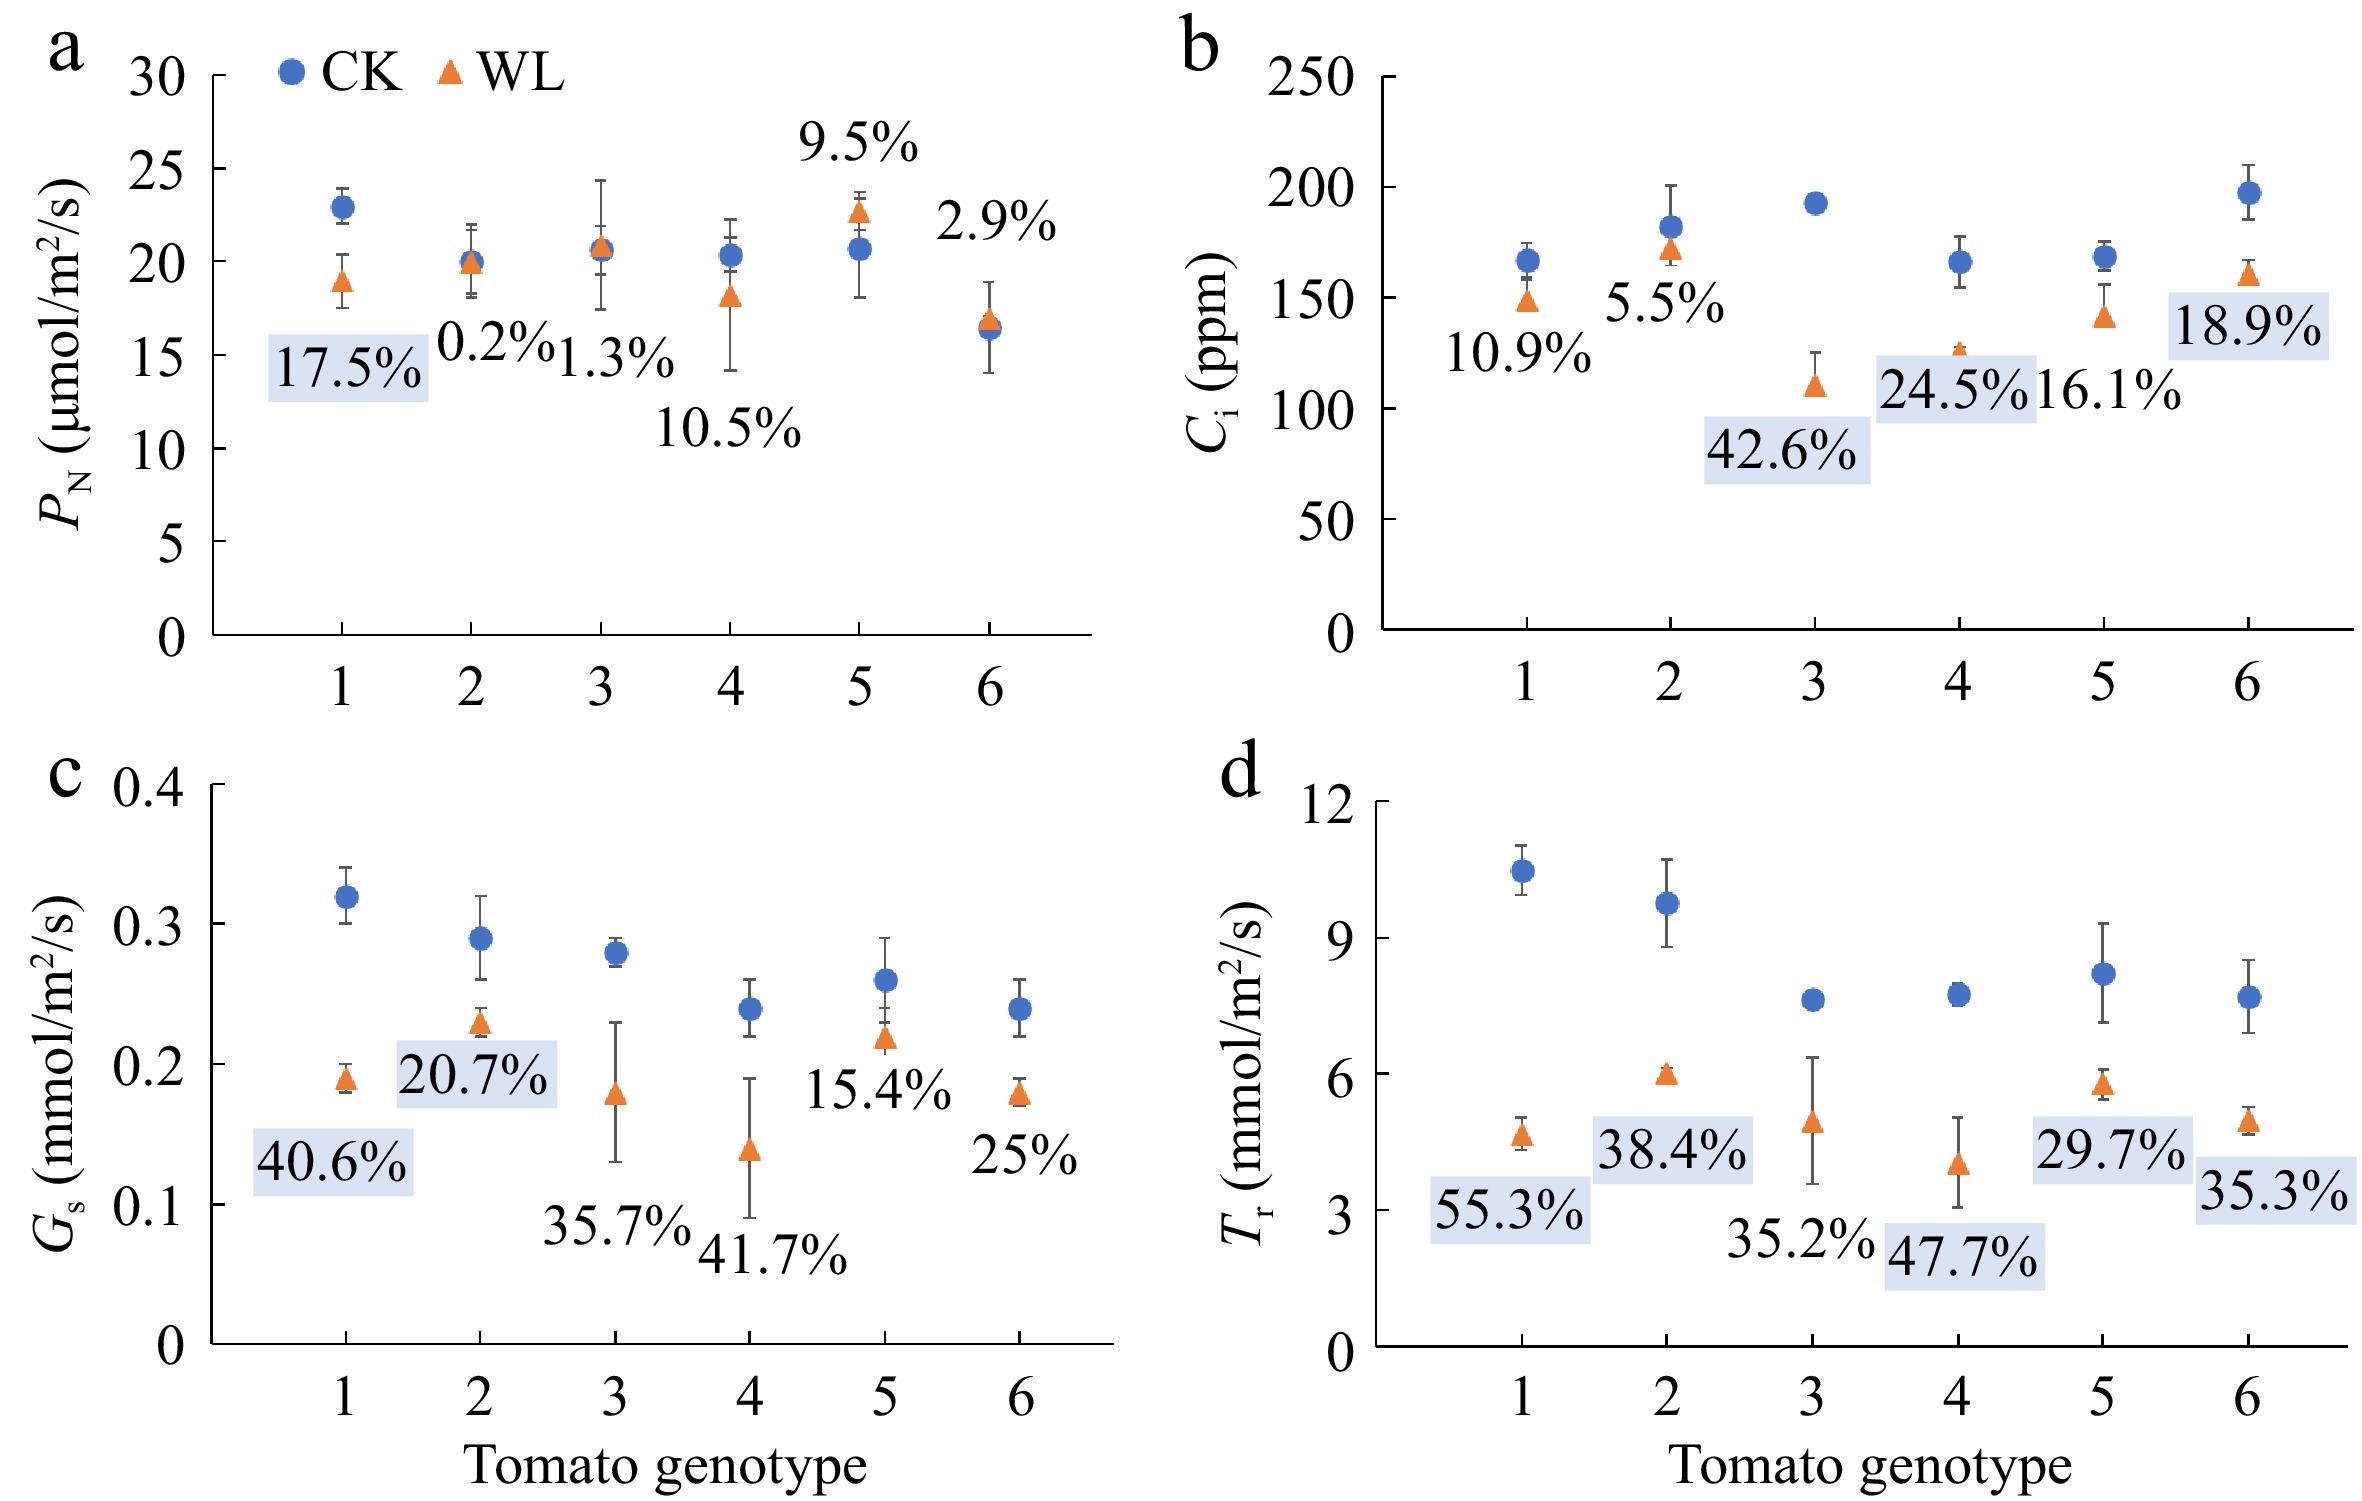
Figure 3.
(a) Net photosynthetic rate (PN), (b) intercellular CO2 concentration (Ci), (c) stomatal conductance (Gs), and (d) transpiration rate (Tr) of six tomato genotypes at anthesis stage under CK and WL. The CK and WL indicated control and waterlogging treatment, respectively. The values indicated mean ± SEM (n = 3). The percentages (blue square) referred to significantly decreased percentages of the parameters in each genotype under waterlogging treatment as compared with the respective controls (p < 0.05). The percentages without color indicated no significant difference (p < 0.05).
-
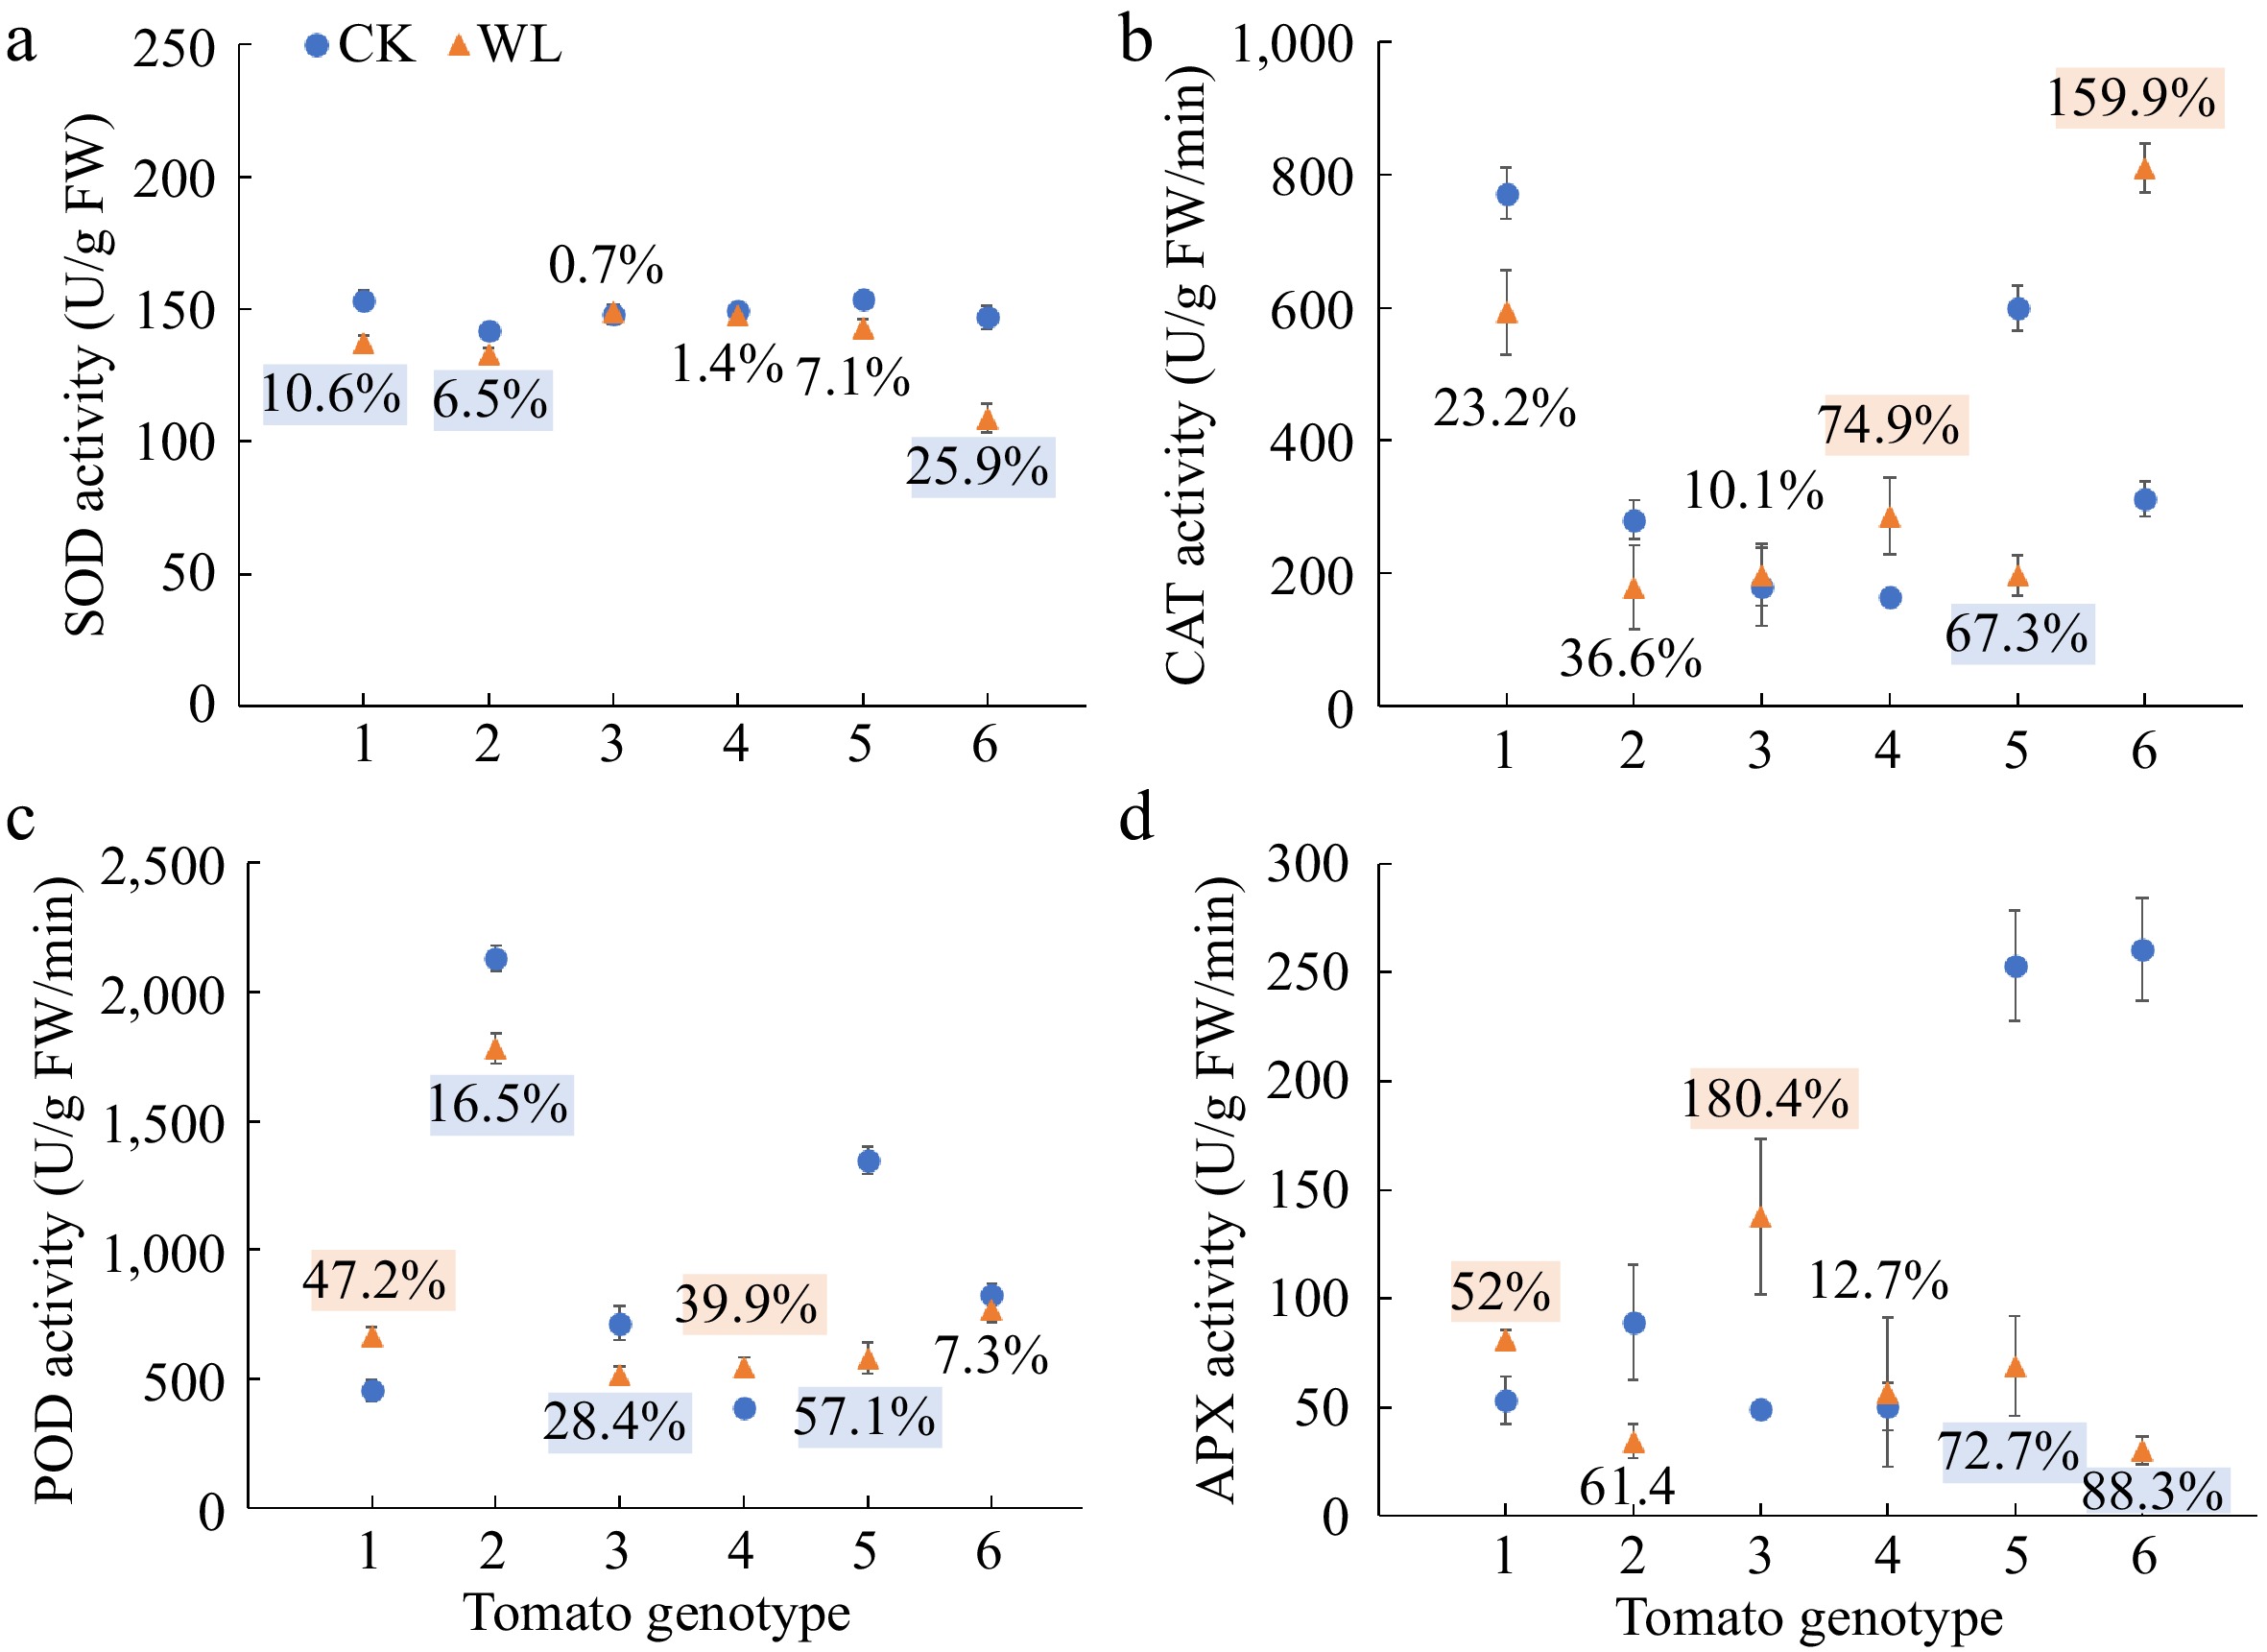
Figure 4.
Activities of (a) superoxide dismutase (SOD), (b) catalase (CAT), (c) peroxidase (POD), and (d) ascorbate peroxidase (APX) of six tomato genotypes at anthesis stage under CK and WL The CK and WL indicated control and waterlogging treatment, respectively. The values indicated mean ± SEM (n = 3). The percentages (blue/orange square) referred to significantly decreased/increased percentages of the parameters in each genotype under waterlogging treatment as compared with the respective controls (p < 0.05). The percentages without color indicated no significant difference (p < 0.05).
-
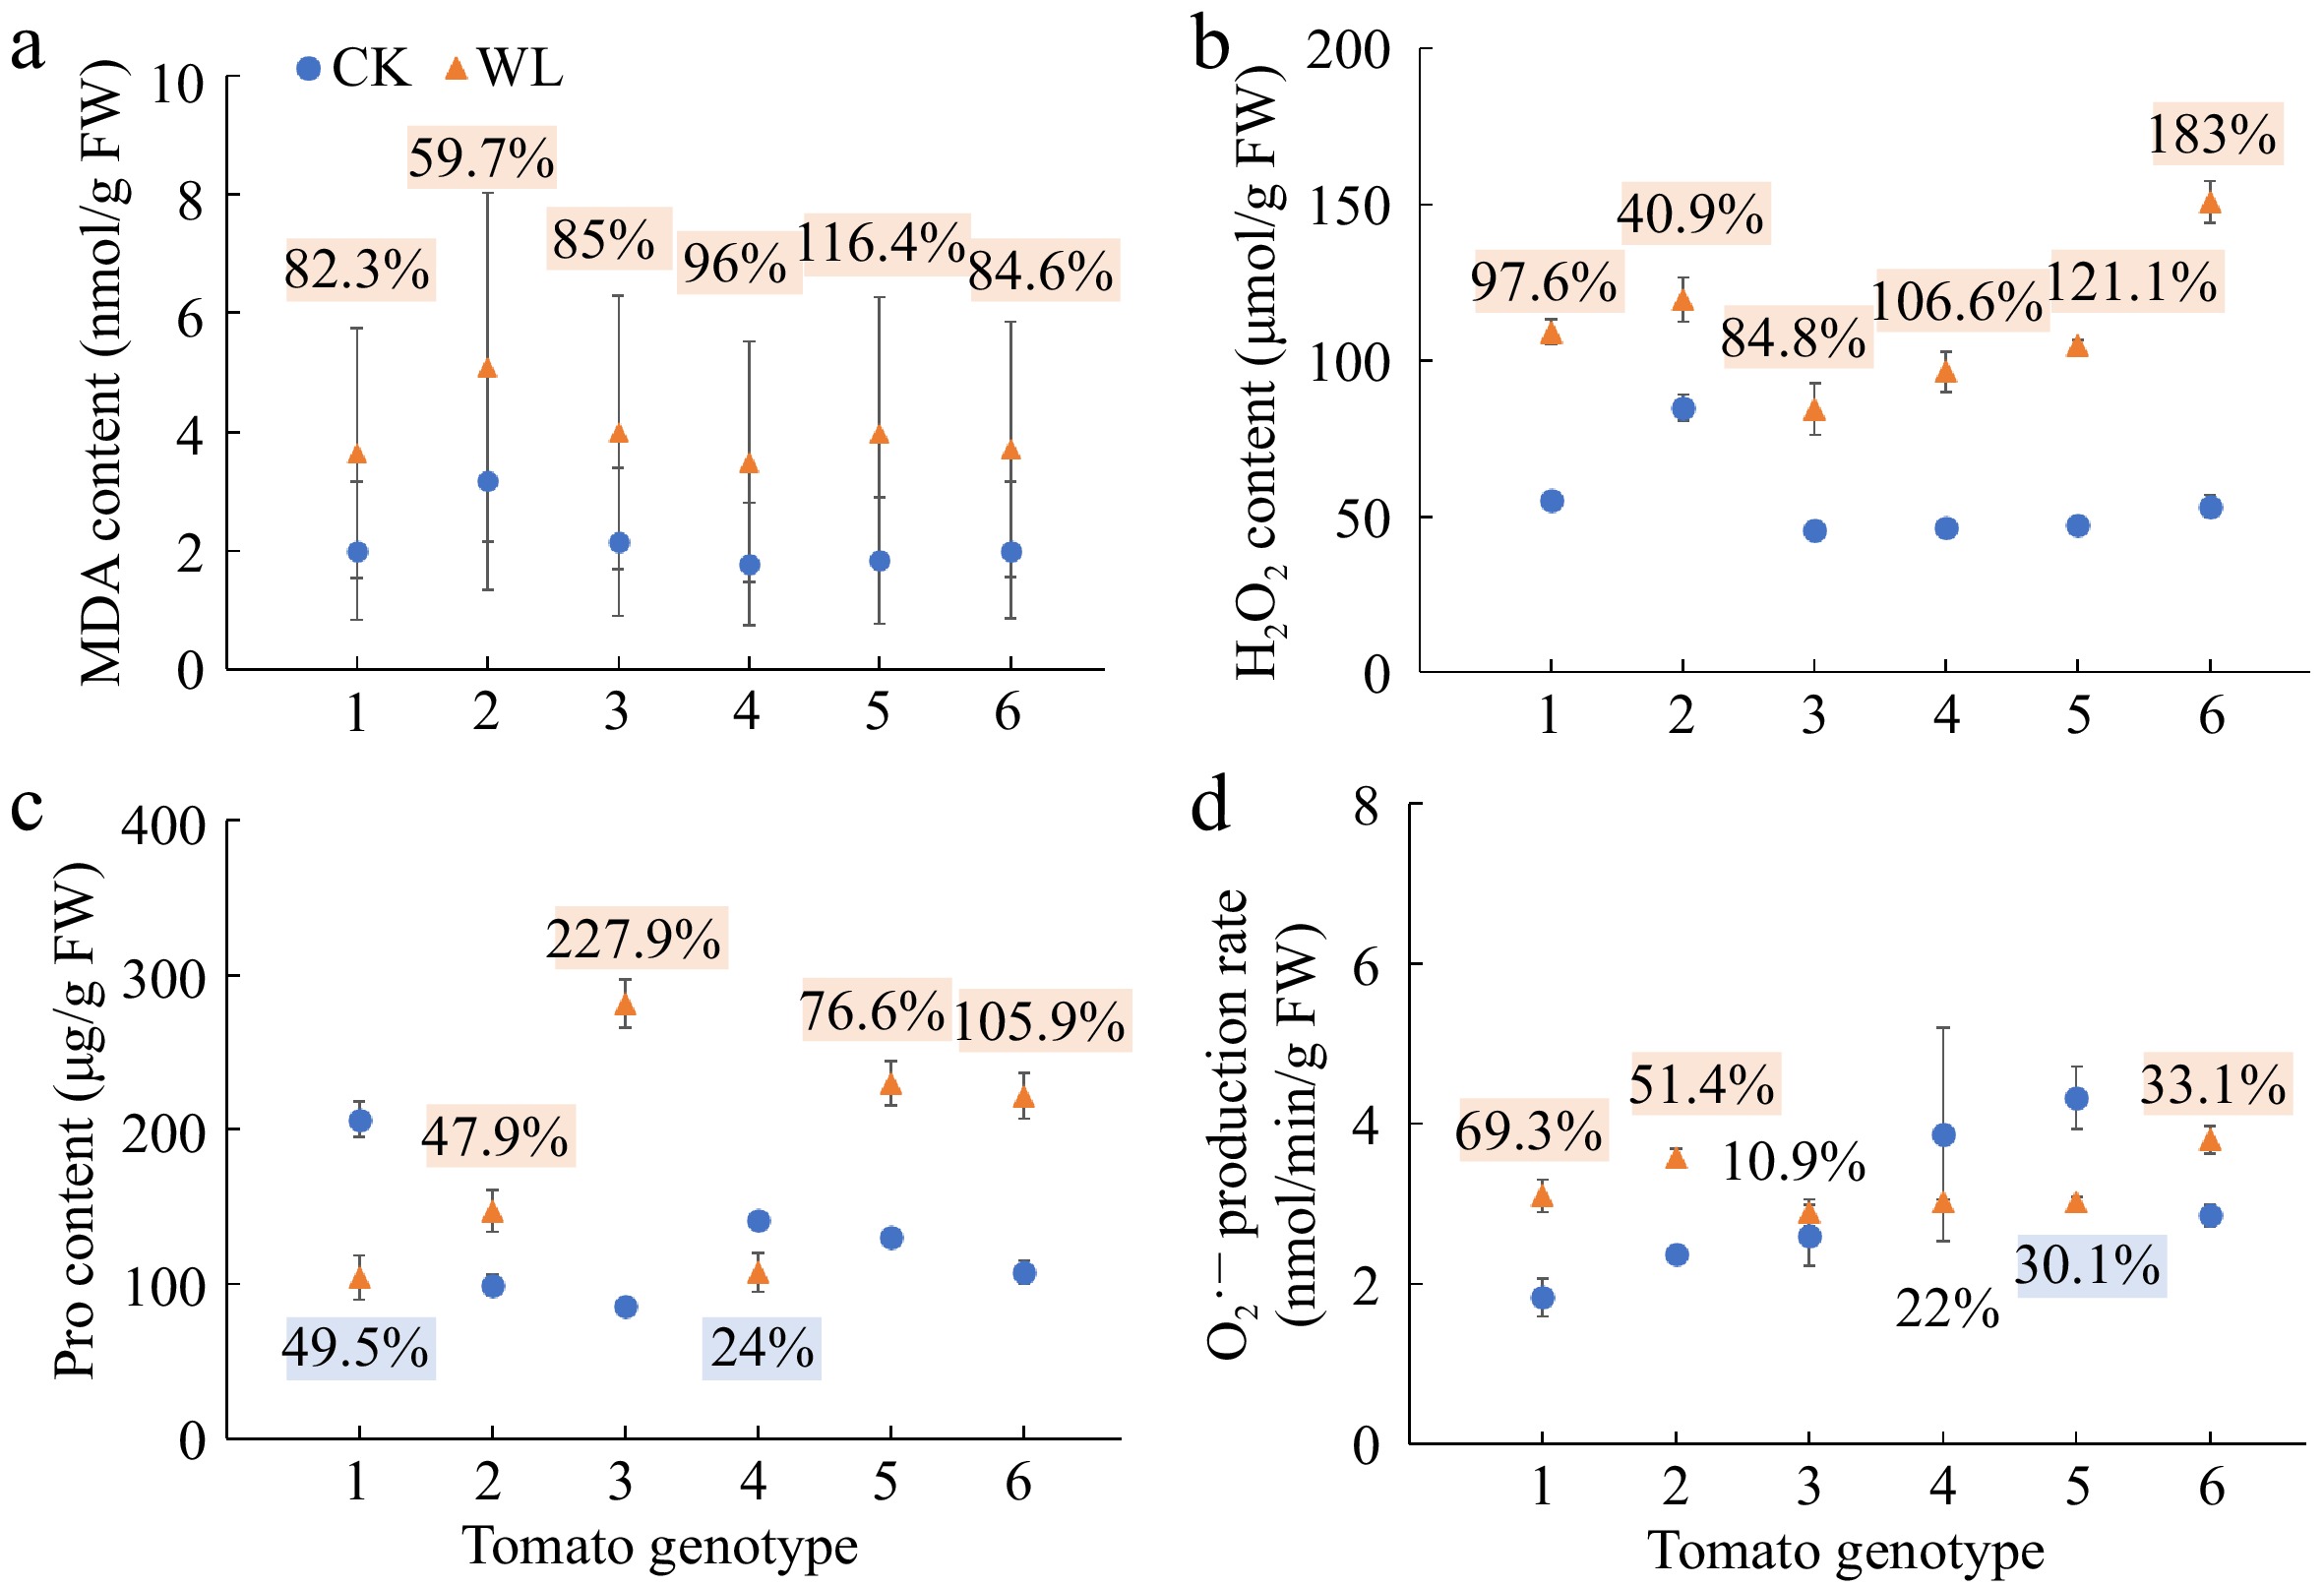
Figure 5.
(a) Malondialdehyde (MDA) content, (b) hydrogen peroxide (H2O2) content, (c) proline (Pro) content, and (d) superoxide anion (O2•─) production rate of six tomato genotypes at anthesis stage under CK and WL. The CK and WL indicated control and waterlogging treatment, respectively. The values indicated mean ± SEM (n = 3). The percentages (blue/orange square) referred to significantly decreased/increased percentages of the parameters in each genotype under waterlogging treatment as compared with the respective controls (p < 0.05). The percentages without color indicated no significant difference (p < 0.05).
-
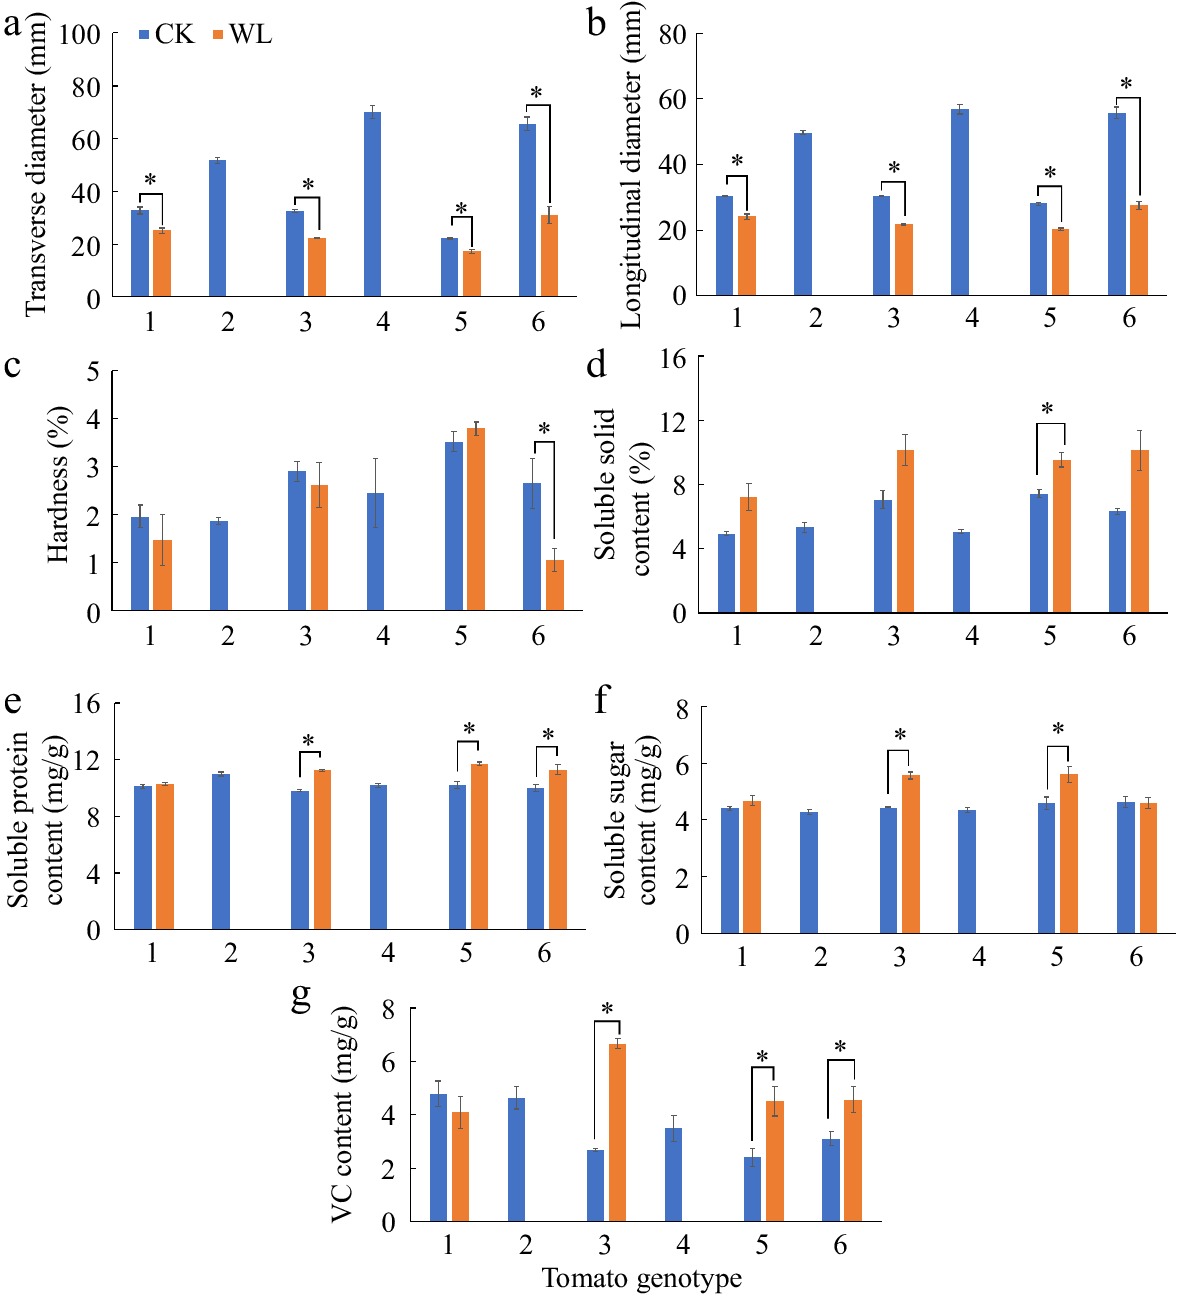
Figure 6.
(a) Transverse diameter, (b) longitudinal diameter, (c) hardness, (d) soluble solid content, (e) soluble protein content, (f) soluble sugar content, and (g) vitamin C (VC) content of the fruits from six tomato genotypes at anthesis stage under CK and WL. The CK and WL indicated control and waterlogging treatment, respectively. The values indicated mean ± SEM (n = 3). '*' indicated the significant difference of the parameters in each genotype under waterlogging treatment as compared with the respective controls; no marker indicated no significant difference (p < 0.05). Plants of genotype No. 2 and No. 4 under waterlogging treatment exhibited less than three replicates due to less than three fruits, resulting in blank bars.
-
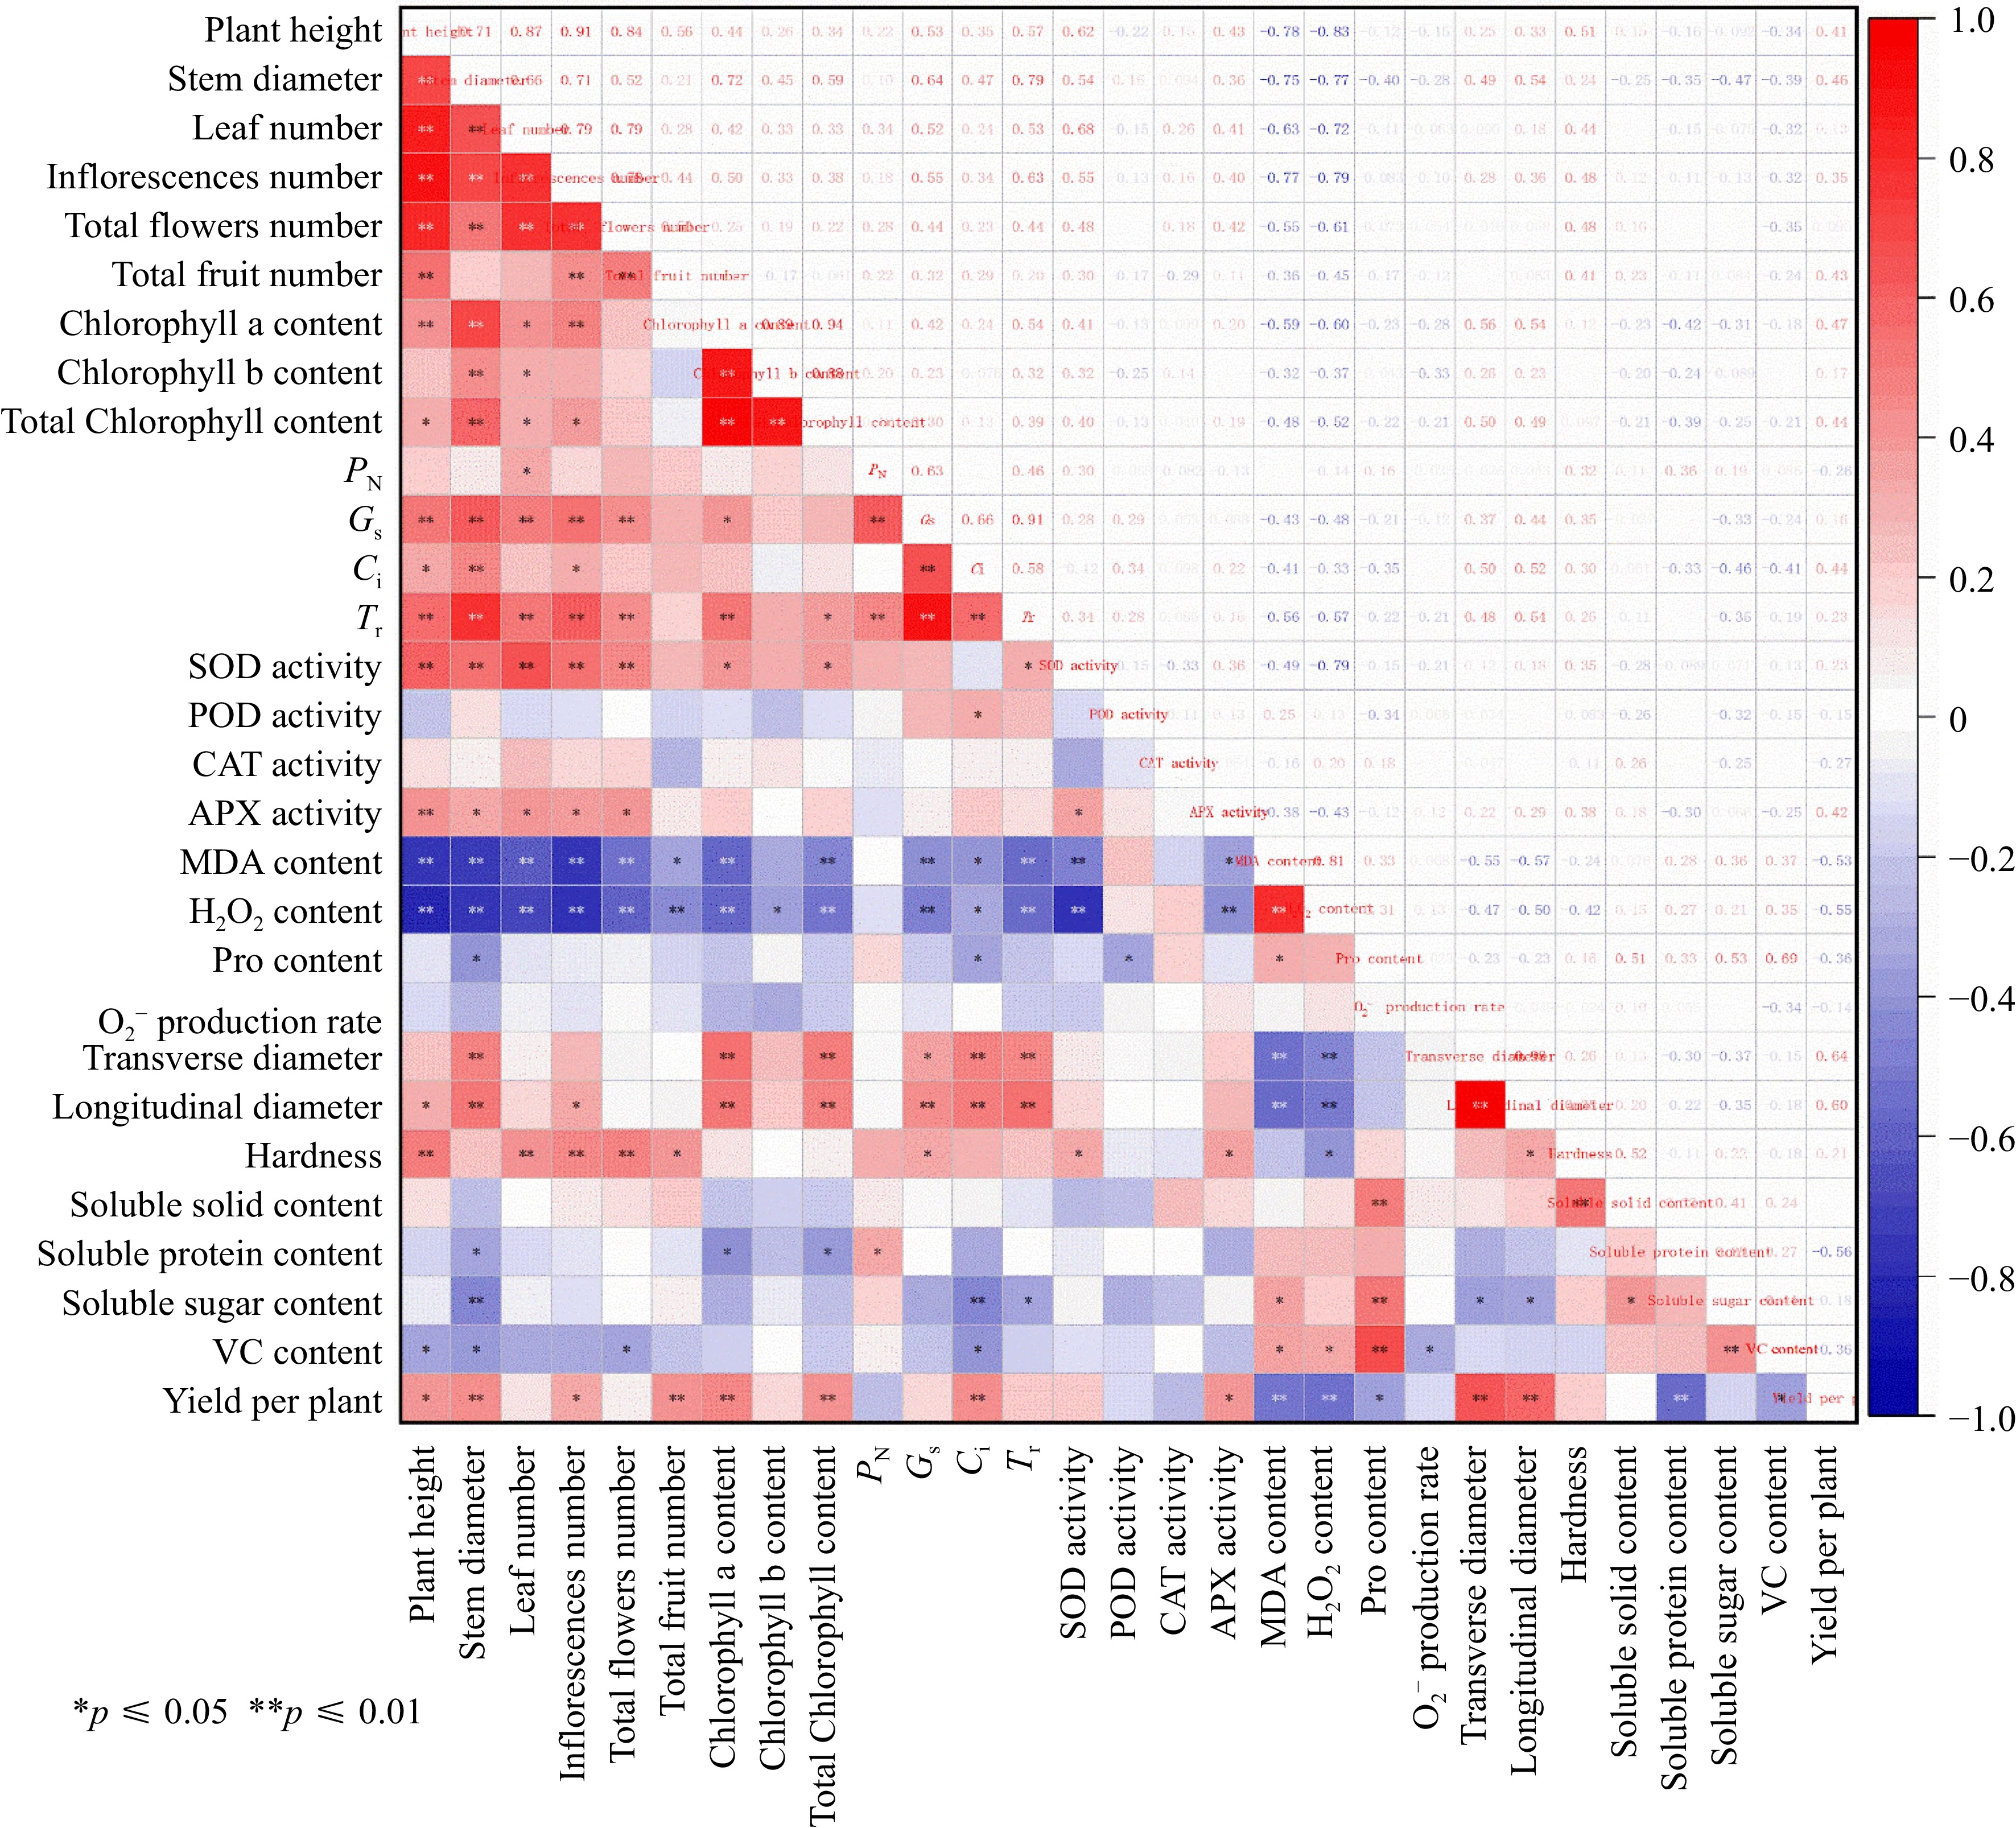
Figure 7.
Correlation analysis of all the measured parameters. PN: Net photosynthetic rate, Ci: intercellular CO2 concentration, Gs: stomatal conductance, Tr: transpiration rate, SOD: superoxide dismutase, CAT: catalase, POD: peroxidase, APX: ascorbate peroxidase, MDA: Malondialdehyde, Pro: proline, VC: vitamin C.
-
NO. Tomato genotype Treatment Flower number
per plantSingle fruit
weight (g)Fruit number per plant Fruit weight per plant (Kg) 1 MIX-002 CK 48 ± 5.0* 20.7 ± 1.22* 20 ± 1.0* 0.41 ± 0.02* WL 5 ± 1.5 9.0 ± 0.91 5 ± 3.0 0.04 ± 0.03 2 LA4440 CK 15 ± 2.8 69.7 ± 4.35 7 ± 0.3 0.46 ± 0.02 WL 4 ± 0.3 ─ ─ ─ 3 Fenbeibei CK 59 ± 10.4* 20.5 ± 0.28* 198 ± 4.0 4.06 ± 0.08* WL 21 ± 5.2 6.6 ± 0.06 70 ± 48.3 0.46 ± 0.32 4 Hezuo 908 CK 18 ± 2.3* 171.9 ± 14.52 16 ± 4.7 2.75 ± 0.81 WL 6 ± 1.2 ─ ─ ─ 5 Jinzhu CK 90 ± 14.4* 8.7 ± 0.36* 54 ± 7.2 0.47 ± 0.06* WL 24 ± 6.5 3.6 ± 0.40 26 ± 7.6 0.09 ± 0.03 6 Ruifen 882 CK 16 ± 2.2* 142.3 ± 13.71* 50 ± 2.9* 7.16 ± 0.41* WL 5 ± 2.9 16.0 ± 3.16 5 ± 0.6 0.05 ± 0.03 Note: The CK and WL indicated control and waterlogging treatment, respectively. The values indicated mean ± SEM (n = 3). '*' indicated the significant difference of the same genotype between CK and WL (p < 0.05). Table 1.
Effects of waterlogging on yield of six tomato genotypes at the anthesis stage.
Figures
(7)
Tables
(1)