-
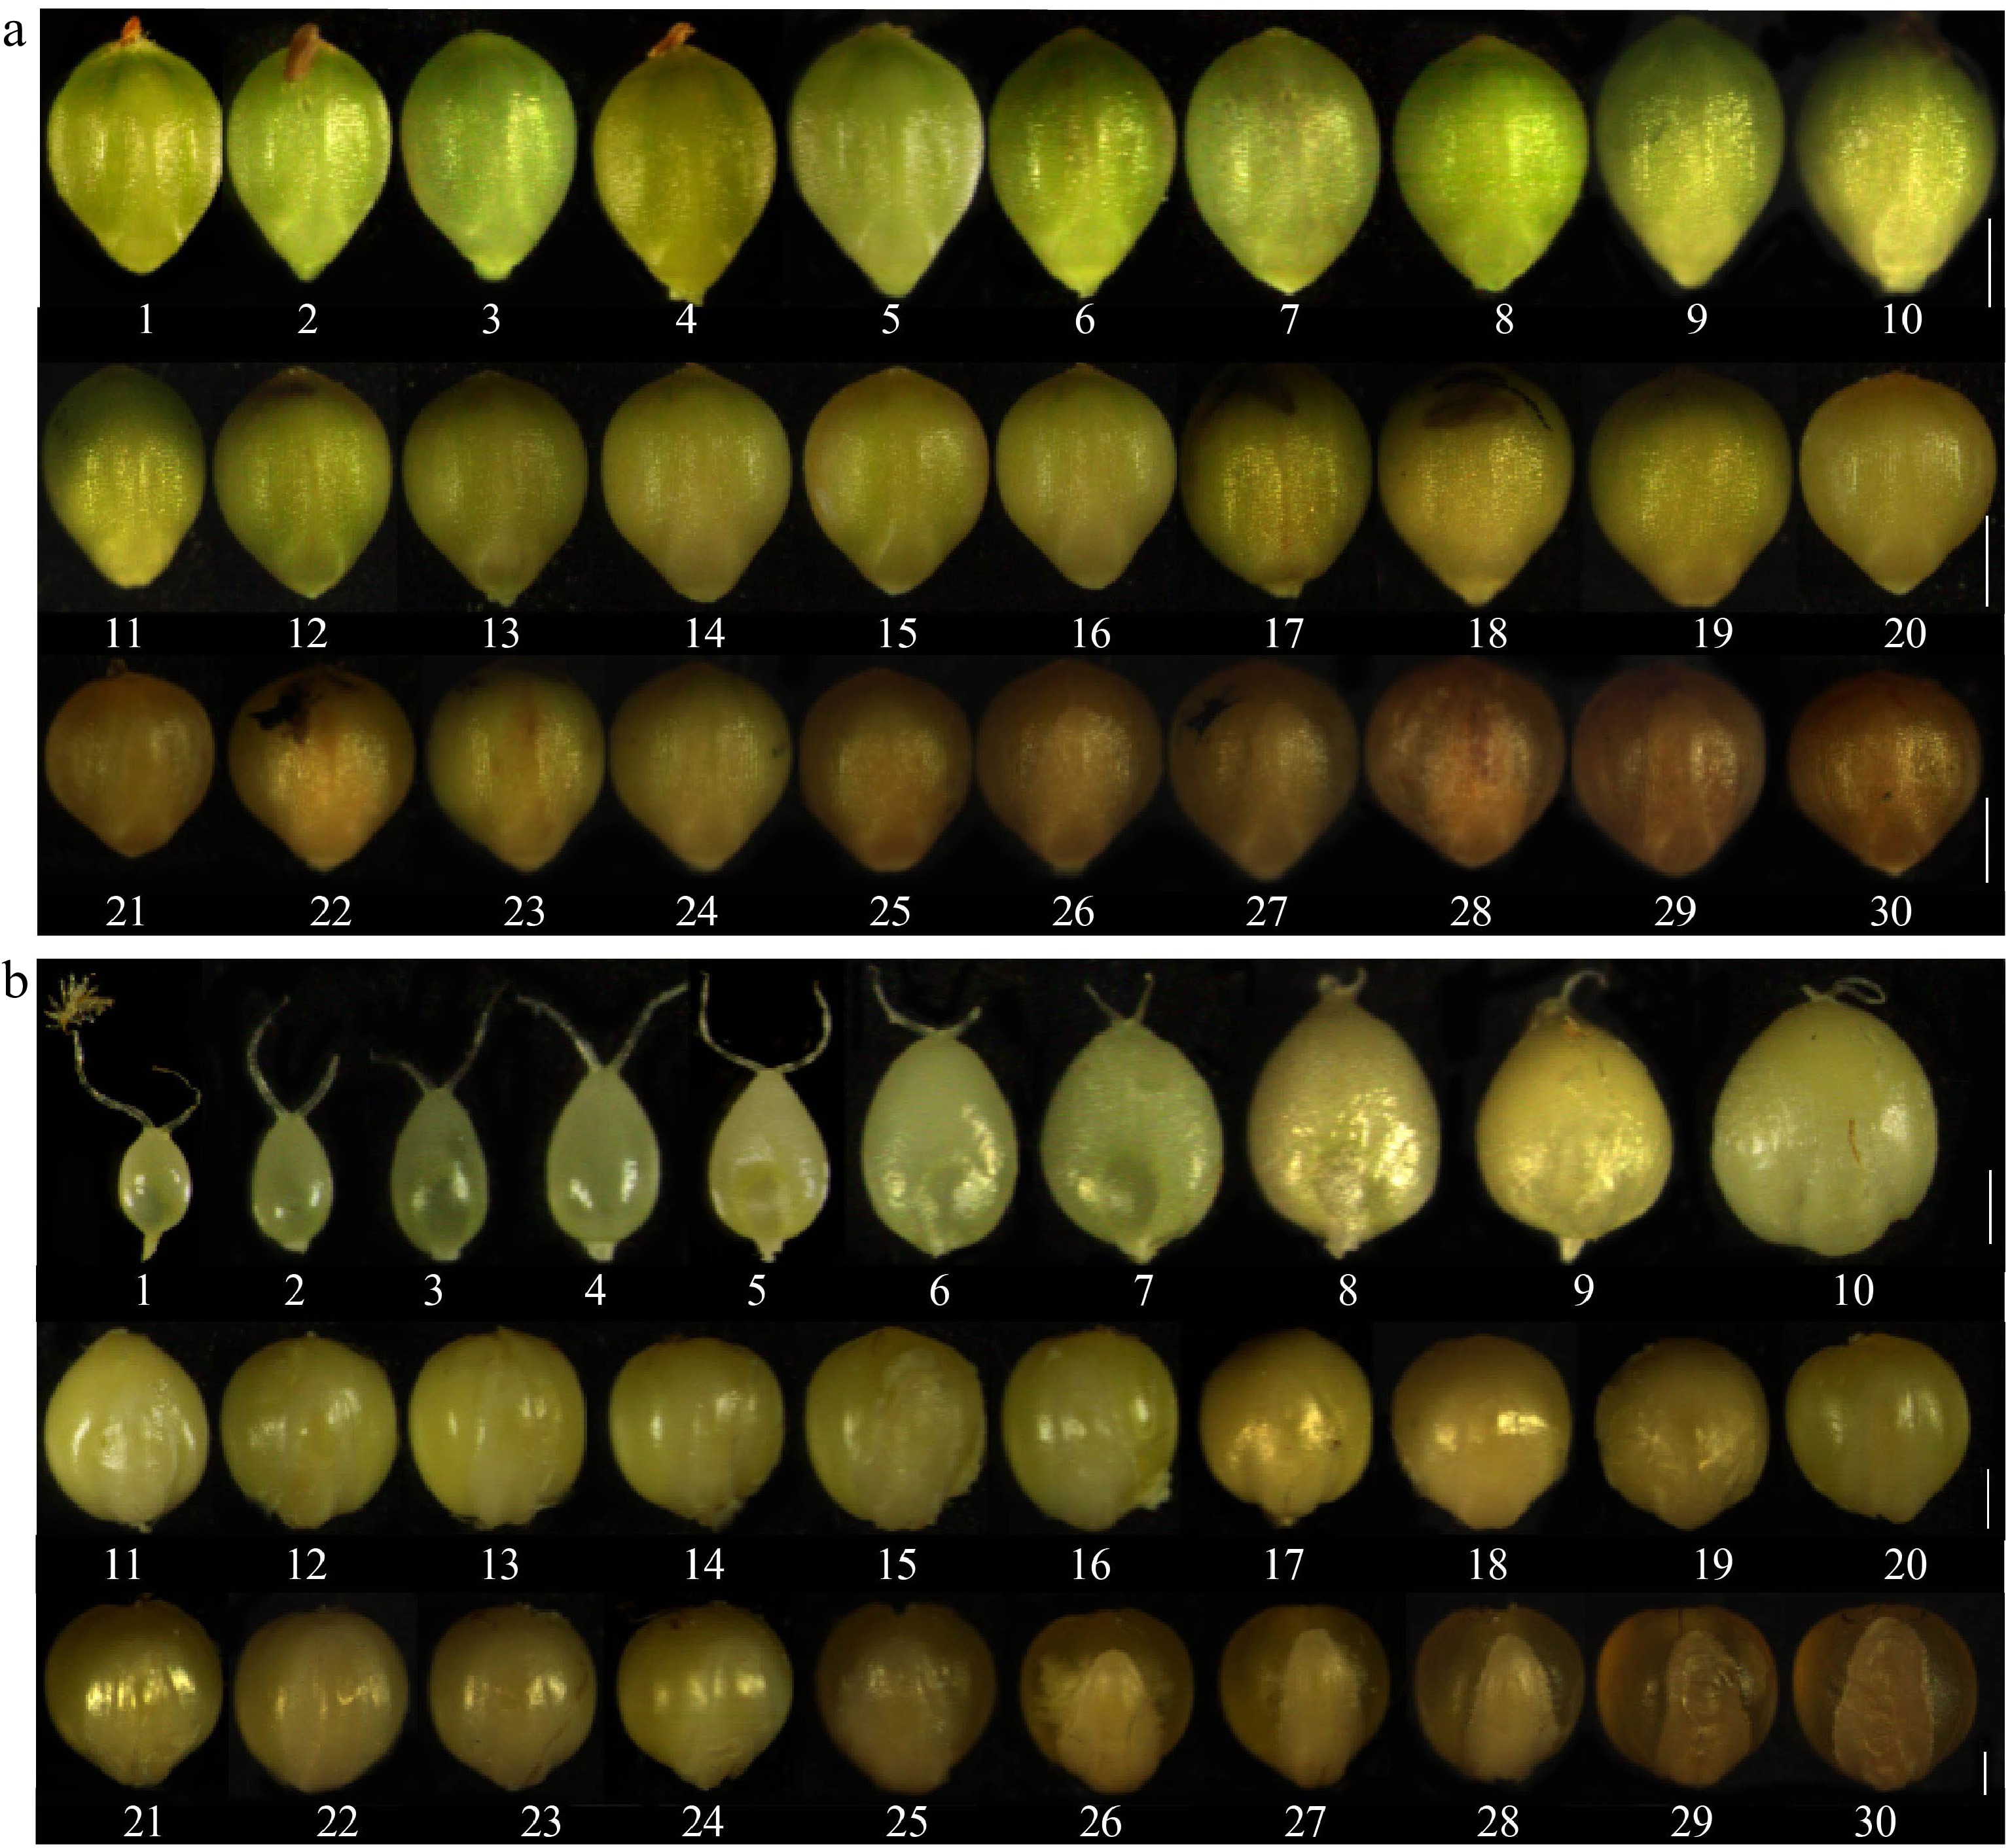
Figure 1.
Dynamics of foxtail millet grain development. (a) Time series of kernel development from 1 to 30 DAP; (b) Time series of grain development from 1 to 30 DAP without kernel hull. Numbers below denote the DAP. (a) Scale bars = 1 mm, (b) Scale bars = 500 μm.
-
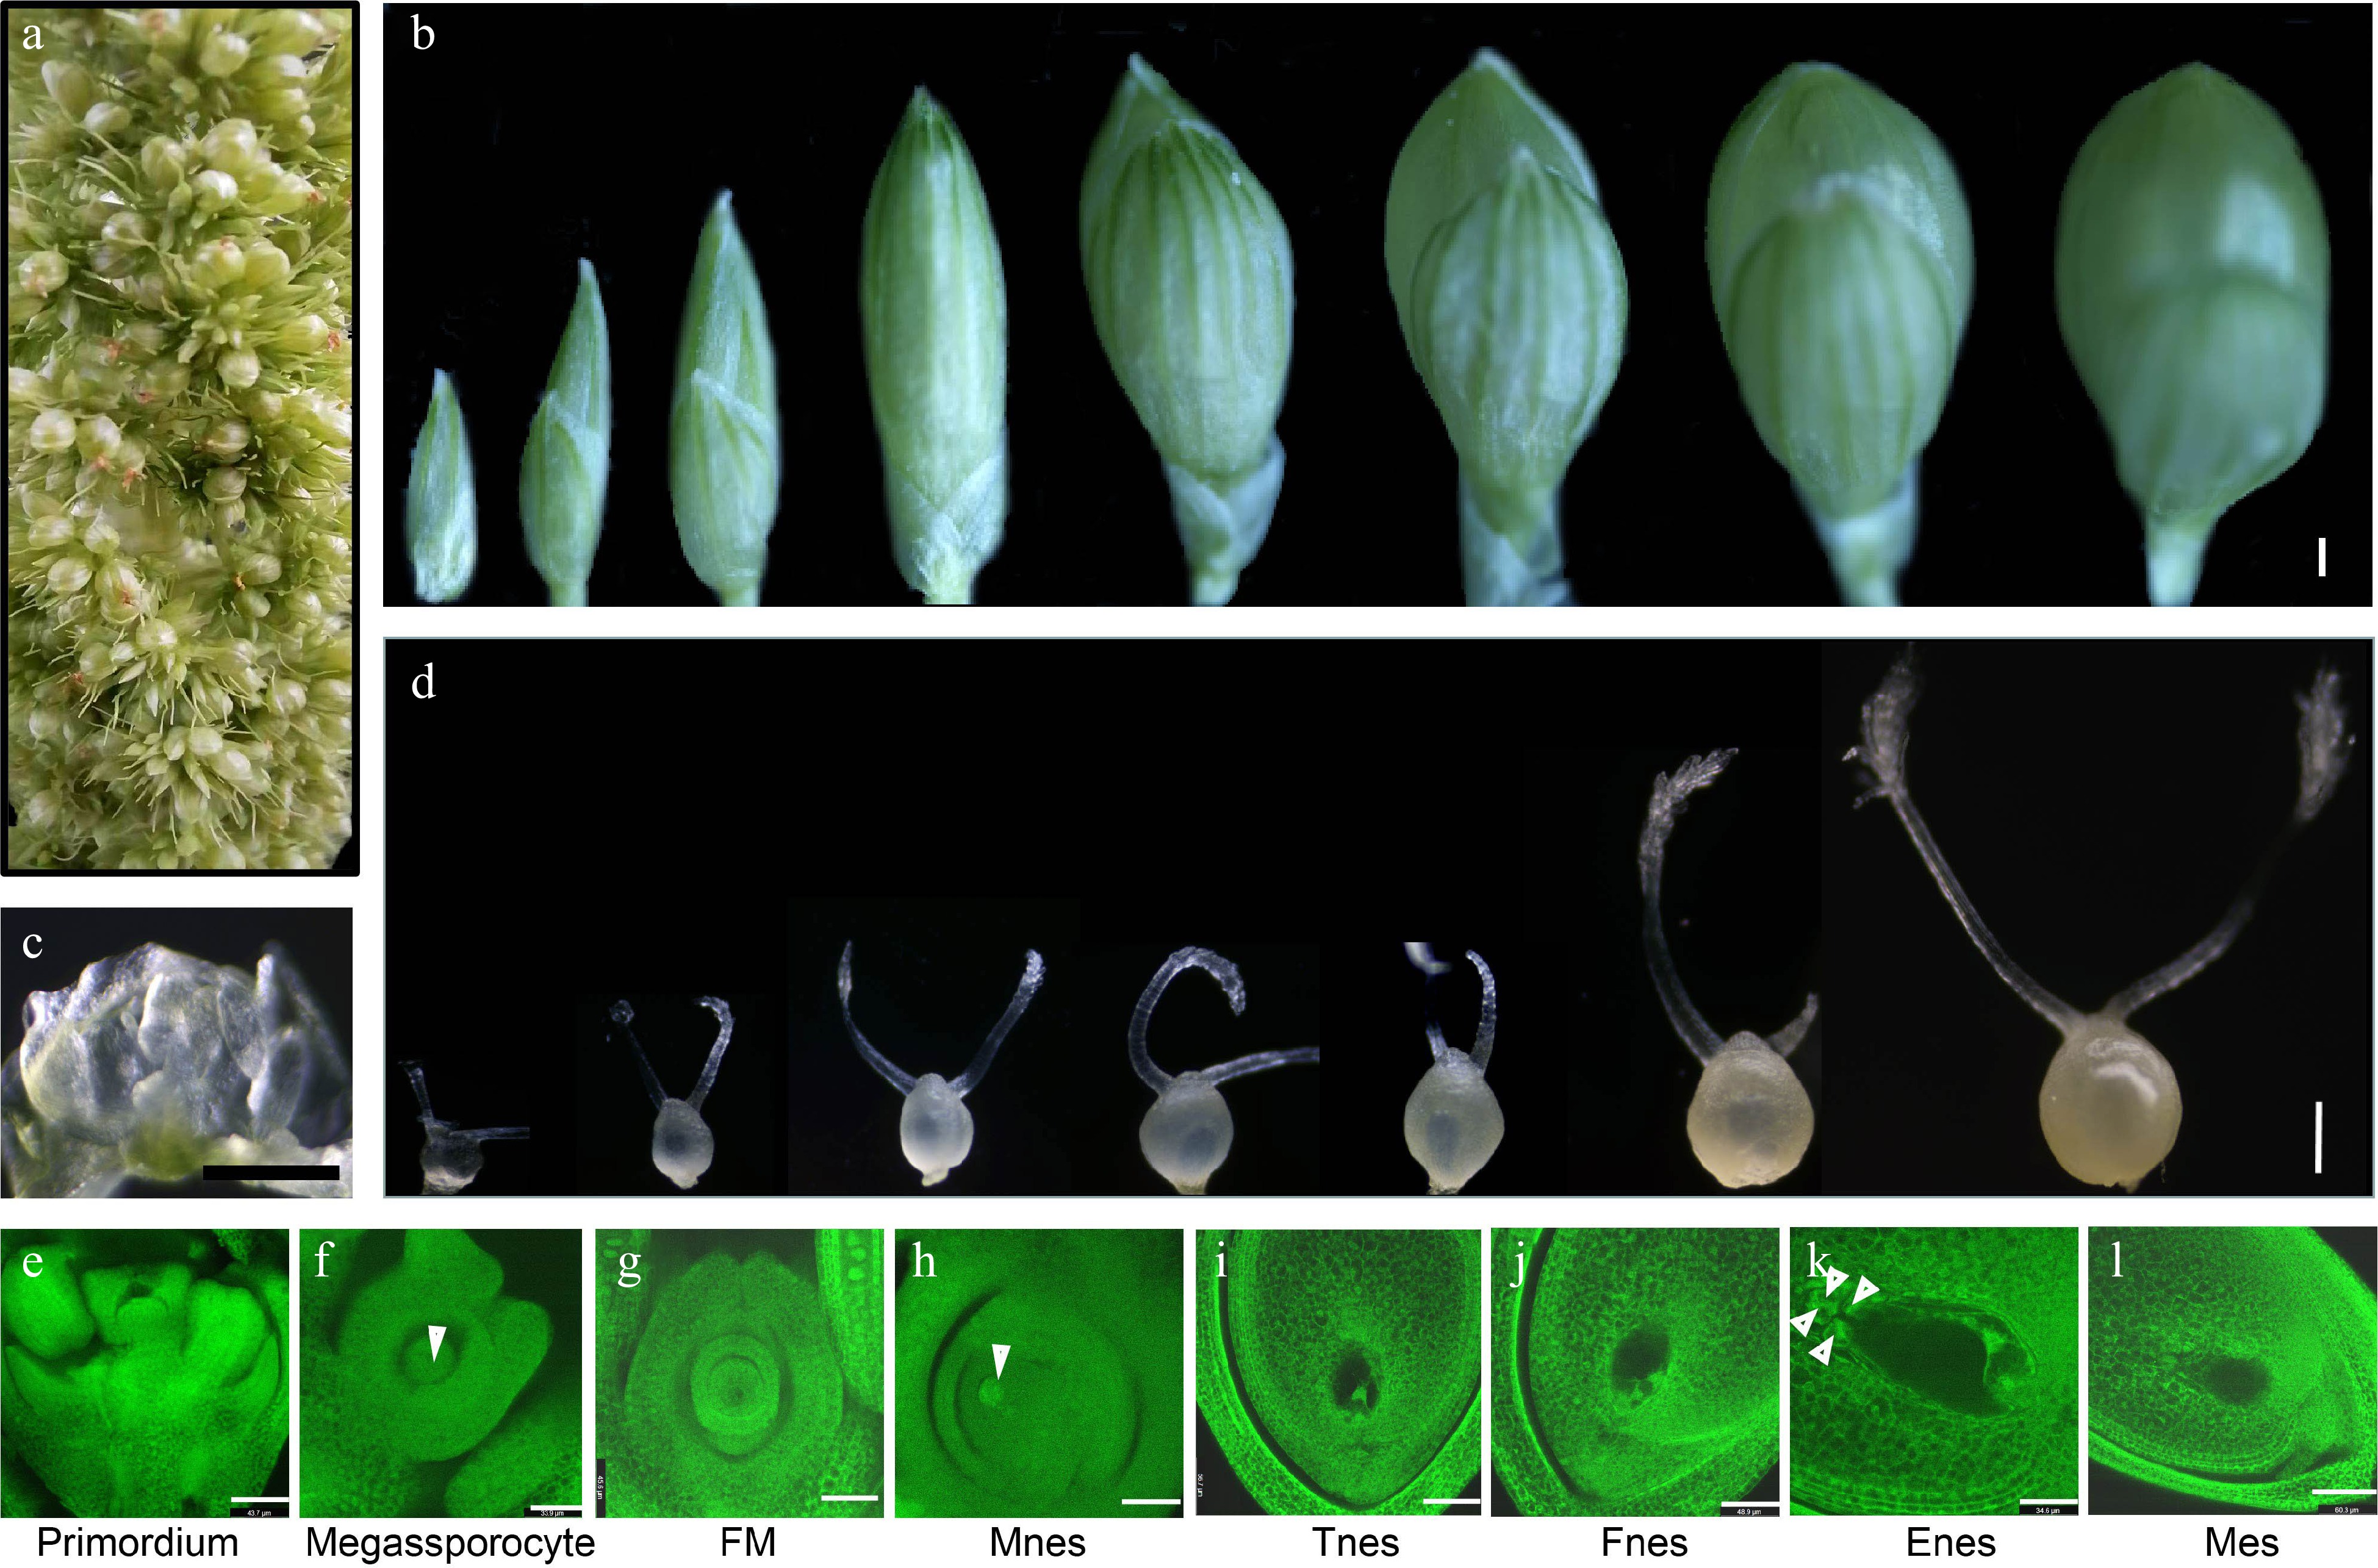
Figure 2.
Morphological analysis of the developing ovules and spikelets in foxtail millet before pollination. (a) The young foxtail millet spike contains all developmental stages of ovules and florets. (b) Appearance morphological analysis of florets development in foxtail millet. (c) Morphology of the ovule primordia in foxtail millet. (d) Morphology of ovule development in foxtail millet before pollination. (e)−(l) The structure of ovules observed by confocal microscopy in foxtail millet before pollination. FM: Functional megaspore; Mnes: Mono nucleate embryo sac; Tnes: Two-nucleate embryo sac; Fnes: Four-nucleate embryo sac; Enes: Eight-nucleate embryo sac; Mes: Mature embryo sac. (b)−(d) Scale bars = 10 μm, (e) Scale bars = 43.7 μm; (f) Scale bars = 33.9 μm; (g) Scale bars = 45.6 μm; (h) Scale bars = 45.3 μm; (i) Scale bars = 56.7 μm; (j) Scale bars = 48.9 μm; (k) Scale bars = 34.6 μm; (l) Scale bars = 60.3 μm.
-
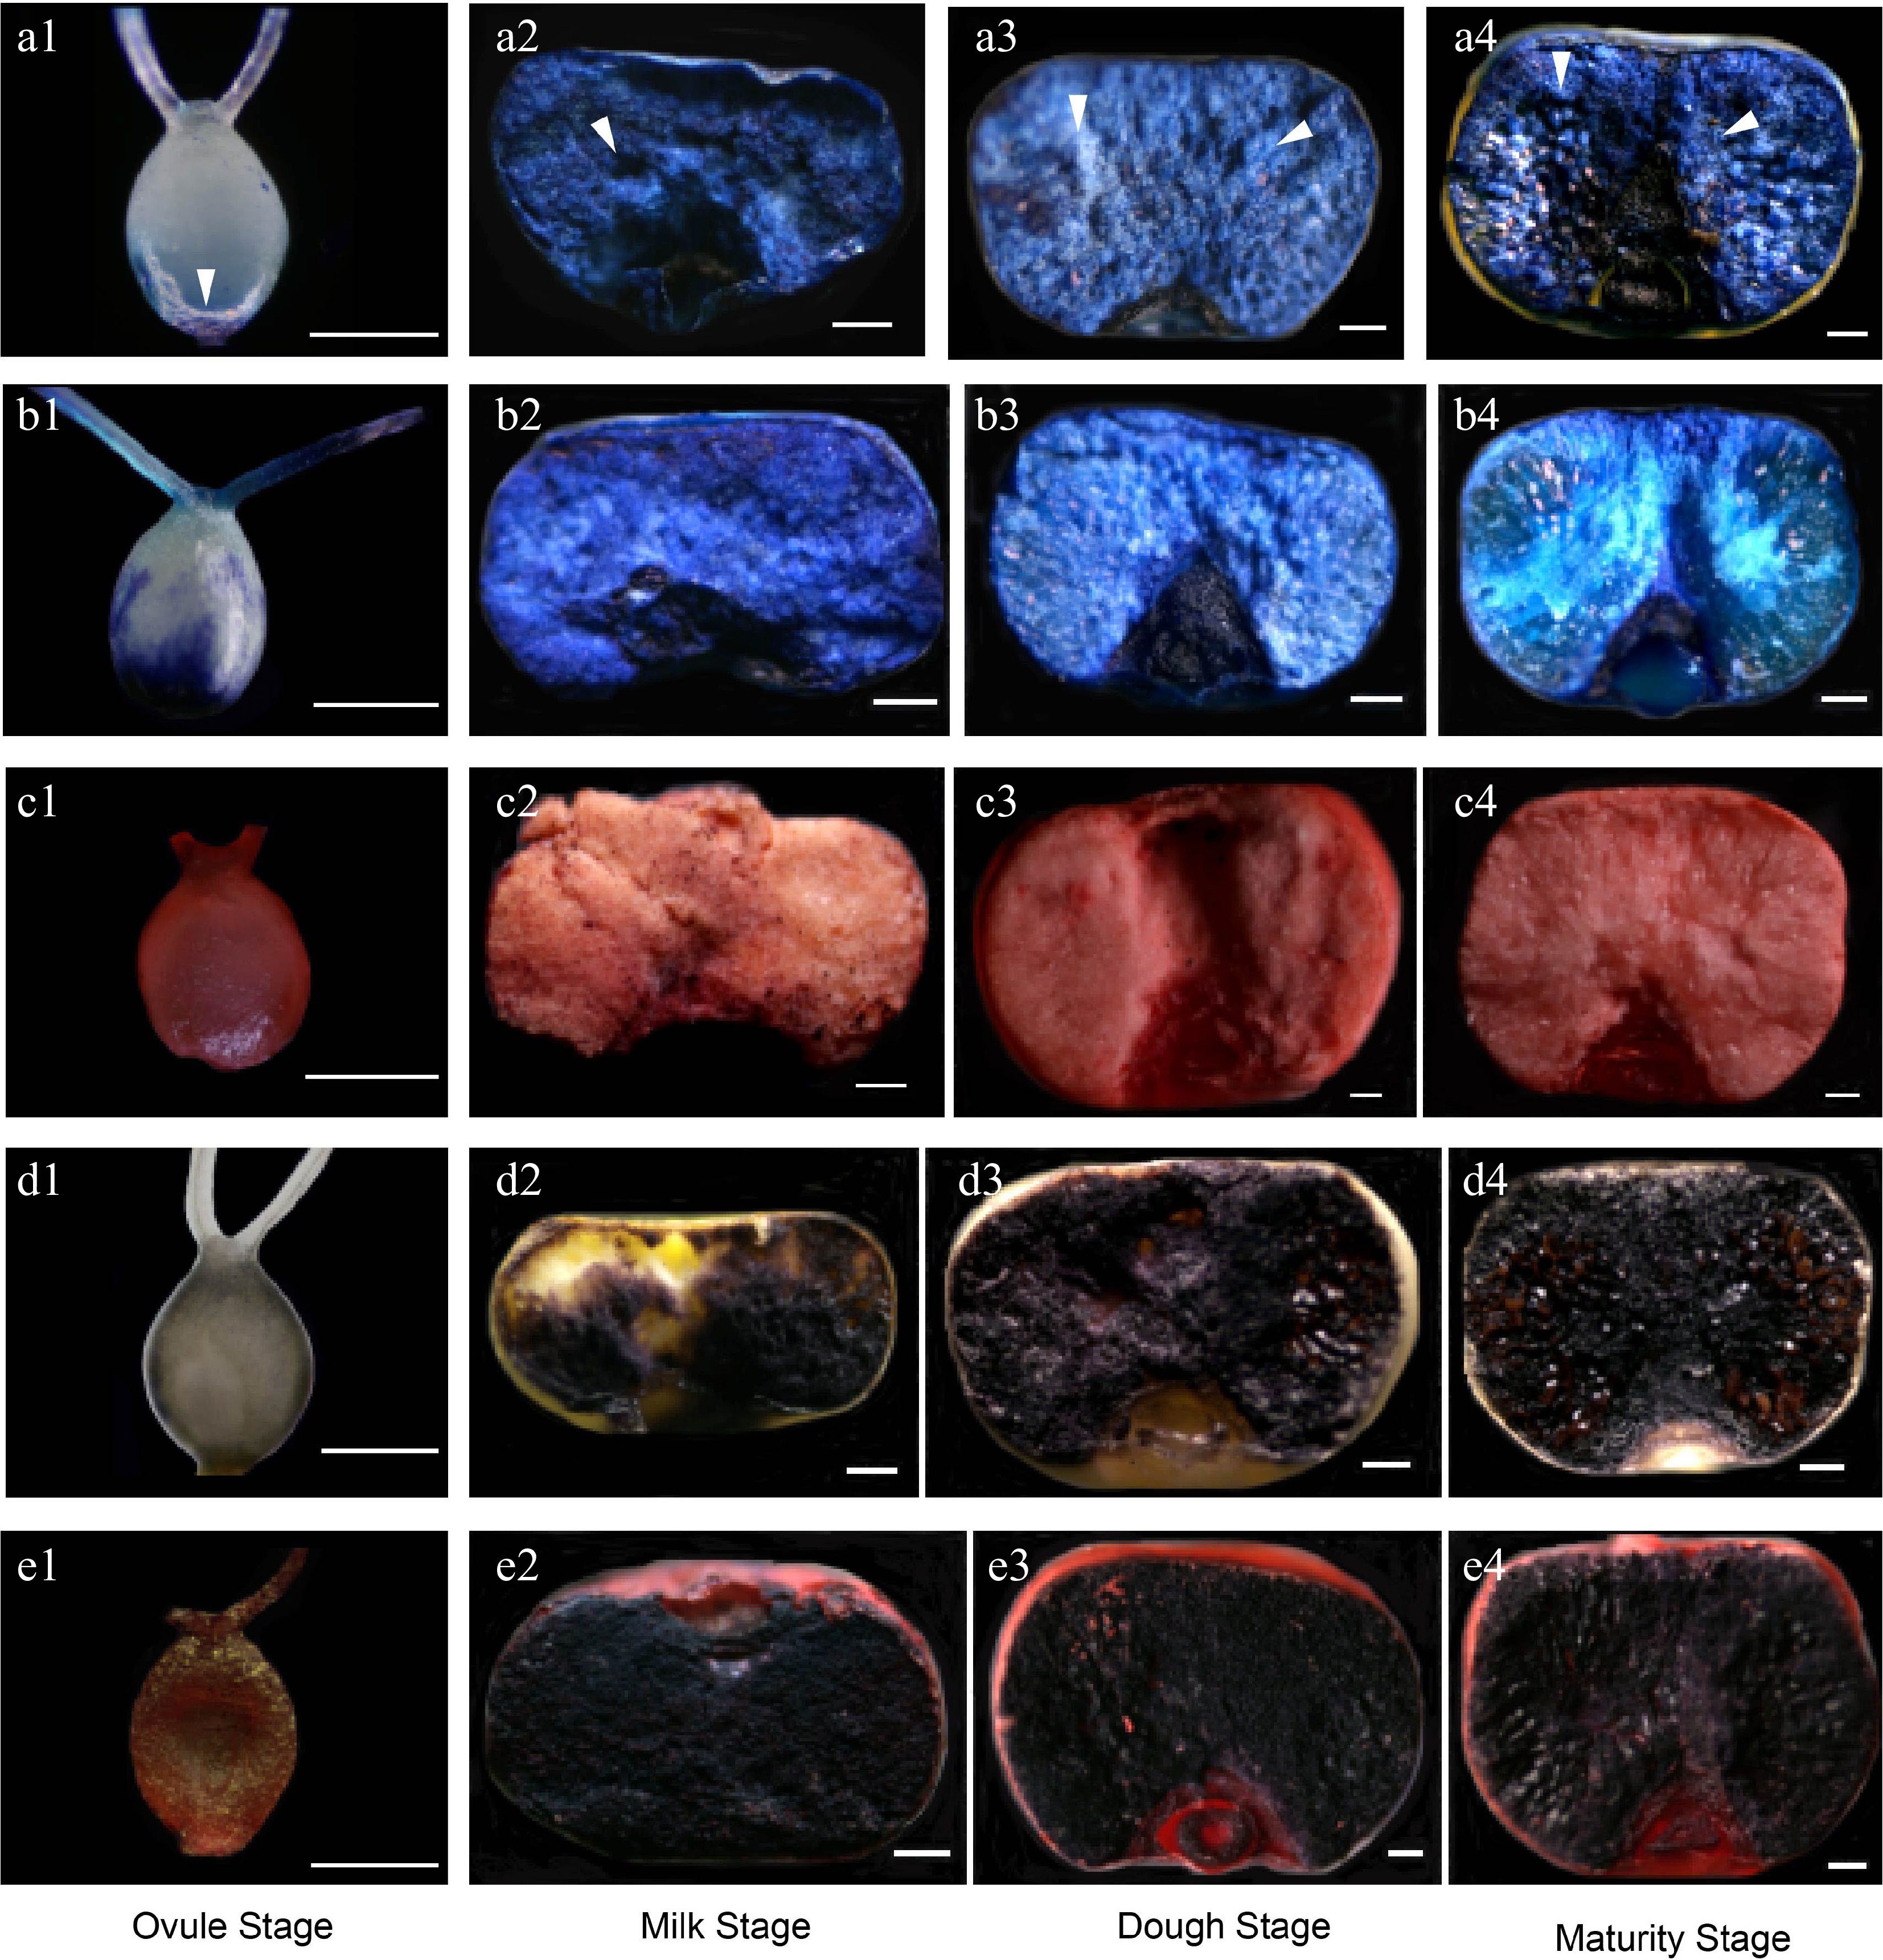
Figure 3.
Storage product accumulation in the foxtail millet hulled grain by staining analysis. (a1)−(a4) Transversely sectioned hulled grain stained with Evans blue to analyze the PCD of developing grain. (b1)−(b4) Transversely sectioned hulled grain stained with toluidine blue to observe endosperm storage product accumulation. (c1)−(c4) Transversely sectioned hulled grain dyed with Sudan Red IV to analyze the lipids accumulation. (d1)−(d4) Transversely sectioned hulled grain stained with Lugol's iodine to analyze the accumulation of starch. (e1)−(e4) Transversely sectioned hulled grain dyed with Sudan Red IV and Lugol's iodine to analyze the accumulation of lipids and starch. Scale bars = 10 μm.
-
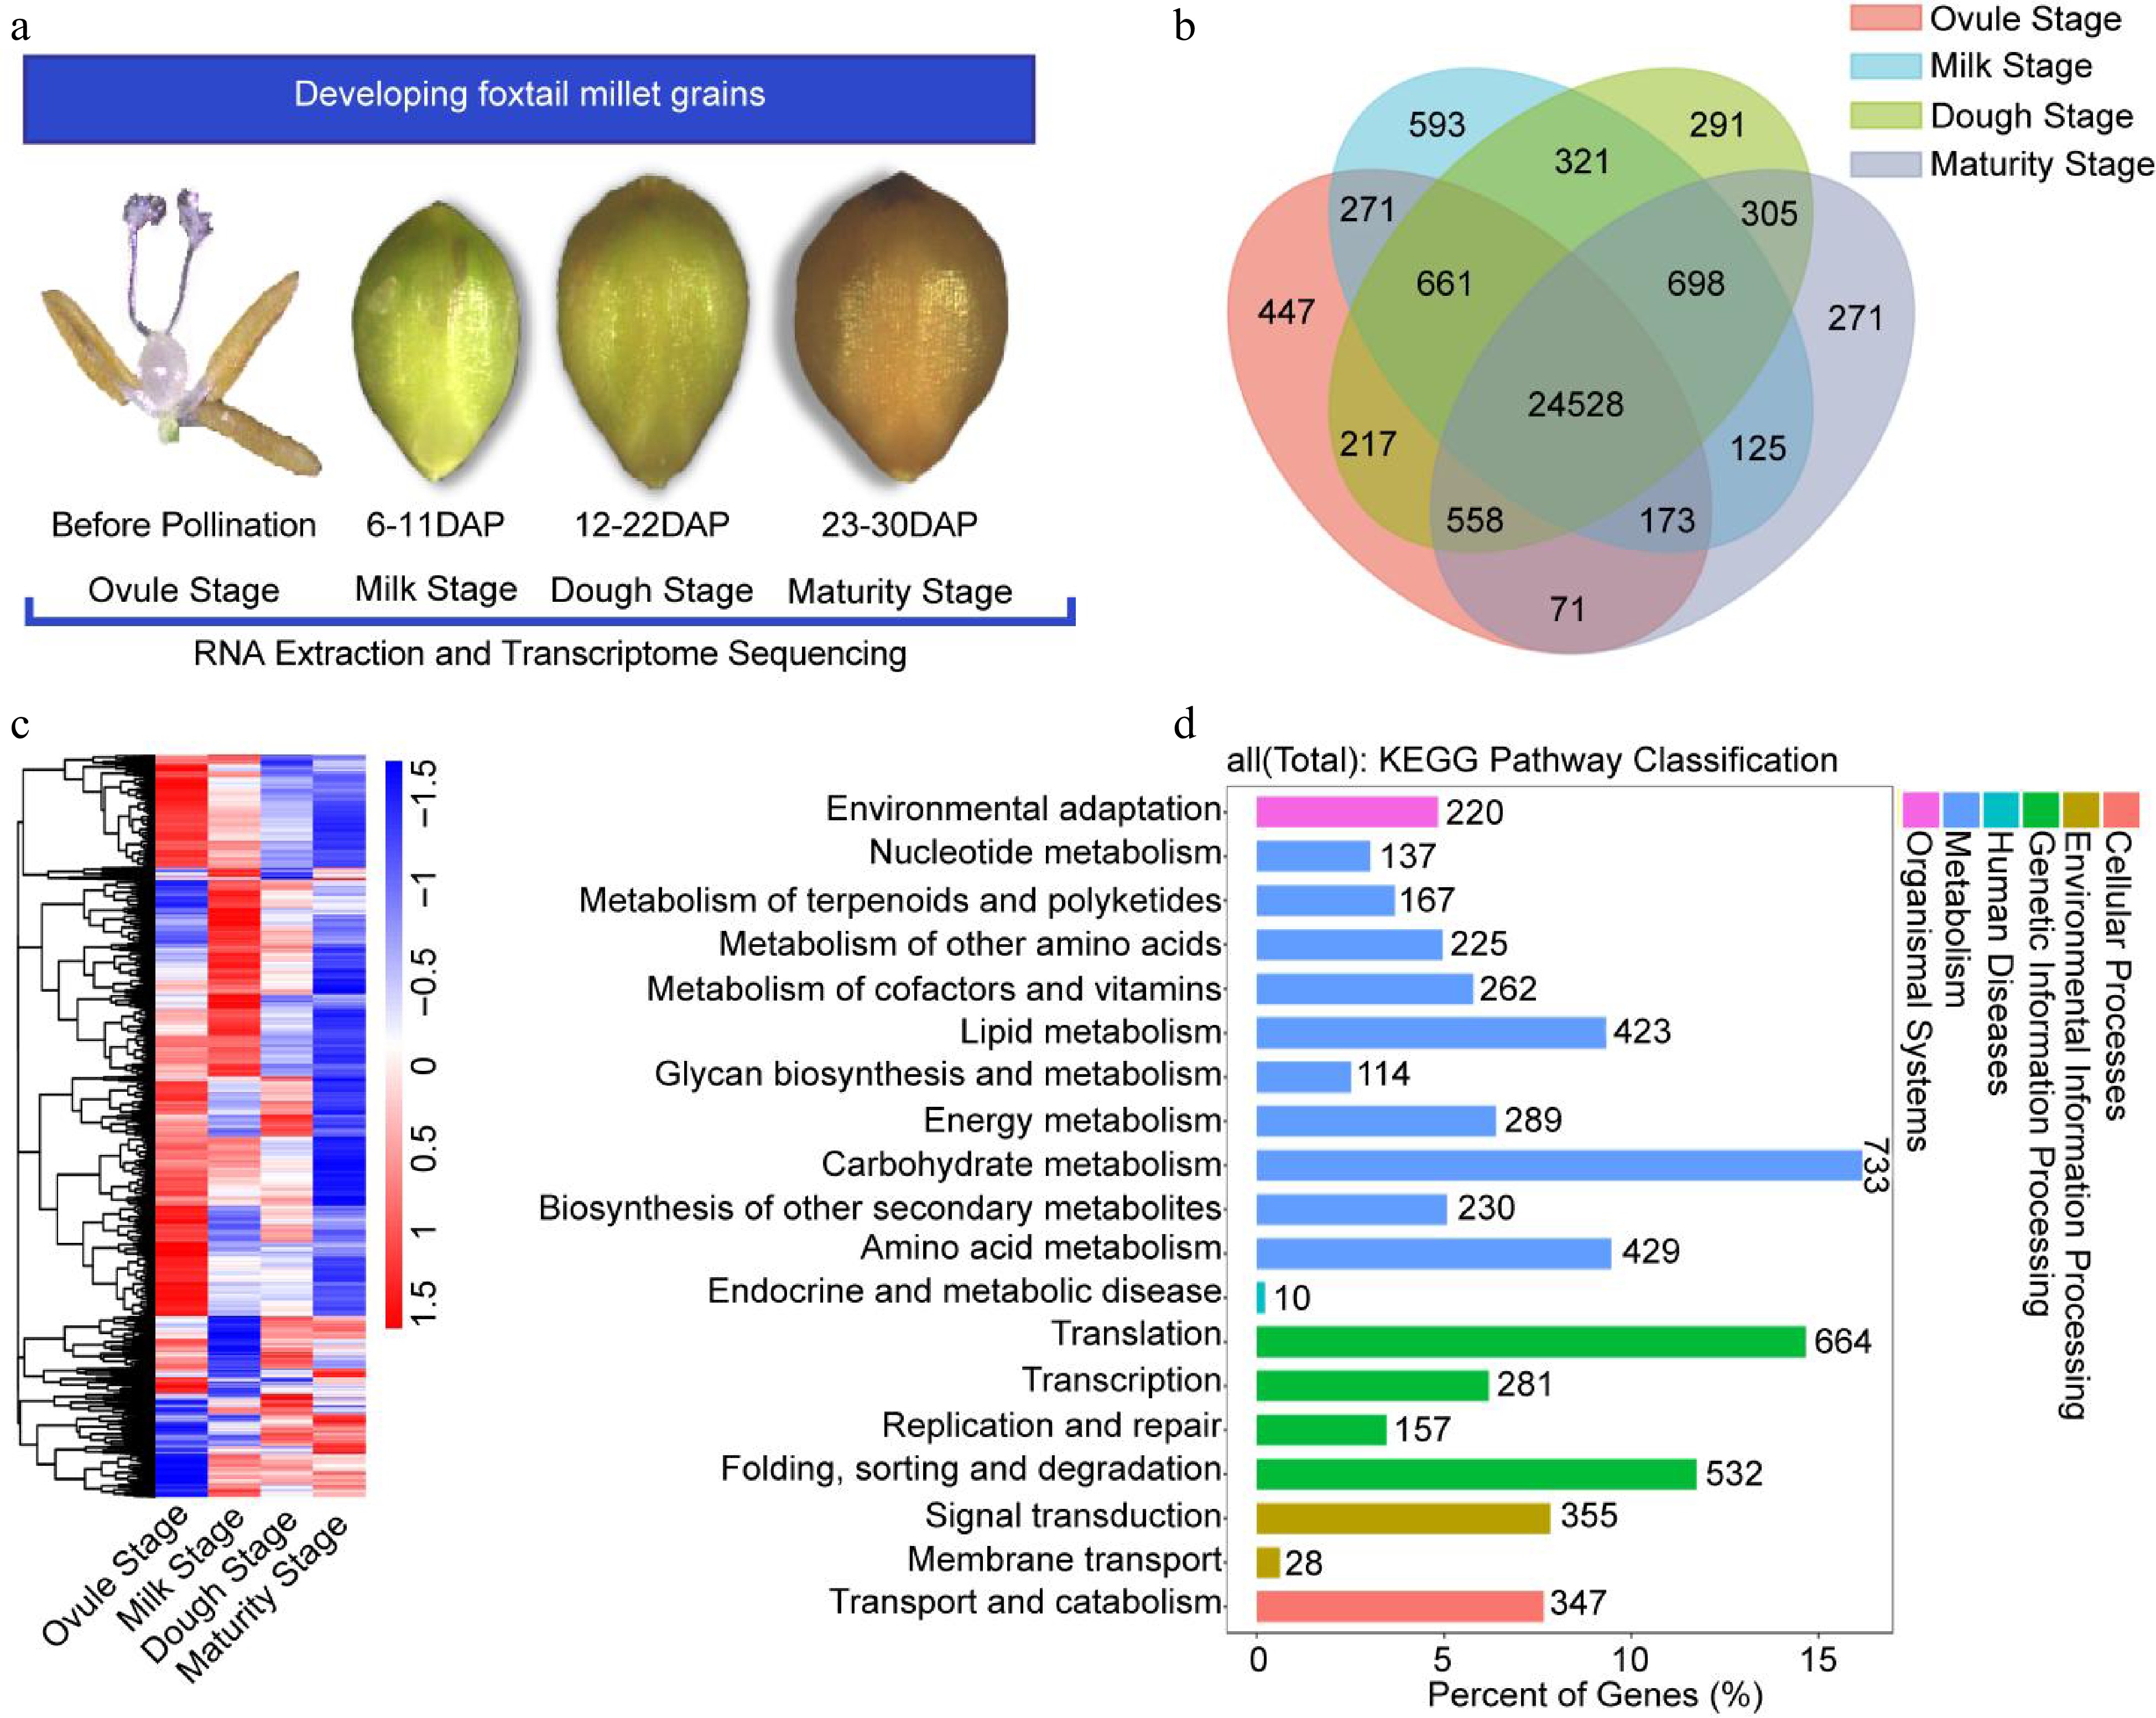
Figure 4.
Global gene expression profiling and KEGG pathway analysis. (a) Schematic overview of the experimental approach. RNA-seq was performed for four developmental stages. (b) Distribution of genes in four samples. (c) Hierarchical cluster analysis of genes expressed during four developmental stages. (d) KEGG pathway classification of the all expression gene in four developmental stages.
-
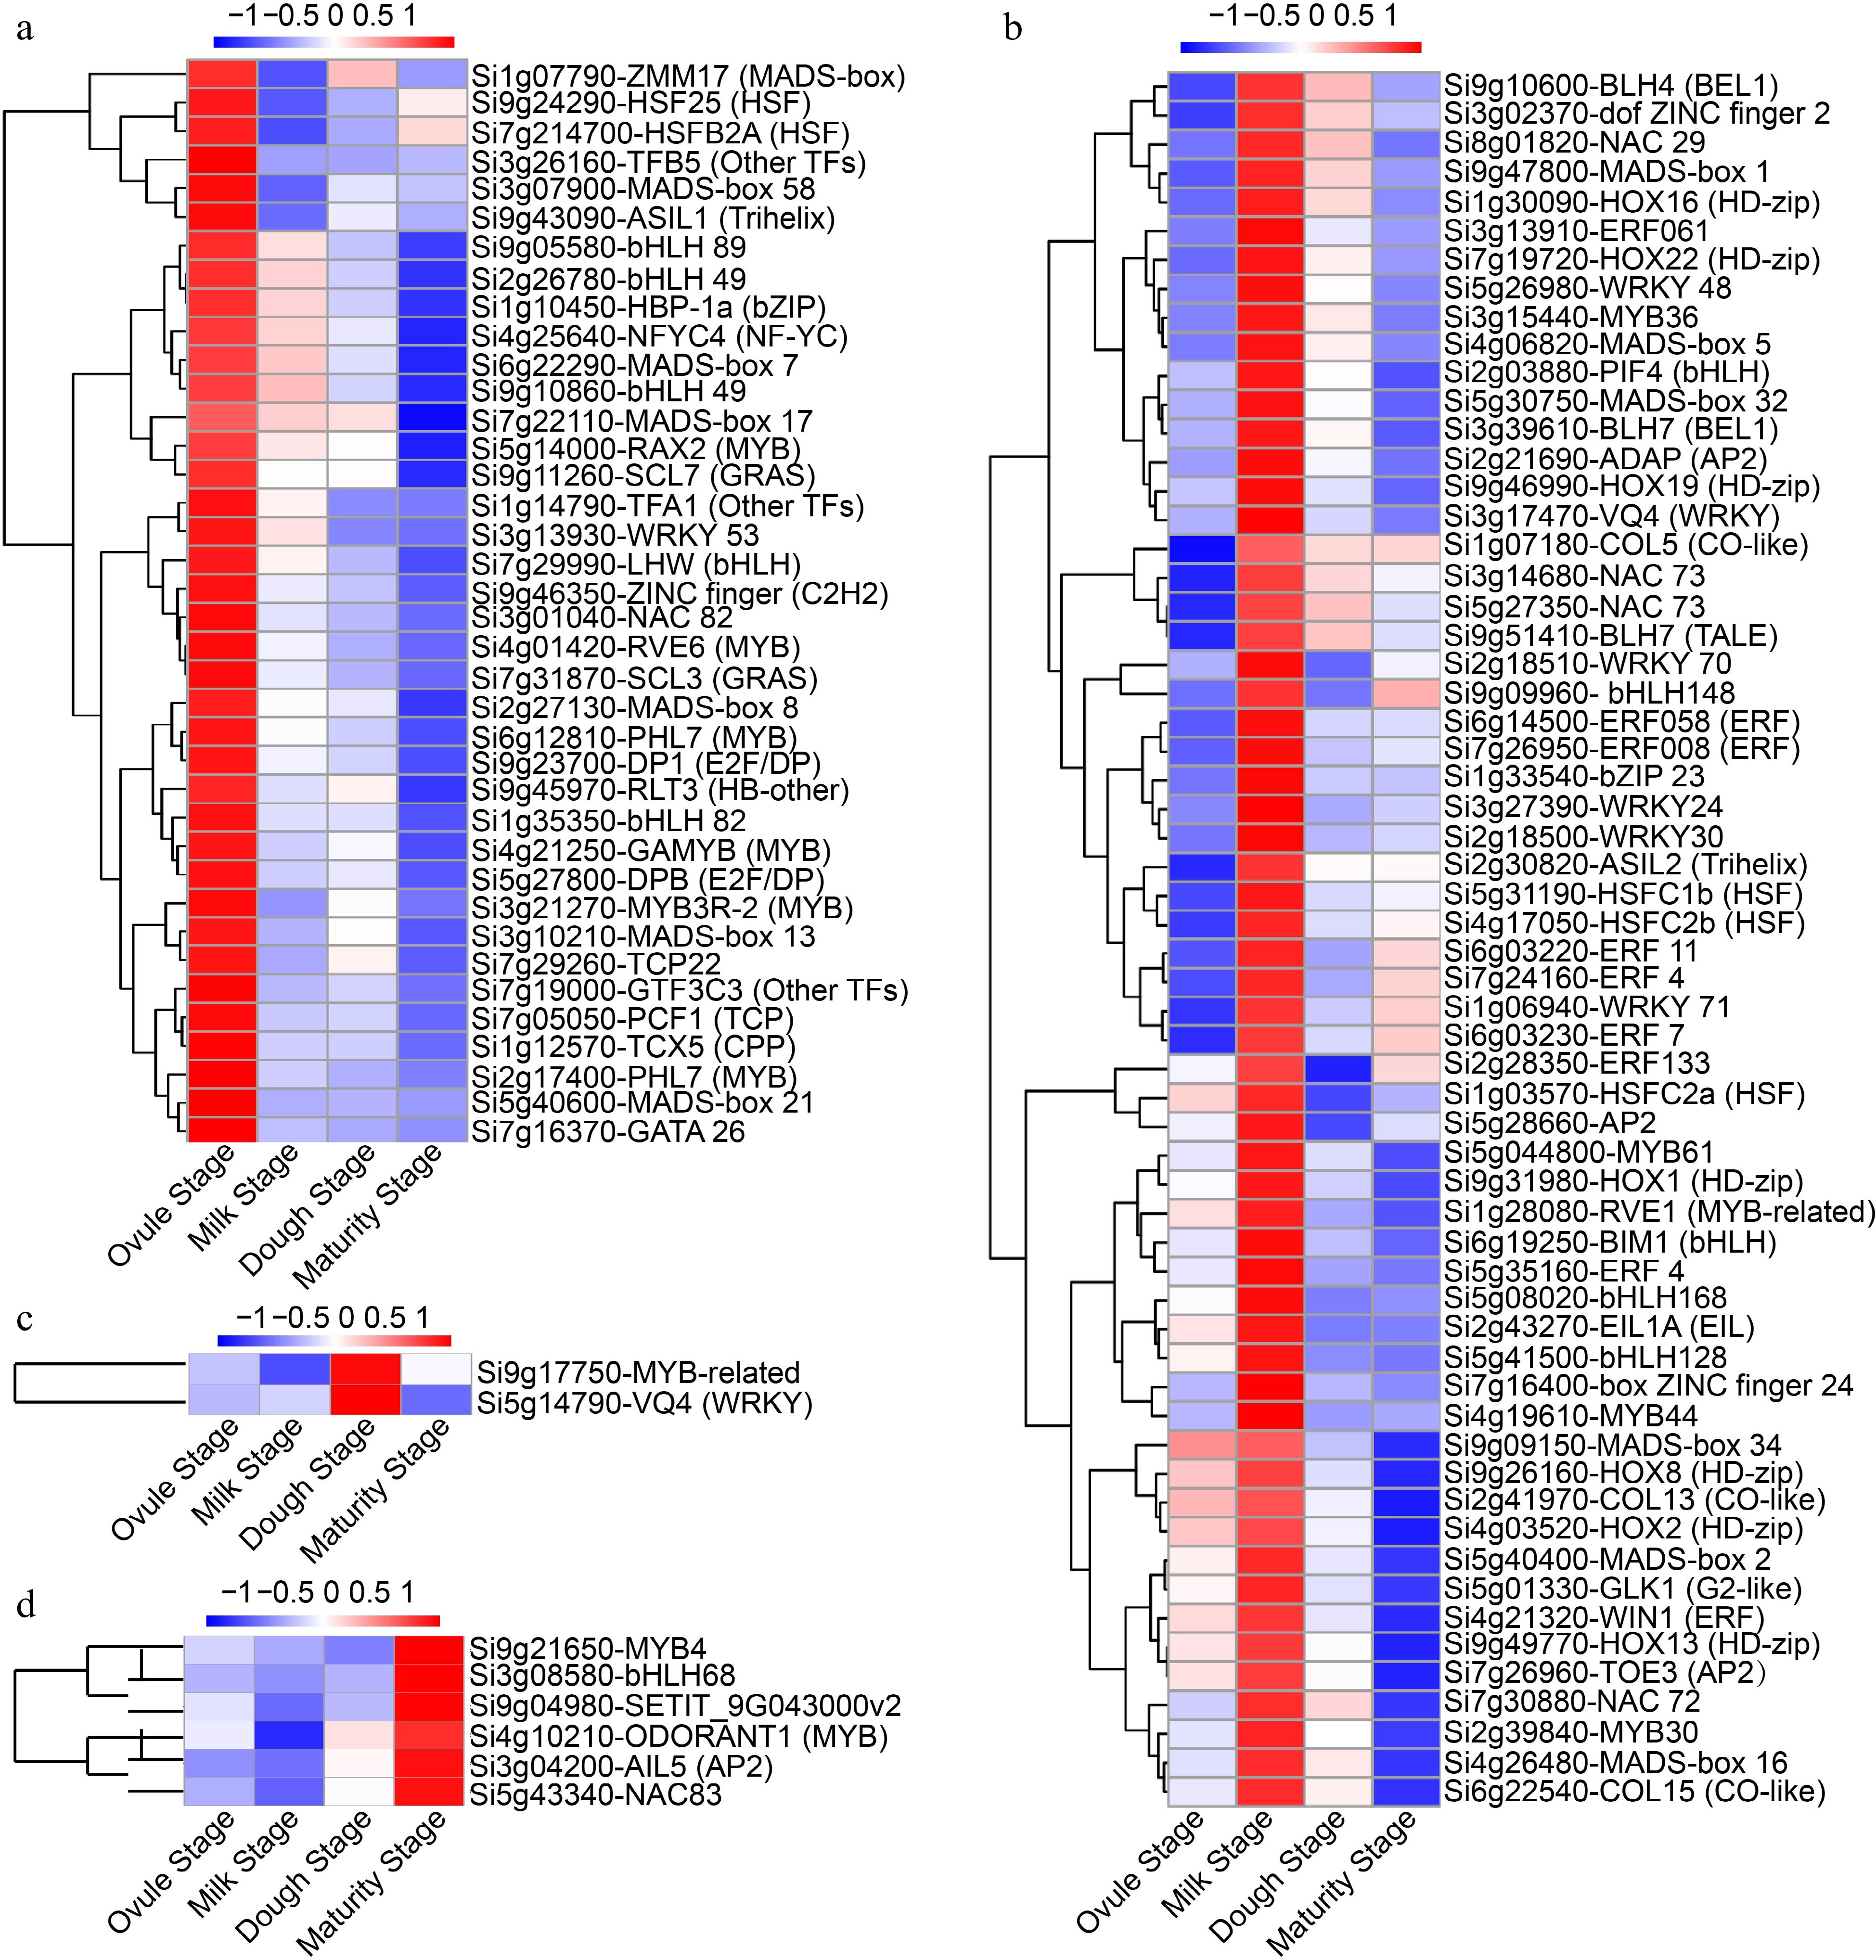
Figure 5.
Hierarchical clustering of TFs expression levels during four developmental stages. TFs predominantly expressed at (a) the ovule stage, (b) the milk stage, (c) the dough stage, and (d) the maturity stage, respectively.
-
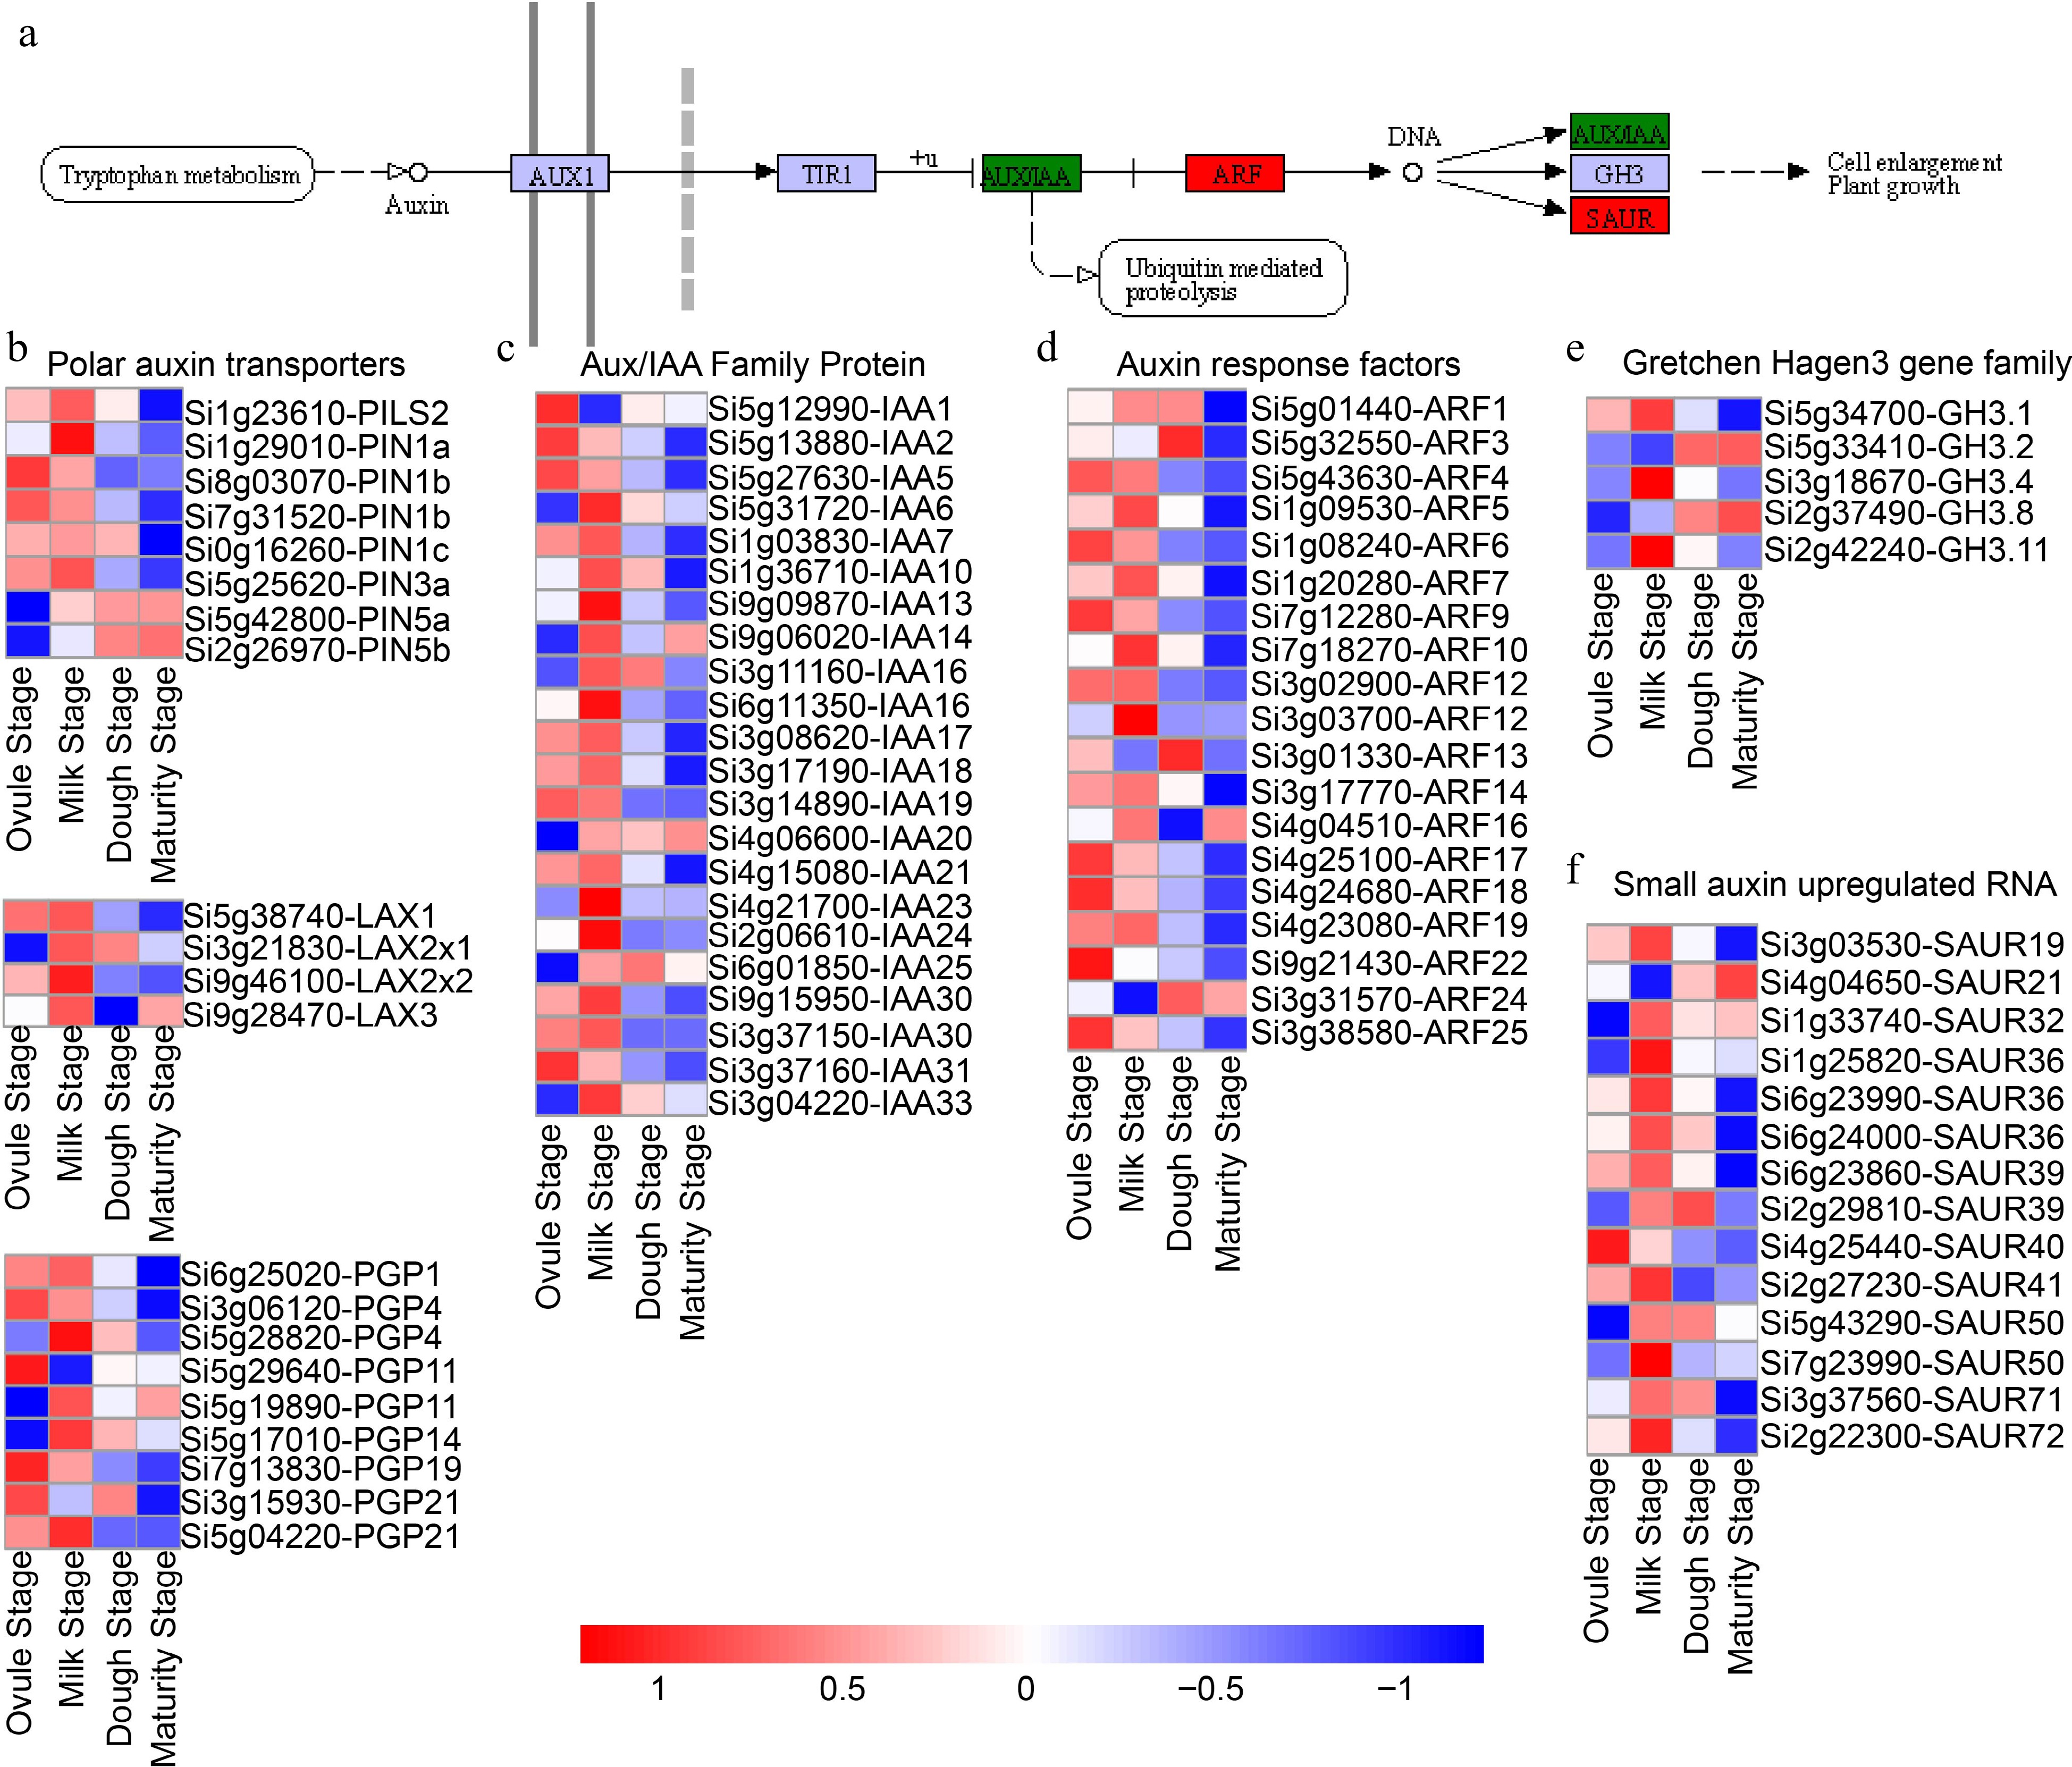
Figure 6.
Expression patterns of genes enriched in the auxin signaling during the four developmental stages. (a) Schematic of the auxin pathway in plants. (b) Polar auxin transporter gene expression patterns, (c) IAAs, (d) ARFs, (e) GH3s, and (f) SAURs respectively. AUX1: auxin influx carrier (AUX1 LAX family); TIR1: Transport inhibitor response 1; AUX/IAA: auxin-responsive protein IAA; ARFs: Auxin response factors; GH3: Indole-3-acetic acid-amido synthetase (auxin responsive GH3 gene family); SAUR: Small auxin up-regulated RNA (SAUR family protein). PINs: Auxin efflux carrier component; LAXs: Auxin transporter-like protein; PGPs: ABC transporter B family member; IAAs: Indole-3-acetic acid.
-
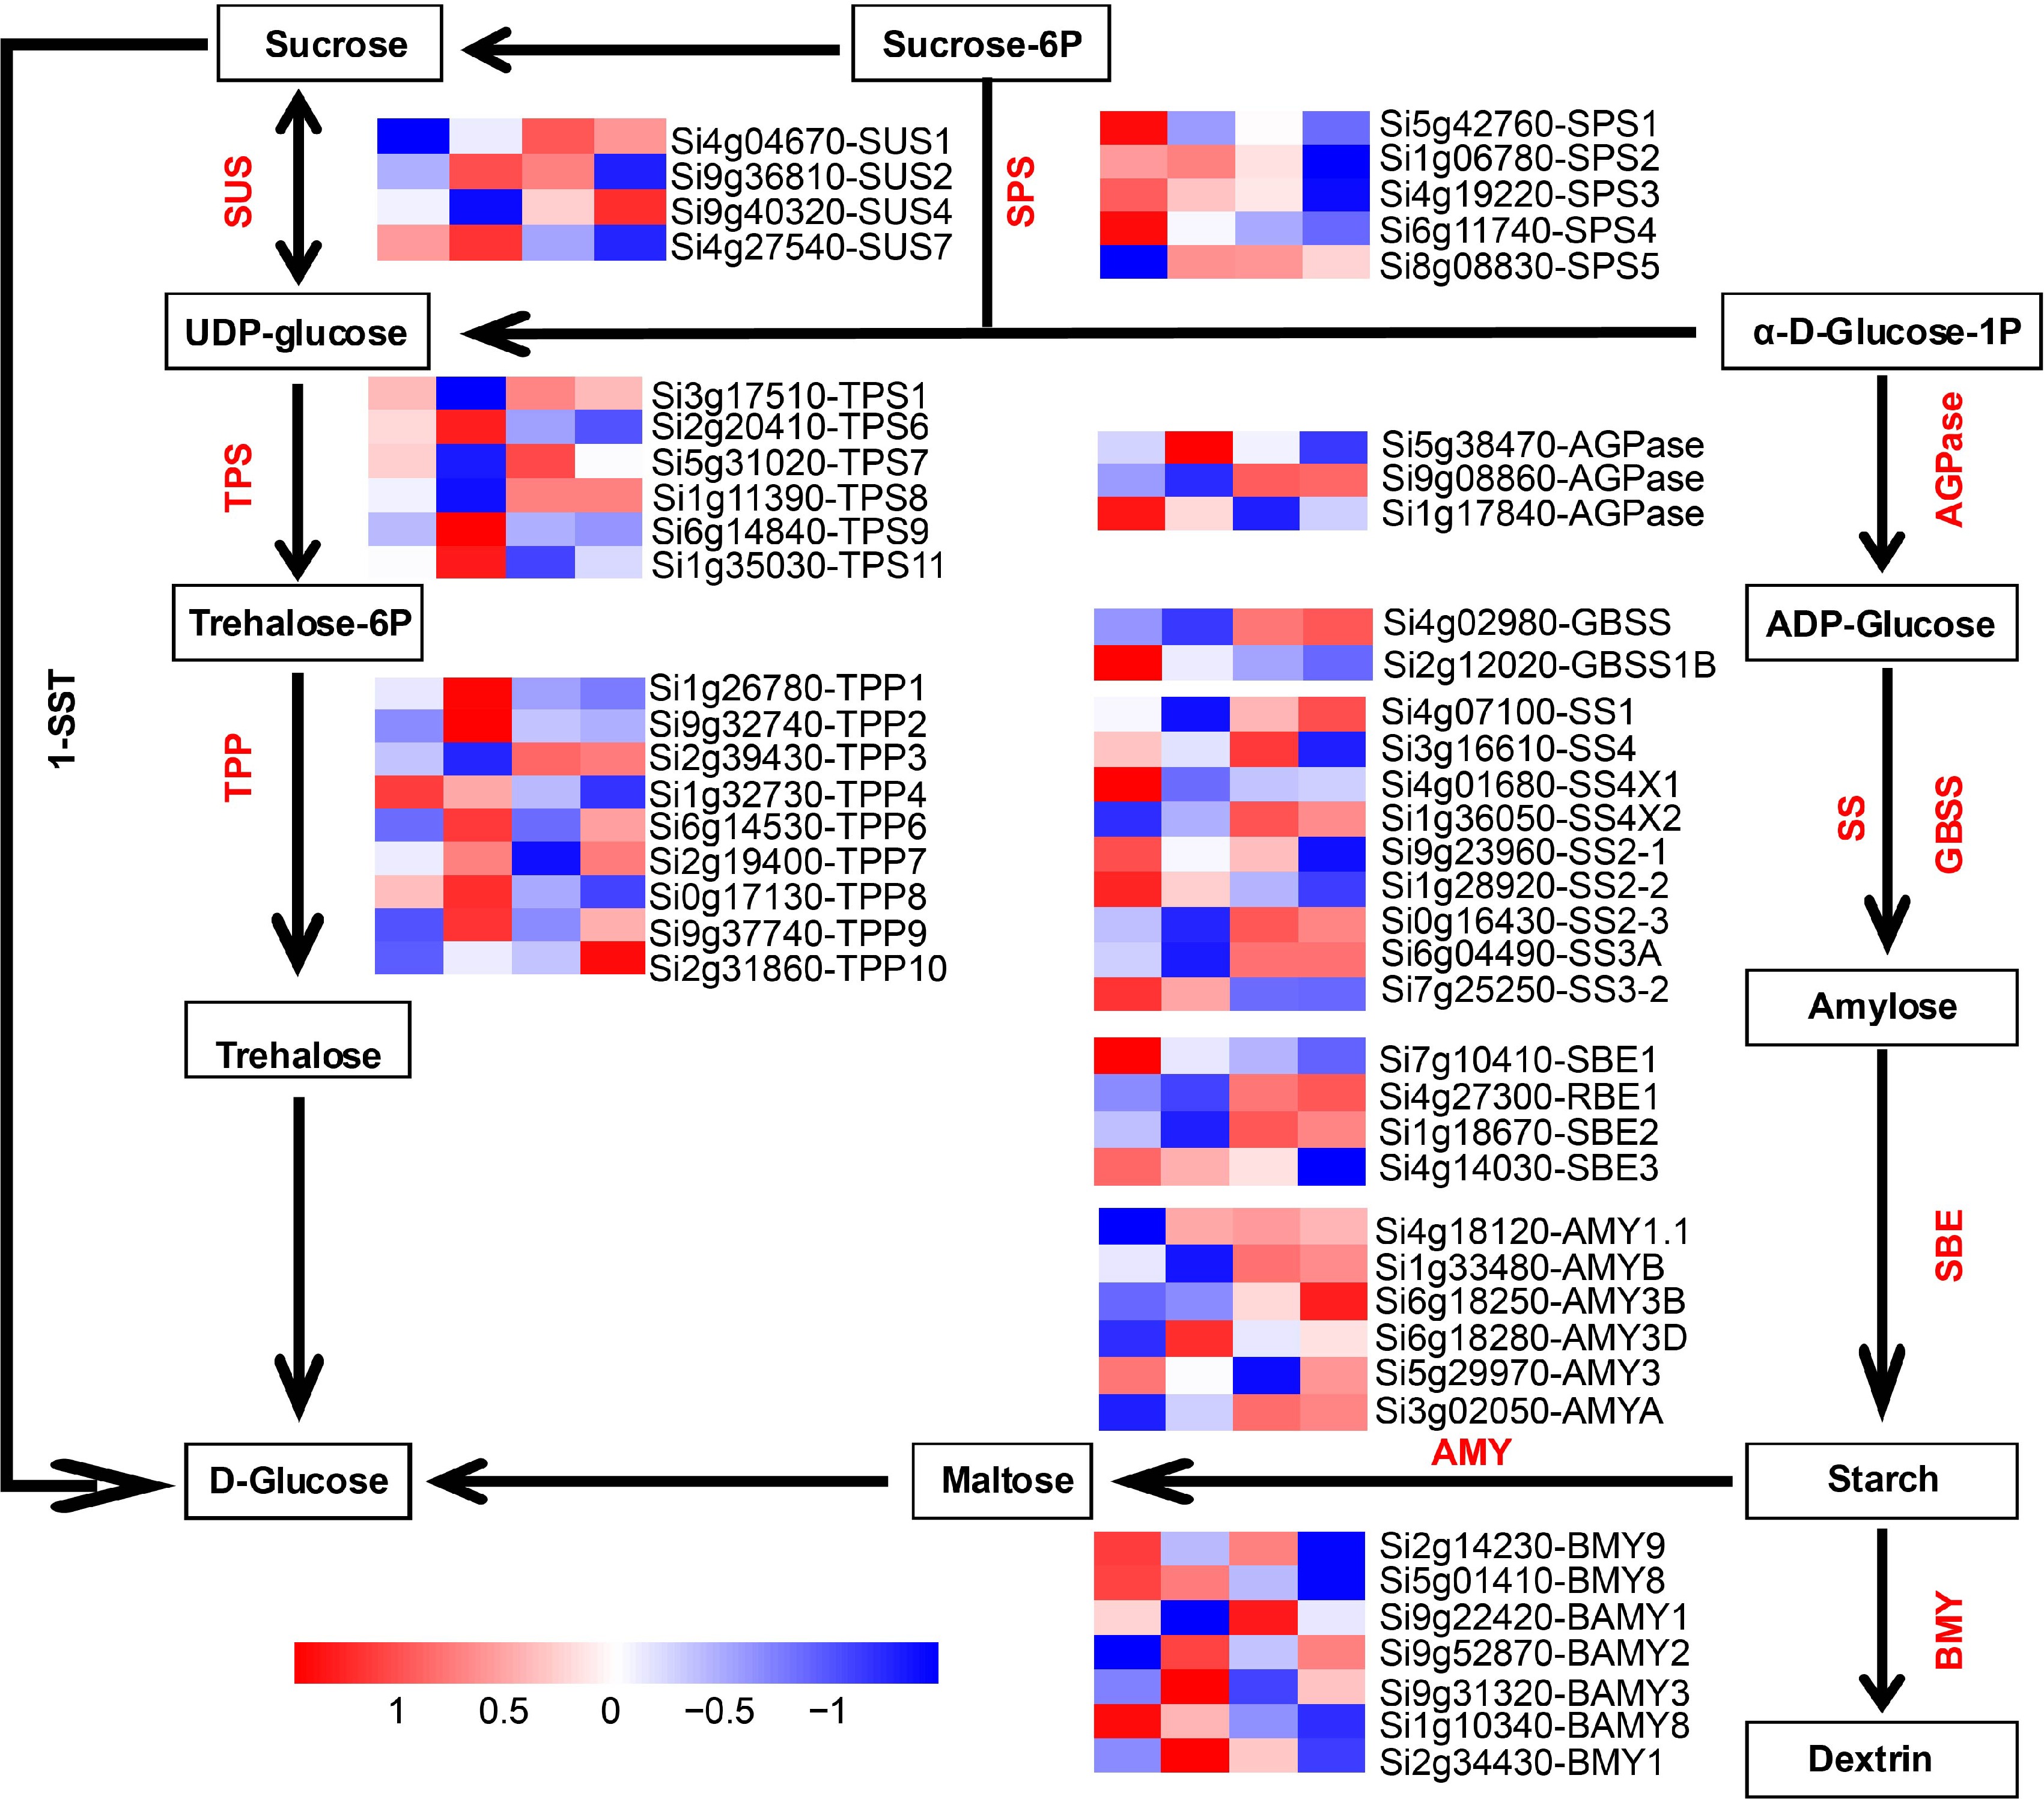
Figure 7.
Analysis of expression patterns of genes in the sucrose-starch metabolism pathway during four developmental stages. AGPase: ADP glucose pyrophosphorylase; GBSS: Granule-bound starch synthase; SSs: Starch synthase; SBE: Starch-branching enzyme; BMY: Beta-amylase; AMY: Alpha-amylase isozyme; SUS: Sucrose synthase; TPS: Alpha trehalose phosphate synthase; TPP: Trehalose phosphate phosphatase; SPS: Sucrose phosphate synthase; 1-SST: Sucrose 1-fructosyltransferase.
-
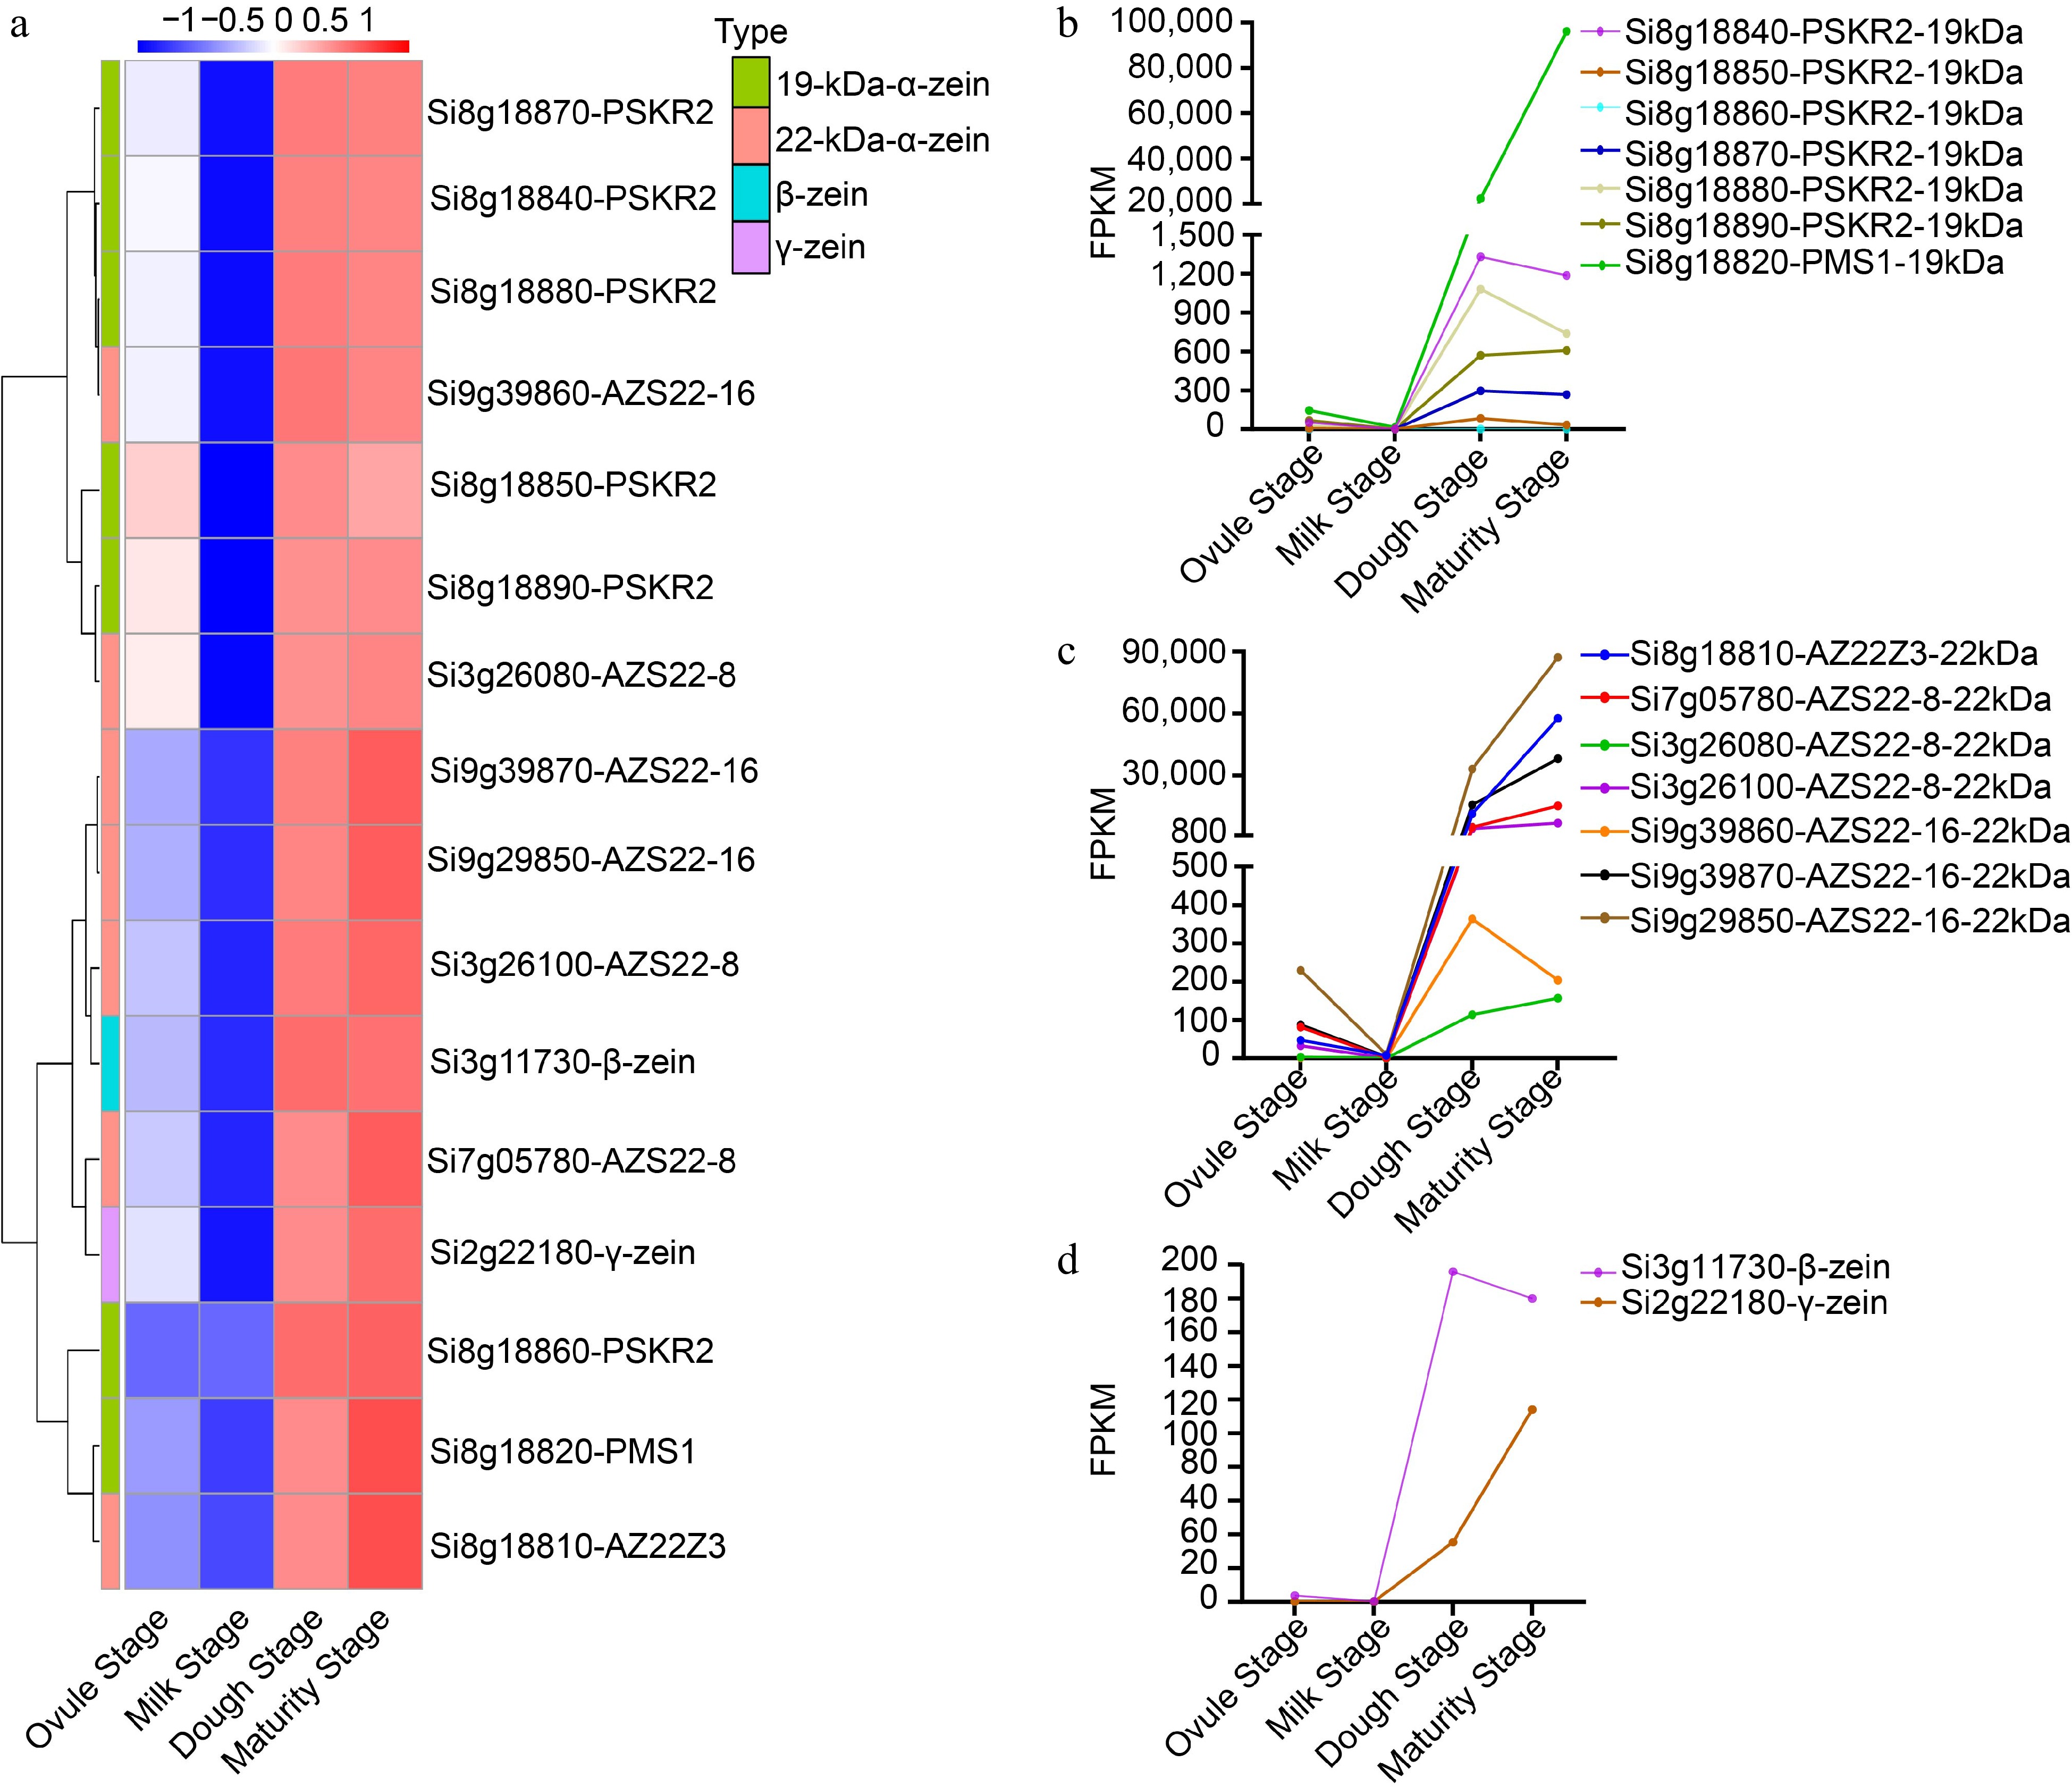
Figure 8.
Analysis of zein family genes expression during four developmental stages. (a) Cluster Heat map of the FPKM values of 16 zein genes at the four developmental stages. (b) Dynamic transcript levels of 19-kDa-α-zein genes at four developmental stages. (c) Dynamic transcript levels of 22-kDa-α-zein at four developmental stages. (d) Dynamic transcript levels of β- and γ-zeins at four developmental stages.
-
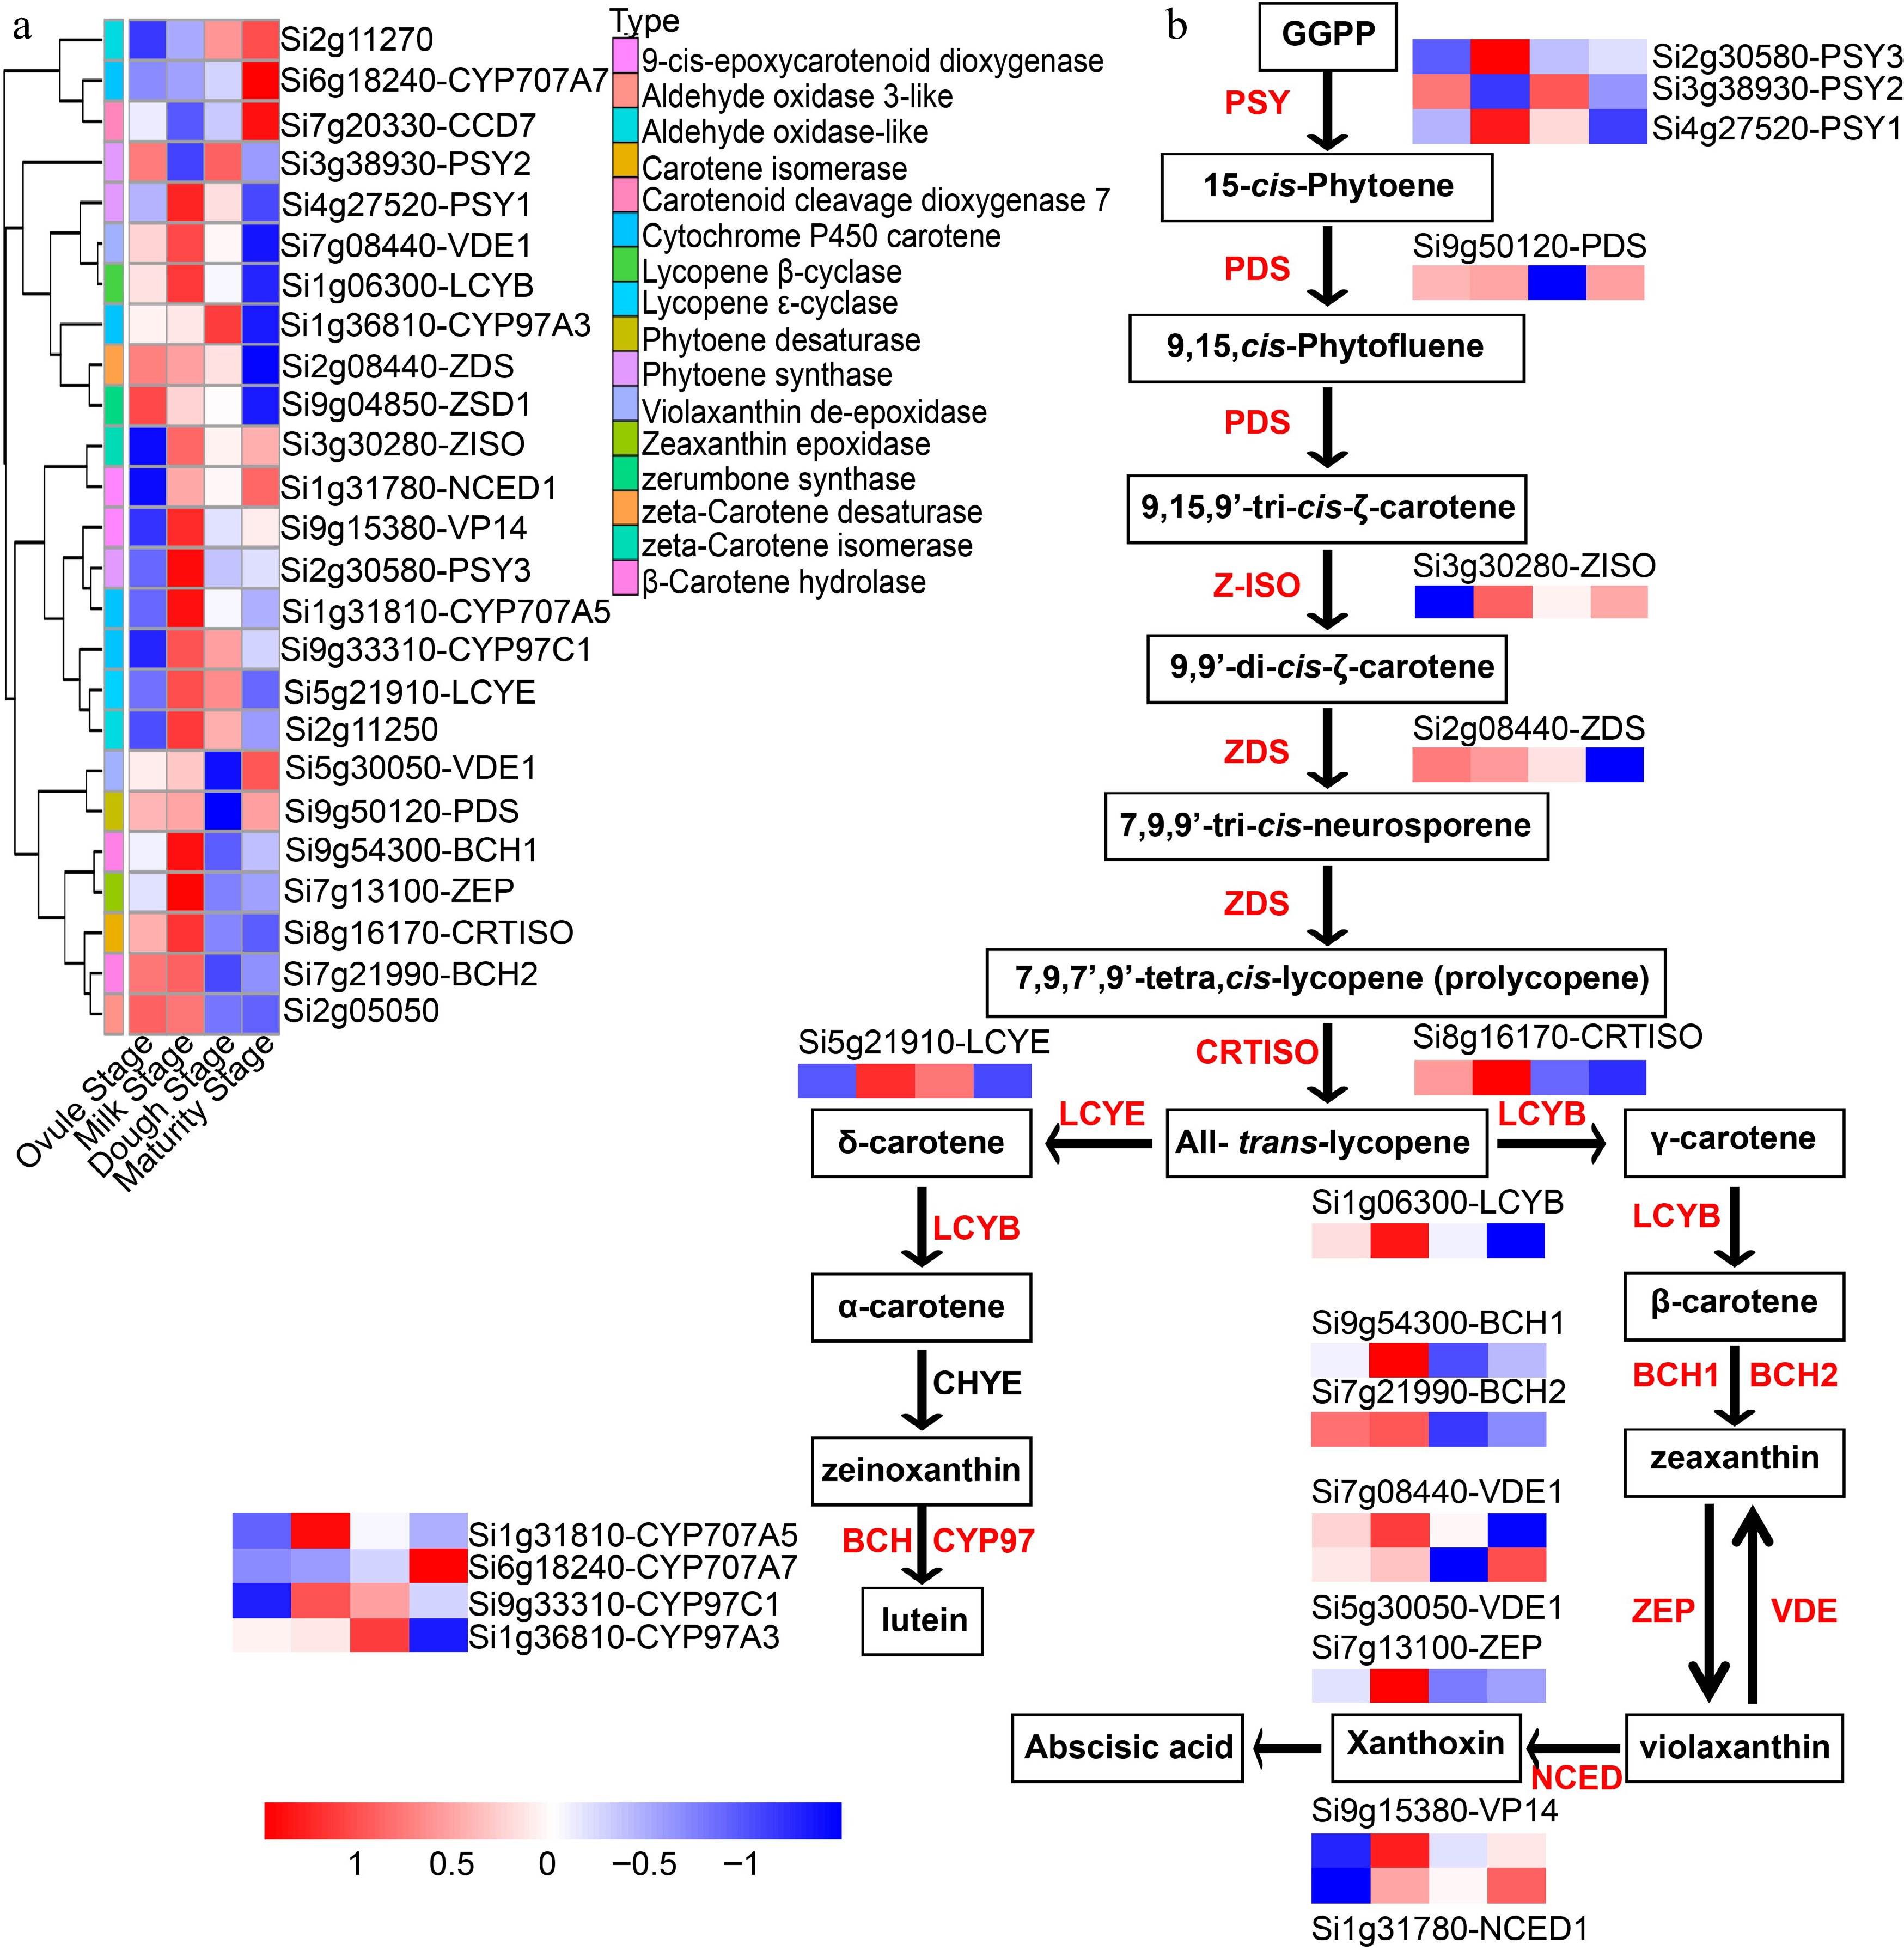
Figure 9.
Hierarchical clustering analysis of carotenoid metabolic pathway genes at the four developmental stages. (a) Heat map analysis of carotenoid metabolic pathway genes in the four developmental stages. (b) Schematic diagram of carotenoid metabolic pathway. PSY: phytoene synthase; PDS: phytoene desaturase; Z-ISO: ζ-carotene isomerase; ZDS: ζ-carotene desaturase; CRTISO: carotenoid isomerase; LCYE: lycopene ε-cyclase; LCYB: lycopene β-cyclase; LCYE: lycopene ε-cyclase; BCH: β-carotene hydroxylase; ZEP: zeaxanthin epoxidase; VDE: violaxanthin de-epoxidase; NCED: 9-cis-epoxycarotenoid dioxygenase; CYP97A: cytochrome P450 carotene hydroxylase.
Figures
(9)
Tables
(0)