-
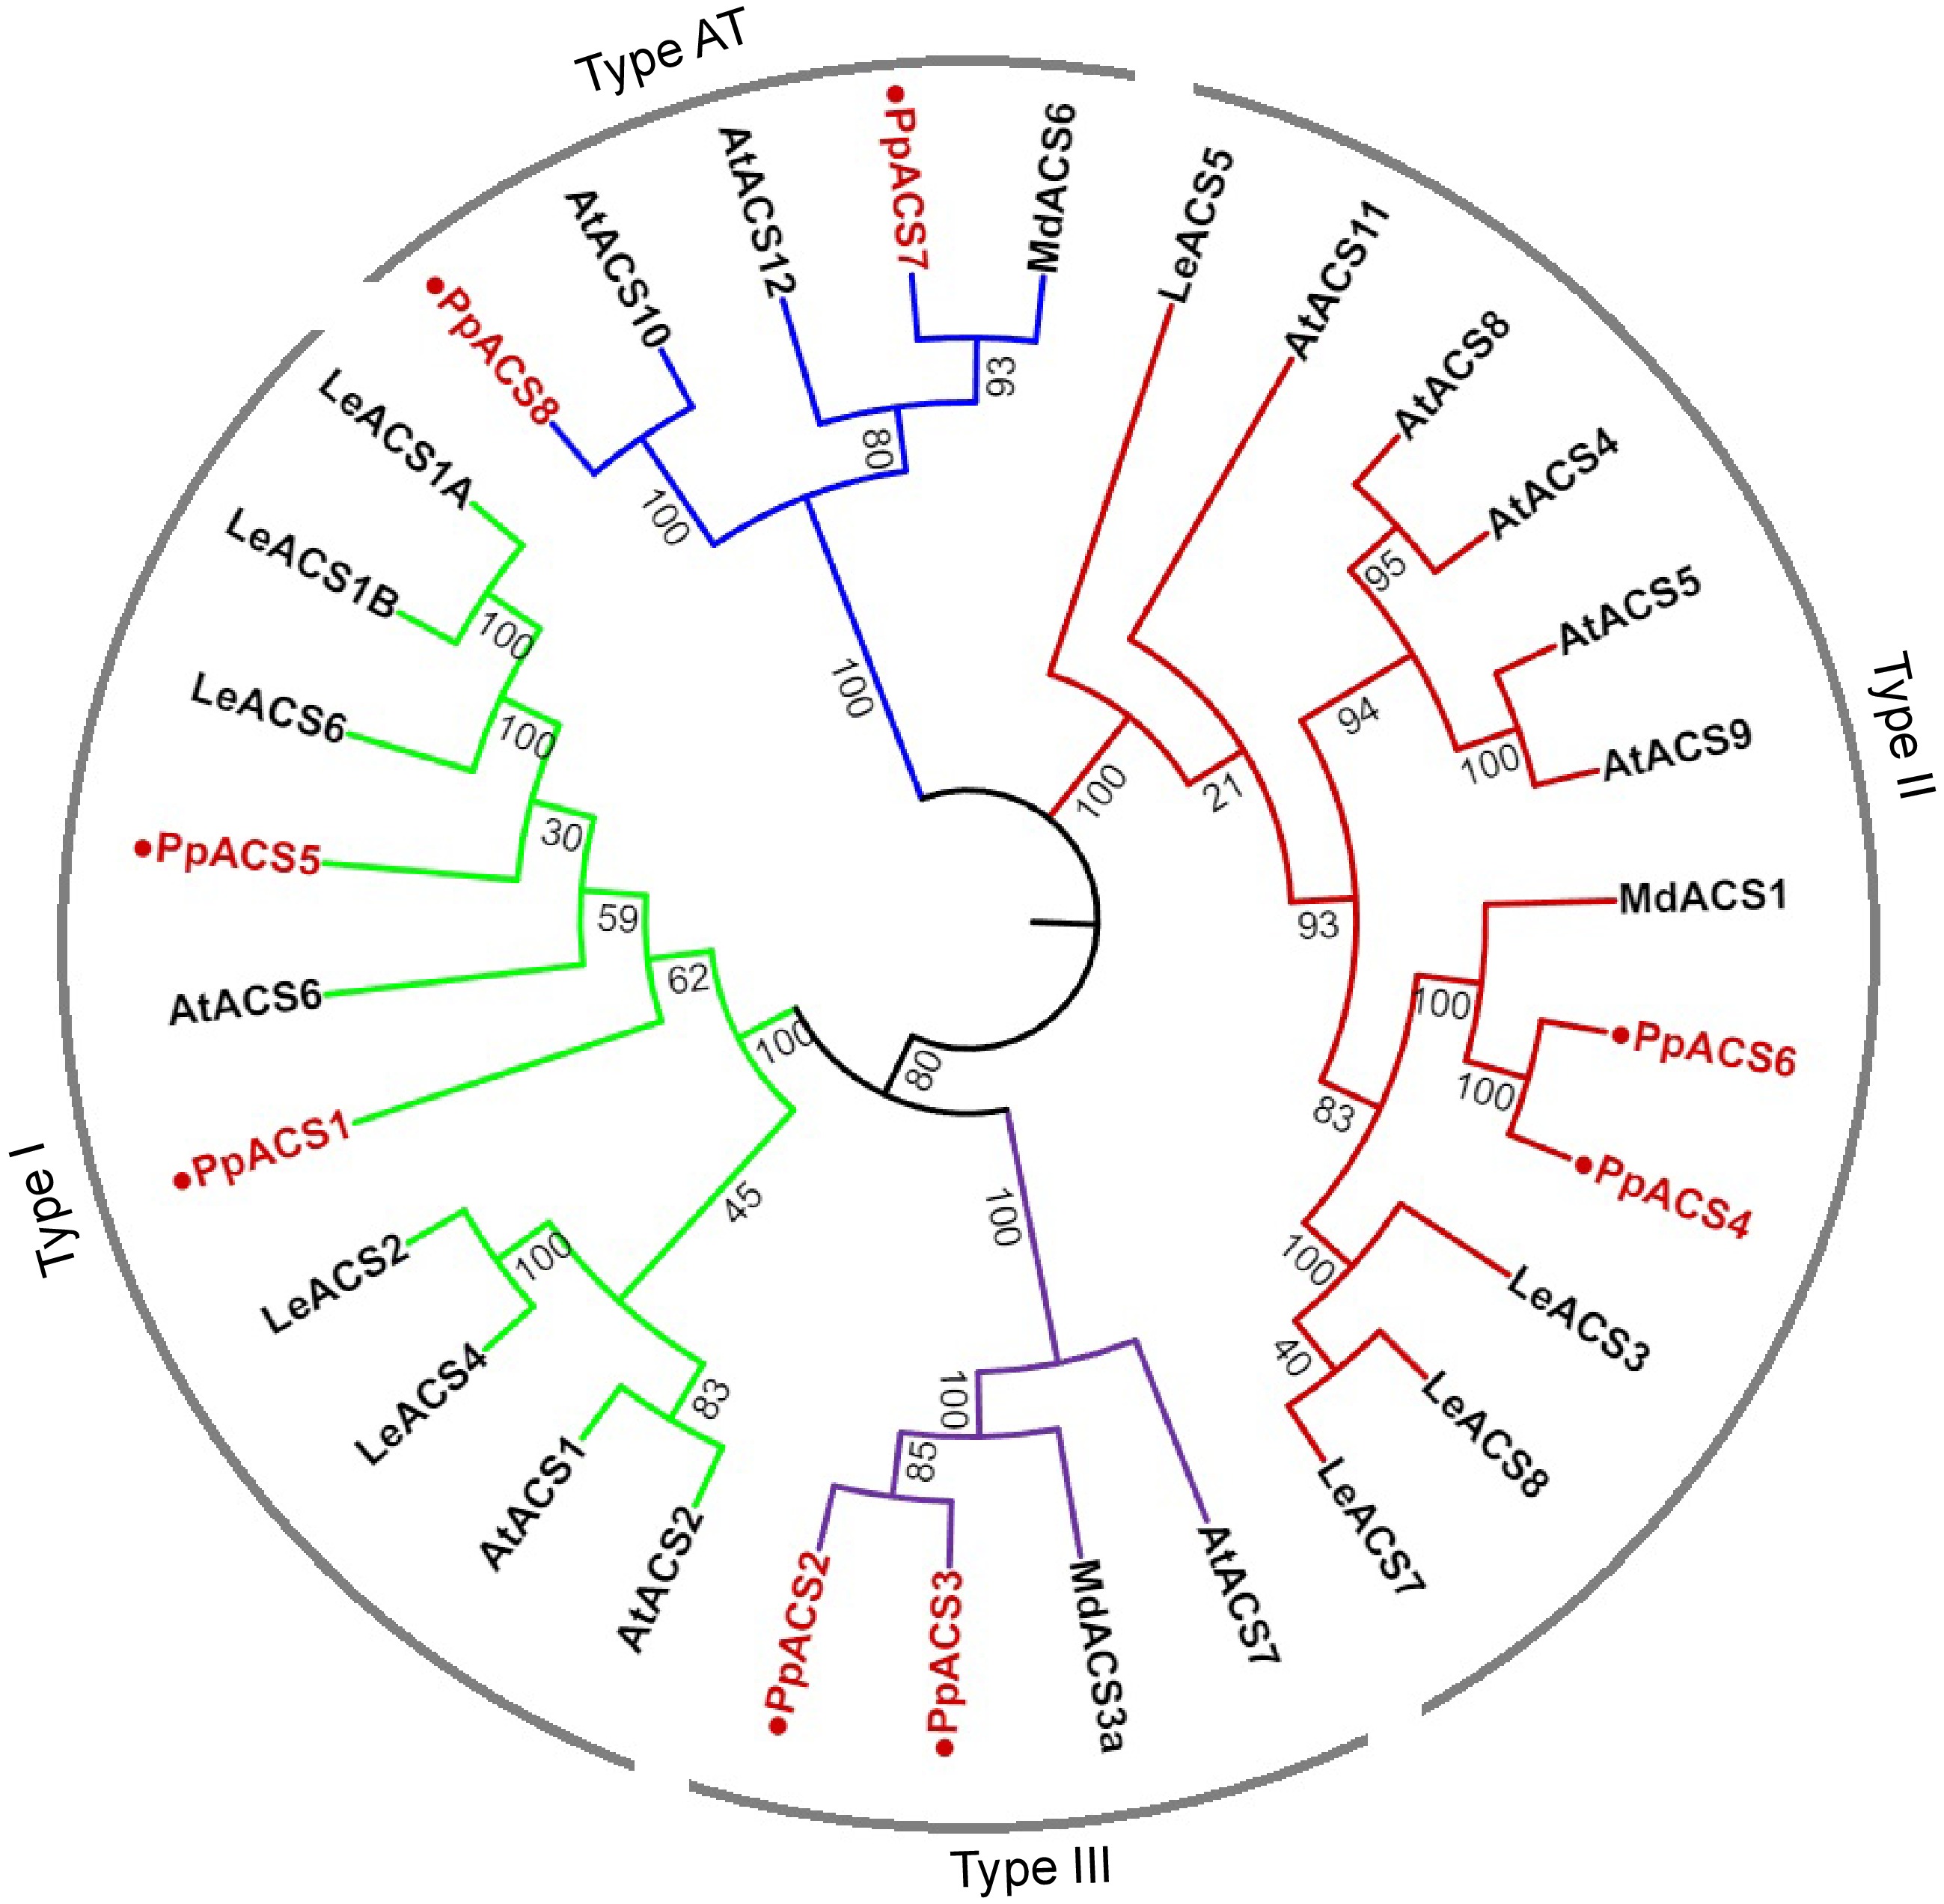
Figure 1.
Phylogenetic analysis of ACS proteins from Arabidopsis, tomato, apple, and peach. A neighbor-joining tree of ACS proteins was generated using the MEGA11.0 with 1000 replicates (Jukes-Cantor distance matrix). ACS proteins of peach are marked with red color. Deduced amino acid sequences from Arabidopsis [AtACS1 (At3g61510), AtACS2 (At1g01480), AtACS4 (At2g22810), AtACS5 (At5g65800), AtACS6 (At4g11280), AtACS7 (At4g26200), AtACS8 (At4g37770), AtACS9 (At3g49700), AtACS10 (At1g62960), AtACS11 (At4g08040), AtACS12 (At5g51690)], apple [MdACS1 (U89156), MdACS3a (AB243060), MdACS6 (MDP0000133334)] and tomato [LeACS1A (U18056), LeACS1B (U18057), LeACS2 (X59139), LeACS3 (U17972), LeACS4 (X59146), LeACS5 (AF167425), LeACS6 (AF167428), LeACS7 (AF043122), LeACS8 AF167427)] were used. AT type ACS proteins are more like aminotransferases.
-

Figure 2.
Amino acid alignment of the C-termini of ACS proteins from Arabidopsis and peach. The conserved serine (S) residues of the ACS proteins are marked with black boxes according to previous research[31].
-

Figure 3.
Gene structure and conserved protein motifs of the PpACS family in peach. (a) The phylogenetic tree based on all PpACS proteins was constructed using the maximum likelihood method with 1,000 bootstrap. (b) The gene structures of the PpACS genes. The green and yellow boxes represent UTRs and CDSs respectively. (c) The conserved motifs of the PpACS proteins were identified using the MEME program. (d) The sequence logos of the conserved motifs numbered from 1 to 10. The seven conserved domains of ACS are marked with red boxes and named as box 1−7.
-
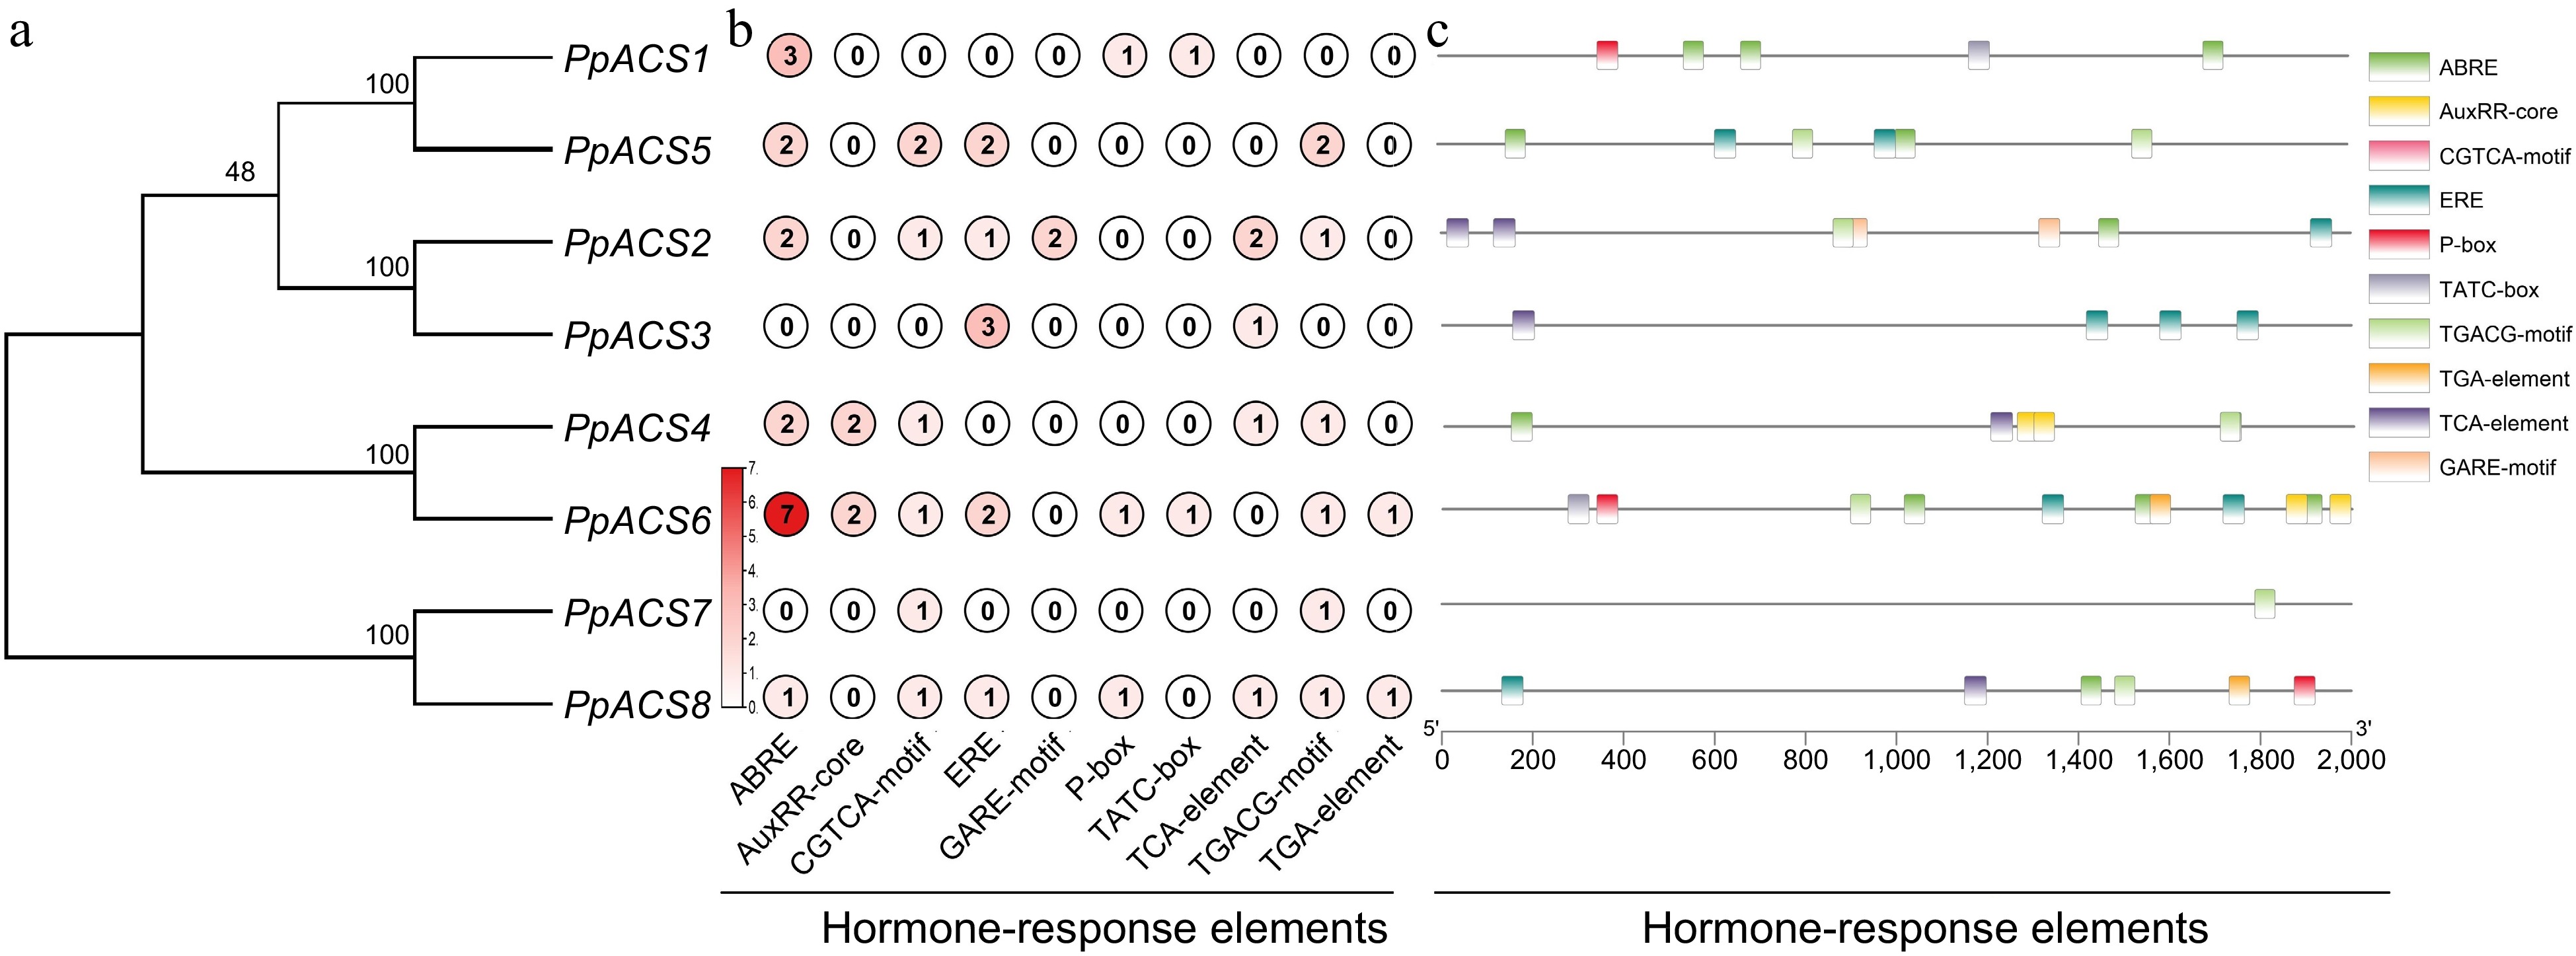
Figure 4.
Analysis of the cis-elements in the promoters of the PpACS genes. The cis-elements of the PpACS genes were determined by the PlantCARE online web tool and visualized by the TB-tool. (a) Phylogenetic tree of all PpACS proteins. (b) Number of hormone-responsive elements detected in each PpACS gene promoter. (c) Visualization of hormone-responsive elements in the PpACS promoters, with ten different cis-elements displayed by different colored boxes.
-
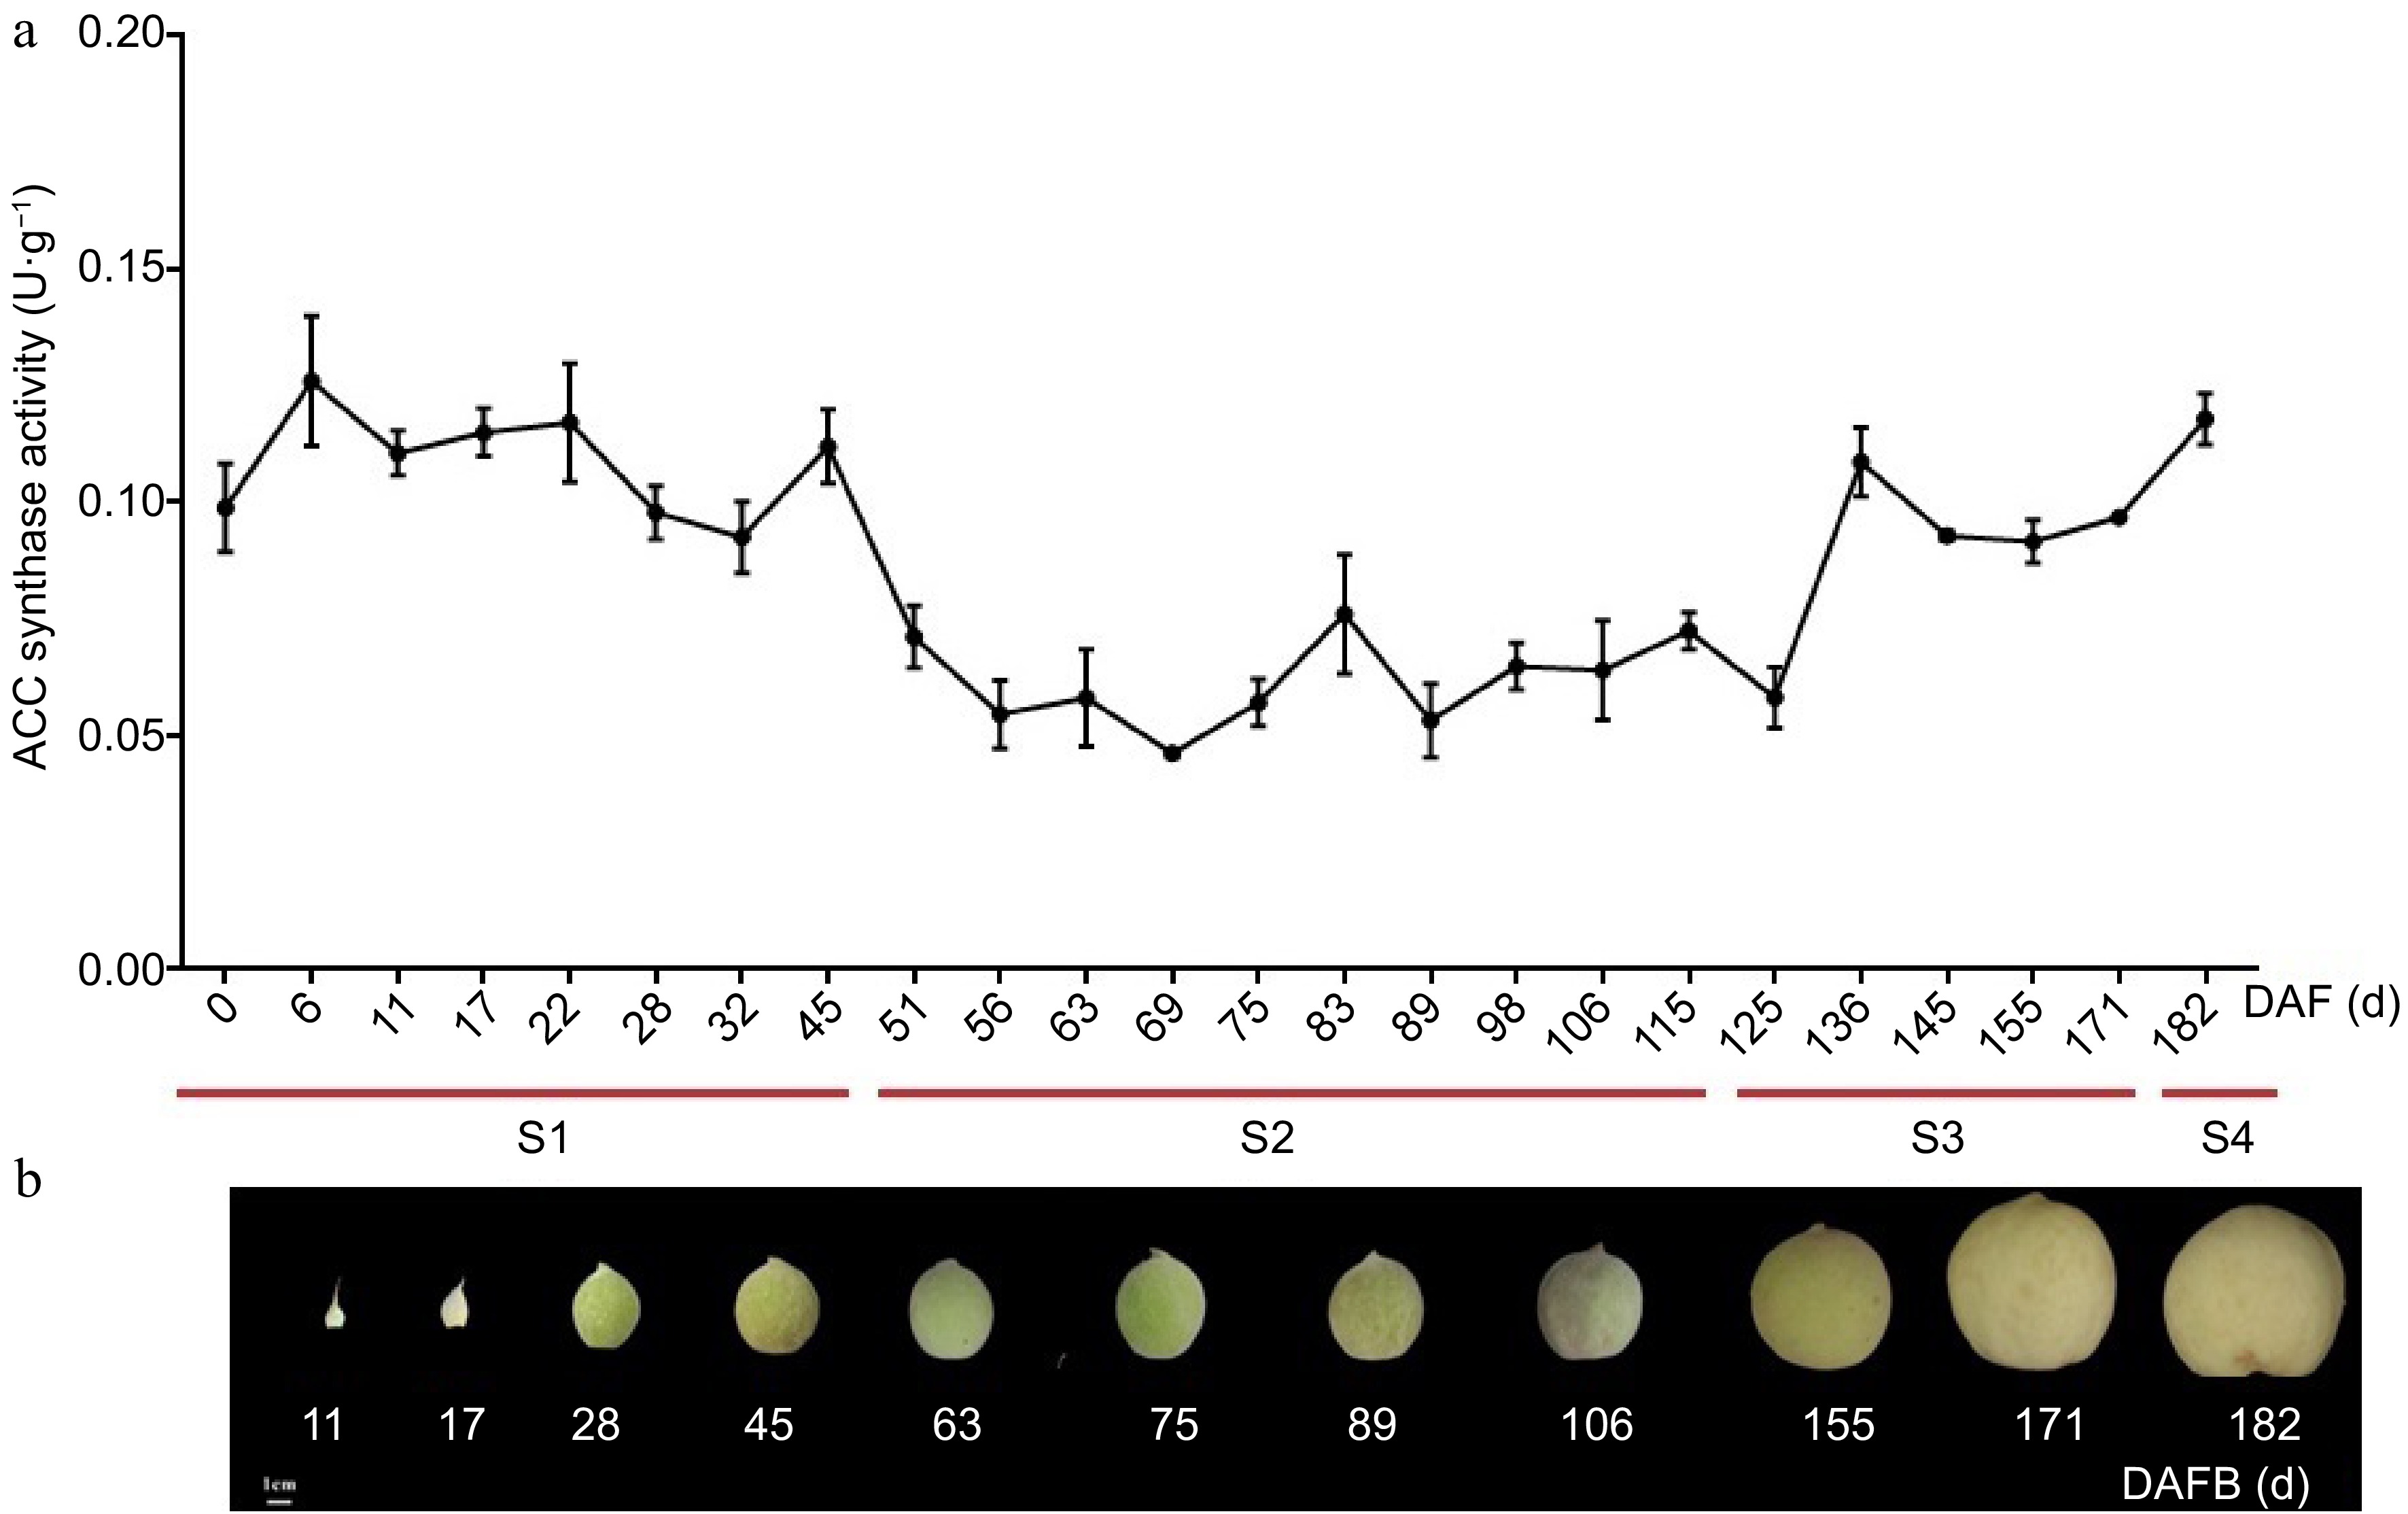
Figure 5.
Total ACC synthase activity at different stages of fruit development in peach. (a) Total ACC synthase activity in different stages of peach fruit development. The values are means ± SD of three independent biological replicates for ACC synthase activity. (b) Sampling time of peach fruit at different development stages, which was divided into four periods (S1, S2, S3 and S4 identified with red lines) according to the days after full bloom (DAFB).
-
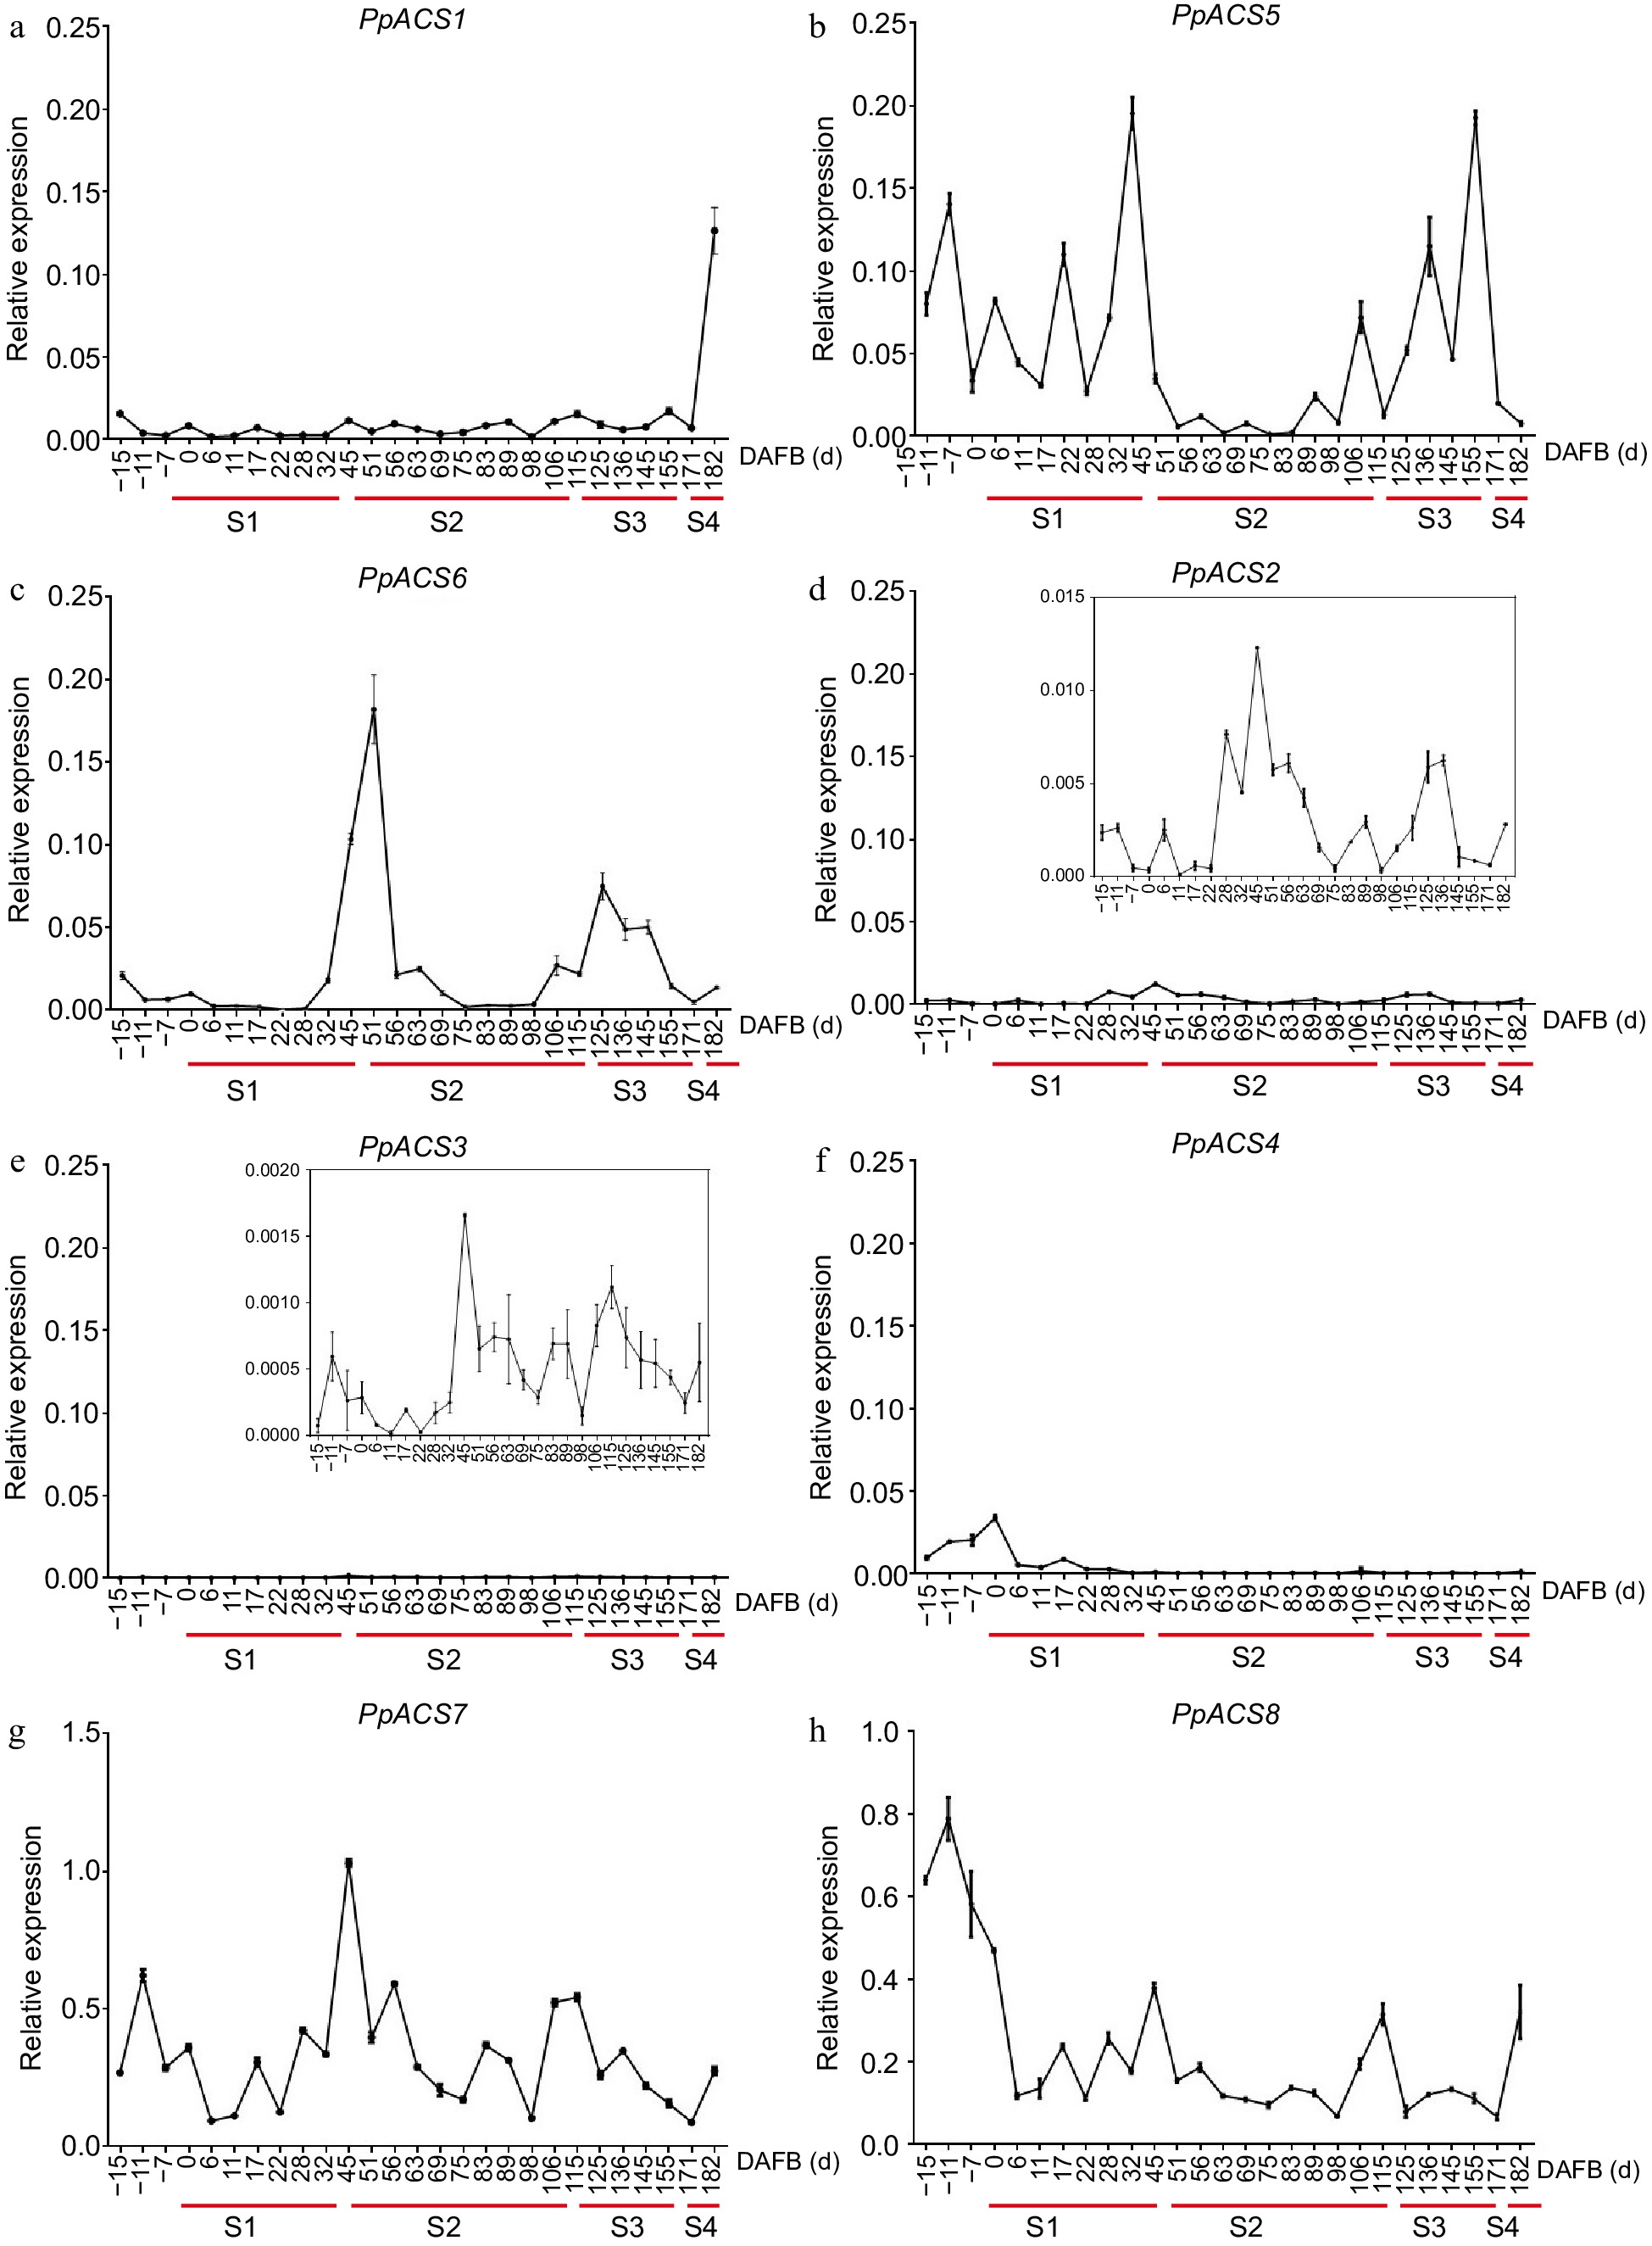
Figure 6.
Expression profiles of PpACS genes during fruit development of peach. The expression values are means ± SD of three independent biological replicates as analyzed by qRT-PCR. The fruit development stage was divided into four periods (S1, S2, S3 and S4; identified with red lines) according to the days after full bloom (DAFB). (a)−(h) show the expression profiles of PpACS1−PpACS8, respectively.
-

Figure 7.
Effect of ethylene and 1-MCP treatments on the expressions of PpACS genes. The expression values are means ± SD of three independent biological replicates as determined by qRTPCR. Fruits were treated with ethylene and 1-MCP and then, stored at room temperature until sampling at 2 and 4 d. *p < 0.05, **p < 0.01, ***p < 0.001 (Student's t-test).
Figures
(7)
Tables
(0)