ARTICLE   Open Access    

Genome-wide identification and expression pattern analysis of the ACS gene family during fruit development in peach

  • # Authors contributed equally: Langlang Zhang, Jiancan Feng

More Information
  • Received: 18 August 2023
    Revised: 21 September 2023
    Accepted: 23 October 2023
    Published online: 05 January 2024
    Fruit Research  4 Article number: e004 (2024)  |  Cite this article
  • Ethylene plays an important role in regulating the development and ripening of fruits, and 1-aminocyclopropane carboxylic acid synthase is the key rate-limiting enzyme in ethylene synthesis pathway. In this study, eight PpACS genes were identified from the peach genome [Prunus persica (L.) Batsch], and their phylogeny, gene structures, promoter motifs and expression patterns were analyzed. The PpACS genes could be divided into four types, and the genes with similar structures and motif distribution clustered together. Identification of the cis-elements in the promoters revealed that the PpACS genes may respond to various hormones. Furthermore, expression analysis showed that five (PpACS1, PpACS5, PpACS6, PpACS7 and PpACS8) of the eight PpACS genes were expressed at different stages during peach fruit development. Among them, PpACS1 was highly expressed at the ripening stage and induced by ethylene. The expression peaks of PpACS5, PpACS6, PpACS7 and PpACS8 during the transition from first exponential growth to pit hardening (S1 to S2) indicated a potential function of ethylene during this important transition. Taken together, these results provide valuable information for future investigation into the functions of the PpACS genes during peach fruit development and ripening.
  • Crops require a variety of nutrients for growth and nitrogen is particularly important. Nitrogen is the primary factor limiting plant growth and yield formation, and it also plays a significant role in improving product quality[14]. Nitrogen accounts for 1%−3% of the dry weight of plants and is a component of many compounds. For example, it is an important part of proteins, a component of nucleic acids, the skeleton of cell membranes, and a constituent of chlorophyll[5,6]. When the plant is deficient in nitrogen, the synthesis process of nitrogen-containing substances such as proteins decrease significantly, cell division and elongation are restricted, and chlorophyll content decreases, and this leads to short and thin plants, small leaves, and pale color[2,7,8]. If nitrogen in the plant is in excess, a large number of carbohydrates will be used for the synthesis of proteins, chlorophyll, and other substances, so that cells are large and thin-walled, and easy to be attacked by pests and diseases. At the same time, the mechanical tissues in the stem are not well developed and are prone to collapse[3,8,9]. Therefore, the development of new crop varieties with both high yields and improved nitrogen use efficiency (NUE) is an urgently needed goal for more sustainable agriculture with minimal nitrogen demand.

    Plants obtain inorganic nitrogen from the soil, mainly in the form of NH4+ and nitrate (NO3)[1013]. Nitrate uptake by plants occurs primarily in aerobic environments[3]. Transmembrane proteins are required for nitrate uptake from the external environment as well as for transport and translocation between cells, tissues, and organs. NITRATE TRANSPORTER PROTEIN 1 (NRT1)/PEPTIDE TRANSPORTER (PTR) family (NPF), NRT2, CHLORIDE CHANNEL (CLC) family, and SLOW ACTIVATING ANION CHANNEL are four protein families involved in nitrate transport[14]. One of the most studied of these is NRT1.1, which has multiple functions[14]. NRT1.1 is a major nitrate sensor, regulating many aspects of nitrate physiology and developmental responses, including regulating the expression levels of nitrate-related genes, modulating root architecture, and alleviating seed dormancy[1518].

    There is mounting evidence that plant growth and development are influenced by interactions across numerous phytohormone signaling pathways, including abscisic acid, gibberellins, growth hormones, and cytokinins[3,19,20]. To increase the effectiveness of plant nitrogen fertilizer application, it may be possible to tweak the signaling mediators or vary the content of certain phytohormones. Since the 1930s, research on the interplay between growth factors and N metabolism has also been conducted[3]. The Indole acetic acid (IAA) level of plant shoots is shown to decrease in early studies due to N shortage, although roots exhibit the reverse tendency[3,21]. In particular, low NO3 levels caused IAA buildup in the roots of Arabidopsis, Glycine max, Triticum aestivum, and Zea mays, indicating that IAA is crucial for conveying the effectiveness of exogenous nitrogen to the root growth response[20,22,23].

    Studies have shown that two families are required to control the expression of auxin-responsive genes: one is the Auxin Response Factor (ARF) and the other is the Aux/IAA repressor family[2426]. As the transcription factor, the ARF protein regulates the expression of auxin response genes by specifically binding to the TGTCNN auxin response element (AuxRE) in promoters of primary or early auxin response genes[27]. Among them, rice OsARF18, as a class of transcriptional repressor, has been involved in the field of nitrogen utilization and yield[23,28]. In rice (Oryza sativa), mutations in rice salt tolerant 1 (rst1), encoding the OsARF18 gene, lead to the loss of its transcriptional repressor activity and up-regulation of OsAS1 expression, which accelerates the assimilation of NH4+ to Asn and thus increases N utilization[28]. In addition, dao mutant plants deterred the conversion of IAA to OxIAA, thus high levels of IAA strongly activates OsARF18, which subsequently represses the expression of OsARF2 and OsSUT1 by directly binding to the AuxRE and SuRE promoter motifs, resulting in the inhibition of carbohydrate partitioning[23]. As a result, rice carrying the dao has low yields.

    Apples (Malus domestica) are used as a commercially important crop because of their high ecological adaptability, high nutritional value, and annual availability of fruit[29]. To ensure high apple yields, growers promote rapid early fruit yield growth by applying nitrogen. However, the over-application of nitrogen fertilizer to apples during cultivation also produces common diseases and the over-application of nitrogen fertilizer is not only a waste of resources but also harmful to the environment[29]. Therefore, it is of great significance to explore efficient nitrogen-regulated genes to understand the uptake and regulation of nitrogen fertilizer in apples, and to provide reasonable guidance for nitrogen application during apple production[30]. In this study, MdARF18 is identified which is a key transcription factor involved in nitrate uptake and transport in apples and MdARF18 reduces NO3 uptake and assimilation. Further analysis suggests that MdRF18 may inhibit the transcriptional level of MdNRT1.1 promoter by directly binding to its TGTCTT target, thus affecting normal plant growth.

    The protein sequence of apple MdARF18 (MD07G1152100) was obtained from The Apple Genome (https://iris.angers.inra.fr/gddh13/). Mutant of arf18 (GABI_699B09) sequence numbers were obtained from the official TAIR website (www.arabidopsis.org). The protein sequences of ARF18 from different species were obtained from the protein sequence of apple MdARF18 on the NCBI website. Using these data, a phylogenetic tree with reasonably close associations was constructed[31].

    Protein structural domain prediction of ARF18 was performed on the SMART website (https://smart.embl.de/). Motif analysis of ARF18 was performed by MEME (https://meme-suite.org/meme/tools/meme). Clustal was used to do multiple sequence comparisons. The first step was accessing the EBI web server through the Clustal Omega channel. The visualization of the results was altered using Jalview, which may be downloaded from www.jalview.org/download.[32]

    The apple 'Orin' callus was transplanted on MS medium containing 1.5 mg·L−1 6-benzylaminopurine (6-BA) and 0.5 mg·L−1 2,4 dichlorophenoxyacetic acid (2,4-D) at 25 °C, in the dark, at 21-d intervals. 'Royal Gala' apple cultivars were cultured in vermiculite and transplanted at 25 °C every 30 d. The Arabidopsis plants used were of the Columbia (Col-0) wild-type variety. Sowing and germinating Arabidopsis seeds on MS nutrient medium, and Arabidopsis seeds were incubated and grown at 25 °C (light/dark cycle of 16 h/8 h)[33].

    The nutrient solution in the base contained 1.0 mM CaCl2, 1.0 mM KH2PO4, 1.0 mM MgSO4, 0.1 mM FeSO4·7H2O 0.1 mM Na2EDTA·2H2O, 50 μM MnSO4·H2O, 50 μM H3BO3, 0.05 μM CuSO4·5H2O, 0.5 μM Na2MoO4·2H2O, 15 μM ZnSO4·7H2O, 2.5 μM KI, and 0.05 μM CoCl·6H2O, and 0.05 μM CoCl·6H2O, and 0.05 μM CoCl· 6H2O. 2H2O, 15 μM ZnSO4·7H2O, 2.5 μM KI and 0.05 μM CoCl·6H2O, and 0.05 μM CoCl·6H2O, supplemented with 0.5 mM, 2 mM, and 10 mM KNO3 as the sole nitrogen source, and added with the relevant concentrations of KCl to maintain the same K concentration[33,34].

    For auxin treatment, 12 uniformly growing apple tissue-cultured seedlings (Malus domestica 'Royal Gala') were selected from each of the control and treatment groups, apple seedlings were incubated in a nutrient solution containing 1.5 mg·L−1 6-BA, 0.2 mg·L−1 naphthalene acetic acid, and IAA (10 μM) for 50 d, and then the physiological data were determined. Apple seedlings were incubated and grown at 25 °C (light/dark cycle of 16 h/8 h).

    For nitrate treatment, Arabidopsis seedlings were transferred into an MS medium (containing different concentrations of KNO3) as soon as they germinated to test root development. Seven-day-old Arabidopsis were transplanted into vermiculite and then treated with a nutrient solution containing different concentrations of KNO3 (0.5, 2, 10 mM) and watered at 10-d intervals. Apple calli were treated with medium containing 1.5 mg·L−1 6-BA, 0.5 mg·L−1 2,4-D, and varying doses of KNO3 (0.5, 2, and 10 mM) for 25 d, and samples were examined for relevant physiological data. Apple calli were subjected to the same treatment for 1 d for GUS staining[35].

    To obtain MdARF18 overexpression materials, the open reading frame (ORF) of MdARF18 was introduced into the pRI-101 vector. To obtain pMdNRT1.1 material, the 2 kb segment located before the transcription start site of MdNRT1.1 was inserted into the pCAMBIA1300 vector. The Agrobacterium tumefaciens LBA4404 strain was cultivated in lysozyme broth (LB) medium supplemented with 50 mg·L−1 kanamycin and 50 mg·L−1 rifampicin. The MdARF18 overexpression vector and the ProMdNRT1.1::GUS vector were introduced into Arabidopsis and apple callus using the flower dip transformation procedure. The third-generation homozygous transgenic Arabidopsis (T3) and transgenic calli were obtained[36]. Information on the relevant primers designed is shown in Supplemental Table S1.

    Plant DNA and RNA were obtained using the Genomic DNA Kit and the Omni Plant RNA Kit (tDNase I) (Tiangen, Beijing, China)[37].

    cDNA was synthesized for qPCR by using the PrimeScript First Strand cDNA Synthesis Kit (Takara, Dalian, China). The cDNA for qPCR was synthesized by using the PrimeScript First Strand cDNA Synthesis Kit (Takara, Dalian, China). Quantitative real-time fluorescence analysis was performed by using the UltraSYBR Mixture (Low Rox) kit (ComWin Biotech Co. Ltd., Beijing, China). qRT-PCR experiments were performed using the 2−ΔΔCᴛ method for data analysis. The data were analyzed by the 2−ΔΔCᴛ method[31].

    GUS staining buffer contained 1 mM 5-bromo-4-chloro-3-indolyl-β-glutamic acid, 0.01 mM EDTA, 0.5 mM hydrogen ferrocyanide, 100 mM sodium phosphate (pH 7.0), and 0.1% (v/v) Triton X-100 was maintained at 37 °C in the dark. The pMdNRT1.1::GUS construct was transiently introduced into apple calli. To confirm whether MdNRT1.1 is activated or inhibited by MdARF18, we co-transformed 35S::MdARF18 into pMdNRT1.1::GUS is calling. The activity of transgenic calli was assessed using GUS labeling and activity assays[33,38].

    The specimens were crushed into fine particles, combined with 1 mL of ddH2O, and thereafter subjected to a temperature of 100 °C for 30 min. The supernatant was collected in a flow cell after centrifugation at 12,000 revolutions per minute for 10 min. The AutoAnalyzer 3 continuous flow analyzer was utilized to measure nitrate concentrations. (SEAL analytical, Mequon, WI, USA). Nitrate reductase (NR) activity was characterized by the corresponding kits (Solarbio Life Science, Beijing, China) using a spectrophotometric method[31].

    Y1H assays were performed as previously described by Liu et al.[39]. The coding sequence of MdARF18 was integrated into the pGADT7 expression vector, whereas the promoter region of MdNRT1.1 was included in the pHIS2 reporter vector. Subsequently, the constitutive vectors were co-transformed into the yeast monohybrid strain Y187. The individual transformants were assessed on a medium lacking tryptophan, leucine, and histidine (SDT/-L/-H). Subsequently, the positive yeast cells were identified using polymerase chain reaction (PCR). The yeast strain cells were diluted at dilution factors of 10, 100, 1,000, and 10,000. Ten μL of various doses were added to selective medium (SD-T/-L/-H) containing 120 mM 3-aminotriazole (3-AT) and incubated at 28 °C for 2−3 d[37].

    Dual-luciferase assays were performed as described previously[40]. Full-length MdARF18 was cloned into pGreenII 62-SK to produce MdARF18-62-SK. The promoter fragment of MdNRT1.1 was cloned into pGreenII 0800-LUC to produce pMdNRT1.1-LUC. Different combinations were transformed into Agrobacterium tumefaciens LBA4404 and the Agrobacterium solution was injected onto the underside of the leaves of tobacco (Nicotiana benthamiana) leaves abaxially. The Dual Luciferase Reporter Kit (Promega, www.promega.com) was used to detect fluorescence activity.

    Total protein was extracted from wild-type and transgenic apple calli with or without 100 μM MG132 treatment. The purified MdARF18-HIS fusion protein was incubated with total protein[41]. Samples were collected at the indicated times (0, 1, 3, 5, and 7 h).

    Protein gel blots were analyzed using GST antibody. ACTIN antibody was used as an internal reference. All antibodies used in this study were provided by Abmart (www.ab-mart.com).

    Unless otherwise noted, every experiment was carried out independently in triplicate. A one-way analysis of variance (ANOVA) was used to establish the statistical significance of all data, and Duncan's test was used to compare results at the p < 0.05 level[31].

    To investigate whether auxin affects the effective uptake of nitrate in apple, we first externally applied IAA under normal N (5 mM NO3) environment, and this result showed that the growth of Gala apple seedlings in the IAA-treated group were better than the control, and their fresh weights were heavier than the control group (Fig. 1a, d). The N-related physiological indexes of apple seedlings also showed that the nitrate content and NR activity of the root part of the IAA-treated group were significantly higher than the control group, while the nitrate content and NR activity of the shoot part were lower than the control group (Fig. 1b, c). These results demonstrate that auxin could promote the uptake of nitrate and thus promotes growth of plants.

    Figure 1.  Auxin enhances nitrate uptake of Gala seedlings. (a) Phenotypes of apple (Malus domestica 'Royal Gala') seedlings grown nutritionally for 50 d under IAA (10 μM) treatment. (b) Nitrate content of shoot and root apple (Malus domestica 'Royal Gala') seedlings treated with IAA. (c) NR activity in shoot and root of IAA treatment apple (Malus domestica 'Royal Gala') seedlings. (d) Seedling fresh weight under IAA treatment. Bars represent the mean ± SD (n = 3). Different letters above the bars indicate significant differences using the LSD test (p < 0.05).

    To test whether auxin affects the expression of genes related to nitrogen uptake and metabolism. For the root, the expression levels of MdNRT1.1, MdNRT2.1, MdNIA1, MdNIA2, and MdNIR were higher than control group (Supplemental Fig. S1a, f, hj), while the expression levels of MdNRT1.2, MdNRT1.6 and MdNRT2.5 were lower than control group significantly (Supplemental Fig. S1b, d, g). For the shoot, the expression of MdNRT1.1, MdNRT1.5, MdNRT1.6, MdNRT1.7, MdNRT2.1, MdNRT2.5, MdNIA1, MdNIA2, and MdNIR genes were significantly down-regulated (Supplemental Fig. S1a, cj). This result infers that the application of auxin could mediate nitrate uptake in plants by affecting the expression levels of relevant nitrate uptake and assimilation genes.

    Since the auxin signaling pathway requires the regulation of the auxin response factors (ARFs)[25,27], it was investigated whether members of ARF genes were nitrate responsive. Firstly, qPCR quantitative analysis showed that the five subfamily genes of MdARFs (MdARF9, MdARF2, MdARF12, MdARF3, and MdARF18) were expressed at different levels in various organs of the plant (Supplemental Fig. S2). Afterward, the expression levels of five ARF genes were analyzed under different concentrations of nitrate treatment (Fig. 2), and it was concluded that these genes represented by each subfamily responded in different degrees, but the expression level of MdARF18 was up-regulated regardless of low or high nitrogen (Fig. 2i, j), and the expression level of MdARF18 showed a trend of stable up-regulation under IAA treatment (Supplemental Fig. S3). The result demonstrates that MdARFs could affect the uptake of external nitrate by plants and MdARF18 may play an important role in the regulation of nitrate uptake.

    Figure 2.  Relative expression analysis of MdARFs subfamilies in response to different concentrations of nitrate. Expression analysis of representative genes from five subfamilies of MdARF transcription factors. Bars represent the mean ± SD (n = 3). Different letters above the bars indicate significant differences using the LSD test (p < 0.05).

    MdARF18 (MD07G1152100) was predicted through The Apple Genome website (https://iris.angers.inra.fr/gddh13/) and it had high fitness with AtARF18 (AT3G61830). The homologs of ARF18 from 15 species were then identified in NCBI (www.ncbi.nlm.nih.gov) and then constructed an evolutionary tree (Supplemental Fig. S4). The data indicates that MdARF18 was most closely genetically related to MbARF18 (Malus baccata), indicating that they diverged recently in evolution (Supplemental Fig. S4). Conserved structural domain analyses indicated that all 15 ARF18 proteins had highly similar conserved structural domains (Supplemental Fig. S5). In addition, multiple sequence alignment analysis showed that all 15 ARF18 genes have B3-type DNA-binding domains (Supplemental Fig. S6), which is in accordance with the previous reports on ARF18 protein structure[26].

    To explore whether MdARF18 could affect the development of the plant's root system. Firstly, MdARF18 was heterologously expressed into Arabidopsis, and an arf18 mutant (GABI_699B09) Arabidopsis was also obtained (Supplemental Fig. S7). Seven-day-old MdARF18 transgenic Arabidopsis and arf18 mutants were treated in a medium with different nitrate concentrations for 10 d (Fig. 3a, b). After observing results, it was found that under the environment of high nitrate concentration, the primary root of MdARF18 was shorter than arf18 and wild type (Fig. 3c), and the primary root length of arf18 is the longest (Fig. 3c), while there was no significant difference in the lateral root (Fig. 3d). For low nitrate concentration, there was no significant difference in the length of the primary root, and the number of lateral roots of MdARF18 was slightly more than wild type and arf18 mutant. These results suggest that MdARF18 affects root development in plants. However, in general, low nitrate concentrations could promote the transport of IAA by NRT1.1 and thus inhibit lateral root production[3], so it might be hypothesized that MdARF18 would have some effect on MdNRT1.1 thus leading to the disruption of lateral root development.

    Figure 3.  MdARF18 inhibits root development. (a) MdARF18 inhibits root length at 10 mM nitrate concentration. (b) MdARF18 promotes lateral root growth at 0.5 mM nitrate concentration. (c) Primary root length statistics. (d) Lateral root number statistics. Bars represent the mean ± SD (n = 3). Different letters above the bars indicate significant differences using the LSD test (p < 0.05).

    To investigate whether MdARF18 affects the growth of individual plants under different concentrations of nitrate, 7-day-old overexpression MdARF18, and arf18 mutants were planted in the soil and incubated for 20 d. It was found that arf18 had the best growth of shoot, while MdARF18 had the weakest shoot growth at any nitrate concentration (Fig. 4a). MdARF18 had the lightest fresh weight and the arf18 mutant had the heaviest fresh weight (Fig. 4b). N-related physiological indexes revealed that the nitrate content and NR activity of arf18 were significantly higher than wild type, whereas MdARF18 materials were lower than wild type (Fig. 4c, d). More detail, MdARF18 had the lightest fresh weight under low and normal nitrate, while the arf18 mutant had the heaviest fresh weight, and the fresh weight of arf18 under high nitrate concentration did not differ much from the wild type (Fig. 4b). Nitrogen-related physiological indexes showed that the nitrate content of arf18 was significantly higher than wild type, while MdARF18 was lower than wild type. The NR activity of arf18 under high nitrate did not differ much from the wild type, but the NR activity of MdARF18 was the lowest in any treatment (Fig. 4c, d). These results indicate that MdARF18 significantly inhibits plant growth by inhibiting plants to absorb nitrate, and is particularly pronounced at high nitrate concentrations.

    Figure 4.  Ectopic expression of MdARF18 inhibits Arabidopsis growth. (a) Status of Arabidopsis growth after one month of incubation at different nitrate concentrations. (b) Fresh weight of Arabidopsis. (c) Nitrate content of Arabidopsis. (d) NR activity in Arabidopsis. Bars represent the mean ± SD (n = 3). Different letters above the bars indicate significant differences using the LSD test (p < 0.05).

    In addition, to further validate this conclusion, MdARF18 overexpression calli were obtained and treated with different concentrations of nitrate (Supplemental Fig. S8). The results show that the growth of overexpressed MdARF18 was weaker than wild type in both treatments (Supplemental Fig. S9a). The fresh weight of MdARF18 was significantly lighter than wild type (Supplemental Fig. S9b), and its nitrate and NR activity were lower than wild type (Supplemental Fig. S9c, d), which was consistent with the above results (Fig. 4). This result further confirms that MdARF18 could inhibit the development of individual plants by inhibiting the uptake of nitrate.

    Nitrate acts as a signaling molecule that takes up nitrate by activating the NRT family as well as NIAs and NIR[3,34]. To further investigate the pathway by which MdARF18 inhibits plant growth and reduces nitrate content, qRT-PCR was performed on the above plant materials treated with different concentrations of nitrate (Fig. 5). The result shows that the expression levels of AtNRT1.1, AtNIA1, AtNIA2, and AtNIR were all down-regulated in overexpression of MdARF18, and up-regulated in the arf18 mutant (Fig. 5a, hj). There was no significant change in AtNRT1.2 at normal nitrate levels, but AtNRT1.2 expression levels were down-regulated in MdARF18 and up-regulated in arf18 at both high and low nitrate levels (Fig. 5b). This trend in the expression levels of these genes might be consistent with the fact that MdARF18 inhibits the expression of nitrogen-related genes and restricts plant growth. The trend in the expression levels of these genes is consistent with MdARF18 restricting plant growth by inhibiting the expression of nitrogen-related genes. However, AtNRT1.5, AtNRT1.6, AtNRT1.7, AtNRT2.1, and AtNRT2.5 did not show suppressed expression levels in MdARF18 (Fig. 5cg). These results suggest that MdARF18 inhibits nitrate uptake and plant growth by repressing some of the genes for nitrate uptake or assimilation.

    Figure 5.  qPCR-RT analysis of N-related genes. Expression analysis of N-related genes in MdARF18 transgenic Arabidopsis at different nitrate concentrations. Bars represent the mean ± SD (n = 3). Different letters above the bars indicate significant differences using the LSD test (p < 0.05).

    In addition, to test whether different concentrations of nitrate affect the protein stability of MdARF18. However, it was found that there was no significant difference in the protein stability of MdARF18 at different concentrations of nitrate (Supplemental Fig. S10). This result suggests that nitrate does not affect the degradation of MdARF18 protein.

    To further verify whether MdARF18 can directly bind N-related genes, firstly we found that the MdNRT1.1 promoter contains binding sites to ARF factors (Fig. 6a). The yeast one-hybrid research demonstrated an interaction between MdARF18 and the MdNRT1.1 promoter, as shown in Fig. 6b. Yeast cells that were simultaneously transformed with MdNRT1.1-P-pHIS and pGADT7 were unable to grow in selected SD medium. However, cells that were transformed with MdNRT1.1-P-pHIS and MdARF18-pGADT7 grew successfully in the selective medium. The result therefore hypothesizes that MdARF18 could bind specifically to MdNRT1.1 promoter to regulate nitrate uptake in plants.

    Figure 6.  MdARF18 binds directly to the promoter of MdNRT1.1. (a) Schematic representation of MdNRT1.1 promoter. (b) Y1H assay of MdARF18 bound to the MdNRT1.1 promoter in vitro. 10−1, 10−2, 10−3, and 10−4 indicate that the yeast concentration was diluted 10, 100, 1,000, and 10,000 times, respectively. 3-AT stands for 3-Amino-1,2,4-triazole. (c) Dual luciferase assays demonstrate the binding of MdARF18 with MdNRT1.1 promoter. The horizontal bar on the left side of the right indicates the captured signal intensity. Empty LUC and 35S vectors were used as controls. Representative images of three independent experiments are shown here.

    To identify the inhibition or activation of MdNRT1.1 by MdARF18, we analyzed their connections by Dual luciferase assays (Fig. 6c), and also analyzed the fluorescence intensity (Supplemental Fig. S11). It was concluded that the fluorescence signals of cells carrying 35Spro and MdNRT1.1pro::LUC were stronger, but the mixture of 35Spro::MdARF18 and MdNRT1.1pro::LUC injected with fluorescence signal intensity was significantly weakened. Next, we transiently transformed the 35S::MdARF18 into pMdNRT1.1::GUS transgenic calli (Fig. 7). GUS results first showed that the color depth of pMdNRT1.1::GUS and 35S::MdARF18 were significantly lighter than pMdnNRT1.1::GUS alone (Fig. 7a). GUS enzyme activity, as well as GUS expression, also indicated that the calli containing pMdnNRT1.1::GUS alone had a stronger GUS activity (Fig. 7b, c). In addition, the GUS activity of calli containing both pMdNRT1.1:GUS and 35S::MdARF18 were further attenuated under both high and low nitrate concentrations (Fig. 7a). These results suggest that MdARF18 represses MdNRT1.1 expression by directly binding to the MdNRT1.1 promoter region.

    Figure 7.  MdARF18 inhibits the expression of MdNRT1.1. (a) GUS staining experiment of pMdNRT1.1::GUS transgenic calli and transgenic calli containing both pMdNRT1.1::GUS and 35S::MdARF18 with different nitrate treatments. (b) GUS activity assays in MdARF18 overexpressing calli with different nitrate treatments. (c) GUS expression level in MdARF18 overexpressing calli with different nitrate treatments. Bars represent the mean ± SD (n = 3). Different numbers of asterisk above the bars indicate significant differences using the LSD test (*p < 0.05 and **p< 0.01).

    Plants replenish their nutrients by absorbing nitrates from the soil[42,43]. Previous studies have shown that some of the plant hormones such as IAA, GA, and ABA interact with nitrate[25,4445]. The effect of nitrate on the content and transport of IAA has been reported in previous studies, e.g., nitrate supply reduced IAA content in Arabidopsis, wheat, and maize roots and inhibited the transport of IAA from shoot to root[20,21]. In this study, it was found that auxin treatment promoted individual fresh weight gain and growth (Fig. 1a, b). Nitrate content and NR activity were also significantly higher in their root parts (Fig. 1c, d) and also affected the transcript expression levels of related nitrate uptake and assimilation genes (Supplemental Fig. S1). Possibly because IAA can affect plant growth by influencing the uptake of external nitrates by the plant.

    ARFs are key transcription factors to regulate auxin signaling[4649]. We identified five representative genes of the apple MdARFs subfamily and they all had different expression patterns (Supplemental Fig. S2). The transcript levels of each gene were found to be affected to different degrees under different concentrations of nitrate, but the expression level of MdARF18 was up-regulated under both low and high nitrate conditions (Fig. 2). The transcript level of MdARF18 was also activated under IAA treatment (Supplemental Fig. S3), so MdARF18 began to be used in the study of the mechanism of nitrate uptake in plants. In this study, an Arabidopsis AtARF18 homolog was successfully cloned and named MdARF18 (Supplemental Figs S4, S5). It contains a B3-type DNA-binding structural domain consistent with previous studies of ARFs (Supplemental Fig. S6), and arf18 mutants were also obtained and their transcript levels were examined (Supplemental Fig. S7).

    Plants rely on rapid modification of the root system to efficiently access effective nitrogen resources in the soil for growth and survival. The plasticity of root development is an effective strategy for accessing nitrate, and appropriate concentrations of IAA can promote the development of lateral roots[7,44]. The present study found that the length of the primary root was shortened and the number of lateral roots did increase in IAA-treated Gl3 apple seedlings (Supplemental Fig. S12). Generally, an environment with low concentrations of nitrate promotes the transport of IAA by AtNRT1.1, which inhibits the growth of lateral roots[14]. However, in the research of MdARF18 transgenic Arabidopsis, it was found that the lateral roots of MdARF18-OX increased under low concentrations of nitrate, but there was no significant change in the mutant arf18 (Fig. 3). Therefore, it was hypothesized that MdARF18 might repress the expression of the MdNRT1.1 gene or other related genes that can regulate root plasticity, thereby affecting nitrate uptake in plants.

    In rice, several researchers have demonstrated that OsARF18 significantly regulates nitrogen utilization. Loss of function of the Rice Salt Tolerant 1 (RST1) gene (encoding OsARF18) removes its ability to transcriptionally repress OsAS1, accelerating the assimilation of NH4+ to Asn and thereby increasing nitrogen utilization[28]. During soil incubation of MdARF18-OX Arabidopsis, it was found that leaving aside the effect of differences in nitrate concentration, the arf18 mutant grew significantly better than MdARF18-OX and had higher levels of nitrate and NR activity in arf18 than in MdARF18-OX. This demonstrates that MdARF18 may act as a repressor of nitrate uptake and assimilation, thereby inhibiting normal plant development (Fig. 4). Interestingly, an adequate nitrogen environment promotes plant growth, but MdARF18-OX Arabidopsis growth and all physiological indexes were poorer under high nitrate concentration than MdARF18-OX at other concentrations. We hypothesize that MdARF18 may be activated more intensively at high nitrate concentrations, or that MdARF18 suppresses the expression levels of genes for nitrate uptake or assimilation (genes that may play a stronger role at high nitrate concentrations), thereby inhibiting plant growth. In addition, we obtained MdARF18 transgenic calli (Supplemental Fig. S8) and subjected them to high and low concentrations of nitrate, and also found that MdARF18 inhibited the growth of individuals at both concentrations (Supplemental Fig. S9). This further confirms that MdARF18 inhibits nitrate uptake in individuals.

    ARF family transcription factors play a key role in transmitting auxin signals to alter plant growth and development, e.g. osarf1 and osarf24 mutants have reduced levels of OsNRT1.1B, OsNRT2.3a and OsNIA2 transcripts[22]. Therefore, further studies are needed to determine whether MdARF18 activates nitrate uptake through different molecular mechanisms. The result revealed that the transcript levels of AtNRT1.1, AtNIA1, AtNIA2, and AtNIR in MdARF18-OX were consistent with the developmental pattern of impaired plant growth (Fig. 5). Unfortunately, we attempted to explore whether variability in nitrate concentration affects MdARF18 to differ at the protein level, but the two did not appear to differ significantly (Supplemental Fig. S10).

    ARF transcription factors act as trans-activators/repressors of N metabolism-related genes by directly binding to TGTCNN/NNGACA-containing fragments in the promoter regions of downstream target genes[27,50]. The NRT family plays important roles in nitrate uptake, transport, and storage, and NRT1.1 is an important dual-affinity nitrate transporter protein[7,5052], and nitrogen utilization is very important for apple growth[53,54]. We identified binding sites in the promoters of these N-related genes that are compatible with ARF factors, and MdARF18 was found to bind to MdNRT1.1 promoter by yeast one-hybrid technique (Fig. 6a, b). It was also verified by Dual luciferase assays that MdARF18 could act as a transcriptional repressor that inhibited the expression of the downstream gene MdNRT1.1 (Fig. 6c), which inhibited the uptake of nitrate in plants. In addition, the GUS assay was synchronized to verify that transiently expressed pMdNRT1.1::GUS calli with 35S::MdARF18 showed a lighter staining depth and a significant decrease in GUS transcript level and enzyme activity (Fig. 7). This phenomenon was particularly pronounced at high concentrations of nitrate. These results suggest that MdARF18 may directly bind to the MdNRT1.1 promoter and inhibit its expression, thereby suppressing NO3 metabolism and decreasing the efficiency of nitrate uptake more significantly under high nitrate concentrations.

    In conclusion, in this study, we found that MdARF18 responds to nitrate and could directly bind to the TGTCTT site of the MdNRT1.1 promoter to repress its expression. Our findings provide new insights into the molecular mechanisms by which MdARF18 regulates nitrate transport in apple.

    The authors confirm contribution to the paper as follows: study conception and design: Liu GD; data collection: Liu GD, Rui L, Liu RX; analysis and interpretation of results: Liu GD, Li HL, An XH; draft manuscript preparation: Liu GD; supervision: Zhang S, Zhang ZL; funding acquisition: You CX, Wang XF; All authors reviewed the results and approved the final version of the manuscript.

    Data sharing not applicable to this article as no datasets were generated or analyzed during the current study.

    This work was supported by the National Natural Science Foundation of China (32272683), the Shandong Province Key R&D Program of China (2022TZXD008-02), the China Agriculture Research System of MOF and MARA (CARS-27), the National Key Research and Development Program of China (2022YFD1201700), and the National Natural Science Foundation of China (NSFC) (32172538).

  • The authors declare that they have no conflict of interest.

  • Supplemental Table S1 The Primer sequences of genes.
    Supplemental Table S2 Molecular characteristics of PpACS genes in peach.
    Supplemental Table S3 Classification statistics of PpACSs promoter cis-elements.
    Supplemental Fig. S1 Expression profiles of PpACS genes in different tissues.
  • [1]

    Lin Z, Zhong S, Grierson D. 2009. Recent advances in ethylene research. Journal of Experimental Botany 60:3311−36

    doi: 10.1093/jxb/erp204

    CrossRef   Google Scholar

    [2]

    Barry CS, Giovannoni JJ. 2007. Ethylene and fruit ripening. Journal of Plant Growth Regulation 26:143−59

    doi: 10.1007/s00344-007-9002-y

    CrossRef   Google Scholar

    [3]

    Kumar R, Khurana A, Sharma AK. 2014. Role of plant hormones and their interplay in development and ripening of fleshy fruits. Journal of Experimental Botany 65:4561−75

    doi: 10.1093/jxb/eru277

    CrossRef   Google Scholar

    [4]

    Alexander L, Grierson D. 2002. Ethylene biosynthesis and action in tomato: a model for climacteric fruit ripening. Journal of Experimental Botany 53:2039−55

    doi: 10.1093/jxb/erf072

    CrossRef   Google Scholar

    [5]

    Klee HJ, Giovannoni JJ. 2011. Genetics and control of tomato fruit ripening and quality attributes. Annual Review of Genetics 45:41−59

    doi: 10.1146/annurev-genet-110410-132507

    CrossRef   Google Scholar

    [6]

    Shinozaki Y, Hao S, Kojima M, Sakakibara H, Ozeki-Iida Y, et al. 2015. Ethylene suppresses tomato (Solanum lycopersicum) fruit set through modification of gibberellin metabolism. The Plant Journal 83:237−51

    doi: 10.1111/tpj.12882

    CrossRef   Google Scholar

    [7]

    Martínez C, Manzano S, Megías Z, Garrido D, Picó B, et al. 2013. Involvement of ethylene biosynthesis and signalling in fruit set and early fruit development in zucchini squash (Cucurbita pepo L.). BMC Plant Biology 13:139

    doi: 10.1186/1471-2229-13-139

    CrossRef   Google Scholar

    [8]

    Dussi MC, Sosa D, Calvo GS. 2002. Effects of RetainTM on fruit maturity and fruit set of pear cultivars Williams and Packham¿s Triumph. Acta Horticulturae 596:767−71

    doi: 10.17660/actahortic.2002.596.132

    CrossRef   Google Scholar

    [9]

    Adams DO, Yang SF. 1979. Ethylene biosynthesis: Identification of 1-aminocyclopropane-1-carboxylic acid as an intermediate in the conversion of methionine to ethylene. Proceedings of the National Academy of Sciences of the United States of America 76:170−74

    doi: 10.1073/pnas.76.1.170

    CrossRef   Google Scholar

    [10]

    Boller T, Herner RC, Kende H. 1979. Assay for and enzymatic formation of an ethylene precursor, 1-aminocyclopropane-1-carboxylic acid. Planta 145:293−303

    doi: 10.1007/BF00454455

    CrossRef   Google Scholar

    [11]

    Kende H. 1993. Ethylene biosynthesis. Annual Review of Plant Physiology and Plant Molecular Biology 44:283−307

    doi: 10.1146/annurev.pp.44.060193.001435

    CrossRef   Google Scholar

    [12]

    Yamagami T, Tsuchisaka A, Yamada K, Haddon WF, Harden LA, et al. 2003. Biochemical diversity among the 1-amino-cyclopropane-1-carboxylate synthase isozymes encoded by the Arabidopsis gene family. Journal of Biological Chemistry 278:49102−12

    doi: 10.1074/jbc.M308297200

    CrossRef   Google Scholar

    [13]

    Tsuchisaka A, Theologis A. 2004. Heterodimeric interactions among the 1-amino-cyclopropane-1-carboxylate synthase polypeptides encoded by the Arabidopsis gene family. Proceedings of the National Academy of Sciences of the United States of America 101:2275−80

    doi: 10.1073/pnas.0308515101

    CrossRef   Google Scholar

    [14]

    Nakatsuka A, Murachi S, Okunishi H, Shiomi S, Nakano R, et al. 1998. Differential expression and internal feedback regulation of 1-aminocyclopropane-1-carboxylate synthase, 1-aminocyclopropane-1-carboxylate oxidase, and ethylene receptor genes in tomato fruit during development and ripening. Plant Physiology 118:1295−305

    doi: 10.1104/pp.118.4.1295

    CrossRef   Google Scholar

    [15]

    Barry CS, Llop-Tous MI, Grierson D. 2000. The regulation of 1-aminocyclopropane-1-carboxylic acid synthase gene expression during the transition from system-1 to system-2 ethylene synthesis in tomato. Plant Physiology 123:979−86

    doi: 10.1104/pp.123.3.979

    CrossRef   Google Scholar

    [16]

    Li T, Tan D, Yang X, Wang A. 2013. Exploring the apple genome reveals six ACC synthase genes expressed during fruit ripening. Scientia Horticulturae 157:119−23

    doi: 10.1016/j.scienta.2013.04.016

    CrossRef   Google Scholar

    [17]

    Tan D, Li T, Wang A. 2013. Apple 1-aminocyclopropane-1-carboxylic acid synthase genes, MdACS1 and MdACS3a, are expressed in different systems of ethylene biosynthesis. Plant Molecular Biology Reporter 31:204−9

    doi: 10.1007/s11105-012-0490-y

    CrossRef   Google Scholar

    [18]

    Lelièvre JM, Latchè A, Jones B, Bouzayen M, Pech JC. 1997. Ethylene and fruit ripening. Physiologia Plantarum 101:727−39

    doi: 10.1111/j.1399-3054.1997.tb01057.x

    CrossRef   Google Scholar

    [19]

    Ji Y, Wang A. 2021. Recent advances in phytohormone regulation of apple fruit ripening. Plants 10:2061

    doi: 10.3390/plants10102061

    CrossRef   Google Scholar

    [20]

    Zeng W, Pan L, Liu H, Niu L, Lu Z, et al. 2015. Characterization of 1-aminocyclopropane-1-carboxylic acid synthase (ACS) genes during nectarine fruit development and ripening. Tree Genetics & Genomes 11:18

    doi: 10.1007/s11295-015-0833-6

    CrossRef   Google Scholar

    [21]

    Tatsuki M, Haji T, Yamaguchi M. 2006. The involvement of 1-aminocyclopropane-1-carboxylic acid synthase isogene, Pp-ACS1, in peach fruit softening. Journal of Experimental Botany 57:1281−89

    doi: 10.1093/jxb/erj097

    CrossRef   Google Scholar

    [22]

    Cheng X, Cui Z, Jiang Y, Chen Y, Tan B, et al. 2023. PpeERF115 regulates peach fruit ripening by increasing polyamine turnover through up-regulation of genes involved in polyamine synthesis and catabolism. Postharvest Biology and Technology 204:112432

    doi: 10.1016/j.postharvbio.2023.112432

    CrossRef   Google Scholar

    [23]

    Chen C, Chen H, Zhang Y, Thomas HR, Frank MH, et al. 2020. TBtools: an integrative toolkit developed for interactive analyses of big biological data. Molecular Plant 13:1194−202

    doi: 10.1016/j.molp.2020.06.009

    CrossRef   Google Scholar

    [24]

    Lescot M, Déhais P, Thijs G, Marchal K, Moreau Y, et al. 2002. PlantCARE, a database of plant cis-acting regulatory elements and a portal to tools for in silico analysis of promoter sequences. Nucleic Acids Research 30:325−27

    doi: 10.1093/nar/30.1.325

    CrossRef   Google Scholar

    [25]

    Hall T. 1999. BioEdit: a user-friendly biological sequence alignment editor and analysis program for Windows 95/98/NT. Nuclc Acids Symposium Series 41:95−98

    Google Scholar

    [26]

    Goodstein DM, Shu S, Howson R, Neupane R, Hayes RD, et al. 2012. Phytozome: a comparative platform for green plant genomics. Nucleic Acids Research 40:D1178−D1186

    doi: 10.1093/nar/gkr944

    CrossRef   Google Scholar

    [27]

    Tong Z, Gao Z, Wang F, Zhou J, Zhang Z. 2009. Selection of reliable reference genes for gene expression studies in peach using real-time PCR. BMC Molecular Biology 10:71

    doi: 10.1186/1471-2199-10-71

    CrossRef   Google Scholar

    [28]

    Livak KJ, Schmittgen TD. 2001. Analysis of relative gene expression data using real-time quantitative PCR and the 2−ΔΔCT method. Methods 25:402−8

    doi: 10.1006/meth.2001.1262

    CrossRef   Google Scholar

    [29]

    Ye J, Coulouris G, Zaretskaya I, Cutcutache I, Rozen S, et al. 2012. Primer-BLAST: a tool to design target-specific primers for polymerase chain reaction. BMC Bioinformatics 13:134

    doi: 10.1186/1471-2105-13-134

    CrossRef   Google Scholar

    [30]

    Chae HS, Kieber JJ. 2005. Eto Brute? Role of ACS turnover in regulating ethylene biosynthesis Trends in Plant Science 10:291−96

    doi: 10.1016/j.tplants.2005.04.006

    CrossRef   Google Scholar

    [31]

    Yoshida H, Wang KLC, Chang CM, Mori K, Uchida E, et al. 2006. The ACC synthase TOE sequence is required for interaction with ETO1 family proteins and destabilization of target proteins. Plant Molecular Biology 62:427−37

    doi: 10.1007/s11103-006-9029-7

    CrossRef   Google Scholar

    [32]

    Wei C, Zhang R, Yang X, Zhu C, Li H, et al. 2019. Comparative analysis of calcium-dependent protein kinase in Cucurbitaceae and expression studies in watermelon. International Journal of Molecular Sciences 20:2527

    doi: 10.3390/ijms20102527

    CrossRef   Google Scholar

    [33]

    Lü P, Yu S, Zhu N, Chen Y, Zhou B, et al. 2018. Genome encode analyses reveal the basis of convergent evolution of fleshy fruit ripening. Nature Plants 4:784−91

    doi: 10.1038/s41477-018-0249-z

    CrossRef   Google Scholar

    [34]

    Guo Z, Zhang Y, Yao J, Xie Z, Zhang Y, et al. 2021. The NAM/ATAF1/2/CUC2 transcription factor PpNAC. A59 enhances PpERF. A16 expression to promote ethylene biosynthesis during peach fruit ripening. Horticulture Research 8:209

    doi: 10.1038/s41438-021-00644-6

    CrossRef   Google Scholar

    [35]

    Li T, Tan D, Liu Z, Jiang Z, Wei Y, et al. 2015. Apple MdACS6 regulates ethylene biosynthesis during fruit development involving ethylene-responsive factor. Plant and Cell Physiology 56:1909−17

    doi: 10.1093/pcp/pcv111

    CrossRef   Google Scholar

    [36]

    Tonutti P, Casson P, Ramina A. 1991. Ethylene biosynthesis during peach fruit development. Journal of the American Society for Horticultural Science 116:274−79

    doi: 10.21273/jashs.116.2.274

    CrossRef   Google Scholar

    [37]

    Bonghi C, Trainotti L, Botton A, Tadiello A, Rasori A, et al. 2011. A microarray approach to identify genes involved in seed-pericarp cross-talk and development in peach. BMC Plant Biology 11:107

    doi: 10.1186/1471-2229-11-107

    CrossRef   Google Scholar

  • Cite this article

    Wang X, Dong K, Cheng J, Tan B, Zheng X, et al. 2024. Genome-wide identification and expression pattern analysis of the ACS gene family during fruit development in peach. Fruit Research 4: e004 doi: 10.48130/frures-0023-0040
    Wang X, Dong K, Cheng J, Tan B, Zheng X, et al. 2024. Genome-wide identification and expression pattern analysis of the ACS gene family during fruit development in peach. Fruit Research 4: e004 doi: 10.48130/frures-0023-0040

Figures(7)

Article Metrics

Article views(3295) PDF downloads(461)

ARTICLE   Open Access    

Genome-wide identification and expression pattern analysis of the ACS gene family during fruit development in peach

Fruit Research  4 Article number: e004  (2024)  |  Cite this article

Abstract: Ethylene plays an important role in regulating the development and ripening of fruits, and 1-aminocyclopropane carboxylic acid synthase is the key rate-limiting enzyme in ethylene synthesis pathway. In this study, eight PpACS genes were identified from the peach genome [Prunus persica (L.) Batsch], and their phylogeny, gene structures, promoter motifs and expression patterns were analyzed. The PpACS genes could be divided into four types, and the genes with similar structures and motif distribution clustered together. Identification of the cis-elements in the promoters revealed that the PpACS genes may respond to various hormones. Furthermore, expression analysis showed that five (PpACS1, PpACS5, PpACS6, PpACS7 and PpACS8) of the eight PpACS genes were expressed at different stages during peach fruit development. Among them, PpACS1 was highly expressed at the ripening stage and induced by ethylene. The expression peaks of PpACS5, PpACS6, PpACS7 and PpACS8 during the transition from first exponential growth to pit hardening (S1 to S2) indicated a potential function of ethylene during this important transition. Taken together, these results provide valuable information for future investigation into the functions of the PpACS genes during peach fruit development and ripening.

    • Ethylene is an important plant hormone that plays a vital role in many aspects of plant growth, including fruit development and ripening[13]. Climacteric fruit like tomato, apple, pear, kiwifruit and peach display enhanced ethylene production and a peak in respiration at the onset of ripening. It is thought that ethylene regulates the initiation of various ripening-related changes like fruit color, cell wall metabolism, sugar content, flavor and aroma compounds in climacteric fruit[35]. In addition, ethylene has been reported to participate in fruit set and early fruit development[68]. The inhibition of ethylene production or ethylene-induced responses by external treatments with chemical inhibitors such as ethylene biosynthesis inhibitor aminoethoxyvinylglycine, perception inhibitor silver thiosulphate and 1-methylcyclopropene (1-MCP), induces fruit set efficiency and the growth of set fruits in pear[8], and tomato[6].

      Ethylene is synthesized from S-adenosyl-L-methionine (SAM), which is converted to 1-aminocyclopropane carboxylic acid (ACC) under the catalyzation of the enzyme ACC synthase (ACS). Then, ACC is oxidized into ethylene by ACC oxidase (ACO)[9,10]. In the ethylene synthesis pathway, the formation of ACC is generally thought to be the rate-limiting step and therefore, ACS proteins are rate-limiting enzymes in ethylene synthesis[11]. ACS belongs to the family of pyridoxal-5'-phosphate dependent aminotransferases, which require vitamin B6 as a co-factor for activity[9]. According to the presence of particular sequences at the C-terminus, ACS genes can be divided into three major groups: Type I genes encode target sites for mitogen-activated and calcium-dependent protein kinases (MAPK and CDPK, respectively), Type II genes encode target sites for CDPKs and E3 ligases, and Type III genes encode no signaling target sites[12].

      Early work has discovered several genes in the ACS family in different species and their differential expression during plant development. There are 12 ACS genes (ACS1 to ACS12) in Arabidopsis, and all of them display different expression patterns throughout growth and development[1, 13]. In tomato, nine genes encoding ACS (LeACS1A, LeACS1B, and LeACS2−8) have been reported[1], with LeACS1A, LeACS2, LeACS4, and LeACS6 are expressed in different stage of fruit development[14, 15]. Three of the genes, LeACS1A, LeACS2, and LeACS4 showed a ripening-related increase in expression, while LeACS6 transcripts were present in mature green fruit but declined as ripening was initiated[15]. A total of 19 ACS genes were identified in apple, with six expressed in fruit[16]. Among them, MdACS3a is expressed lower and before fruit ripening, while MdACS1 is expressed abundantly after fruit ripening[17]. These results indicated that fruit development relies on the expression of different ACS genes to form ethylene at distinct developmental stages.

      There are two systems of ethylene biosynthesis in higher plants: System 1 is auto-inhibitory and responsible for producing basal levels of ethylene in all tissues, including non-ripening fruit; System 2 is auto-stimulatory and produces the burst of ethylene during the ripening of climacteric fruit[15, 18]. The ethylene production in Systems 1 and 2 is regulated by differential expression of ACS genes. In tomato, System 1 is regulated by the expression of LeACS1A and LeACS6. As fruit transitions to the ripening stage, the expression of LeACS1A and LeACS4 is induced, dependent on the RIN MADS-box transcription factor, and System-2 ethylene synthesis is subsequently initiated and maintained by LeACS2[15]. In apple, MdACS1 is well-known to control the climacteric ethylene burst during fruit ripening, while MdACS6 is responsible for ethylene production in System-1 and MdACS3a is a main regulator of ethylene production through the transition from System 1 to System 2[17, 19].

      Six PpACSs were identified in nectarine, and three of them are expressed during nectarine fruit development and ripening[20]. Among them, PpACS1 is expressed abundantly at the ripening stage and plays important roles in regulating fruit softening[20, 21]. However, peach fruit development and ripening consists of several growth phases: the first exponential growth phase (S1), the onset of pit hardening (S2), the second exponential growth phase (S3), and ripening (S4). Aside from the ripening stage, the regulation of PpACS genes to control ethylene synthesis during the other development phases especially the transition between different growth phases, remains unclear.

      In this study, we identified eight PpACS genes in peach and analyzed their gene structures, conserved domains, motifs and promoters. Samples were taken from additional, intervals before and after full bloom to perform detailed examinations of ACS activity and transcript levels of the PpACS genes during fruit development and ripening. The PpACS transcript expression patterns were also examined under ethylene and 1-MCP treatments. These results provide valuable information for the study of the PpACS gene functions during peach fruit development.

    • For PpACS expression profiles and ACS activity analysis, peach fruit at different developmental stages were collected from the cultivar 'Jinqiuhongmi' about 7 days' before and after full bloom (DAFB). For ethylene and 1-MCP treatment, the variety 'Huangshuimi' peach fruit at 70 DAFB were collected and treated with 100 g·L−1 of ethephon, 10 μL·L−1 of 1-methylcyclopropene (1-MCP) or distilled water according to Cheng et al[22]. Fruit samples were collected at 0, 2 and 4 d after treatment. All collected materials were immediately frozen in liquid nitrogen and stored at −80 °C until use. The peach cultivars used in this study were seven-year-old trees and maintained at the Fruit Tree Germplasm Repository of Henan Agricultural University (Henan Province, China).

    • The genome sequences (Version 2.0) used in this study were downloaded from GDR (www.rosaceae.org/gb/gbrowse/prunus_persica_v2.0/). All PpACS genes in peach were identified by BlastP using the ACS genes of Arabidopsis thaliana as the query sequence[12] downloaded from the TAIR database (www.arabidopsis.org/). The potential PpACS genes were reconfirmed through comparison with the Swiss-Port database in NCBI-BLASTP (https://blast.ncbi.nlm.nih.gov/Blast.cgi).

      The exon-intron structures and the conserved motifs of the PpACS genes were analyzed and visualized using TBtools[23] with the parameters of zero or one repetition and 10 maximum number of motifs.

      The 2,000 bp upstream of each PpACS coding sequence (CDS) was extracted as the promoter by TBtools[23]. The promoter cis-acting elements were predicted through the PlantCARE (http://bioinformatics.psb.ugent.be/webtools/plantcare/html/)[24] and visualized using TBtools[23].

    • The predicted CDS length, predicted isoelectric point (pI) and molecular weights (MWs) of all confirmed PpACSs were predicted by ExPASy-ProtParam (https://web.expasy.org/protparam/), and their subcellular localization was predicted by Plant-mPLo (www.csbio.sjtu.edu.cn/bioinf/plant-multi/).

      The multiple sequence alignment was generated by the BioEdit Sequence Alignment Editor[25]. A total number of 23 ACS proteins from Arabidopsis, tomato and apple were downloaded from the Phytozome database (https://phytozome-next.jgi.doe.gov/)[26] and were used for phylogenetic analysis together with the PpACSs. Maximum likelihood and neighbor-joining trees of ACS proteins were generated using MEGA 11.0 with 1,000 replicates (Jukes-Cantor distance matrix).

    • Total RNA was extracted using the Spin Column Plant total RNA Purification Kit (Sangon Biotech, Shanghai, China), and the first-strand cDNA was synthesized using the PrimeScriptTM RT reagent Kit (TaKaRa, Dalian, China). qRT-PCR was conducted in a total reaction volume of 20 μL containing 10 μL of SYBR Green I Master Mix (Takara, Dalian, China), 0.2 μM of each primer, and 100 ng of template cDNA. The amplification was performed on an ABI Prism 7500 FAST Sequence Detection System (Applied Biosystems, Madrid, CA, USA) with the following program: pre-denaturation at 95 °C for 30 s, followed by 40 cycles of 95 °C for 30 s, 60 °C for 34 s, and 72 °C for 1 min. The peach PpTEF2 (Prupe.4G138900) gene was selected as constitutive controls[27]. According to the Ct value, the gene expression level was calculated by the 2−ΔΔCT method[28]. Primers used for qRT-PCR were designed using Primer-BLAST[29] and are listed in Supplemental Table S1. Three biological replicates were performed for each analysis.

    • The peach fruits collected at different developmental stages after full bloom were also used to detect ACS activity. Firstly, fruit samples were ground with liquid nitrogen, and 0.1 g samples were homogenized by hand with 2 mL phosphate buffer (pH 7.4), and then centrifuged at 1,000 g for 20 min. The supernatant was collected to detect ACS activity. The Plant ACC synthase (ACS) ELISA Kit (Ruishou, Shanghai, China) was used to perform a chromogenic reaction according to the instructions. Briefly, a total reaction volume of 50 μL samples or standard, 100 μL of enzyme conjugate were added to a microtiter plate, covered with an adhesive strip and incubated for 60 min at 37 °C, the microtiter plate was washed four times. Then, 50 μL Substrate A and Substrate B were added to each well respectively, gently mixed and incubated for 15 min at 37 °C. Lastly, 50 μL Stop Solution were added and the reaction solution wwas measured at a wavelength of 450 nm using a microplate reader within 15 min. A standard curve was generated and used to calculate the ACS activity. Three biological replicates were performed.

    • An early study identified six PpACS genes in the nectarine genome[20]. Here, we have found eight PpACS genes in the peach genome, including the six reported PpACSs and two other genes named PpACS7 and PpACS8 (Supplemental Table S2). According to previous studies, the ACS proteins can be classified into four types based on their C-terminal sequence characteristics[12, 30]. Here, a phylogenetic tree was constructed, and sequence alignment of the C-terminal amino acids of the ACS proteins was performed.

      The phylogenetic analysis showed that the eight PpACS proteins from peach were classified into four types (Type I, Type II, Type III and AT, or aminotransferase) together with the ACS proteins from Arabidopsis, tomato and apple (Fig. 1). For instance, PpACS1 and PpACS5 clustered with Type I ACS proteins, PpACS4 and PpACS6 with Type II, and PpACS2 and PpACS3 with Type III (Fig. 1). The proteins that cluster in the AT type, namely PpACS7 and PpACS8 from peach, AtACS10 and AtACS12 from Arabidopsis, and MdACS6 from apple, are likely aminotransferases (AT) that lack ACS activities (Fig. 1).
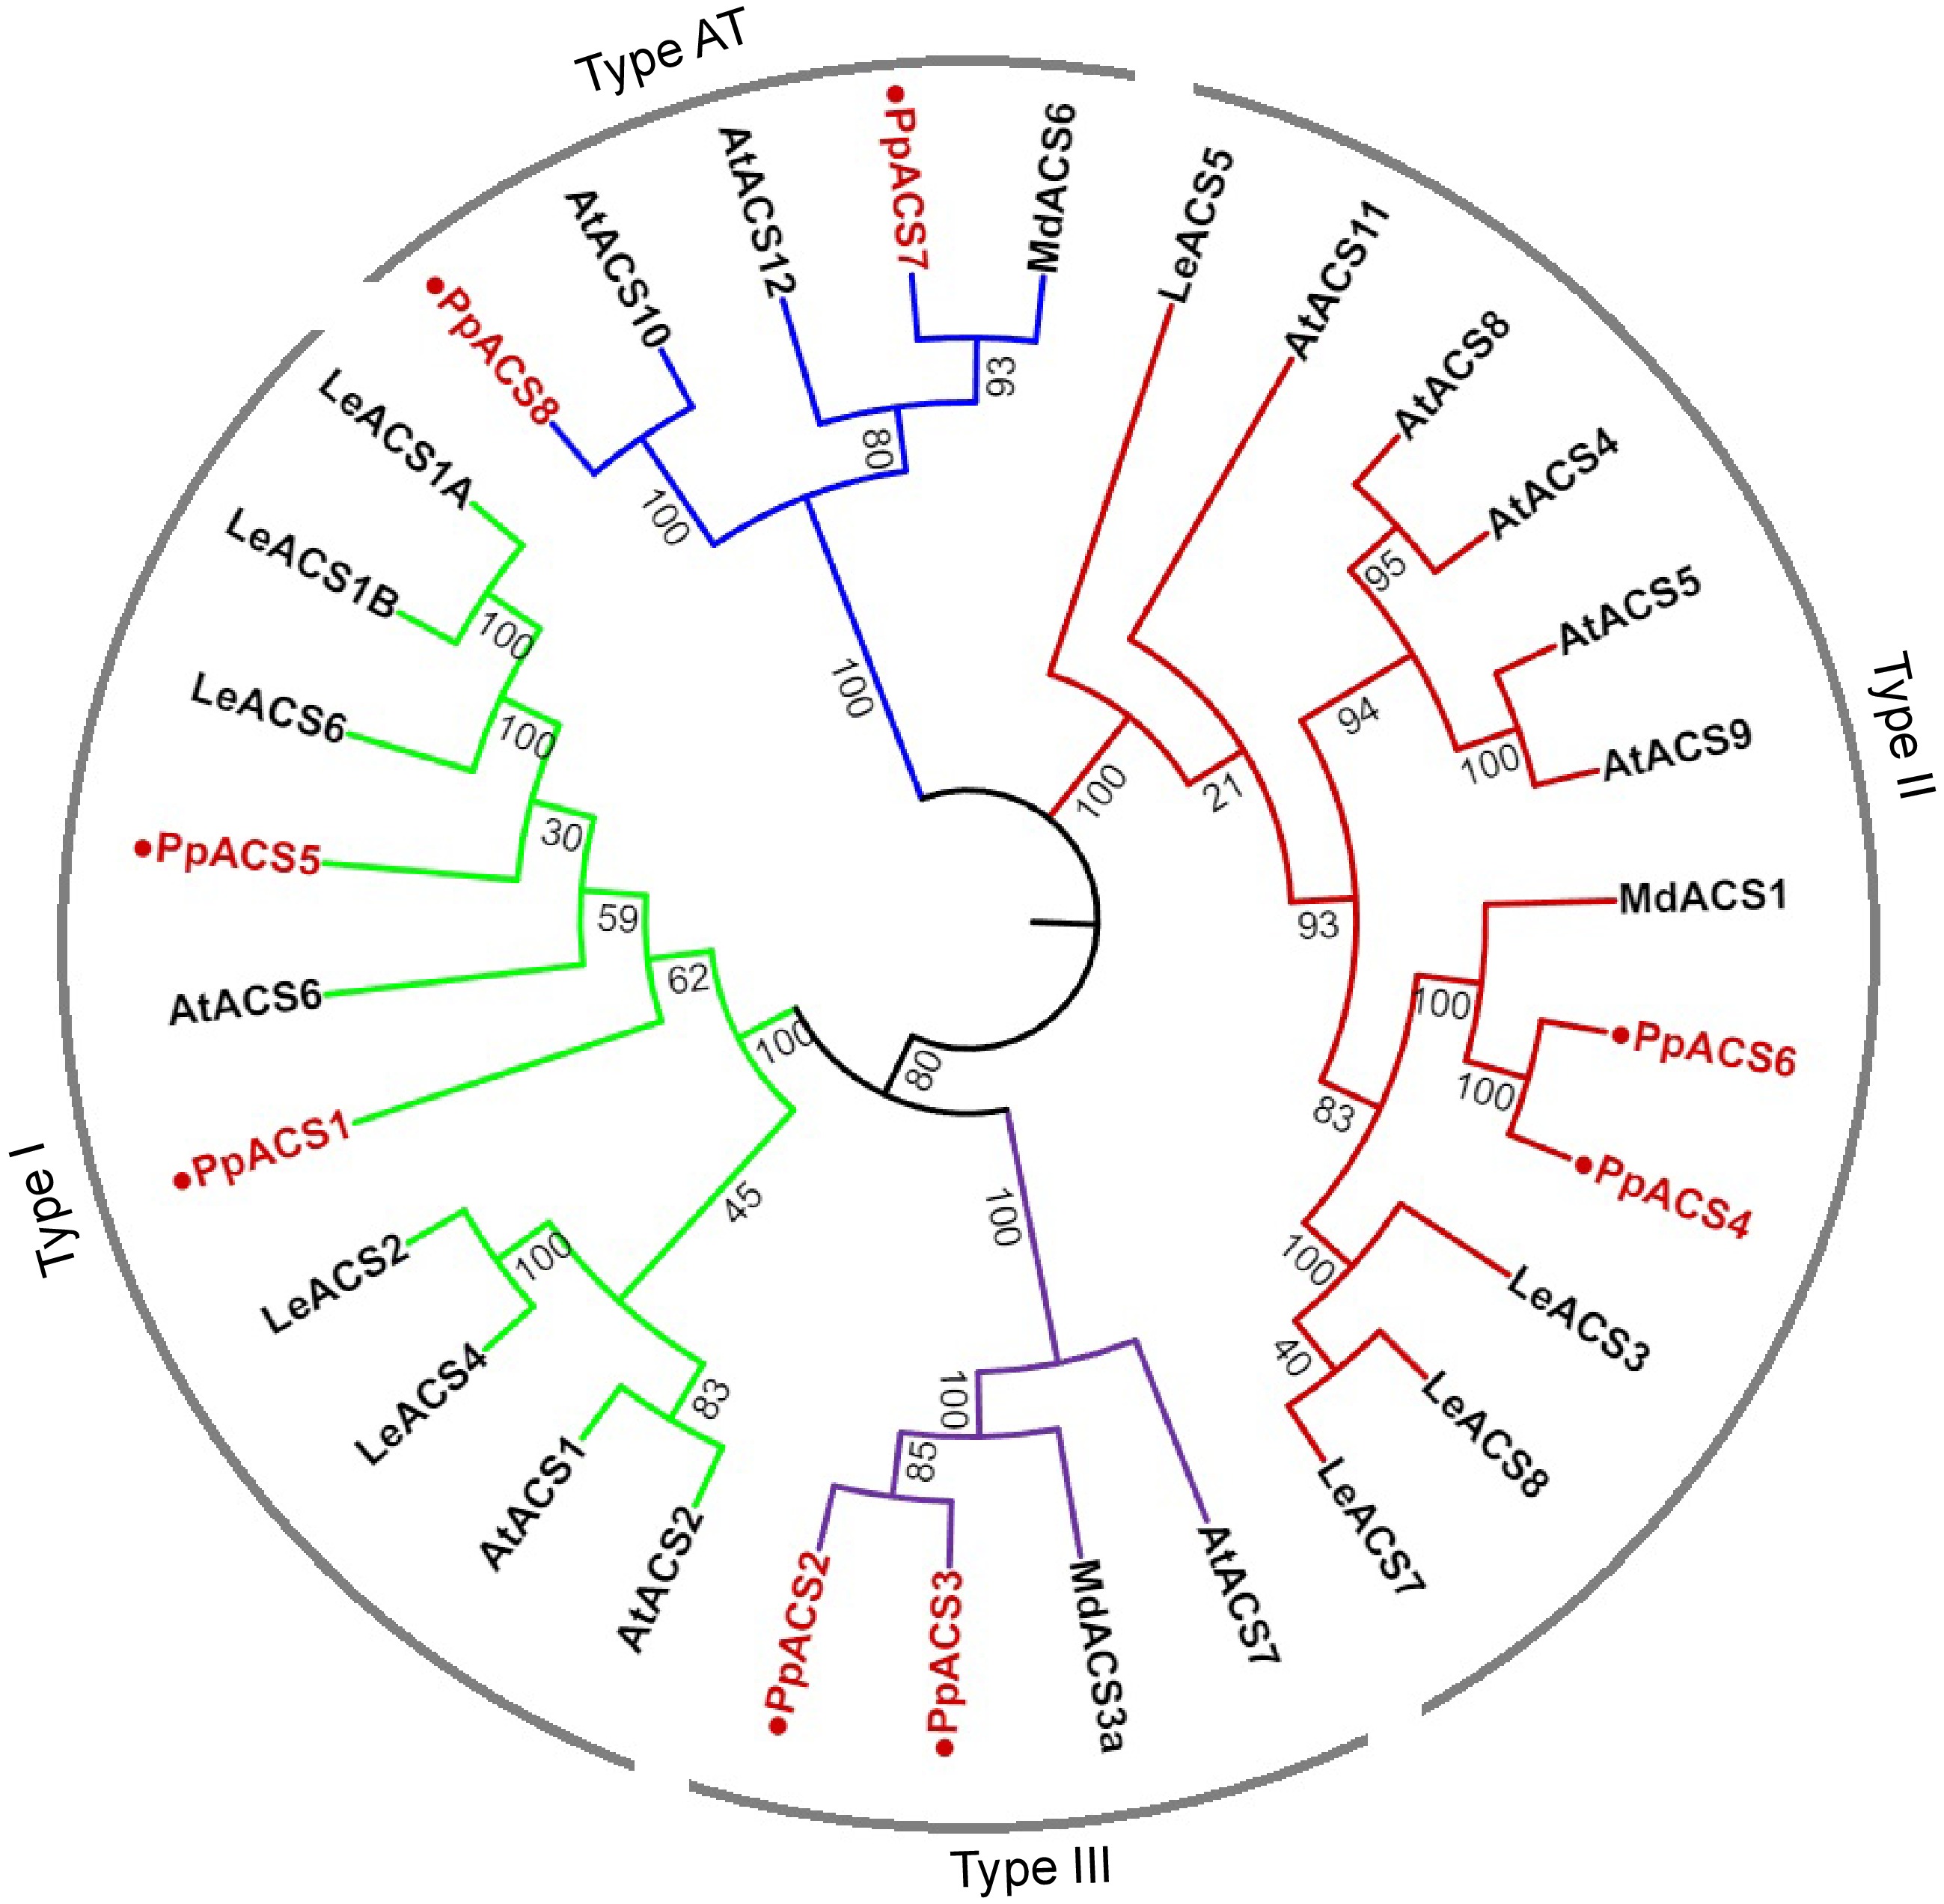
      Figure 1. 

      Phylogenetic analysis of ACS proteins from Arabidopsis, tomato, apple, and peach. A neighbor-joining tree of ACS proteins was generated using the MEGA11.0 with 1000 replicates (Jukes-Cantor distance matrix). ACS proteins of peach are marked with red color. Deduced amino acid sequences from Arabidopsis [AtACS1 (At3g61510), AtACS2 (At1g01480), AtACS4 (At2g22810), AtACS5 (At5g65800), AtACS6 (At4g11280), AtACS7 (At4g26200), AtACS8 (At4g37770), AtACS9 (At3g49700), AtACS10 (At1g62960), AtACS11 (At4g08040), AtACS12 (At5g51690)], apple [MdACS1 (U89156), MdACS3a (AB243060), MdACS6 (MDP0000133334)] and tomato [LeACS1A (U18056), LeACS1B (U18057), LeACS2 (X59139), LeACS3 (U17972), LeACS4 (X59146), LeACS5 (AF167425), LeACS6 (AF167428), LeACS7 (AF043122), LeACS8 AF167427)] were used. AT type ACS proteins are more like aminotransferases.

      Further amino acid sequence alignment of the C-termini of the ACS proteins from Arabidopsis and peach confirmed the conservative characteristics of the PpACS proteins (Fig. 2). The Type I ACS proteins have four conserved serine residues, three of which are phosphorylation sites of MAPKs and one of which is a phosphorylation site of CDPKs (Fig. 2). The Type II ACS proteins contained only one CDPK phosphorylation sites or conserved serine residues at the C-terminus (Fig. 2). Both the Type III and AT-type showed the shortest C-terminals, lacking both types of conserved serine residues (Fig. 2).

      Figure 2. 

      Amino acid alignment of the C-termini of ACS proteins from Arabidopsis and peach. The conserved serine (S) residues of the ACS proteins are marked with black boxes according to previous research[31].

    • The analysis of exon-intron structure is essential to understanding the evolutionary history within gene families[32]. The exons and introns of the ACS genes in peach were analyzed by TBtools. The PpACS members in the same subfamily showed roughly similar exon/intron distribution patterns in terms of the exon length and the number of introns (Fig. 3b). The Type I enzymes PpACS1 and PpACS5, PpACS4 and PpACS6 (Type II), PpACS7 and PpACS8 (AT type) all contained four exons and three introns, while PpACS2 and PpACS3 (Type III) contained three exons and two introns (Fig. 3a, b). The conserved motifs of the PpACS genes were analyzed, and the results showed that all members contained nine motifs (Fig. 3c). Motif 1−8 were common and distributed among all members, while motif 9 was included in members of Type I, Type II and Type III, but not in the AT Type. Only the AT-type genes contained motif 10, suggesting a highly specific function. Sequence logos of the ten conserved motifs included the seven conserved domains of ACS proteins (Fig. 3d).

      Figure 3. 

      Gene structure and conserved protein motifs of the PpACS family in peach. (a) The phylogenetic tree based on all PpACS proteins was constructed using the maximum likelihood method with 1,000 bootstrap. (b) The gene structures of the PpACS genes. The green and yellow boxes represent UTRs and CDSs respectively. (c) The conserved motifs of the PpACS proteins were identified using the MEME program. (d) The sequence logos of the conserved motifs numbered from 1 to 10. The seven conserved domains of ACS are marked with red boxes and named as box 1−7.

    • In order to better understand the potential regulatory function of PpACS genes in peach, the possible cis-regulatory elements (CREs) were identified in the 2,000-bp upstream region from each transcription start site using the PlantCARE online web tool. The predicted CREs of the PpACS genes contained the core promoter elements, environmental stress-related elements, hormone-responsive elements, light-responsive elements, site-binding-related elements, and some others binding sites (Supplemental Table S3). The largest number of elements were the core promoter elements that contained the TATA-box, AT-TATA and CAAT-box (Supplemental Table S3). The light-responsive elements were abundant, including Box 4, the G-box, and the TCT-motif (Supplemental Table S3). There were also various hormone-responsive elements, including the TCA-element involved in salicylic acid (SA) responsiveness, the TATC-box and gibberellin (GA)-response element (GARE) involved in GA responsiveness, the abscisic acid (ABA)-responsive element (ABRE), the AuxRR-core and TGA involved in auxin responsiveness, the CGTCA-motif and TGACG-motif involved in MeJA-responsiveness and the ethylene-responsive element (ERE) (Fig. 4b, c). The most numerous element was the ABRE, which was widely distributed among the PpACSs, except for PpACS3 and PpACS7. The second most common element was ERE (Fig. 4b, c). This analysis indicates that the PpACS genes are regulated by ABA and ethylene signals.
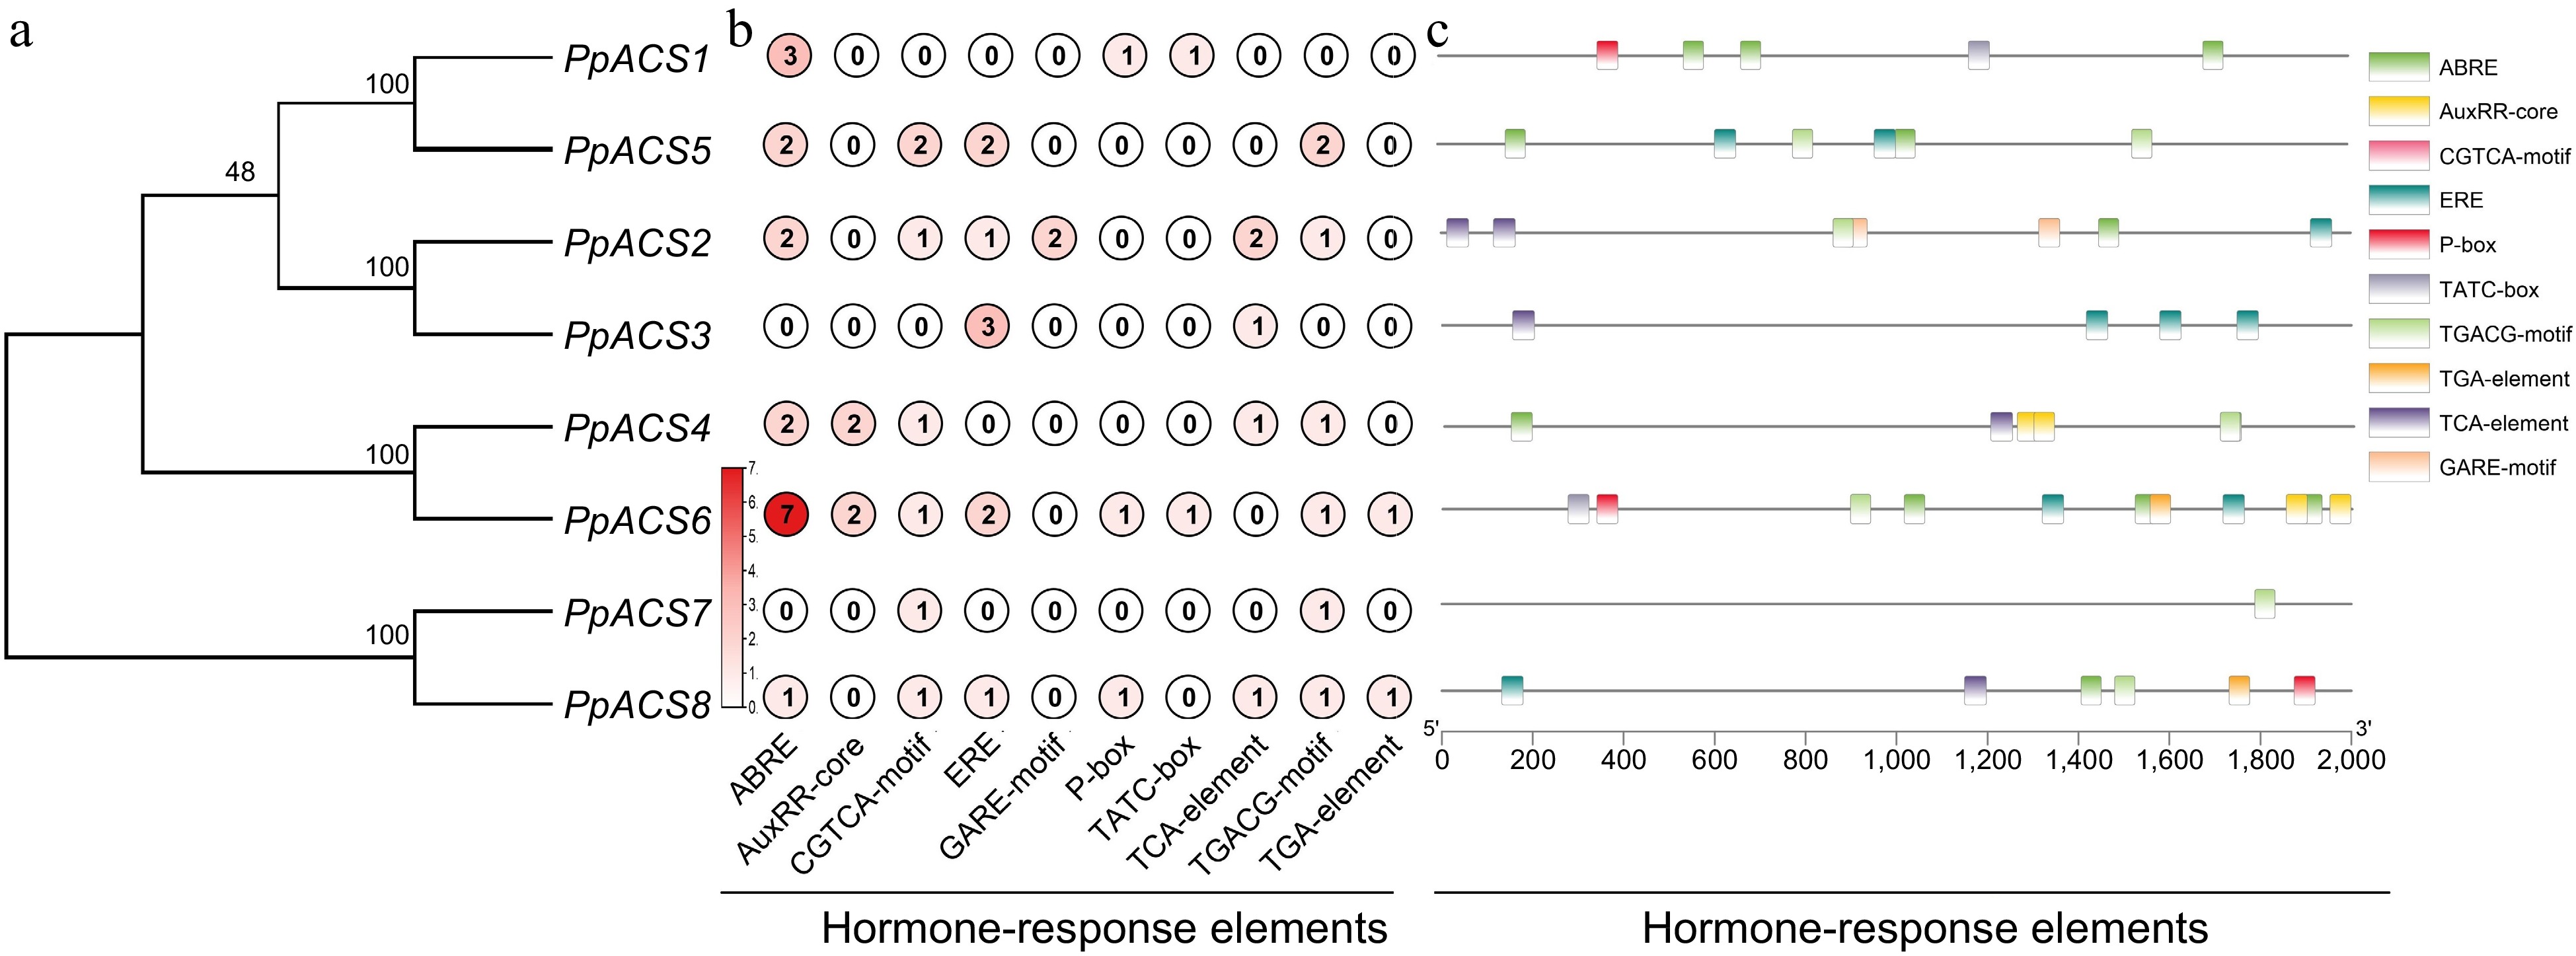
      Figure 4. 

      Analysis of the cis-elements in the promoters of the PpACS genes. The cis-elements of the PpACS genes were determined by the PlantCARE online web tool and visualized by the TB-tool. (a) Phylogenetic tree of all PpACS proteins. (b) Number of hormone-responsive elements detected in each PpACS gene promoter. (c) Visualization of hormone-responsive elements in the PpACS promoters, with ten different cis-elements displayed by different colored boxes.

    • To further investigate the potential functions of the PpACS genes during peach fruit development and ripening, the ACS activity and PpACS expression profiles were determined. Peach fruit samples were numbered negatively as the days before full bloom, while the days after full bloom were divided into four phases: first exponential growth phase (S1), the onset of pit hardening (S2), the second exponential growth phase (S3), and ripening (S4) (Fig. 5a, b).
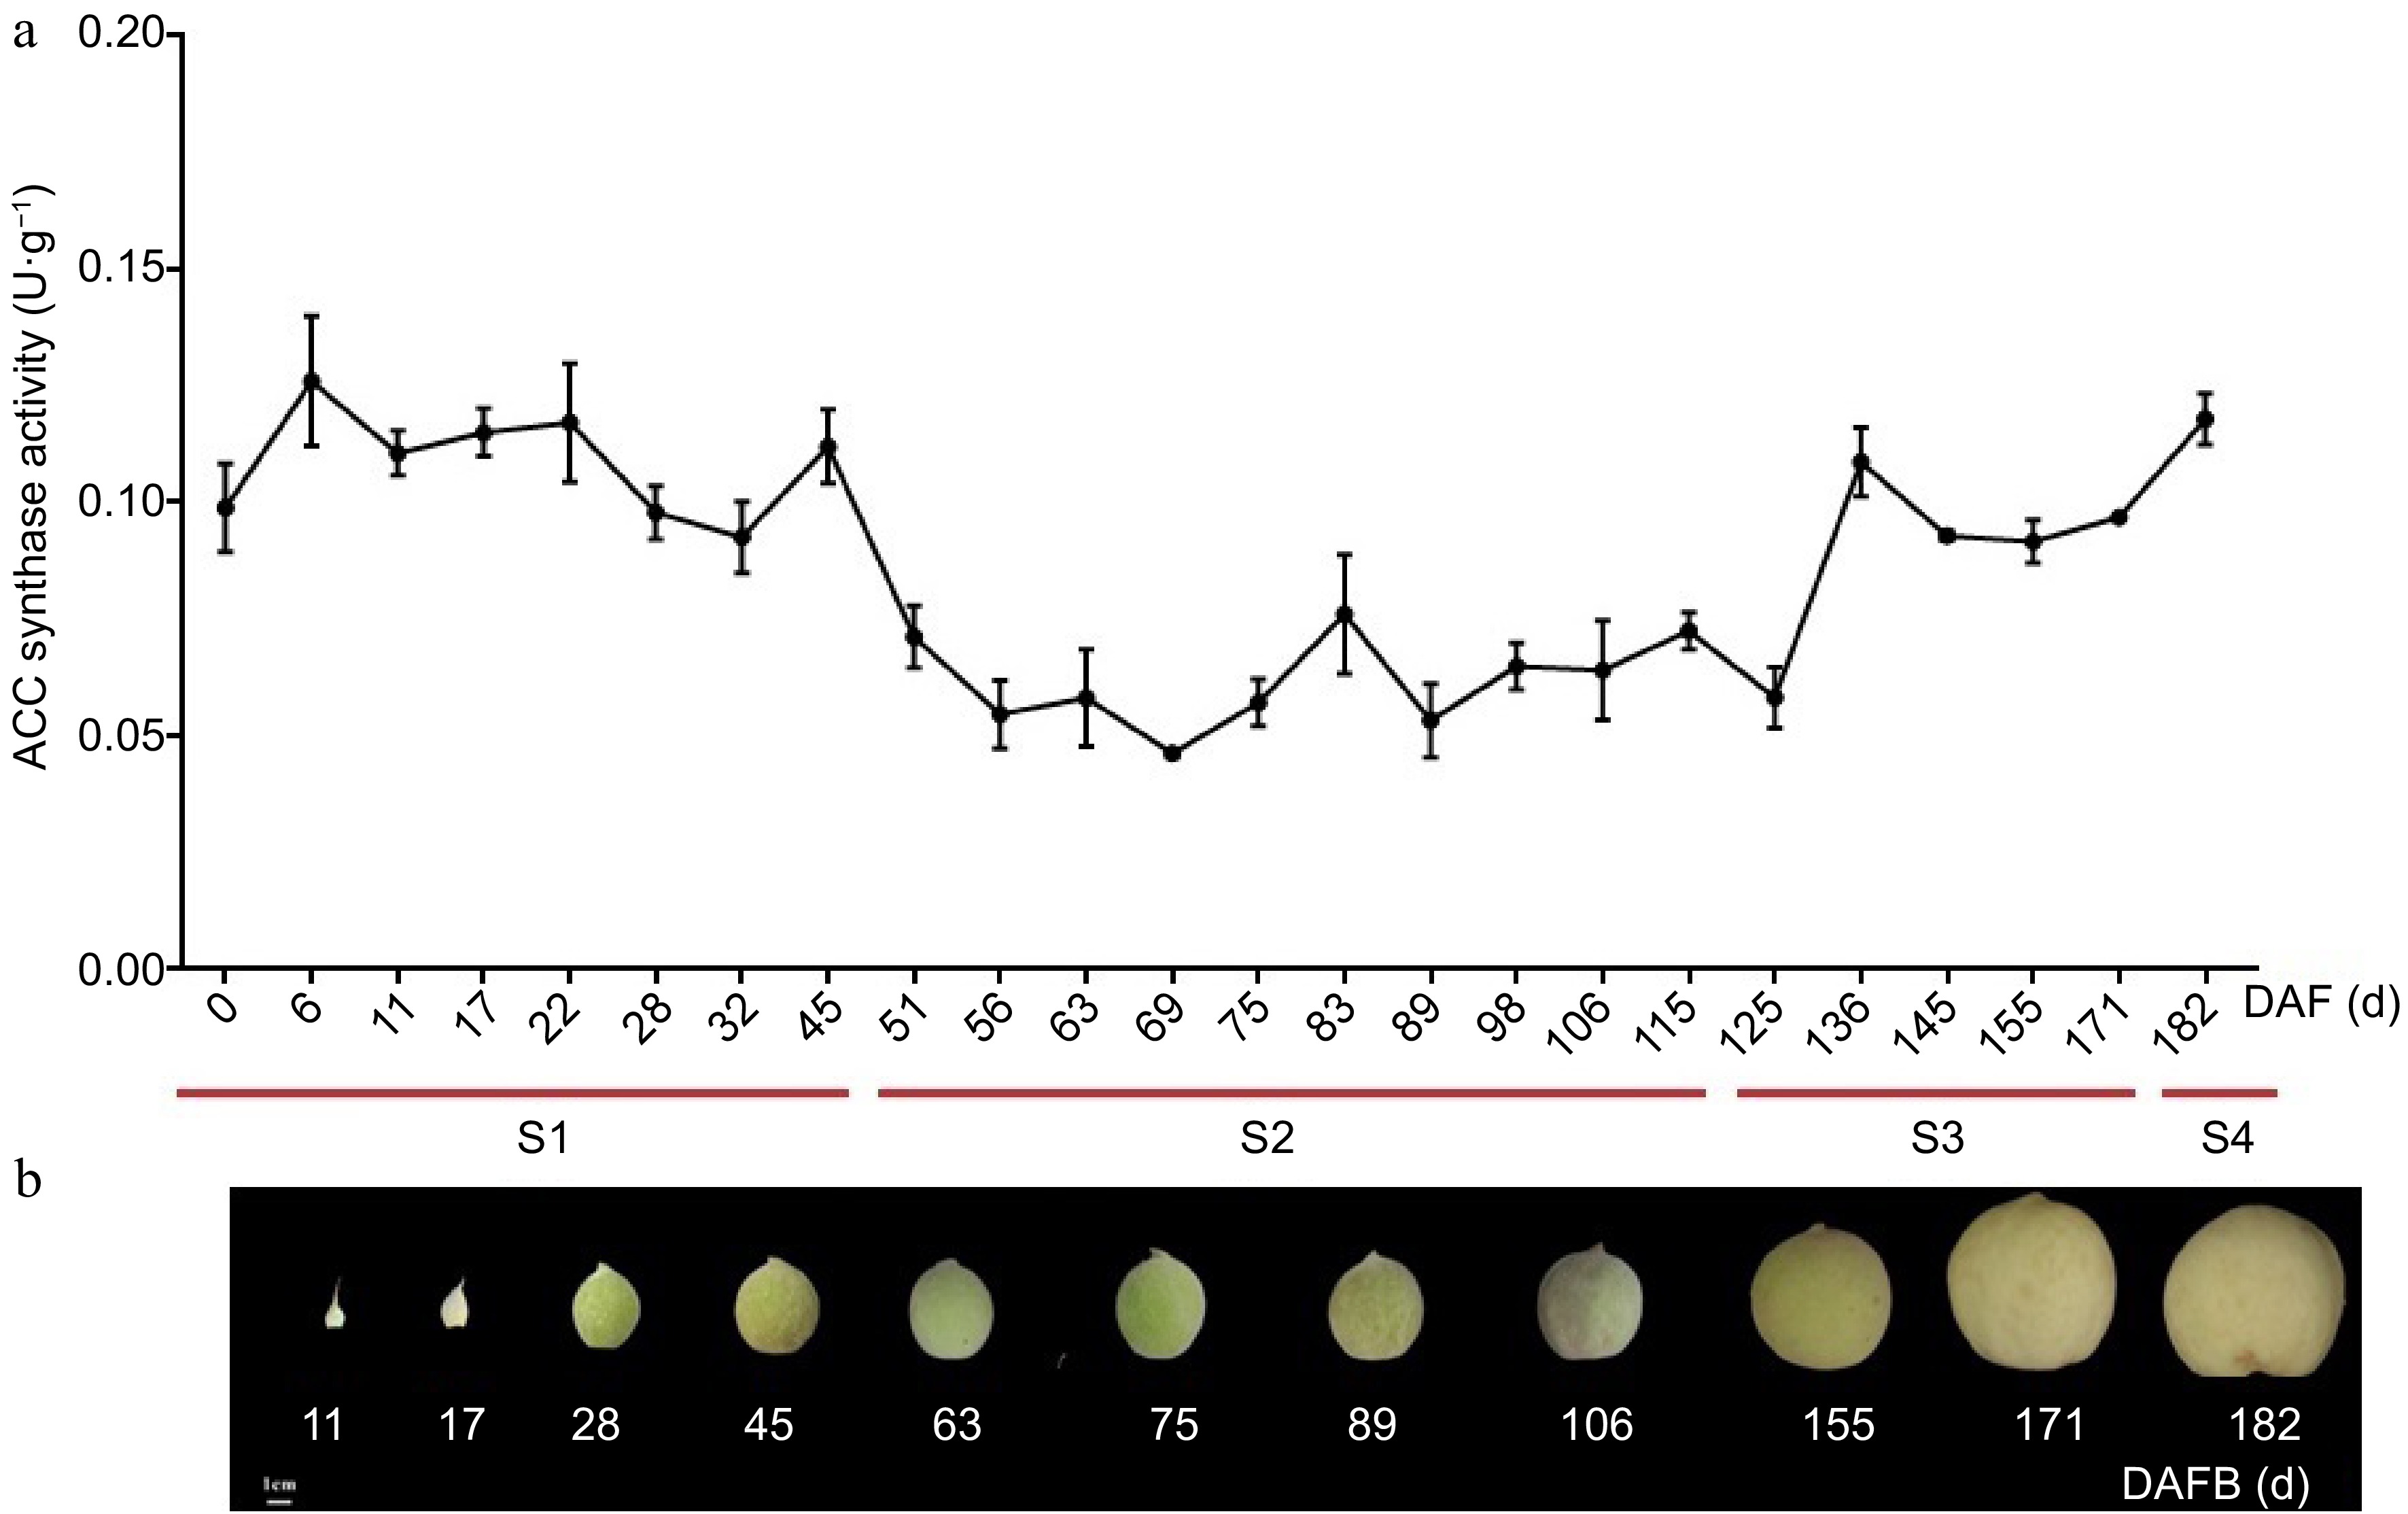
      Figure 5. 

      Total ACC synthase activity at different stages of fruit development in peach. (a) Total ACC synthase activity in different stages of peach fruit development. The values are means ± SD of three independent biological replicates for ACC synthase activity. (b) Sampling time of peach fruit at different development stages, which was divided into four periods (S1, S2, S3 and S4 identified with red lines) according to the days after full bloom (DAFB).

      The total ACS activity fluctuated during fruit development (Fig. 5a). ACS activity was higher during the stage 1 and decreased significantly during the S2 (Fig. 5a). There was a rapid increase in activity within stage-3 at 136 DAFB, and the activity remained high during stage 3 and 4 (Fig. 5a).

      The expression profiles of the PpACS genes showed that the eight PpACS genes were differentially expressed during peach fruit development. Among them, the AT-type genes PpACS7 and PpACS8 exhibited higher expression during fruit development (Fig. 6g & h). Transcripts of PpACS1, PpACS5, and PpACS6 also accumulated during fruit development and ripening (Fig. 6ac), while those for PpACS2, PpACS3, and PpACS4 exhibited minimal expression in peach fruit (Fig. 6df). PpACS1, which has been identified as playing important roles in peach fruit ripening[33, 34] showed a burst expression at the S4 stage (Fig. 6a). Interestingly, PpACS5, PpACS6, PpACS7, and PpACS8 showed clear expression peaks at the S1 to S2 transition (Fig. 6b, c & g). The ACS genes were mainly expressed at the early (S1) and ripening stages (S3−S4) during the fruit development and may function for ethylene synthesis during these stages.
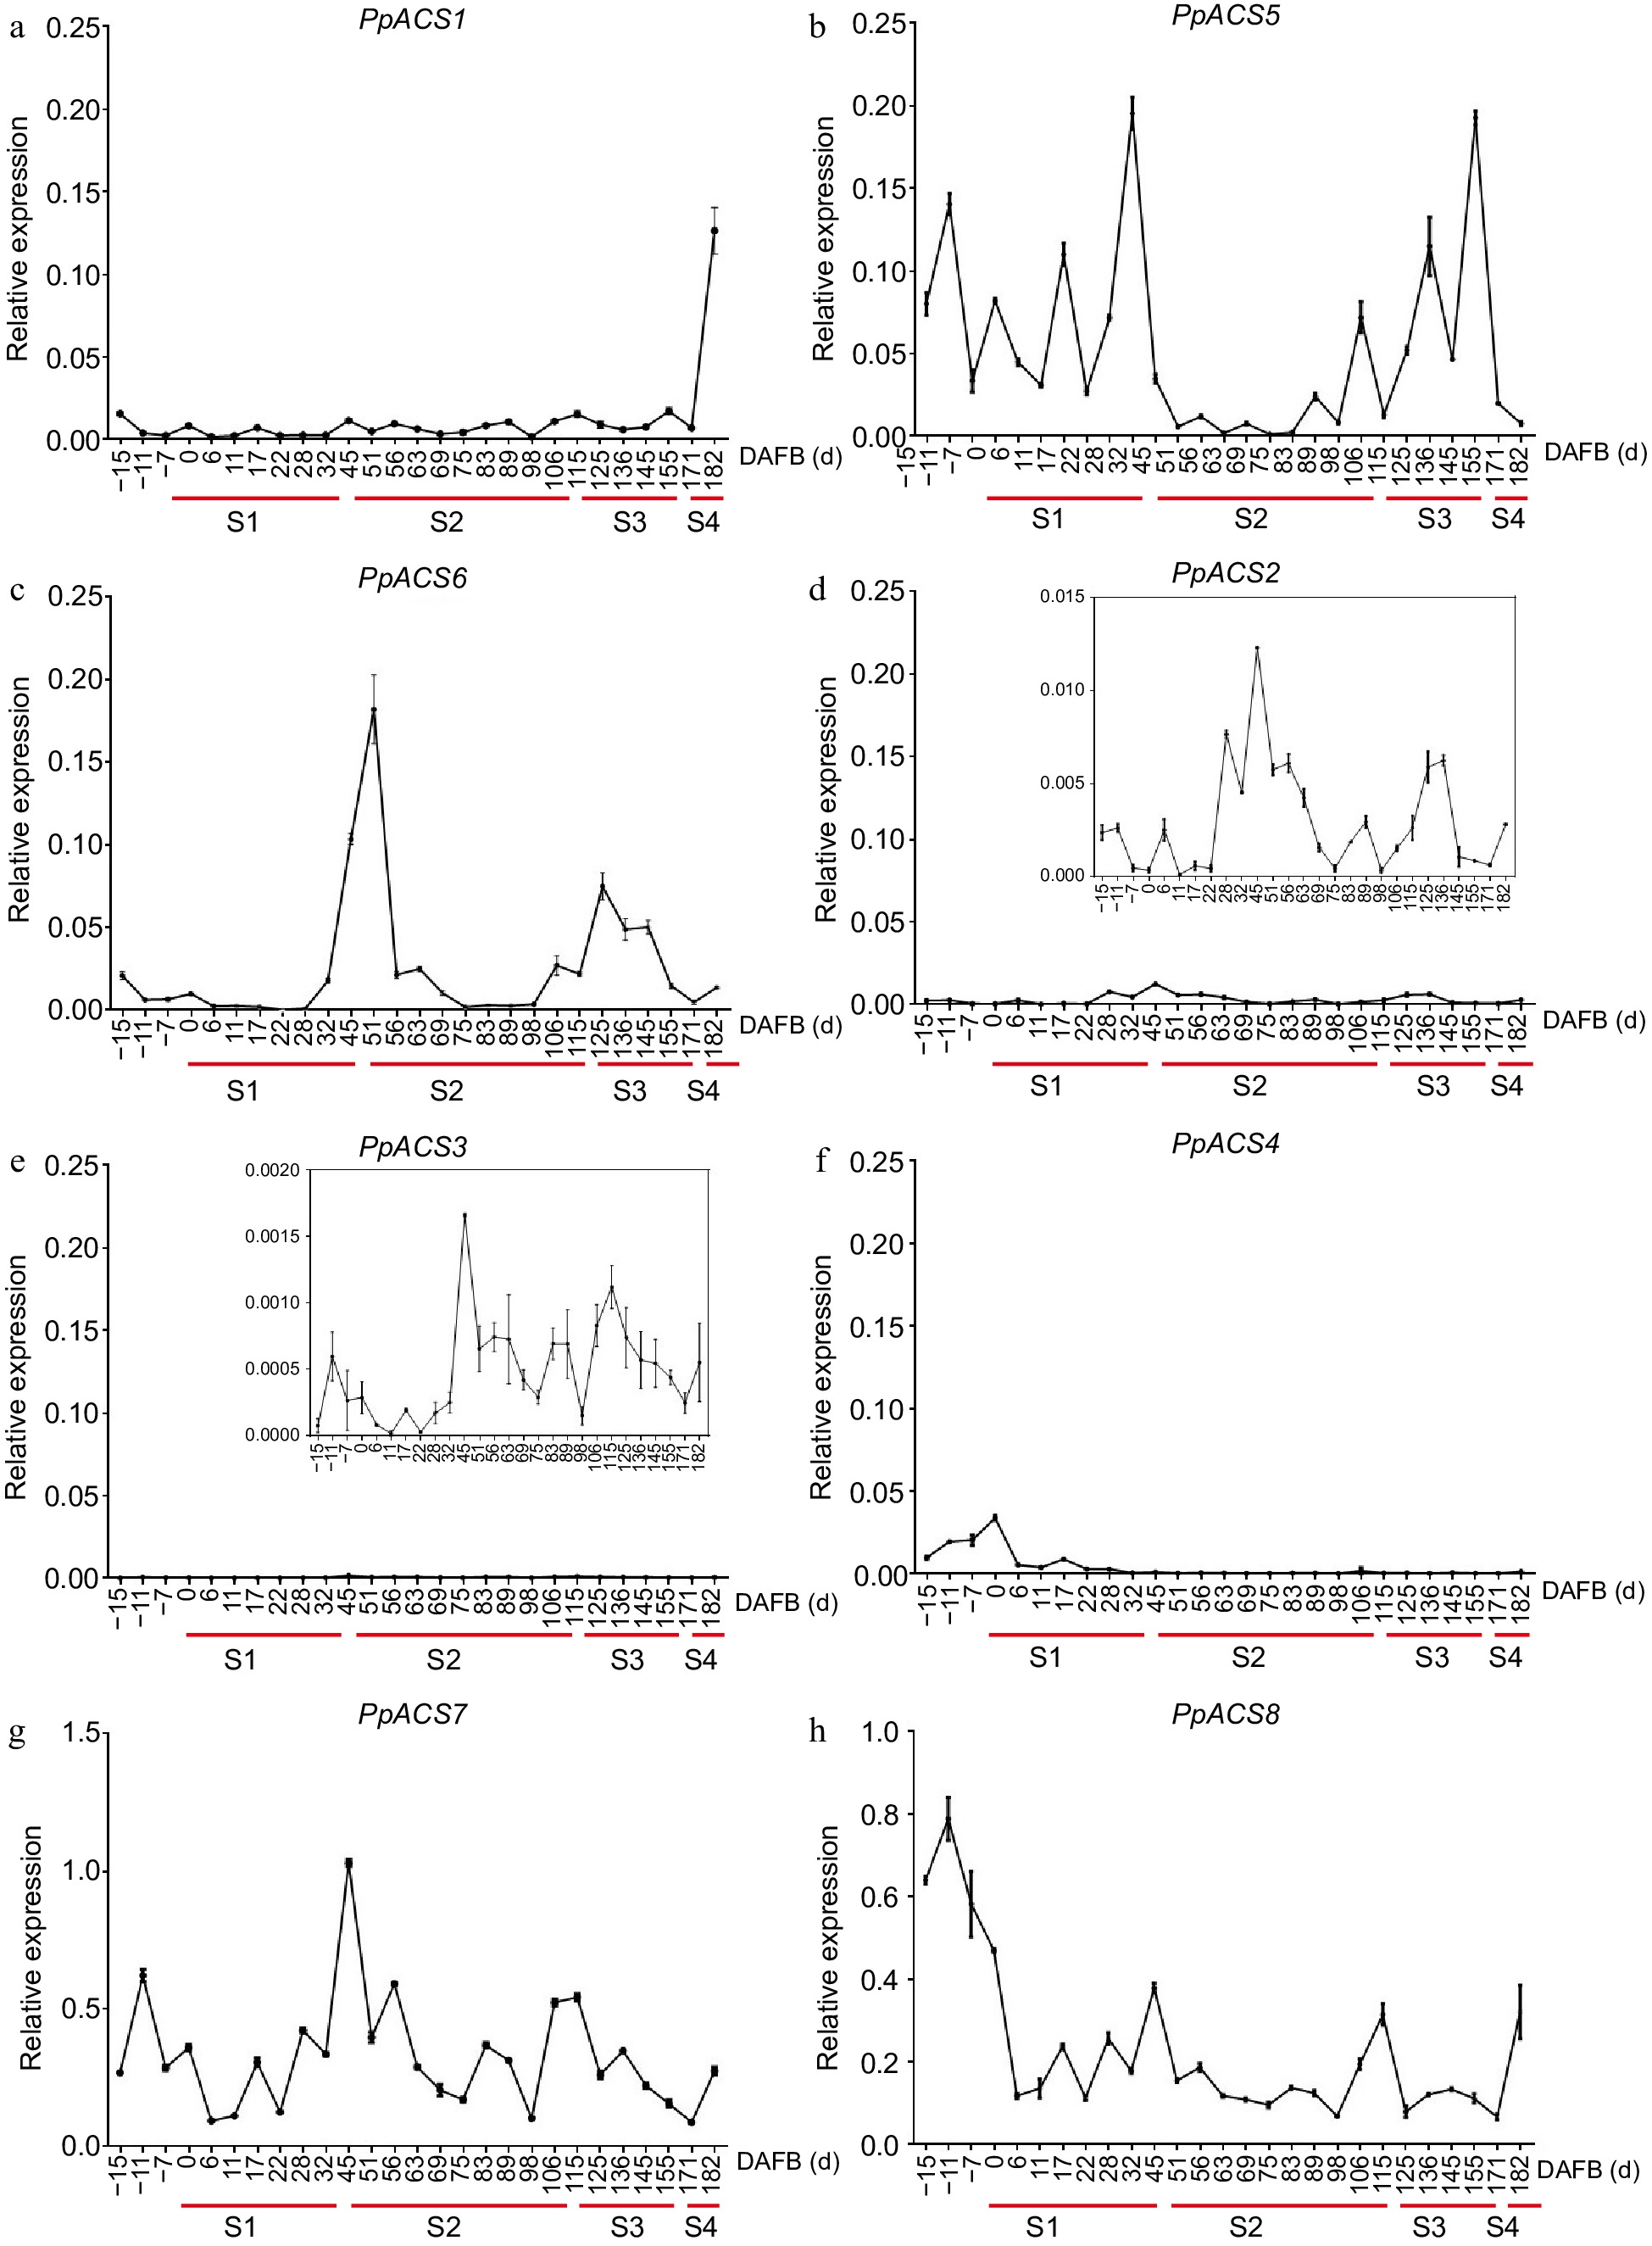
      Figure 6. 

      Expression profiles of PpACS genes during fruit development of peach. The expression values are means ± SD of three independent biological replicates as analyzed by qRT-PCR. The fruit development stage was divided into four periods (S1, S2, S3 and S4; identified with red lines) according to the days after full bloom (DAFB). (a)−(h) show the expression profiles of PpACS1PpACS8, respectively.

    • To further investigate whether PpACS gene expression of is under the control of ethylene in peach fruit, the transcript levels of these PpACS genes were examined after 1-MCP and ethylene treatments. The levels of two transcripts, PpACS1 and PpACS8 were upregulated under ethylene treatment and repressed by 1-MCP treatment (Fig. 7). The expression of PpACS3 was repressed by both ethylene and 1-MCP after treatment for 4 d, while PpACS7 was induced by both ethylene and 1-MCP (Fig. 7). Other PpACS genes, including PpACS2, PpACS4, PpACS5 and PpACS6, were induced by 1-MCP (Fig. 7). All these results indicated that the PpACS genes respond differently to ethylene and 1-MCP.

      Figure 7. 

      Effect of ethylene and 1-MCP treatments on the expressions of PpACS genes. The expression values are means ± SD of three independent biological replicates as determined by qRTPCR. Fruits were treated with ethylene and 1-MCP and then, stored at room temperature until sampling at 2 and 4 d. *p < 0.05, **p < 0.01, ***p < 0.001 (Student's t-test).

    • Genes in the ACS family have been divided into types I, II, III, and AT[12]. In Arabidopsis, AtACS10 and AtACS12 encode aminotransferases and have ATase activity, which have been reported are not likely to be involved in ethylene biosynthesis[12]. Here, PpACS7 and PpACS8 from peach clustered with the AT types together with MdACS6 from apple. It has been reported that MdACS6, a homolog of PpACS7, was expressed continuously during fruit ripening and could regulate ethylene biosynthesis when overexpressed in apple fruit[35]. These results indicate that the AT type ACS genes may have ethylene biosynthesis function during fruit development and need to be further investigated.

      Regulation of ethylene biosynthesis is very important in fruit development, and ACS is the key rate-limiting enzyme in the ethylene synthesis pathway. Here we have conducted a detailed examination of ACS gene expression during peach fruit development and ripening. The results indicate that five ACS genes, PpACS1, PpACS5, PpACS6, PpACS7 and PpACS8, are expressed in peach fruit (Fig. 6). Zeng et al.[20] found that PpACS1, PpACS4 and PpACS5 show ripening-related increases in expression during fruit development and ripening in nectarine 'CN13'. PpACS1 showed extremely high expression at in stage 4 fruit, similar to a previous report. PpACS4, which has been reported to show a climacteric pattern from S3-1 to S4-1, exhibited minimal expression in our studies during the entire course of fruit development. Furthermore, the expression of PpACS5 fluctuated during stages 1 and 3, whereas data presented by Zeng et al.[20] showed it decreased in nectarine during fruit development. These discrepancies may be caused by the use of different cultivars or may be due to the greater number of fruit samples at closer intervals that we collected. The increased number of fruit samples offered a greater chance to detect any changes in ACS gene expression during fruit development and ripening.

      Ethylene plays an important role in regulating the development and ripening of fruits, especially in climacteric fruits like peach. Peach fruit development follows the double sigmoid curve and is divided into four phases[36]. Fruit ripening in peach was thought to be ethylene dependent. Ethylene production at the ripening stages is mainly regulated by the expression of PpACS1[21, 33]. Here, we also found that total ACS activity and the expression of PpACS1, PpACS5 and PpACS6 were high during S3 and S4 (Fig. 5a & 6). However, it is interesting that there are expression peaks for PpACS5, PpACS6, PpACS7 and PpACS8 at the S1 to S2 transition, with corresponding peaks of total ACS activity. The growth of peach fruit is slowed down at the S1 to S2 transition and is followed by endocarp lignification (onset of pit hardening), which lasts at the end of S2[37]. The duration of S2 stage is highly dependent on the cultivars, being shorter for early ripening varieties and longer for late ripening varieties[37]. The increasing expression of these PpACS genes at early S2 stage indicated the potential function of ethylene for the peach fruit mature date.

      A model for the regulation of PpACS gene expression during nectarine fruit development and ripening was proposed[20]. In immature nectarine fruit, they found that the System 1 ethylene production relies on the expression of PpACS5, while expression of both PpACS1 and PpACS4 increased with fruit ripening and were responsible for the burst in ethylene production in System 2. Our data showed that, besides PpACS5, other PpACS genes, including PpACS6, PpACS7 and PpACS8, which were mainly expressed in other tissues beside fruit, were also involved in System 1 ethylene biosynthesis and were responsible for producing a basal level of ethylene during early fruit development (Supplemental Fig. S1). Furthermore, PpACS4 was not expressed during the whole course of fruit development, suggesting that it may not be involved in System 2 ethylene biosynthesis. These results were also supported by Guo et al.[34]. Additionally, transcription of PpACS1 was inhibited after ethylene treatment, suggesting an ethylene-independent (non-autocatalytic) system in nectarine fruit[20]. In contrast, our data clearly show that the expression of PpACS1 were significantly induced by ethylene and repressed by 1-MCP, which indicated that PpACS1 functions in System 2 ethylene biosynthesis via an ethylene-dependent (autocatalytic) way. The result is inconsistent with previous reports, which may be due to the treatment of the fruit at different developmental stages and/or treatment times. The 'CN13' fruits used for treatment by Zeng et al.[20] were collected at the commercial harvest stage (90 DAFB, S4-1), whereas the fruit used here were harvested at 70 DAFB (S3). Moreover, the increased PpACS1 transcript levels after 2- and 4-d of ethylene treatment in our study suggests that high ethylene levels required for induction of these genes.

    • In the present study, we identified eight PpACS genes from the peach genome. Phylogenetic analysis showed that the eight proteins could be divided into four types (Type I-III and AT), which was also supported by their exon/intron structures, promoter motifs and protein domains. The ACS activity was higher during the early (S1) and ripening (S3 and S4) fruit developmental stages. The PpACSs expression profiles during peach fruit development were investigated, and five PpACS genes (PpACS1, PpACS5, PpACS6, PpACS7 and PpACS8) were expressed in peach fruit. Among them, PpACS1 was highly expressed during peach fruit ripening and induced by ethylene treatment, while PpACS5, PpACS6, PpACS7 and PpACS8 were expressed at the S1 to S2 transition, suggesting their different roles in ethylene biosynthesis systems during peach fruit development.

    • The authors confirm contribution to the paper as follows: study conception and design: Zhang L, Feng J; draft manuscript preparation: Wang X, Zhang L; manuscript revision: Tan B, Zheng X, Feng J; experiments performed: Wang X, Dong K; formal analysis: Ye X, Cheng J, Wang W. All authors reviewed the results and approved the final version of the manuscript.

    • All data generated or analysed during this study are included in the published article and its supplementary information files.

      • The work was conducted at the Henan Provincial Key Laboratory of Fruit and Cucurbit Biology and supported by the National Natural Science Foundation of China (32002014), the National Key Research and Development Program of China (2019YFD1000104), and the Special Fund for Henan Agriculture Research System (S2014-11-G02).

      • The authors declare that they have no conflict of interest.

      • # Authors contributed equally: Langlang Zhang, Jiancan Feng

      • Copyright: © 2024 by the author(s). Published by Maximum Academic Press, Fayetteville, GA. This article is an open access article distributed under Creative Commons Attribution License (CC BY 4.0), visit https://creativecommons.org/licenses/by/4.0/.
    Figure (7)  References (37)
  • About this article
    Cite this article
    Wang X, Dong K, Cheng J, Tan B, Zheng X, et al. 2024. Genome-wide identification and expression pattern analysis of the ACS gene family during fruit development in peach. Fruit Research 4: e004 doi: 10.48130/frures-0023-0040
    Wang X, Dong K, Cheng J, Tan B, Zheng X, et al. 2024. Genome-wide identification and expression pattern analysis of the ACS gene family during fruit development in peach. Fruit Research 4: e004 doi: 10.48130/frures-0023-0040

Catalog

  • About this article

/

DownLoad:  Full-Size Img  PowerPoint
Return
Return