-
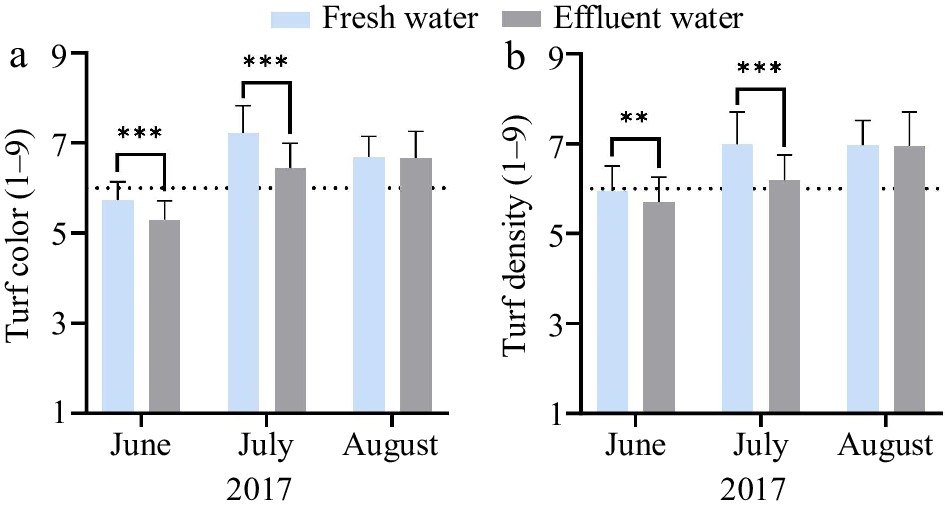
Figure 1.
The effects of summer irrigation with fresh versus effluent water on (a) turf color and (b) turf density varied by rating dates in 2017. Turf color ratings were visually assessed on a 1‒9 scale with 1 being straw-brown turf, 6 being the minimum acceptable color (indicated by the dotted line), and 9 being dark green turf. Turf density ratings were visually assessed on a 1‒9 scale with 1 being the lowest density (open canopy), 6 being the minimum acceptable density (indicated by the dotted line), and 9 being the highest density. Error bars indicate standard deviations. ** Significant at the 0.01 probability level. *** Significant at the 0.001 probability level.
-
Month-year Evapotranspiration
(mm)Precipitation
(mm)Mean temperature
(°C)Max temperature
(°C)Min temperature
(°C)Mar-16 56 188 9.1 12.7 5.3 Apr-16 104 76 12.3 19.4 8.1 May-16 150 20 14.7 19.6 11.6 Jun-16 203 13 17.2 26.3 11.4 Jul-16 226 10 18.9 24.3 15.4 Aug-16 244 3 20.6 29.4 15.1 Sep-16 135 15 16.1 21.3 10.9 Mar-17 46 180 8.6 12.8 2.7 Apr-17 79 89 9.6 12.8 6.8 May-17 145 41 14.3 23.2 8.7 Jun-17 183 38 17.2 28.1 11.1 Jul-17 254 0 19.9 24.7 17.3 Aug-17 224 5 21.3 29.6 17.2 Sep-17 130 51 17.9 24.2 11.1 Table 1.
Corvallis, OR, USA weather data obtained from Bureau of Reclamation Hydromet/AgriMet System.
-
Source of variation df Turf color
(1‒9)aTurf density
(1‒9)b2016 2017 2016 2017 Pr > F Replication 2 NS * NS *** Irrigation water 1 NS *** NS *** Fresh 7.3 6.5 7.5 6.6 Effluent 7.4 6.1 7.5 6.3 Cultivar 10 *** *** * * Date 2 ** *** NS *** Irrigation water × cultivar 10 NS NS NS NS Irrigation water × date 2 NS *** NS *** Cultivar × date 20 * NS NS NS Irrigation water × cultivar × date 20 NS NS NS NS a Turf color ratings were visually assessed on a 1‒9 scale with 1 being straw-brown turf, 6 being the minimum acceptable color, and 9 being dark green turf. b Turf density ratings were visually assessed on a 1‒9 scale with 1 being the lowest density (open canopy), 6 being the minimum acceptable density, and 9 being the highest density. NS Not significant at the 0.05 probability level. * Significant at the 0.05 probability level. ** Significant at the 0.01 probability level. *** Significant at the 0.001 probability level. Table 2.
Analysis of variance and means table for visual turf color and density ratings affected by irrigation water, cultivar, and date in Corvallis, OR, USA in 2016 and 2017.
-
Cultivar Turf color (1−9)ab Turf density (1−9)ac 2016 2017 2016 2017 Premium 7.63A 6.67A 7.69A 6.83A Pillar 7.31CD 6.67A 7.56ABC 6.58AB Pepper 6.93E 5.81D 7.56ABC 6.31BCD Brightstar SLT 7.19D 6.22BC 7.33D 6.33BCD Estelle 7.39BC 6.42AB 7.50ABC 6.36BCD Gray Fox 7.26CD 6.25BC 7.56ABC 6.53ABC Allstar 3 7.46B 6.42AB 7.61AB 6.72AB Mighty 7.38BC 6.28BC 7.47BC 6.11CD SR4660ST 7.47B 6.50AB 7.57ABC 6.72AB Zoom 7.44B 6.47AB 7.39CD 6.44ABCD Manhattan 6 7.36BC 6.08CD 7.43BC 6.08D a Means followed by the same uppercase letter were not significantly different at the 0.05 probability level. b Turf color ratings were visually assessed on a 1‒9 scale with 1 being straw-brown turf, 6 being the minimum acceptable color, and 9 being dark green turf. c Turf density ratings were visually assessed on a 1‒9 scale with 1 being the lowest density (open canopy), 6 being the minimum acceptable density, and 9 being the highest density. Table 3.
Visual turf color and density for 11 perennial ryegrass cultivars evaluated in Corvallis, OR, USA in 2016 and 2017. Mean values represent data points averaged across replication, date, and irrigation water.
-
Source of variation df pH EC
(dS·m−1)B
(ppm)Na
(ppm)Cl
(ppm)Pr > F Replication 2 NS NS NS NS NS Irrigation water 1 NS * * * * Fresh 6.3 0.15 0.9 74 6 Effluent 6.2 0.24 4.3 326 30 Cultivar 10 NS NS NS NS NS Irrigation water × cultivar 10 NS NS NS NS NS NS Not significant at the 0.05 probability level. * Significant at the 0.05 probability level. Table 4.
Analysis of variance and means table for soil pH, electrical conductivity (EC), soil boron (B), sodium (Na), and chloride (Cl) concentrations on 11 perennial ryegrass cultivars under fresh versus effluent water summer irrigation at the conclusion of a two-year study in Corvallis, OR, USA.
-
Source of variation df B (ppm) Na (ppm) Cl (ppm) Pr > F Replication 2 NS NS NS Irrigation water 1 0.0568a ** * Fresh 15 874 5782 Effluent 21 7592 9506 Cultivar 10 * NS NS Irrigation water × cultivar 10 NS NS NS a Significant at the 0.1 probability level with a probability of 0.0568. NS Not significant at the 0.05 probability level. * Significant at the 0.05 probability level. Table 5.
Analysis of variance and means table for leaf tissue boron (B), sodium (Na), and chloride (Cl) concentrations on 11 perennial ryegrass cultivars under fresh versus effluent water summer irrigation at the conclusion of a two-year study in Corvallis, OR, USA.
-
Cultivar B (ppm)a Premium 22ABC Pillar 15BCD Pepper 18BCD Brightstar SLT 18BCD Estelle 8D Gray Fox 21ABC Allstar 3 29A Mighty 14BCD SR4660ST 18BCD Zoom 13CD Manhattan 6 23AB a Means followed by the same uppercase letter were not significantly different at the 0.05 probability level. Table 6.
Leaf tissue boron (B) concentrations for 11 perennial ryegrass cultivars at the conclusion of a two-year study in Corvallis, OR, USA. Mean values represent data points averaged across replication and irrigation water.
Figures
(1)
Tables
(6)