ARTICLE   Open Access    

Field evaluation of perennial ryegrass cultivars for use with effluent water irrigation

More Information
  • Fresh water is a scarce resource that needs to be conserved. Landscape irrigation, a large portion of the outdoor water use, can be accomplished with water of less-than-potable quality. The use of effluent water generated from residential graywater in landscapes would go a long way toward conserving potable water for other essential uses. The objectives of this study were to evaluate the effect of effluent versus fresh water irrigation on the performance of 11 lawn-height perennial ryegrass (Lolium perenne L.) cultivars in the Willamette Valley of Oregon, USA, and determine the effects of effluent water irrigation on soil and tissue analyses. A two-year field trial was established in October 2015 on native soil, and the experimental design was an 11 by 2 strip-plot design with three replications. Synthetic effluent water (water-softening salt, two laundry detergents, and a chelating agent) was applied twice-weekly over perennial ryegrass plots in the summers of 2016 and 2017 and compared to a freshwater control. Small reductions in turf color and density were observed with effluent water irrigation only in June and July of 2017. Our results suggest that effluent water is a viable alternative to freshwater irrigation in the Willamette Valley, where there is little to no precipitation during summer. However, the accumulation of Na, Cl, and B in the soil and plant tissue indicates that future research is warranted to determine any long-term effects from effluent water irrigation on turfgrass and soil health.
  • Aquaporin’s (AQPs) are small (21–34 kD) channel-forming, water-transporting trans-membrane proteins which are known as membrane intrinsic proteins (MIPs) conspicuously present across all kingdoms of life. In addition to transporting water, plant AQPs act to transport other small molecules including ammonia, carbon dioxide, glycerol, formamide, hydrogen peroxide, nitric acid, and some metalloids such as boron and silicon from the soil to different parts of the plant[1]. AQPs are typically composed of six or fewer transmembrane helices (TMHs) coupled by five loops (A to E) and cytosolic N- and C-termini, which are highly conserved across taxa[2]. Asparagine-Proline-Alanine (NPA) boxes and makeup helices found in loops B (cytosolic) and E (non-cytosolic) fold back into the protein's core to form one of the pore's two primary constrictions, the NPA region[1]. A second filter zone exists at the pore's non-cytosolic end, where it is called the aromatic/arginine (ar/R) constriction. The substrate selectivity of AQPs is controlled by the amino acid residues of the NPA and ar/R filters as well as other elements of the channel[1].

    To date, the AQP gene families have been extensively explored in the model as well as crop plants[39]. In seed plants, AQP distributed into five subfamilies based on subcellular localization and sequence similarities: the plasma membrane intrinsic proteins (PIPs; subgroups PIP1 and PIP2), the tonoplast intrinsic proteins (TIPs; TIP1-TIP5), the nodulin26-like intrinsic proteins (NIPs; NIP1-NIP5), the small basic intrinsic proteins (SIPs; SIP1-SIP2) and the uncategorized intrinsic proteins (XIPs; XIP1-XIP3)[2,10]. Among them, TIPs and PIPs are the most abundant and play a central role in facilitating water transport. SIPs are mostly found in the endoplasmic reticulum (ER)[11], whereas NIPs homologous to GmNod26 are localized in the peribacteroid membrane[12].

    Several studies reported that the activity of AQPs is regulated by various developmental and environmental factors, through which water fluxes are controlled[13]. AQPs are found in all organs such as leaves, roots, stems, flowers, fruits, and seeds[14,15]. According to earlier studies, increased AQP expression in transgenic plants can improve the plants' tolerance to stresses[16,17]. Increased root water flow caused by upregulation of root aquaporin expression may prevent transpiration[18,19]. Overexpression of Tamarix hispida ThPIP2:5 improved osmotic stress tolerance in Arabidopsis and Tamarix plants[20]. Transgenic tomatoes having apple MdPIP1;3 ectopically expressed produced larger fruit and improved drought tolerance[21]. Plants over-expressing heterologous AQPs, on the other hand, showed negative effects on stress tolerance in many cases. Overexpression of GsTIP2;1 from G. soja in Arabidopsis plants exhibited lower resistance against salt and drought stress[22].

    A few recent studies have started to establish a link between AQPs and nanobiology, a research field that has been accelerating in the past decade due to the recognition that many nano-substances including carbon-based materials are valuable in a wide range of agricultural, industrial, and biomedical activities[23]. Carbon nanotubes (CNTs) were found to improve water absorption and retention and thus enhance seed germination in tomatoes[24,25]. Ali et al.[26] reported that Carbon nanoparticles (CTNs) and osmotic stress utilize separate processes for AQP gating. Despite lacking solid evidence, it is assumed that CNTs regulate the aquaporin (AQPs) in the seed coats[26]. Another highly noticed carbon-nano-molecule, the fullerenes, is a group of allotropic forms of carbon consisting of pure carbon atoms[27]. Fullerenes and their derivatives, in particular the water-soluble fullerols [C60(OH)20], are known to be powerful antioxidants, whose biological activity has been reduced to the accumulation of superoxide and hydroxyl[28,29]. Fullerene/fullerols at low concentrations were reported to enhance seed germination, photosynthesis, root growth, fruit yield, and salt tolerance in various plants such as bitter melon and barley[3032]. In contrast, some studies also reported the phytotoxic effect of fullerene/fullerols[33,34]. It remains unknown if exogenous fullerene/fullerol has any impact on the expression or activity of AQPs in the cell.

    Garden pea (P. sativum) is a cool-season crop grown worldwide; depending on the location, planting may occur from winter until early summer. Drought stress in garden pea mainly affects the flowering and pod filling which harm their yield. In the current study, we performed a genome-wide identification and characterization of the AQP genes in garden pea (P. sativum), the fourth largest legume crop worldwide with a large complex genome (~4.5 Gb) that was recently decoded[35]. In particular, we disclose, for the first time to our best knowledge, that the transcriptional regulations of AQPs by osmotic stress in imbibing pea seeds were altered by fullerol supplement, which provides novel insight into the interaction between plant AQPs, osmotic stress, and the carbon nano-substances.

    The whole-genome sequence of garden pea ('Caméor') was retrieved from the URGI Database (https://urgi.versailles.inra.fr/Species/Pisum). Protein sequences of AQPs from two model crops (Rice and Arabidopsis) and five other legumes (Soybean, Chickpea, Common bean, Medicago, and Peanut) were used to identify homologous AQPs from the garden pea genome (Supplemental Table S1). These protein sequences, built as a local database, were then BLASTp searched against the pea genome with an E-value cutoff of 10−5 and hit a score cutoff of 100 to identify AQP orthologs. The putative AQP sequences of pea were additionally validated to confirm the nature of MIP (Supplemental Table S2) and transmembrane helical domains through TMHMM (www.cbs.dtu.dk/services/TMHMM/).

    Further phylogenetic analysis was performed to categorize the AQPs into subfamilies. The pea AQP amino acid sequences, along with those from Medicago, a cool-season model legume phylogenetically close to pea, were aligned through ClustalW2 software (www.ebi.ac.uk/Tools/msa/clustalw2) to assign protein names. The unaligned AQP sequences to Medicago counterparts were once again aligned with the AQP sequences of Arabidopsis, rice, and soybean. Based on the LG model, unrooted phylogenetic trees were generated via MEGA7 and the neighbor-joining method[36], and the specific name of each AQP gene was assigned based on its position in the phylogenetic tree.

    By using the conserved domain database (CDD, www.ncbi.nlm.nih.gov/Structure/cdd/cdd.shtml), the NPA motifs were identified from the pea AQP protein sequences[37]. The software TMHMM (www.cbs. dtu.dk/services/TMHMM/)[38] was used to identify the protein transmembrane domains. To determine whether there were any alterations or total deletion, the transmembrane domains were carefully examined.

    Basic molecular properties including amino acid composition, relative molecular weight (MW), and instability index were investigated through the online tool ProtParam (https://web.expasy.org/protparam/). The isoelectric points (pI) were estimated by sequence Manipulation Suite version 2 (www.bioinformatics.org/sms2)[39]. The subcellular localization of AQP proteins was predicted using Plant-mPLoc[40] and WoLF PSORT (www.genscript.com/wolf-psort.html)[ 41] algorithms.

    The gene structure (intron-exon organization) of AQPs was examined through GSDS ver 2.0[42]. The chromosomal distribution of the AQP genes was illustrated by the software MapInspect (http://mapinspect.software.informer.com) in the form of a physical map.

    To explore the tissue expression patterns of pea AQP genes, existing NGS data from 18 different libraries covering a wide range of tissue, developmental stage, and growth condition of the variety ‘Caméor’ were downloaded from GenBank (www.ncbi.nlm.nih.gov/bioproject/267198). The expression levels of the AQP genes in each tissue and growth stage/condition were represented by the FPKM (Fragments Per Kilobase of transcript per Million fragments mapped) values. Heatmaps of AQPs gene were generated through Morpheus software (https://software.broadinstitute.org/morpheus/#).

    Different solutions, which were water (W), 0.3 M mannitol (M), and fullerol of different concentrations dissolved in 0.3 M mannitol (MF), were used in this study. MF solutions with the fullerol concentration of 10, 50, 100, and 500 mg/L were denoted as MF1, MF2, MF3, and MF4, respectively. Seeds of 'SQ-1', a Chinese landrace accession of a pea, were germinated in two layers of filter paper with 30 mL of each solution in Petri dishes (12 cm in diameter) each solution, and the visual phenotype and radicle lengths of 150 seeds for each treatment were analyzed 72 h after soaking. The radicle lengths were measured using a ruler. Multiple comparisons for each treatment were performed using the SSR-Test method with the software SPSS 20.0 (IBM SPSS Statistics, Armonk, NY, USA).

    Total RNA was extracted from imbibing embryos after 12 h of seed soaking in the W, M, and MF3 solution, respectively, by using Trizol reagent (Invitrogen, Carlsbad, CA, USA). The quality and quantity of the total RNA were measured through electrophoresis on 1% agarose gel and an Agilent 2100 Bioanalyzer respectively (Agilent Technologies, Santa Rosa, USA). The TruSeq RNA Sample Preparation Kit was utilized to construct an RNA-Seq library from 5 µg of total RNA from each sample according to the manufacturer's instruction (Illumina, San Diego, CA, USA). Next-generation sequencing of nine libraries were performed through Novaseq 6000 platform (Illumina, San Diego, CA, USA).

    First of all, by using SeqPrep (https://github.com/jstjohn/SeqPrep) and Sickle (https://github.com/najoshi/sickle) the raw RNA-Seq reads were filtered and trimmed with default parameters. After filtering, high-quality reads were mapped onto the pea reference genome (https://urgi.versailles.inra.fr/Species/Pisum) by using TopHat (V2.1.0)[43]. Using Cufflinks, the number of mapped reads from each sample was determined and normalised to FPKM for each predicted transcript (v2.2.1). Pairwise comparisons were made between W vs M and W vs M+F treatments. The DEGs with a fold change ≥ 1.5 and false discovery rate (FDR) adjusted p-values ≤ 0.05 were identified by using Cuffdiff[44].

    qPCR was performed by using TOROGGreen® qPCR Master Mix (Toroivd, Shanghai, China) on a qTOWER®3 Real-Time PCR detection system (Analytik Jena, Germany). The reactions were performed at 95 °C for 60 s, followed by 42 cycles of 95 °C for 10 s and 60 °C for 30 s. Quantification of relative expression level was achieved by normalization against the transcripts of the housekeeping genes β-tubulin according to Kreplak et al.[35]. The primer sequences for reference and target genes used are listed in Supplemental Table S3.

    The homology-based analysis identifies 41 putative AQPs in the garden pea genome. Among them, all but two genes (Psat0s3550g0040.1, Psat0s2987g0040.1) encode full-length aquaporin-like sequences (Table 1). The conserved protein domain analysis later validated all of the expected AQPs (Supplemental Table S2). To systematically classify these genes and elucidate their relationship with the AQPs from other plants' a phylogenetic tree was created. It clearly showed that the AQPs from pea and its close relative M. truncatula formed four distinct clusters, which represented the different subfamilies of AQPs i.e. TIPs, PIPs, NIPs, and SIPs (Fig. 1a). However, out of the 41 identified pea AQPs, 4 AQPs couldn't be tightly aligned with the Medicago AQPs and thus were put to a new phylogenetic tree constructed with AQPs from rice, Arabidopsis, and soybean. This additional analysis assigned one of the 4 AQPs to the XIP subfamily and the rest three to the TIP or NIP subfamilies (Fig. 1b). Therefore, it is concluded that the 41 PsAQPs comprise 11 PsTIPs, 15 PsNIPs, 9 PsPIPs, 5 PsSIPs, and 1 PsXIP (Table 2). The PsPIPs formed two major subgroups namely PIP1s and PIP2s, which comprise three and six members, respectively (Table 1). The PsTIPs formed two major subgroups TIPs 1 (PsTIP1-1, PsTIP1-3, PsTIP1-4, PsTIP1-7) and TIPs 2 (PsTIP2-1, PsTIP2-2, PsTIP2-3, PsTIP2-6) each having four members (Table 2). Detailed information such as gene/protein names, accession numbers, the length of deduced polypeptides, and protein structural features are presented in Tables 1 & 2

    Table 1.  Description and distribution of aquaporin genes identified in the garden pea genome.
    Chromosome
    S. NoGene NameGene IDGene length
    (bp)
    LocationStartEndTranscription length (bp)CDS length
    (bp)
    Protein length
    (aa)
    1PsPIP1-1Psat5g128840.32507chr5LG3231,127,859231,130,365675675225
    2PsPIP1-2Psat2g034560.11963chr2LG149,355,95849,357,920870870290
    3PsPIP1-4Psat2g182480.11211chr2LG1421,647,518421,648,728864864288
    4PsPIP2-1Psat6g183960.13314chr6LG2369,699,084369,702,397864864288
    5PsPIP2-2-1Psat4g051960.11223chr4LG486,037,44686,038,668585585195
    6PsPIP2-2-2Psat5g279360.22556chr5LG3543,477,849543,480,4042555789263
    7PsPIP2-3Psat7g228600.22331chr7LG7458,647,213458,649,5432330672224
    8PsPIP2-4Psat3g045080.11786chr3LG5100,017,377100,019,162864864288
    9PsPIP2-5Psat0s3550g0040.11709scaffold0355020,92922,63711911191397
    10PsTIP1-1Psat3g040640.12021chr3LG589,426,47389,428,493753753251
    11PsTIP1-3Psat3g184440.12003chr3LG5393,920,756393,922,758759759253
    12PsTIP1-4Psat7g219600.12083chr7LG7441,691,937441,694,019759759253
    13PsTIP1-7Psat6g236600.11880chr6LG2471,659,417471,661,296762762254
    14PsTIP2-1Psat1g005320.11598chr1LG67,864,8107,866,407750750250
    15PsTIP2-2Psat4g198360.11868chr4LG4407,970,525407,972,392750750250
    16PsTIP2-3Psat1g118120.12665chr1LG6230,725,833230,728,497768768256
    17PsTIP2-6Psat2g177040.11658chr2LG1416,640,482416,642,139750750250
    18PsTIP3-2Psat6g054400.11332chr6LG254,878,00354,879,334780780260
    19PsTIP4-1Psat6g037720.21689chr6LG230,753,62430,755,3121688624208
    20PsTIP5-1Psat7g157600.11695chr7LG7299,716,873299,718,567762762254
    21PsNIP1-1Psat1g195040.21864chr1LG6346,593,853346,595,7161863645215
    22PsNIP1-3Psat1g195800.11200chr1LG6347,120,121347,121,335819819273
    23PsNIP1-5Psat7g067480.12365chr7LG7109,420,633109,422,997828828276
    24PsNIP1-6Psat7g067360.12250chr7LG7109,270,462109,272,711813813271
    25PsNIP1-7Psat1g193240.11452chr1LG6344,622,606344,624,057831831277
    26PsNIP2-1-2Psat3g197520.1669chr3LG5420,092,382420,093,050345345115
    27PsNIP2-2-2Psat3g197560.1716chr3LG5420,103,168420,103,883486486162
    28PsNIP3-1Psat2g072000.11414chr2LG1133,902,470133,903,883798798266
    29PsNIP4-1Psat7g126440.11849chr7LG7209,087,362209,089,210828828276
    30PsNIP4-2Psat5g230920.11436chr5LG3463,340,575463,342,010825825275
    31PsNIP5-1Psat6g190560.11563chr6LG2383,057,323383,058,885867867289
    32PsNIP6-1Psat5g304760.45093chr5LG3573,714,868573,719,9605092486162
    33PsNIP6-2Psat7g036680.12186chr7LG761,445,34161,447,134762762254
    34PsNIP6-3Psat7g259640.12339chr7LG7488,047,315488,049,653918918306
    35PsNIP7-1Psat6g134160.24050chr6LG2260,615,019260,619,06840491509503
    36PsSIP1-1Psat3g091120.13513chr3LG5187,012,329187,015,841738738246
    37PsSIP1-2Psat1g096840.13609chr1LG6167,126,599167,130,207744744248
    38PsSIP1-3Psat7g203280.12069chr7LG7401,302,247401,304,315720720240
    39PsSIP2-1-1Psat0s2987g0040.1706scaffold02987177,538178,243621621207
    40PsSIP2-1-2Psat3g082760.13135chr3LG5173,720,100173,723,234720720240
    41PsXIP2-1Psat7g178080.12077chr7LG7335,167,251335,169,327942942314
    bp: base pair, aa: amino acid.
     | Show Table
    DownLoad: CSV
    Figure 1.  Phylogenetic analysis of the identified AQPs from pea genome. (a) The pea AQPs proteins aligned with those from the cool-season legume Medicago truncatual. (b) The four un-assigned pea AQPs in (a) (denoted as NA) were further aligned with the AQPs of rice, soybean, and Arabidopsis by using the Clustal W program implemented in MEGA 7 software. The nomenclature of PsAQPs was based on homology with the identified aquaporins that were clustered together.
    Table 2.  Protein information, conserved amino acid residues, trans-membrane domains, selectivity filter, and predicted subcellular localization of the 39 full-length pea aquaporins.
    S. NoAQPsGeneLengthTMHNPANPAar/R selectivity filterpIWoLF PSORTPlant-mPLoc
    LBLEH2H5LE1LE2
    Plasma membrane intrinsic proteins (PIPs)
    1PsPIP1-1Psat5g128840.32254NPA0F0008.11PlasPlas
    2PsPIP1-2Psat2g034560.12902NPANPAFHTR9.31PlasPlas
    3PsPIP1-4Psat2g182480.12886NPANPAFHTR9.29PlasPlas
    4PsPIP2-1Psat6g183960.12886NPANPAFHT08.74PlasPlas
    5PsPIP2-2-1Psat4g051960.1195300FHTR8.88PlasPlas
    6PsPIP2-2-2Psat5g279360.22635NPANPAFHTR5.71PlasPlas
    7PsPIP2-3Psat7g228600.22244NPA0FF006.92PlasPlas
    8PsPIP2-4Psat3g045080.12886NPANPAFHTR8.29PlasPlas
    Tonoplast intrinsic proteins (TIPs)
    1PsTIP1-1Psat3g040640.12517NPANPAHIAV6.34PlasVacu
    2PsTIP1-3Psat3g184440.12536NPANPAHIAV5.02Plas/VacuVacu
    3PsTIP1-4Psat7g219600.12537NPANPAHIAV4.72VacuVacu
    4PsTIP1-7Psat6g236600.12546NPANPAHIAV5.48Plas/VacuVacu
    5PsTIP2-1Psat1g005320.12506NPANPAHIGR8.08VacuVacu
    6PsTIP2-2Psat4g198360.12506NPANPAHIGR5.94Plas/VacuVacu
    7PsTIP2-3Psat1g118120.12566NPANPAHIAL6.86Plas/VacuVacu
    8PsTIP2-6Psat2g177040.12506NPANPAHIGR4.93VacuVacu
    9PsTIP3-2Psat6g054400.12606NPANPAHIAR7.27Plas/VacuVacu
    10PsTIP4-1Psat6g037720.22086NPANPAHIAR6.29Vac/ plasVacu
    11PsTIP5-1Psat7g157600.12547NPANPANVGC8.2Vacu /plasVacu/Plas
    Nodulin-26 like intrisic proteins (NIPs)
    1PsNIP1-1Psat1g195040.22155NPA0WVF06.71PlasPlas
    2PsNIP1-3Psat1g195800.12735NPANPVWVAR6.77PlasPlas
    3PsNIP1-5Psat7g067480.12766NPANPVWVAN8.98PlasPlas
    4PsNIP1-6Psat7g067360.12716NPANPAWVAR8.65Plas/VacuPlas
    5PsNIP1-7Psat1g193240.12776NPANPAWIAR6.5Plas/VacuPlas
    6PsNIP2-1-2Psat3g197520.11152NPAOG0009.64PlasPlas
    7PsNIP2-2-2Psat3g197560.116230NPA0SGR6.51PlasPlas
    8PsNIP3-1Psat2g072000.12665NPANPASIAR8.59Plas/VacuPlas
    9PsNIP4-1Psat7g126440.12766NPANPAWVAR6.67PlasPlas
    10PsNIP4-2Psat5g230920.12756NPANPAWLAR7.01PlasPlas
    11PsNIP5-1Psat6g190560.12895NPSNPVAIGR7.1PlasPlas
    12PsNIP6-1Psat5g304760.41622NPA0I0009.03PlasPlas
    13PsNIP6-2Psat7g036680.1254000G0005.27ChloPlas/Nucl
    14PsNIP6-3Psat7g259640.13066NPANPVTIGR8.32PlasPlas
    15PsNIP7-1Psat6g134160.25030NLK0WGQR8.5VacuChlo/Nucl
    Small basic intrinsic proteins (SIPs)
    1PsSIP1-1Psat3g091120.12466NPTNPAVLPN9.54PlasPlas/Vacu
    2PsSIP1-2Psat1g096840.12485NTPNPAIVPL9.24VacuPlas/Vacu
    3PsSIP1-3Psat7g203280.12406NPSNPANLPN10.32ChloPlas
    4PsSIP2-1-2Psat3g082760.12404NPLNPAYLGS10.28PlasPlas
    Uncharacterized X intrinsic proteins (XIPs)
    1PsXIP2-1Psat7g178080.13146SPVNPAVVRM7.89PlasPlas
    Length: protein length (aa); pI: Isoelectric point; Trans-membrane helicase (TMH) represents for the numbers of Trans-membrane helices predicted by TMHMM Server v.2.0 tool; WoLF PSORT and Plant-mPLoc: best possible cellualr localization predicted by the WoLF PSORT and Plant-mPLoc tool, respectively (Chlo Chloroplast, Plas Plasma membrane, Vacu Vacuolar membrane, Nucl Nucleus); LB: Loop B, L: Loop E; NPA: Asparagine-Proline-Alanine; H2 represents for Helix 2, H5 represents for Helix 5, LE1 represents for Loop E1, LE2 represents for Loop E2, Ar/R represents for Aromatic/Arginine.
     | Show Table
    DownLoad: CSV

    To understand the genome distribution of the 41 PsAQPs, we mapped these genes onto the seven chromosomes of a pea to retrieve their physical locations (Fig. 2). The greatest number (10) of AQPs were found on chromosome 7, whereas the least (2) on chromosome 4 (Fig. 2 and Table 1). Chromosomes 1 and 6 each contain six aquaporin genes, whereas chromosomes 2, 3, and 5 carry four, seven, and four aquaporin genes, respectively (Fig. 2). The trend of clustered distribution of AQPs was seen on specific chromosomes, particularly near the end of chromosome 7.

    Figure 2.  Chromosomal localization of the 41 PsAQPs on the seven chromosomes of pea. Chr1-7 represents the chromosomes 1 to 7. The numbers on the right of each chromosome show the physical map positions of the AQP genes (Mbp). Blue, green, orange, brown, and black colors represent TIPs, NIPs, PIPs, SIPs, and XIP, respectively.

    The 39 full-length PsAQP proteins have a length of amino acid ranging from 115 to 503 (Table 1) and Isoelectric point (pI) values ranging from 4.72 to 10.35 (Table 2). As a structural signature, transmembrane domains were predicted to exist in all PsAQPs, with the number in individual AQPs varying from 2 to 6. By subfamilies, TIPs harbor the greatest number of TM domains in total, followed by PIPs, NIPs, SIPs, and XIP (Table 2). Exon-intron structure analysis showed that most PsAQPs (16/39) having two introns, while ten members had three, seven members had four, and five members had only one intron (Fig. 3). Overall, PsAQPs exhibited a complex structure with varying intron numbers, positions, and lengths.

    Figure 3.  The exon-intron structures of the AQP genes in pea. Upstream/downstream region, exon, and intron are represented by a blue box, yellow box, and grey line, respectively.

    As aforementioned, generally highly conserved two NPA motifs generate an electrostatic repulsion of protons in AQPs to form the water channel, which is essential for the transport of substrate molecules[15]. In order to comprehend the potential physiological function and substrate specificity of pea aquaporins, NPA motifs (LB, LE) and residues at the ar/R selectivity filter (H2, H5, LE1, and LE2) were examined. (Table 2). We found that all PsTIPs and most PsPIPs had two conserved NPA motifs except for PsPIP1-1, PsPIP2-2-1, and PsPIP2-3, each having a single NPA motif. Among PsNIPs, PsNIP1-6, PsNIP1-6, PsNIP1-7, PsNIP3-1, PsNIP4-1 and PSNIP4-2 had two NPA domains, while PsNIP1-1, PsNIP2-1-2, PsNIP2-2-2 and PsNIP6-1 each had a single NPA motif. In the PsNIP sub-family, the first NPA motif showed an Alanine (A) to Valine (V) substitution in three PsNIPs (PsNIP1-3, PsNIP1-5, and PsNIP6-3) (Table 2). Furthermore, the NPA domains of all members of the XIP and SIP subfamilies were different. The second NPA motif was conserved in PsSIP aquaporins, however, all of the first NPA motifs had Alanine (A) replaced by Leucine (L) (PsSIP2-1-1, PsSIP2-1-2) or Threonine (T) (PsSIP1-1). In comparison to other subfamilies, this motif variation distinguishes water and solute-transporting aquaporins[45].

    Compared to NPA motifs, the ar/R positions were more variable and the amino acid composition appeared to be subfamily-dependent. The majority of PsPIPs had phenylalanine at H2, histidine at H5, threonine at LE1, and arginine at LE2 selective filter (Table 2). All of the PsTIP1 members had a Histidine-Isoleucine-Alanine-Valine structure at this position, while all PsTIP2 members but PsTIP2-3 harbored Histidine-Isoleucine-Glycine-Arginine. Similarly, PsNIPs, PsSIPs and PsXIP also showed subgroup-specific variation in ar/R selectivity filter (Table 2). Each of these substitutions partly determines the function of transporting water[46].

    Sequence-based subcellular localization analysis using WoLF PSORT predicted that all PsPIPs localized in the plasma membrane, which is consistent with their subfamily classification (Table 2). Around half (5/11) of the PsTIPs (PsTIP1-4, PsTIP2-1, PsTIP2-6, PsTIP4-1, and PsTIP5-1) were predicted to localize within vacuoles. However, several TIP members (PsTIP1-1, PsTIP1-3, PsTIP1-7, PsTIP2-2, PsTIP2-3 and PsTIP3-2) were predicted to localize in plasma membranes. We then further investigated their localizations by using another software (Plant-mPLoc, Table 2), which predicted that all the PsTIPs localize within vacuoles, thus supporting that they are tonoplast related. An overwhelming majority of PsNIPs (14/15) and PsXIP were predicted to be found only in plasma membranes., which was also expected (Table 2). Collectively, the versatility in subcellular localization of the pea AQPs is implicative of their distinct roles in controlling water and/or solute transport in the context of plant cell compartmentation.

    Tissue expression patterns of genes are indicative of their functions. Since there were rich resources of RNA-Seq data from various types of pea tissues in the public database, they were used for the extraction of expression information of PsAQP genes as represented by FPKM values. A heat map was generated to show the expression patterns of PsAQP genes in 18 different tissues/stages and their responses to nitrate levels (Fig. 4). According to the heat map, PsPIP1-2, PsPIP2-3 were highly expressed in root and nodule G (Low-nitrate), whereas PsTIP1-4, PsTIP2-6, and PsNIP1-7 were only expressed in roots in comparison to other tissues. The result also demonstrated that PsPIP1-1 and PsNIP3-1 expressed more abundantly in leaf, tendril, and peduncle, whereas PsPIP2-2-2 and PsTIP1-1 showed high to moderate expressions in all the samples except for a few. Interestingly, PsTIP1-1 expression in many green tissues seemed to be oppressed by low-nitrate. In contrast, some AQPs such as PsTIP1-3, PsTIP1-7, PsTIP5-1, PsNIP1-5, PsNIP4-1, PsNIP5-1, and PsSIP2-1-1 showed higher expression only in the flower tissue. There were interesting developmental stage-dependent regulations of some AQPs in seeds (Fig. 4). For example, PsPIP2-1, PsPIP2-2-1, PsNIP1-6, PsSIP1-1, and PsSIP1-2 were more abundantly expressed in the Seed_12 dap (days after pollination;) tissue than in the Seed_5 dai (days after imbibition) tissue; reversely, PsPIP2-2-2, PsPIP2-4, PsTIP2-3, and PsTIP3-2 showed higher expression in seed_5 dai in compare to seed_12 dap tissues (Fig. 4). The AQP genes may have particular functional roles in the growth and development of the pea based on their tissue-specific expression.

    Figure 4.  Heatmap analysis of the expression of pea AQP gene expressions in different tissues using RNA-seq data (PRJNA267198). Normalized expression of aquaporins in terms of reads per kilobase of transcript per million mapped reads (RPKM) showing higher levels of PIPs, NIPs, TIPs SIPs, and XIP expression across the different tissues analyzed. (Stage A represents 7-8 nodes; stage B represents the start of flowering; stage D represents germination, 5 d after imbibition; stage E represents 12 d after pollination; stage F represents 8 d after sowing; stage G represents 18 d after sowing, LN: Low-nitrate; HN: High-nitrate.

    Expressions of plant AQPs in vegetative tissues under normal and stressed conditions have been extensively studied[15]; however, little is known about the transcriptional regulation of AQP genes in seeds/embryos. To provide insights into this specific area, wet-bench RNA-Seq was performed on the germinating embryo samples isolated from water (W)-imbibed seeds and those treated with mannitol (M, an osmotic reagent), mannitol, and mannitol plus fullerol (F, a nano-antioxidant). The phenotypic evaluation showed that M treatment had a substantial inhibitory effect on radicle growth, whereas the supplement of F significantly mitigated this inhibition at all concentrations, in particular, 100 mg/mL in MF3, which increased the radicle length by ~33% as compared to that under solely M treatment (Fig. 5). The expression values of PsAQP genes were removed from the RNA-Seq data, and pairwise comparisons were made within the Group 1: W vs M, and Group 2: W vs MF3, where a total of ten and nince AQPs were identified as differentially expressed genes (DEGs), respectively (Fig. 6). In Group 1, six DEGs were up-regulated and four DEGs down-regulated, whereas in Group 2, six DEGs were up-regulated and three DEGs down-regulated. Four genes viz. PsPIPs2-5, PsNIP6-3, PsTIP2-3, and PsTIP3-2 were found to be similarly regulated by M or MF3 treatment (Fig. 6), indicating that their regulation by osmotic stress couldn't be mitigated by fullerol. Three genes, all being PsNIPs (1-1, 2-1-2, and 4-2), were up-regulated only under mannitol treatment without fullerol, suggesting that their perturbations by osmotic stress were migrated by the antioxidant activities. In contrast, four other genes namely PsTIP2-2, PsTIP4-1, PsNIP1-5, and PsSIP1-3 were only regulated under mannitol treatment when fullerol was present.

    Figure 5.  The visual phenotype and radicle length of pea seeds treated with water (W), 0.3 M mannitol (M), and fullerol of different concentrations dissolved in 0.3 M mannitol (MF). MF1, MF2, MF3, and MF4 indicated fullerol dissolved in 0.3 M mannitol at the concentration of 10, 50, 100, and 500 mg/L, respectively. (a) One hundred and fifty grains of pea seeds each were used for phenotype analysis at 72 h after treatment. Radicle lengths were measured using a ruler in three replicates R1, R2, and R3 in all the treatments. (b) Multiple comparison results determined using the SSR-Test method were shown with lowercase letters to indicate statistical significance (P < 0.05).
    Figure 6.  Venn diagram showing the shared and unique differentially expressed PsAQP genes in imbibing seeds under control (W), Mannitol (M) and Mannitol + Fullerol (MF3) treatments. Up-regulation (UG): PsPIP2-5, PsNIP1-1, PsNIP2-1-2, PsNIP4-2, PsNIP6-3, PsNIP1-5, PsTIP2-2, PsTIP4-1, PsSIP1-3, PsXIP2-1; Down-regulation (DG): PsTIP2-3, PsTIP3-2, PsNIP1-7, PsNIP5-1, PsXIP2-1.

    As a validation of the RNA-Seq data, eight genes showing differential expressions in imbibing seeds under M or M + F treatments were selected for qRT-PCR analysis, which was PsTIP4-1, PsTIP2-2, PsTIP2-3, PsTIP3-2, PsPIP2-5, PsXIP2-1, PsNIP6-3 and PsNIP1-5 shown in Fig 6, the expression modes of all the selected genes but PsXIP2-1 were well consistent between the RNA-Seq and the qRT-PCR data. PsXIP2-1, exhibiting slightly decreased expression under M treatment according to RNA-Seq, was found to be up-regulated under the same treatment by qRT-PCR (Fig. 7). This gene was therefore removed from further discussions.

    Figure 7.  The expression patterns of seven PsAQPs in imbibing seeds as revealed by RNA-Seq and qRT-PCR. The seeds were sampled after 12 h soaking in three different solutions, namely water (W), 0.3 M mannitol (M), and 100 mg/L fullerol dissolved in 0.3 M mannitol (MF3) solution. Error bars are standard errors calculated from three replicates.

    This study used the recently available garden pea genome to perform genome-wide identification of AQPs[35] to help understand their functions in plant growth and development. A total of 39 putative full-length AQPs were found in the garden pea genome, which is very similar to the number of AQPs identified in many other diploid legume crops such as 40 AQPs genes in pigeon pea, chickpea, common bean[7,47,48], and 44 AQPs in Medicago[49]. On the other hand, the number of AQP genes in pea is greater compared to diploid species like rice (34)[4], Arabidopsis thaliana (35)[3], and 32 and 36 in peanut A and B genomes, respectively[8]. Phylogenetic analysis assigned the pea AQPs into all five subfamilies known in plants, whereas the presence of only one XIP in this species seems less than the number in other diploid legumes which have two each in common bean and Medicago[5,48,49]. The functions of the XIP-type AQP will be of particular interest to explore in the future.

    The observed exon-intron structures in pea AQPs were found to be conserved and their phylogenetic distribution often correlated with these structures. Similar exon-intron patterns were seen in PIPs and TIPs subfamily of Arabidopsis, soybean, and tomato[3,6,50]. The two conserved NPA motifs and the four amino acids forming the ar/R SF mostly regulate solute specificity and transport of the substrate across AQPs[47,51]. According to our analysis, all the members of each AQP subfamilies in garden pea showed mostly conserved NPA motifs and a similar ar/R selective filter. Interestingly, most PsPIPs carry double NPA in LB and LE and a hydrophilic ar/R SF (F/H/T/R) as observed in three legumes i.e., common bean[48], soybean[5] chickpea[7], showing their affinity for water transport. All the TIPs of garden pea have double NPA in LB and LE and wide variation at selectivity filters. Most PsTIP1s (1-1, 1-3, 1-4, and 1-7) were found with H-I-A-V ar/R selectivity filter similar to other species such as Medicago, Arachis, and common bean, that are reported to transport water and other small molecules like boron, hydrogen peroxide, urea, and ammonia[52]. Compared with related species, the TIPs residues in the ar/R selectivity filter were very similar to those in common bean[48], Medicago[49], and Arachis[8]. In the present study, the NIPs, NIP1s (1-3, 1-5, 1-6, and1-7), and NIP2-2-2 genes have G-S-G-R selectivity. Interestingly, NIP2s with a G-S-G-R selectivity filter plays an important role in silicon influx (Si) in many plant species such as Soybean and Arachis[6,8]. It was reported that Si accumulation protects plants against various types of biotic and abiotic stresses[53].

    The subcellular localization investigation suggested that most of the PsAQPs were localized to the plasma membrane or vacuolar membrane. The members of the PsPIPs, PsNIPs, and PsXIP subfamilies were mostly located in the plasma membrane, whereas members of the PsTIPs subfamily were often predicted to localize in the vacuolar membrane. Similar situations were reported in many other legumes such as common bean, soybean, and chickpea[5,7,48]. Apart from that, PsSIPs subfamily were predicted to localize to the plasma membrane or vacuolar membrane, and some AQPs were likely to localize in broader subcellular positions such as the nucleus, cytosol, and chloroplast, which indicates that AQPs may be involved in various molecular transport functions.

    AQPs have versatile physiological functions in various plant organs. Analysis of RNA-Seq data showed a moderate to high expression of the PsPIPs in either root or green tissues except for PsPIP2-4, indicating their affinity to water transport. In several other species such as Arachis[8], common bean[48], and Medicago[49], PIPs also were reported to show high expressions and were considered to play an important role to maintain root and leaf hydraulics. Also interestingly, PsTIP2-3 and PsTIP3-2 showed high expressions exclusively in seeds at 5 d after imbibition, indicating their specific roles in seed germination. Earlier, a similar expression pattern for TIP3s was reported in Arabidopsis during the initial phase of seed germination and seed maturation[54], soybean[6], canola[55], and Medicago[49], suggesting that the main role of TIP3s in regulating seed development is conserved across species.

    Carbon nanoparticles such as fullerol have a wide range of potential applications as well as safety concerns in agriculture. Fullerol has been linked to plant protection from oxidative stress by influencing ROS accumulation and activating the antioxidant system in response to drought[56]. The current study revealed that fullerol at an adequate concentration (100 mg/L), had favorable effects on osmotic stress alleviation. In this study, the radical growth of germinating seeds was repressed by the mannitol treatment, and many similar observations have been found in previous studies[57]. Furthermore, mannitol induces ROS accumulation in plants, causing oxidative stress[58]. Our work further validated that the radical growth of germinating seeds were increased during fullerol treatment. Fullerol increased the length of roots and barley seeds, according to Panova et al.[32]. Fullerol resulted in ROS detoxification in seedlings subjected to water stress[32].

    Through transcriptomic profiling and qRT-PCR, several PsAQPs that responded to osmotic stress by mannitol and a combination of mannitol and fullerol were identified. Most of these differentially expressed AQPs belonged to the TIP and NIP subfamilies. (PsTIP2-2, PsTIP2-3, and PsTIP 3-2) showed higher expression by mannitol treatment, which is consistent with the fact that many TIPs in other species such as GmTIP2;3 and Eucalyptus grandis TIP2 (EgTIP2) also showed elevated expressions under osmotic stress[54,59]. The maturation of the vacuolar apparatus is known to be aided by the TIPs, which also enable the best possible water absorption throughout the growth of embryos and the germination of seeds[60]. Here, the higher expression of PsTIP (2-2, 2-3, and 3-2) might help combat water deficiency in imbibing seeds due to osmotic stress. The cellular signals triggering such transcriptional regulation seem to be independent of the antioxidant system because the addition of fullerol didn’t remove such regulation. On the other hand, the mannitol-induced regulation of most PsNIPs were eliminated when fullerol was added, suggesting either a response of these NIPs to the antioxidant signals or being due to the mitigated cellular stress. Based on our experimental data and previous knowledge, we propose that the fullerol-induced up- or down-regulation of specific AQPs belonging to different subfamilies and locating in different subcellular compartments, work coordinatedly with each other, to maintain the water balance and strengthen the tolerance to osmotic stress in germinating pea seeds through reduction of ROS accumulation and enhancement of antioxidant enzyme levels. Uncategorized X intrinsic proteins (XIPs) Aquaporins are multifunctional channels that are accessible to water, metalloids, and ROS.[32,56]. Due likely to PCR bias, the expression data of PsXIP2-1 from qRT-PCR and RNA-Seq analyses didn’t match well, hampering the drawing of a solid conclusion about this gene. Further studies are required to verify and more deeply dissect the functions of each of these PsAQPs in osmotic stress tolerance.

    A total of 39 full-length AQP genes belonging to five sub-families were identified from the pea genome and characterized for their sequences, phylogenetic relationships, gene structures, subcellular localization, and expression profiles. The number of AQP genes in pea is similar to that in related diploid legume species. The RNA-seq data revealed that PsTIP (2-3, 3-2) showed high expression in seeds for 5 d after imbibition, indicating their possible role during the initial phase of seed germination. Furthermore, gene expression profiles displayed that higher expression of PsTIP (2-3, 3-2) in germinating seeds might help maintain water balance under osmotic stress to confer tolerance. Our results suggests that the biological functions of fullerol in plant cells are exerted partly through the interaction with AQPs.

    Under Bio project ID PRJNA793376 at the National Center for Biotechnology Information, raw data of sequencing read has been submitted. The accession numbers for the RNA-seq raw data are stored in GenBank and are mentioned in Supplemental Table S4.

    This study is supported by the National Key Research & Development Program of China (2022YFE0198000) and the Key Research Program of Zhejiang Province (2021C02041).

  • Pei Xu is the Editorial Board member of journal Vegetable Research. He was blinded from reviewing or making decisions on the manuscript. The article was subject to the journal's standard procedures, with peer-review handled independently of this Editorial Board member and his research group.

  • [1]

    Liu J, Yang H, Gosling SN, Kummu M, Flörke M, et al. 2017. Water scarcity assessments in the past, present, and future. Earth's Future 5:545−59

    doi: 10.1002/2016EF000518

    CrossRef   Google Scholar

    [2]

    U. S. Environmental Protection Agency. 2013. Reduce your outdoor water use. https://19january2017snapshot.epa.gov/www3/watersense/docs/factsheet_outdoor_water_use_508.pdf

    [3]

    Skiles DJ. 2010. Changes in golf course fairway soils under effluent water irrigation. Thesis. Colorado State University. 108 pp.

    [4]

    Steppuhn H, van Genuchten MT, Grieve CM. 2005. Root-zone salinity: II. Indices for tolerance in agricultural crops. Crop Science 45:221−32

    doi: 10.2135/cropsci2005.0221

    CrossRef   Google Scholar

    [5]

    Harivandi MA. 2000. Irrigating turfgrass and landscape plants with municipal recycled water. Acta Horticulturae 537:697−703

    doi: 10.17660/actahortic.2000.537.82

    CrossRef   Google Scholar

    [6]

    National Research Council. 2012. Water reuse: potential for expanding the nation's water supply through reuse of municipal wastewater. Washington, DC: National Academies Press. 276 pp. https://doi.org/10.17226/13303

    [7]

    Ayars JE, Schoneman RA. 2006. Irrigating field crops in the presence of saline groundwater. Irrigation and Drainage 55:265−79

    doi: 10.1002/ird.258

    CrossRef   Google Scholar

    [8]

    Koch MJ, Bonos SA. 2011. Salinity tolerance of cool-season turfgrass cultivars under field conditions. Applied Turfgrass Science 8:1−11

    doi: 10.1094/ats-2011-0725-01-rs

    CrossRef   Google Scholar

    [9]

    Koch MJ, Meyer WA, Bonos SA. 2015. Inheritance of salinity tolerance in perennial ryegrass. Crop Science 55:1834−42

    doi: 10.2135/cropsci2014.11.0791

    CrossRef   Google Scholar

    [10]

    Meyer WA, Hoffman L, Bonos SA. 2017. Breeding cool-season turfgrass cultivars for stress tolerance and sustainability in a changing environment. International Turfgrass Society Research Journal 13:3−10

    doi: 10.2134/itsrj2016.09.0806

    CrossRef   Google Scholar

    [11]

    Rose-Fricker C, Wipff JK, III. 2001. Breeding for salt tolerance in cool-season turfgrasses. International Turfgrass Society Research Journal 9:206−12

    Google Scholar

    [12]

    Negahban-Azar M, Sharvelle SE, Qian Y, Shogbon A. 2013. Leachability of chemical constituents in soil–plant systems irrigated with synthetic graywater. Environmental Science: Processes & Impacts 15:760−72

    doi: 10.1039/C3EM30685B

    CrossRef   Google Scholar

    [13]

    Lin Y, Qian Y. 2019. Mineral composition of Kentucky bluegrass under recycled water irrigation on golf courses. HortScience 54:357−61

    doi: 10.21273/HORTSCI13650-18

    CrossRef   Google Scholar

    [14]

    Krishnan S, Brown RN. 2009. Na+ and K+ accumulation in perennial ryegrass and red fescue accessions differing in salt tolerance. International Turfgrass Society 11:817−27

    Google Scholar

    [15]

    Castro E, Mañas MP, De Las Heras J. 2011. Effects of wastewater irrigation on soil properties and turfgrass growth. Water Science and Technology 63:1678−88

    doi: 10.2166/wst.2011.335

    CrossRef   Google Scholar

    [16]

    Mazur AR, Rice JS. 1999. Impact of overseeding bermudagrass with various amounts of perennial ryegrass for winter putting turf. HortScience 34:864−66

    doi: 10.21273/HORTSCI.34.5.864

    CrossRef   Google Scholar

    [17]

    U. S. Climate Data. Climate Corvallis - Oregon and Weather Averages Corvallis. 1981−2010. https://www.usclimatedata.com/climate/corvallis/oregon/united-states/usor0076

    [18]

    Olsen C, Kowalewski A, Gould M, Lambrinos J. 2017. Evaluating two rainwater harvesting systems in an urban setting in Oregon's Willamette Valley. Journal of Green Building 12:1−10

    doi: 10.3992/1552-6100.12.1.1

    CrossRef   Google Scholar

    [19]

    Shaw DA, Chang AC, Gibeault VA, McMaster M, Oster JD, et al. 1995. Agronomic study of the use of reclaimed water for irrigation of turfgrass and landscape plant materials. Phase II final report to Metropolitan Wastewater Department. University of California Cooperative Extension, San Diego, CA

    [20]

    Matlock M, Whipple R, Shaw R. 2019. Just for the turf of it: turf replacement as a water conservation tool. Journal of Soil and Water Conservation 74:449−55

    doi: 10.2489/jswc.74.5.449

    CrossRef   Google Scholar

    [21]

    Pincetl S, Gillespie TW, Pataki DE, Porse E, Jia S, et al. 2019. Evaluating the effects of turf-replacement programs in Los Angeles. Landscape and Urban Planning 185:210−21

    doi: 10.1016/j.landurbplan.2019.01.011

    CrossRef   Google Scholar

    [22]

    Sovocool KA, Morgan M, Bennett D. 2006. An in-depth investigation of Xeriscape as a water conservation measure. Journal AWWA 98:82−93

    doi: 10.1002/j.1551-8833.2006.tb07590.x

    CrossRef   Google Scholar

    [23]

    Zhang X, Khachatryan H. 2021. Interactive effects of homeowners' environmental concerns and rebate incentives on preferences for low-input residential landscapes. Urban Forestry & Urban Greening 65:127322

    doi: 10.1016/j.ufug.2021.127322

    CrossRef   Google Scholar

    [24]

    Braun RC, Bremer DJ, Ebdon JS, Fry JD, Patton AJ. 2022. Review of cool-season turfgrass water use and requirements: II. Responses to drought stress. Crop Science 62:1685−701

    doi: 10.1002/csc2.20790

    CrossRef   Google Scholar

    [25]

    Isweiri H, Qian Y, Davis JG. 2022. Comparison of fresh versus effluent water irrigation on soil chemical properties of golf course greens and fairways. International Turfgrass Society Research Journal 14:182−93

    doi: 10.1002/its2.42

    CrossRef   Google Scholar

    [26]

    Harivandi MA, Marcum KB, Qian Y. 2008. Recycled, gray, and saline water irrigation for turfgrass. In Water Quality and Quantity Issues for Turfgrasses in Urban Landscapes, eds. Beard JB, Kenna MP. Ames, Iowa: Council for Agricultural Science and Technology. pp. 243−57. https://www.cast-science.org/wp-content/uploads/2008/03/CAST-SP27_Water-Quality-and-Quantity-Issues-in-Turfgrass.pdf

    [27]

    Christians NE, Engelke MC. 1994. Choosing the right grass to fit the environment. In Handbook of Integrated Pest Management for Turf and Ornamentals, ed. Lesley AR. Boca Raton, FL: CRC Press. pp. 99−113. https://doi.org/10.1201/9780138752798-13

    [28]

    Butler JD, Hodges TK. 1967. Mineral composition of turfgrass. HortScience 2:62−63

    doi: 10.21273/HORTSCI.2.2.62

    CrossRef   Google Scholar

    [29]

    Oertli JJ, Lunt OR, Youngner VB. 1961. Boron toxicity in several turfgrass species. Agronomy Journal 53:262−65

    doi: 10.2134/agronj1961.00021962005300040017x

    CrossRef   Google Scholar

    [30]

    Oster JD, Singer MJ, Fulton A, Richardson W, Prichard T. 1992. Water penetration problems in California soils. Kearny Foundation of Soil Science, Division of Agriculture and Natural Resources, University of California, Davis. 165 pp.

    [31]

    Westcot DW, Ayers RS. 1985. Irrigation water quality criteria. In Irrigation With Reclaimed Municipal Wastewater - A Guidance Manual, ed. GS Pettygrove, T Asano. Boca Raton: CRC Press. pp. 1−37. https://doi.org/10.1201/9781351073905-3

  • Cite this article

    Wang R, Olsen CJ, Gould MA, Kowalewski AR. 2023. Field evaluation of perennial ryegrass cultivars for use with effluent water irrigation. Grass Research 3:23 doi: 10.48130/GR-2023-0023
    Wang R, Olsen CJ, Gould MA, Kowalewski AR. 2023. Field evaluation of perennial ryegrass cultivars for use with effluent water irrigation. Grass Research 3:23 doi: 10.48130/GR-2023-0023

Figures(1)  /  Tables(6)

Article Metrics

Article views(3028) PDF downloads(421)

ARTICLE   Open Access    

Field evaluation of perennial ryegrass cultivars for use with effluent water irrigation

Grass Research  3 Article number: 23  (2023)  |  Cite this article

Abstract: Fresh water is a scarce resource that needs to be conserved. Landscape irrigation, a large portion of the outdoor water use, can be accomplished with water of less-than-potable quality. The use of effluent water generated from residential graywater in landscapes would go a long way toward conserving potable water for other essential uses. The objectives of this study were to evaluate the effect of effluent versus fresh water irrigation on the performance of 11 lawn-height perennial ryegrass (Lolium perenne L.) cultivars in the Willamette Valley of Oregon, USA, and determine the effects of effluent water irrigation on soil and tissue analyses. A two-year field trial was established in October 2015 on native soil, and the experimental design was an 11 by 2 strip-plot design with three replications. Synthetic effluent water (water-softening salt, two laundry detergents, and a chelating agent) was applied twice-weekly over perennial ryegrass plots in the summers of 2016 and 2017 and compared to a freshwater control. Small reductions in turf color and density were observed with effluent water irrigation only in June and July of 2017. Our results suggest that effluent water is a viable alternative to freshwater irrigation in the Willamette Valley, where there is little to no precipitation during summer. However, the accumulation of Na, Cl, and B in the soil and plant tissue indicates that future research is warranted to determine any long-term effects from effluent water irrigation on turfgrass and soil health.

    • Population growth and urbanization have resulted in increasing water demand and consequently accelerating fresh water scarcity[1]. On average, 320 gallons of water were used per day per household in the USA[2]. Reusing residential graywater could substantially reduce or eliminate the use of fresh water for landscape irrigation. Reclaimed wastewater has been used to irrigate turfgrass and proven to be effective in situations where transportation of the water is reasonable and soils are capable[3,4]. A large portion of residential graywater can be reclaimed for direct use at the local level; however, concerns over its reliability with regard to chemical composition have prevented the implementation of effluent water use on a national or global scale[5,6].

      The major concern regarding recycled graywater (effluent water) use is due to its high salt content[5] which can cause salinity stress and ion stress or toxicity. It is well documented that saline soil conditions have detrimental effects on turfgrasses and other crops[4,7]. Turfgrass breeders have been working for decades to identify and breed salt-tolerant turfgrass species and cultivars to combat the issue of elevated salinity from effluent and gray water sources[811]. In addition to salinity, the boron (B), sodium (Na), and chloride (Cl) can build up in the soil and plant tissue which are potentially toxic to turfgrasses, therefore, their levels need to be monitored when using recycled or graywater irrigation[1215]. As more and more areas of the world are experiencing issues related to water scarcity, identifying turfgrass species and cultivars that perform well under effluent water are critically important for improving the sustainability of turfgrass[10]. Perennial ryegrass (Lolium perenne L.) is a commonly used cool-season turfgrass in lawns, athletic fields, and golf courses, and it is also widely used for overseeding in warm-season grass during the winter season[16]. This study was designed to subject 11 lawn-height perennial ryegrass cultivars to summer effluent water irrigation in the Willamette Valley of Oregon (USA) where summer precipitation is scarce. The goals were to evaluate turfgrass performance and determine soil chemical properties and plant tissue B, Na, and Cl under effluent water irrigation compared to freshwater irrigation.

    • A field study was conducted at Lewis-Brown Horticulture Farm in Corvallis, OR, USA on a Chehalis silty clay loam soil. Corvallis is located in the Willamette Valley, OR, USA and has a warm-summer Mediterranean climate (Csb) according to the Köppen-Geiger climate classification with wet winters and warm, dry summers. The weather data during the study period is provided in Table 1. The average annual precipitation in Corvallis is 108.5 cm, which occurs almost exclusively in a nine-month period from autumn to spring[17], therefore, irrigation with harvested rainwater[18] and residential effluent water are viable alternatives to using the limited potable water resources for urban lawns in Corvallis or regions with a similar climate. Perennial ryegrass cultivars were sown at the rate of 54 g·m−2 to ensure uniform establishment on research plots, and a 25-3-10 (N-P-K) fertilizer (Wil-Gro 5 Iron, Wilbur-Ellis Company, Aurora, CO, USA) was applied at a rate of 100 kg·N·ha−1 at seeding on 12 October 2015.

      Table 1.  Corvallis, OR, USA weather data obtained from Bureau of Reclamation Hydromet/AgriMet System.

      Month-yearEvapotranspiration
      (mm)
      Precipitation
      (mm)
      Mean temperature
      (°C)
      Max temperature
      (°C)
      Min temperature
      (°C)
      Mar-16561889.112.75.3
      Apr-161047612.319.48.1
      May-161502014.719.611.6
      Jun-162031317.226.311.4
      Jul-162261018.924.315.4
      Aug-16244320.629.415.1
      Sep-161351516.121.310.9
      Mar-17461808.612.82.7
      Apr-1779899.612.86.8
      May-171454114.323.28.7
      Jun-171833817.228.111.1
      Jul-17254019.924.717.3
      Aug-17224521.329.617.2
      Sep-171305117.924.211.1

      Experimental design was an 11 by 2 strip-plot organized as a randomized complete block design with three replications conducted over two years. Factors included 11 perennial ryegrass cultivars and fresh (control) versus effluent water summer irrigation. The 11 perennial ryegrass cultivars were 'Premium', 'Pillar', 'Pepper', 'Brightstar SLT', 'Estelle', 'Gray Fox', 'Allstar 3', 'Mighty', 'SR4660ST', 'Zoom', and 'Manhattan 6'. These cultivars were commercially produced by local companies in the Willamette Valley at the time the experiment was initiated. The sub-plot size was 2.3 m2. Effluent water treatment was applied twice weekly in June, July, August, and September in 2016 and 2017. Synthetic effluent water was manufactured for this experiment using a mass of constituents of Na, Cl, and B concentrations found in effluent-quality wastewater used for irrigation of the Heritage Golf Course, Westminster, CO, USA[3] and Whispering Palms turfgrass study, Davis, CA, USA[19]. To achieve these values of B, Na, and Cl for this experiment, water softener coarse salt (NaCl) (Compass Minerals International, Inc., Overland Park, KS, USA) at 6.03 × 10⁴ mg·L−1, 20 Mule Team Borax Natural Laundry Booster (Na2B4O7·10H2O) (Henkel AG & Company, KGaA, Düsseldorf, Germany) at 4.15 × 10³ mg·L−1, Arm & Hammer Super Soda Booster (Na2CO3) (Church & Dwight Co., Inc., Ewing, NJ, USA) at 4.31 × 10³ mg·L−1, and trace amounts of ethylenediaminetetraacetic acid (EDTA; C10H16N2O8) (Fisher Scientific, Pittsburgh, PA, USA) at 35.2 mg·L−1 were utilized. The simulated concentrations of B, Na, Cl, and EDTA used for this study were 2.1 mg·B·L−1, 111 mg·Na·L−1, 168 mg·Cl·L−1, and 0.33 mg·EDTA·L−1. Assuming 38 mm irrigation per week, mass loadings over the four-month period were calculated and distributed as twice-weekly sprays at a high concentration to avoid any significant differences in irrigation rates. Concentrated spray applications were watered-in with uniform 2.5 mm overhead irrigation to prevent evaporative loss and any potential acute salinity damage. Both treatments received overhead irrigation at the same rate and frequency. Irrigation was applied at 4.7 mm daily, and 2.5 mm twice weekly following effluent water applications, for a total of 38 mm per week.

    • The turfgrass was mowed as needed at a mowing height of 5 cm and clippings were removed to help prevent annual bluegrass (Poa annua L.) infestation. Annual nitrogen rate for the two trial years was 244 kg·N·ha−1 applied via a 25-3-10 fertilizer (Wil-Gro 5 Iron, Wilbur-Ellis Company). Selective herbicides were used to maintain plots as predominantly perennial ryegrass. Prograss SC (42% ethofumesate) was applied at 4.6 kg·ha−1 (1.9 kg·a.i.·ha−1) on December 1 of 2015, January 6, February 2, September 27, November 4, and December 6 of 2016, and January 23 of 2017. TZone SE (7.72% triclopyr BEE, butoxyethyl ester, 0.66% sulfentrazone, 29.32% 2,4-D, 2-ethylhexyl ester, and 2.22% dicamba acid) was applied at 4.6 kg·ha−1 on 19 September 2016. Barricade 65WG (65% prodiamine) was applied at 0.56 kg·ha−1 (0.36 kg·a.i.·ha−1) on 24 July 2017.

    • Response variables included visual turf color and density, along with soil and tissue elemental analyses. Data were collected on a monthly basis with the exception of soil and tissue samplings which took place at the conclusion of the study in September of 2017.

      Turf color and density were visually assessed using a 1–9 scale with 6 being the minimum acceptable level. In turf color, a 1 rating was given to straw-brown turf, and 9 was given to dark green turf. In turf density, a 1 rating equals the lowest density (open canopy), and 9 equals maximum density. Turf color and density were evaluated two to three days after an effluent water application.

      Soil cores (12 per plot) were collected using a 19-mm-diameter probe to a 15-cm depth with the top 2.5 cm of root and thatch material removed. Aggregate soil samples were analyzed by Oregon State University Soil Health Laboratory (Corvallis, OR, USA) for pH, electrical conductivity (EC), Na, Cl, and B. Tissue samples were collected using a self-propelled push lawn mower (Honda, Minato, Tokyo, Japan), dried, and sent to the same laboratory for analyzing Na, Cl, and B concentrations.

    • Data were subjected to analysis of variance using SAS 9.4 Proc Mixed (SAS Institute Inc., Cary, NC, USA). Due to the significant year effect and interactions between year and some of the remaining factors, data were analyzed separately for each year. Factors in the final analyses included rating date, replication, irrigation water, and cultivar for field measurements, and replication, irrigation water, and cultivar for soil and tissue analyses. Fisher's Protected Least Significant Difference (LSD) at the 0.05 probability level was used to determine treatment difference.

    • Cultivar consistently had significant effects on turf color and density (Table 2). 'Premium' perennial ryegrass received the highest turf color rating, whereas 'Pepper' had the lowest color rating in both years. 'Pepper' had lower than acceptable color in 2017, but was not statistically different than 'Manhattan 6' (Table 3). 'Pillar' had a lower color rating than 'Premium', 'Allstar 3', 'SR4660ST', and 'Zoom' in 2016 but had the highest color rating that was not significantly different from 'Premium', 'Estelle', 'Allstar 3', 'SR4660ST', and 'Zoom' in 2017 (Table 3). All perennial ryegrass cultivars had acceptable turf density ranged from 7.3 to 7.7 in 2016 and 6.1 to 6.8 in 2017 when averaged over each summer and between two irrigation water treatments (Table 3). 'Premium' produced the highest density in both years (Table 3). 'Allstar 3' also had high turf density ratings that were statistically similar to those of 'Premium' in both years (Table 3).

      Table 2.  Analysis of variance and means table for visual turf color and density ratings affected by irrigation water, cultivar, and date in Corvallis, OR, USA in 2016 and 2017.

      Source of variationdfTurf color
      (1‒9)a
      Turf density
      (1‒9)b
      2016201720162017
      Pr > F
      Replication2NS*NS***
      Irrigation water1NS***NS***
      Fresh7.36.57.56.6
      Effluent7.46.17.56.3
      Cultivar10********
      Date2*****NS***
      Irrigation water × cultivar10NSNSNSNS
      Irrigation water × date2NS***NS***
      Cultivar × date20*NSNSNS
      Irrigation water × cultivar × date20NSNSNSNS
      a Turf color ratings were visually assessed on a 1‒9 scale with 1 being straw-brown turf, 6 being the minimum acceptable color, and 9 being dark green turf. b Turf density ratings were visually assessed on a 1‒9 scale with 1 being the lowest density (open canopy), 6 being the minimum acceptable density, and 9 being the highest density. NS Not significant at the 0.05 probability level. * Significant at the 0.05 probability level. ** Significant at the 0.01 probability level. *** Significant at the 0.001 probability level.

      Table 3.  Visual turf color and density for 11 perennial ryegrass cultivars evaluated in Corvallis, OR, USA in 2016 and 2017. Mean values represent data points averaged across replication, date, and irrigation water.

      CultivarTurf color (1−9)abTurf density (1−9)ac
      2016201720162017
      Premium7.63A6.67A7.69A6.83A
      Pillar7.31CD6.67A7.56ABC6.58AB
      Pepper6.93E5.81D7.56ABC6.31BCD
      Brightstar SLT7.19D6.22BC7.33D6.33BCD
      Estelle7.39BC6.42AB7.50ABC6.36BCD
      Gray Fox7.26CD6.25BC7.56ABC6.53ABC
      Allstar 37.46B6.42AB7.61AB6.72AB
      Mighty7.38BC6.28BC7.47BC6.11CD
      SR4660ST7.47B6.50AB7.57ABC6.72AB
      Zoom7.44B6.47AB7.39CD6.44ABCD
      Manhattan 67.36BC6.08CD7.43BC6.08D
      a Means followed by the same uppercase letter were not significantly different at the 0.05 probability level. b Turf color ratings were visually assessed on a 1‒9 scale with 1 being straw-brown turf, 6 being the minimum acceptable color, and 9 being dark green turf. c Turf density ratings were visually assessed on a 1‒9 scale with 1 being the lowest density (open canopy), 6 being the minimum acceptable density, and 9 being the highest density.
    • Effluent water irrigation applied in the summer did not have significant effects on turf color or density compared to freshwater irrigation in the first year of the study. In the second year, irrigation water and its interaction with date were significant (Table 2). Effluent water irrigation had similar effects on turf color and density in 2017 (Fig. 1). Reductions in turf color (Fig. 1a) and density (Fig. 1b) with effluent water irrigation were observed in June and July 2017. In August of 2017, effluent water irrigation produced turf color and density comparable to freshwater irrigation (Fig. 1).
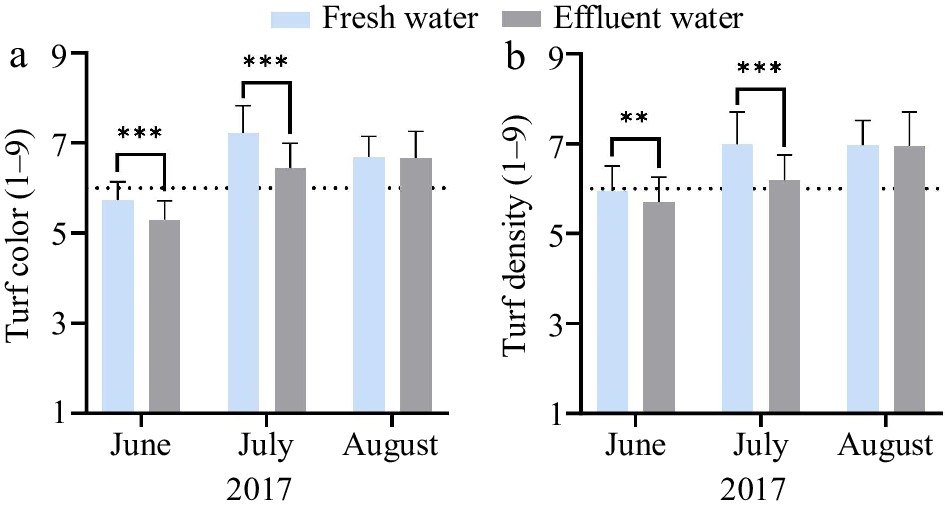
      Figure 1. 

      The effects of summer irrigation with fresh versus effluent water on (a) turf color and (b) turf density varied by rating dates in 2017. Turf color ratings were visually assessed on a 1‒9 scale with 1 being straw-brown turf, 6 being the minimum acceptable color (indicated by the dotted line), and 9 being dark green turf. Turf density ratings were visually assessed on a 1‒9 scale with 1 being the lowest density (open canopy), 6 being the minimum acceptable density (indicated by the dotted line), and 9 being the highest density. Error bars indicate standard deviations. ** Significant at the 0.01 probability level. *** Significant at the 0.001 probability level.

    • While effluent water irrigation did not affect soil pH, it was found to have significant effects on EC as well as soil B, Na, and Cl contents measured at the conclusion of the study (Table 4). Effluent water irrigation in the summer resulted in an EC of 0.24 dS·m‒1 which was statistically higher than the freshwater control of 0.15 dS·m‒1 (Table 4). The concentrations of B, Na, and Cl were found to be significantly higher in the soil of effluent water irrigation treatment compared to the freshwater irrigation treatment, all of which were 4 to 5 times higher than the freshwater control (Table 4). The main effect of perennial ryegrass cultivar and its interaction with irrigation water were not significant in any of the soil chemical properties tested in this study (Table 4).

      Table 4.  Analysis of variance and means table for soil pH, electrical conductivity (EC), soil boron (B), sodium (Na), and chloride (Cl) concentrations on 11 perennial ryegrass cultivars under fresh versus effluent water summer irrigation at the conclusion of a two-year study in Corvallis, OR, USA.

      Source of variationdfpHEC
      (dS·m−1)
      B
      (ppm)
      Na
      (ppm)
      Cl
      (ppm)
      Pr > F
      Replication2NSNSNSNSNS
      Irrigation water1NS****
      Fresh6.30.150.9746
      Effluent6.20.244.332630
      Cultivar10NSNSNSNSNS
      Irrigation water × cultivar10NSNSNSNSNS
      NS Not significant at the 0.05 probability level. * Significant at the 0.05 probability level.
    • Irrigation water had significant effects on Na and Cl ion concentrations in the leaf tissues (Table 5). Significantly higher concentrations of Na and Cl ions, and marginally higher (probability of 0.057) B ions were detected in the tissue samples from effluent water irrigation plots compared to freshwater irrigation plots (Table 5). Perennial ryegrass cultivars had different levels of tissue B regardless of irrigation water source, ranging from 8 ppm from 'Estelle' to 29 ppm from 'Allstar 3' (Table 6).

      Table 5.  Analysis of variance and means table for leaf tissue boron (B), sodium (Na), and chloride (Cl) concentrations on 11 perennial ryegrass cultivars under fresh versus effluent water summer irrigation at the conclusion of a two-year study in Corvallis, OR, USA.

      Source of variationdfB (ppm)Na (ppm)Cl (ppm)
      Pr > F
      Replication2NSNSNS
      Irrigation water10.0568a***
      Fresh158745782
      Effluent2175929506
      Cultivar10*NSNS
      Irrigation water × cultivar10NSNSNS
      a Significant at the 0.1 probability level with a probability of 0.0568. NS Not significant at the 0.05 probability level. * Significant at the 0.05 probability level.

      Table 6.  Leaf tissue boron (B) concentrations for 11 perennial ryegrass cultivars at the conclusion of a two-year study in Corvallis, OR, USA. Mean values represent data points averaged across replication and irrigation water.

      CultivarB (ppm)a
      Premium22ABC
      Pillar15BCD
      Pepper18BCD
      Brightstar SLT18BCD
      Estelle8D
      Gray Fox21ABC
      Allstar 329A
      Mighty14BCD
      SR4660ST18BCD
      Zoom13CD
      Manhattan 623AB
      a Means followed by the same uppercase letter were not significantly different at the 0.05 probability level.
    • Increasing concerns about fresh water scarcity and conservation are limiting the use of turfgrass in urban landscapes, especially in the western and southern USA. In these arid and warm regions, water conservation agencies have implemented incentive programs to remove turfgrass lawns, including Southern California, Southern Nevada, and Florida[2023]. Effluent water irrigation provides an ideal solution for the amenity use of turfgrass without the concerns of food safety when effluent water irrigation is used for growing food crops.

      Perennial ryegrass is generally considered not drought tolerant[24], therefore, an alternative source to freshwater irrigation is critically important. The intent of this field study was to compare effluent versus fresh water irrigation on 11 different lawn-height perennial ryegrass cultivars during the summer drought in the Willamette Valley of Oregon. Our results suggested that effluent water has the potential for irrigating perennial ryegrass during the summer drought periods. There was no significant interaction between the irrigation water and perennial ryegrass cultivar, indicating that cultivars performed well with freshwater irrigation also performed well with effluent water irrigation. Only small reductions in turf color and density were observed with effluent water irrigation in the second year of the study. The low soil EC in this study suggested that the two years of effluent water irrigation did not contribute to soil salinity or salinity stress to the plants. However, it is possible that the reductions in turf color and density could be attributed to ion toxicity.

      Effluent water irrigation had no effect on turf quality (color and density) in the first year, but resulted in statistically lower turf quality compared to freshwater irrigation in June and July, but not August of the second year. The average ratings among the 11 cultivars were slightly under the acceptable level regardless of irrigation water type only in June of 2017 (Fig. 1). Irrigation was not applied in May, but evapotranspiration exceeded precipitation in May (Table 1) causing the lower turf color and density observed in June. Nevertheless, the majority of the perennial ryegrass cultivars used in this study provided acceptable turf quality when averaged over each summer (Table 3). Additionally, the differences in the turf color and density were expected to be associated with genetic traits, considering all the cultivars were subjected to the same level of fertility and irrigation rate. 'Premium', 'Allstar 3', and 'SR4660ST' consistently performed well in both years regardless of irrigation water source and were among the highest ranked cultivars in turf color and density (Table 3). 'Pepper' had low turf color among other cultivars but had relatively high turf density (Table 3).

      Soil B, Na, and Cl concentrations of the effluent water treated plots were more than four times higher than the freshwater control, which likely resulted in higher EC compared to the control (Table 4). Isweiri et al. observed that long-term effluent water irrigation on fairways with perennial ryegrass and Kentucky bluegrass (P. pratensis L.) mixtures also resulted in higher EC values compared to fairways irrigated with fresh water, but remained well below the critical threshold level of 4 dS·m–1 for perennial ryegrass[25]. In our study, the EC value for the effluent water treatment was 0.24 dS·m–1 compared to 0.15 dS·m–1 for the freshwater treatment (Table 4), which is well below 4 dS·m–1. The buildup of salts to potentially toxic levels depends on concentration in irrigation water, amount of water applied, annual precipitation, and soil characteristics[26]. Annual rainfalls occurring between autumn and the following spring could result in lowering or slowing down the increase of EC and concentrations of salts for the effluent water irrigation treatment. This region of the Pacific Northwest is characterized as a cool-humid climate with an average annual precipitation of 108.5 cm, which occurs almost exclusively between autumn and the next spring[17,27], suggesting potential for leaching ions that would otherwise accumulate in the soil from effluent water applications. Our speculation was supported by a greenhouse study that also raised the concerns about the high salts from detergents and personal care products in the graywater can accumulate in soil and leach through soil to reach groundwater[12].

      Higher levels of Na and Cl were also observed in the leaf tissues in response to effluent water irrigation (Table 5). The average tissue Na level of 874 ppm in the grass clippings of 11 perennial ryegrass cultivars irrigated with fresh water in our study is consistent with the Na concentration reported in the literature for perennial ryegrass[28]. In contrast, our results also indicated that the tissue Na level was nearly nine times higher in the effluent water treatment compared to the freshwater control. In Kentucky bluegrass, a study sampling golf courses under long-term recycled water irrigation has shown that increasing Na concentration up to 4,500 ppm in the shoots produced acceptable turf quality but was linearly correlated with decreasing turf quality[13]. Similarly, we observed a high level of tissue Na at 7,592 ppm in perennial ryegrass with effluent water irrigation, which could help explain the reduced turf color and density. Krishnan and Brown reported in a greenhouse study that salt tolerant perennial ryegrasses, including PST-2MNG (experimental code for 'Gray Fox'), accumulated about 40% less Na ion than the nearly 20,000 ppm with 'Linn' when subjected to salt stress and demonstrated that Na exclusion in the leaf tissue is one of the major salt tolerance mechanisms[14]. In the current study, we evaluated 11 newer perennial ryegrass cultivars than 'Linn' and did not observe differences in tissue Na concentrations among them, suggesting that these cultivars exhibited comparable salt tolerance.

      The high concentration of Na and Cl accumulated in the shoot of cool-season turfgrass is a common issue with recycled wastewater[13,15]. Even though the reduction in turf quality was small in scale (Table 2 & Fig. 1), our tissue test results suggested that effluent water could have negative effects on turfgrass growth. Long-term field trials need to be conducted to verify whether the Na, Cl, and B will buildup in the plant tissue as effluent water irrigation continues to be applied. However, the toxicity levels of Na and Cl have not been described in perennial ryegrass. Research has shown that B was accumulated in the grass leaf tips, and that routine mowing could remove B and reduce injury[29]. When turfgrass is continuously growing, mowing is expected to remove grass clippings containing high levels of Na, Cl, and B, whether their concentrations will reach equilibrium and are not detrimental to perennial ryegrass remains unknown, and future research is warranted.

      While many trees, shrubs, and groundcovers are sensitive to Cl, the toxic level and injuries of Cl in turfgrass have not been observed or reported in the literature, suggesting higher tolerance and great potential to utilize effluent water irrigation in turfgrass. On the other hand, the accumulation of Na in soil and leaf tissue could be problematic. Studies have shown Na to be directly toxic to plants; however, its most frequent negative effect is on soil structure[30,31]. Sodium causes breakdown of clay particles, thus decreasing soil aeration and infiltration[26]. Irrigation sources with lower sodium absorption ratio (SAR), the relative proportion of sodium to calcium plus magnesium ions in the water, should be preferred for turf and other landscape applications, particularly on clay soils[26]. Even though effluent water irrigation for two summers in our area, which has low baseline soil EC, did not lead to soil salinity or any significant change in soil pH, long-term studies are needed to continue monitoring EC levels for the safe use of effluent water. Furthermore, Negahban-Azar et al. suggested that graywater should be used as needed based on the evapotranspiration rate and not over applied as a disposal method[12].

    • The results of this study demonstrated the potential of perennial ryegrass cultivars with high turf quality for use as lawns under effluent water irrigation. Although, small reductions in turf density and color were observed in June and July of 2017, the majority of the perennial ryegrass cultivars had acceptable turf color and density ratings when averaged over each summer. Soil analyses showed the buildup of B, Na, Cl, and elevated EC with effluent water applications. The accumulation of Na and Cl was also observed in the plant leaf tissue with effluent water applications.

      Effluent water irrigation is a viable option for growing perennial ryegrass in the dry summer of Willamette Valley. There is still a need for well-documented research on the long-term effects of effluent water irrigation on turfgrass species and cultivars, particularly in areas that are relatively new to water scarcity. Future research is warranted to determine whether turfgrass provides sufficient filtrating of wastewater for safe groundwater and compare turfgrasses to bare soil and other landscape and groundcover plants.

    • The authors confirm contribution to the paper as follows: study conception and design: Olsen CJ, Kowalewski AR; data collection: Olsen CJ, Gould MA; analysis and interpretation of results: Wang R, Kowalewski AR; draft manuscript preparation: Wang R, Olsen CJ. All authors reviewed the results and approved the final version of the manuscript.

    • The datasets generated and/or analyzed during the current study are available from the corresponding author on reasonable request.

      • This research was funded by Western Canada Turfgrass Association (No. 3118).

      • The authors declare that they have no conflict of interest.

      • Copyright: © 2023 by the author(s). Published by Maximum Academic Press, Fayetteville, GA. This article is an open access article distributed under Creative Commons Attribution License (CC BY 4.0), visit https://creativecommons.org/licenses/by/4.0/.
    Figure (1)  Table (6) References (31)
  • About this article
    Cite this article
    Wang R, Olsen CJ, Gould MA, Kowalewski AR. 2023. Field evaluation of perennial ryegrass cultivars for use with effluent water irrigation. Grass Research 3:23 doi: 10.48130/GR-2023-0023
    Wang R, Olsen CJ, Gould MA, Kowalewski AR. 2023. Field evaluation of perennial ryegrass cultivars for use with effluent water irrigation. Grass Research 3:23 doi: 10.48130/GR-2023-0023

Catalog

  • About this article

/

DownLoad:  Full-Size Img  PowerPoint
Return
Return