


-
Unlike animals, dioecious angiosperms account for only about 6% of the total.[1]. In many cases, dioecious plants provide better tools for understanding the genetics of sex determination than dioecious animals[2]. Buffalograss (Buchloe dactyloides (Nutt.) Engelm.) is a perennial, stoloniferous, low herbaceous, and low-input ecological grass[3]. Buffalograss is a dioecious plant, and a few are hermaphroditic. Buffalograss comprises polyploid polymorphisms (x = n = 10), including diploid, tetraploid, pentaploid, and hexaploid individuals[4]. The turf quality of the female plant in B. dactyloides is better than that of the male as when the male plant enters the flowering stage, there is a distinct yellow color due to the flower shaft being higher than the bush, and the female plant does not have such a problem[5]. It was reported that there are no sex-determining heteromorphic chromosomes, and sex determination is linked to gene expression and gibberellin-induced morphological alterations in buffalograss[4]. Studies on B. dactyloides have focused on variety breeding and improvement[6,7], physiological differentiation in response to biotic and abiotic stress, and phenotypic identification. However, the transcriptional information of B. dactyloides, especially in complete mRNA sequences, alternative splicing (AS) events, and long non-encoding RNAs (lncRNAs), is still largely unknown. Moreover, the large number of unannotated transcripts limits the research on the mechanisms of sex differentiation of B. dactyloides.
Plants have complex transcriptional processes; transcriptome research is critical to understanding plant life processes[8]. The RNA-seq technology, based on Illumina sequencing platforms, has significantly higher sequencing depth and a reduced error rate, resulting in substantially higher genome coverage[9], allowing us to better comprehend critical gene expression levels and regulatory mechanisms[10]. However, RNA-seq data cannot systematically and accurately collect or assemble complete transcripts or identify transcripts of isoform, homologous, superfamily, or allele expression, making it insufficient to understand the transcriptome and underlying biological processes. Instead of interrupting RNA fragments, full-length transcriptomes employing PacBio single-molecule real-time (SMRT) sequencing platforms can directly reverse full-length cDNA. Ultra-long reads (median 10 kb) from the platform contain a single complete transcript sequence[11,12]. Assembly is not required for post-analysis, and what is measured is[13]. Moreover, the response to metabolites is more specific than the general response seen at the transcript level[14]. At present, comprehensive investigations of alterations in metabolite levels remain rare. It is particularly true for the joint and parallel analysis of sex differentiation at two levels of genome information processing: the transcriptomic and the metabolomic. However, the integrative analysis of metabolites and transcripts helps identify genes and small molecules involved in critical biological processes[15,16]. We completed the full-length transcriptome sequencing analysis using the transcriptome analysis methods. We explored the complete mRNA structure features of B. dactyloides and completed the identified transcript function annotation. We further investigated the underlying transcriptional mechanism of B. dactyloides sex differentiation by integrating Illumina RNA-seq data and metabolomic data. This work will effectively provide helpful information about the transcriptome of B. dactyloides. We expect it will offer essential resources for further research on sex differentiation, functional gene identification, and variety breeding studies in B. dactyloides.
-
Buchloe dactyloides (cv. Texoka) were vegetatively propagated in an intelligent greenhouse at the Beijing Academy of Agricultural and Forestry Sciences (Beijing, China). In April 2022, we harvested female, male, and monoecious plants' roots, stolon, flowers, and leaves as materials. All samples were frozen in liquid nitrogen and stored at −80 °C for further investigations. To identify as many transcripts as possible, we extracted the total RNA from all organ materials of buffalograss for SMRT sequencing. However, in practical application, we completed sex identification before blooms. We selected leaves of female, male, and monoecious plants for Illumina and metabolite sequencing. First, we extracted total RNA using the plant RNA kit (Omega, GA, USA). Second, the purity, concentration, and integrity of total RNA were assessed using ND-1000 spectrophotometer (NanoDrop Technologies, DE, USA) and 2100 bioanalyzer (Agilent Technologies, CA, USA).
Full-length library construction and PacBio SMRT sequencing
-
We mixed RNA from female, male, and monoecious plants' roots, stolons, flowers, and leaves into one sample. Following the qualification of the sample, a full-length library was constructed with no size selection. After the full-length library passed quality control, we performed full-length transcriptome sequencing based on the PB PacBio Sequel II platform. Then full-length transcriptome sequencing data were analyzed from raw reads in three steps[17]. First, we extracted and polished circular consensus (CCS) sequences using full passes ≥ three and sequence accuracy > 0.9. Next, we classified the full-length transcripts by detecting whether 5' and 3' cDNA primers and poly(A) tails in CCS sequences. Finally, we classified full-length non-chimeric (FLNC) transcripts to recognize consensus isoforms, high-quality isoforms (accuracy > 0.99), and low-quality isoforms using the SMRTLink software. We used CD-HIT v4.6.1 software[18] to merge highly similar sequences and remove redundancy. The low-quality consensus isoforms were polished based on the corresponding Illumina sequencing data using proovread software[19].
Full-length transcriptome structure analysis
-
We conducted the structure analysis with non-redundant FLNC transcripts identified by the full-length transcriptome, including CDS prediction, AS events, and SSR identification and analysis. We used TransDecoder (v5.0.0) software[20] to predict the reliable CDS and their corresponding protein sequences of the transcript. The AS events prediction method referred to the report following the three alignments[21]. We screened transcripts with a length > 1,000 bp and completed SSR analysis utilizing MISA software[22].
Identification of regulatory proteins, lncRNAs and lncRNA target
-
We used iTAK software[23] with default parameters to predict regulatory proteins, including transcription factors (TFs), transcriptional regulators (TRs), and protein kinases (PKs) in B. dactyloides. We filtered out the putative protein-coding RNAs before lncRNAs prediction. We used CPC[24], CNCI[25], CPAT[26], and Pfam[27], to screen > 200 bp transcripts in length that contain two or more exons. The intersection of the four sets was applied in the following lncRNA analysis. In addition, RNA targets of lncRNAs were predicted using LncTar software[28].
Function annotation of transcripts
-
To acquire function annotation information, we compared the non-redundant transcripts to non-redundant protein sequences (NR), Swissprot[29], Gene Ontology (GO)[30], Clusters of Orthologous proteins Groups (COG)[31], Eukaryotic Ortholog Groups (KOG)[32], Pfam, Kyoto Encyclopedia of Genes and Genomes (KEGG)[33], and eggNOG[34] databases utilizing DIAMOND software. Moreover, the protein sequences of transcripts were blasted (p-value < 1E-5) against the TrEMBL database based on the Swissprot database to obtain the annotation information.
Illumina cDNA library construction and sequencing
-
Nine cDNA libraries (three biological replicates for female, male, and monoecious plants) were constructed for Illumina sequencing. After verifying the quality of nine libraries, we used the Illumina NovaSeq6000 platform (San Diego, CA, USA) to perform Illumina sequencing. The specific sequencing data quality controls were: cut the sequencing adapter and the primer sequence in reads; filtrate the low-quality reads to ensure the read quality. Finally, we obtained clean data that is sufficient for subsequent accurate analysis. We further calculated GC content, Q30, and sequence duplication levels of clean data.
Quantification of transcript expression and analysis of differential expression transcripts
-
We used non-redundant transcript sequences identified from PacBio SMRT as a reference and applied NGS reads to them to acquire transcript position information using STAR[35] software. The method of quantification of transcript expression levels was as follows: first, we used Kallisto[36] software to compare NGS reads with transcripts generated from PacBio SMRT and count directly; then, we calculated transcript expression levels using fragments per kilobase of transcript per million fragments mapped (FPKM). To evaluate the reproducibility of biological replicates, we set the Pearson Correlation Coefficient (R2) as the correlation index of samples.
Then we used DESeq2[37] software to identify differential expressions with replicates. We detected DEGs using the threshold: fold change (FC) of not less than two and a false discovery rate (FDR) of less than 0.01. We adjusted the p-value using the Benjamini-Hochberg method. Volcano Plot assessed the differences in transcript expression between two samples and their corresponding significance. Moreover, GO and KEGG functional annotation and enrichment analysis on DEGs we performed.
qRT-PCR analysis
-
DEGs involved in abscisic acid (ABA) metabolic and signaling pathways (BdABA1, BdAOG, and BdSAPK8), gibberellin (GA) metabolic and signaling pathways (BdKAO, BdGID1, and BdDWARF8), cytokinin (CTK) related pathways gene (BdORR9), photosynthesis-related pathways (BdPsbP which encodes PSII reaction center subunit and PetC which encodes cytochrome b6/f complex subunits), and one bHLH transcription factor bHLH137 related to sex differentiation were subjected to qRT-PCR analysis. We reverse-transcribe RNA to cDNA using PrimeScriptTM Reverse Transcriptase (TaKaRa, Dalian, China). The primers used in the study were designed using Primer Premier 5 and listed in Supplemental Table S1. qRT-PCR analysis was performed on a Bio-Rad CFX Connect™ RealTime System using SYBR® Premix Ex Taq™ II (TaKaRa, Dalian, China). Three biological replicates were used for all gene expression analyses. We calculated the relative expression level of genes using the 2−ΔΔCᴛ method.
Metabolites extraction and LC-MS/MS analysis
-
Three experimental groups (male, female, and monoecious plants) contained six samples per group harvested for sequencing and separate analyses. We performed metabolomics experiments using the Waters UPLC Acquity Ⅰ-Class PLUS and UPLC Xevo G2-XS QTOF. Then we analyzed samples using the Waters Acquity UPLC HSS T3 column (1.8 um, 2.1 mm × 100 mm) in positive and negative codes[38]. The mobile phases were 0.1% formic acid aqueous solution (A) and 0.1% formic acid acetonitrile (B), and the injection volume was 1.0 μL. We acquired primary and secondary mass spectrometry data in MSe mode using MassLynx V4.2 software (Waters). Dual-channel data acquisition, including low and high collision energies, can be simultaneously accomplished during each data acquisition cycle. The low and high collision energies were 2 V and 10–40 V, respectively, and the scanning frequency was 0.2 s for a mass spectrum. The parameters of the ESI ion source were according to a previously described report[38]. We processed raw data for peak extraction and alignment and completed identification based on the online METLIN and Biomark's self-built databases using Progenesis QI software. In addition, we identified the theoretical fragment; the mass deviation of the parent ion and fragment ion is less than 100 ppm and 50 ppm, respectively[38].
Quantification of metabolites and analysis of differential metabolites
-
We used the R package (ropls) to perform orthogonal projections to latent structures-discriminant analysis (OPLS-DA) modeling between groups, and we completed 200 permutation tests to ensure the reliability of the model[39]. We determined the model's variable importance in projection (VIP) value using multiple cross-validations. We compared the difference multiples based on the grouping and used the T-test to calculate the difference significance p-value of metabolites. We further identified DAMs using the threshold: p-value less than 0.05 and VIP value greater than one. The hypergeometric distribution test was used to calculate the DAMs of KEGG pathway enrichment significance[40].
Data preprocessing and annotation, and correlation analysis between DEGs and DAMs
-
After normalizing the original peak area information with the total peak area, we evaluate the overall quality of the data. We evaluated the overall data quality using principal component analysis (PCA) and Spearman correlation analysis. We searched the classification and pathway information of identified compounds utilizing the KEGG[33] database.
To calculate the correlation between all DEGs and DAMs, we preprocessed the data using the z-value transformation method and screened according to the correlation coefficient (CC) and p-value of correlation. The screening threshold was |CC| greater than 0.80 and CCP less than 0.05. We mapped DEGs and DAMs simultaneously to related pathways using MapMan software[41].
-
We accomplished the PacBio SMRT sequencing of B. dactyloides and obtained 45.10 Gb of clean data. The PacBio SMRT reads generated in this study were submitted to the BioProject database of the National Center for Biotechnology Information (accession numbers PRJNA991319). The cDNA size of the full-length library was 1–6 kb. First, 675,685 CCS sequences were acquired from raw reads. The average read length of CCS was 1,691 bp, and the mean number of passes was 31. Next, 83.26% (562,568) of CCS sequences were identified as FLNC sequences. Moreover, FLNC sequences were clustered using the SMRTLink software, and 179,367 consensus isoforms were identified. To improve the accuracy of the sequences, we used proovread software to correct the low-quality consensus isoforms corresponding to Illumina sequencing data. 179,248 polished high-quality isoforms were identified, and the percentage of polished high-quality isoforms was 99.93%. The mean read length of consensus isoform was 1,667 bp. The read length distributions of the CCS sequence, FLNC sequence, and consensus isoform are shown in Supplemental Fig. S1. Finally, we obtained 110,870 non-redundant transcripts generated using CD-HIT software.
Using DIAMOND software, we compared 110,870 non-redundant transcript sequences with all databases and obtained 100,362 (90.52%) transcript annotation information (Fig. 1a). We compared the transcript sequences with the NR database. We identified 99,534 homologous transcripts (Fig. 1b). NR homologous species result showed that the most abundant transcripts (49,236) were distributed in Eragrostis curvula, accounting for 49.47%. GO annotation and enrichment analysis divided 82,896 transcripts into three categories (Fig. 1c). First, the most abundant transcripts were involved in the 'biological process' term. Transcripts involved in the 'biological process' were associated with the cellular process (41,643), metabolic process (38,118), and biological regulation (13,703). Then, transcripts involved in the 'cellular component' were related to cellular anatomical entity (45,140) and intracellular (24,922). Finally, for 'molecular function', transcripts were mainly involved in binding (42,921) and catalytic activity (38,620). We identified 136 KEGG pathways involved in 69,000 transcripts using the KEGG database. We listed 13 KEGG pathways involving more than 1,000 transcripts in Fig. 1d. The results showed that plant-pathogen interaction (3,058), plant hormone signal transduction (2,349), carbon metabolism (2,096), biosynthesis of amino acids (1,537), starch and sucrose metabolism (1,535), and MAPK signaling pathway-plant (1,501) were the six abundant pathways for transcripts.
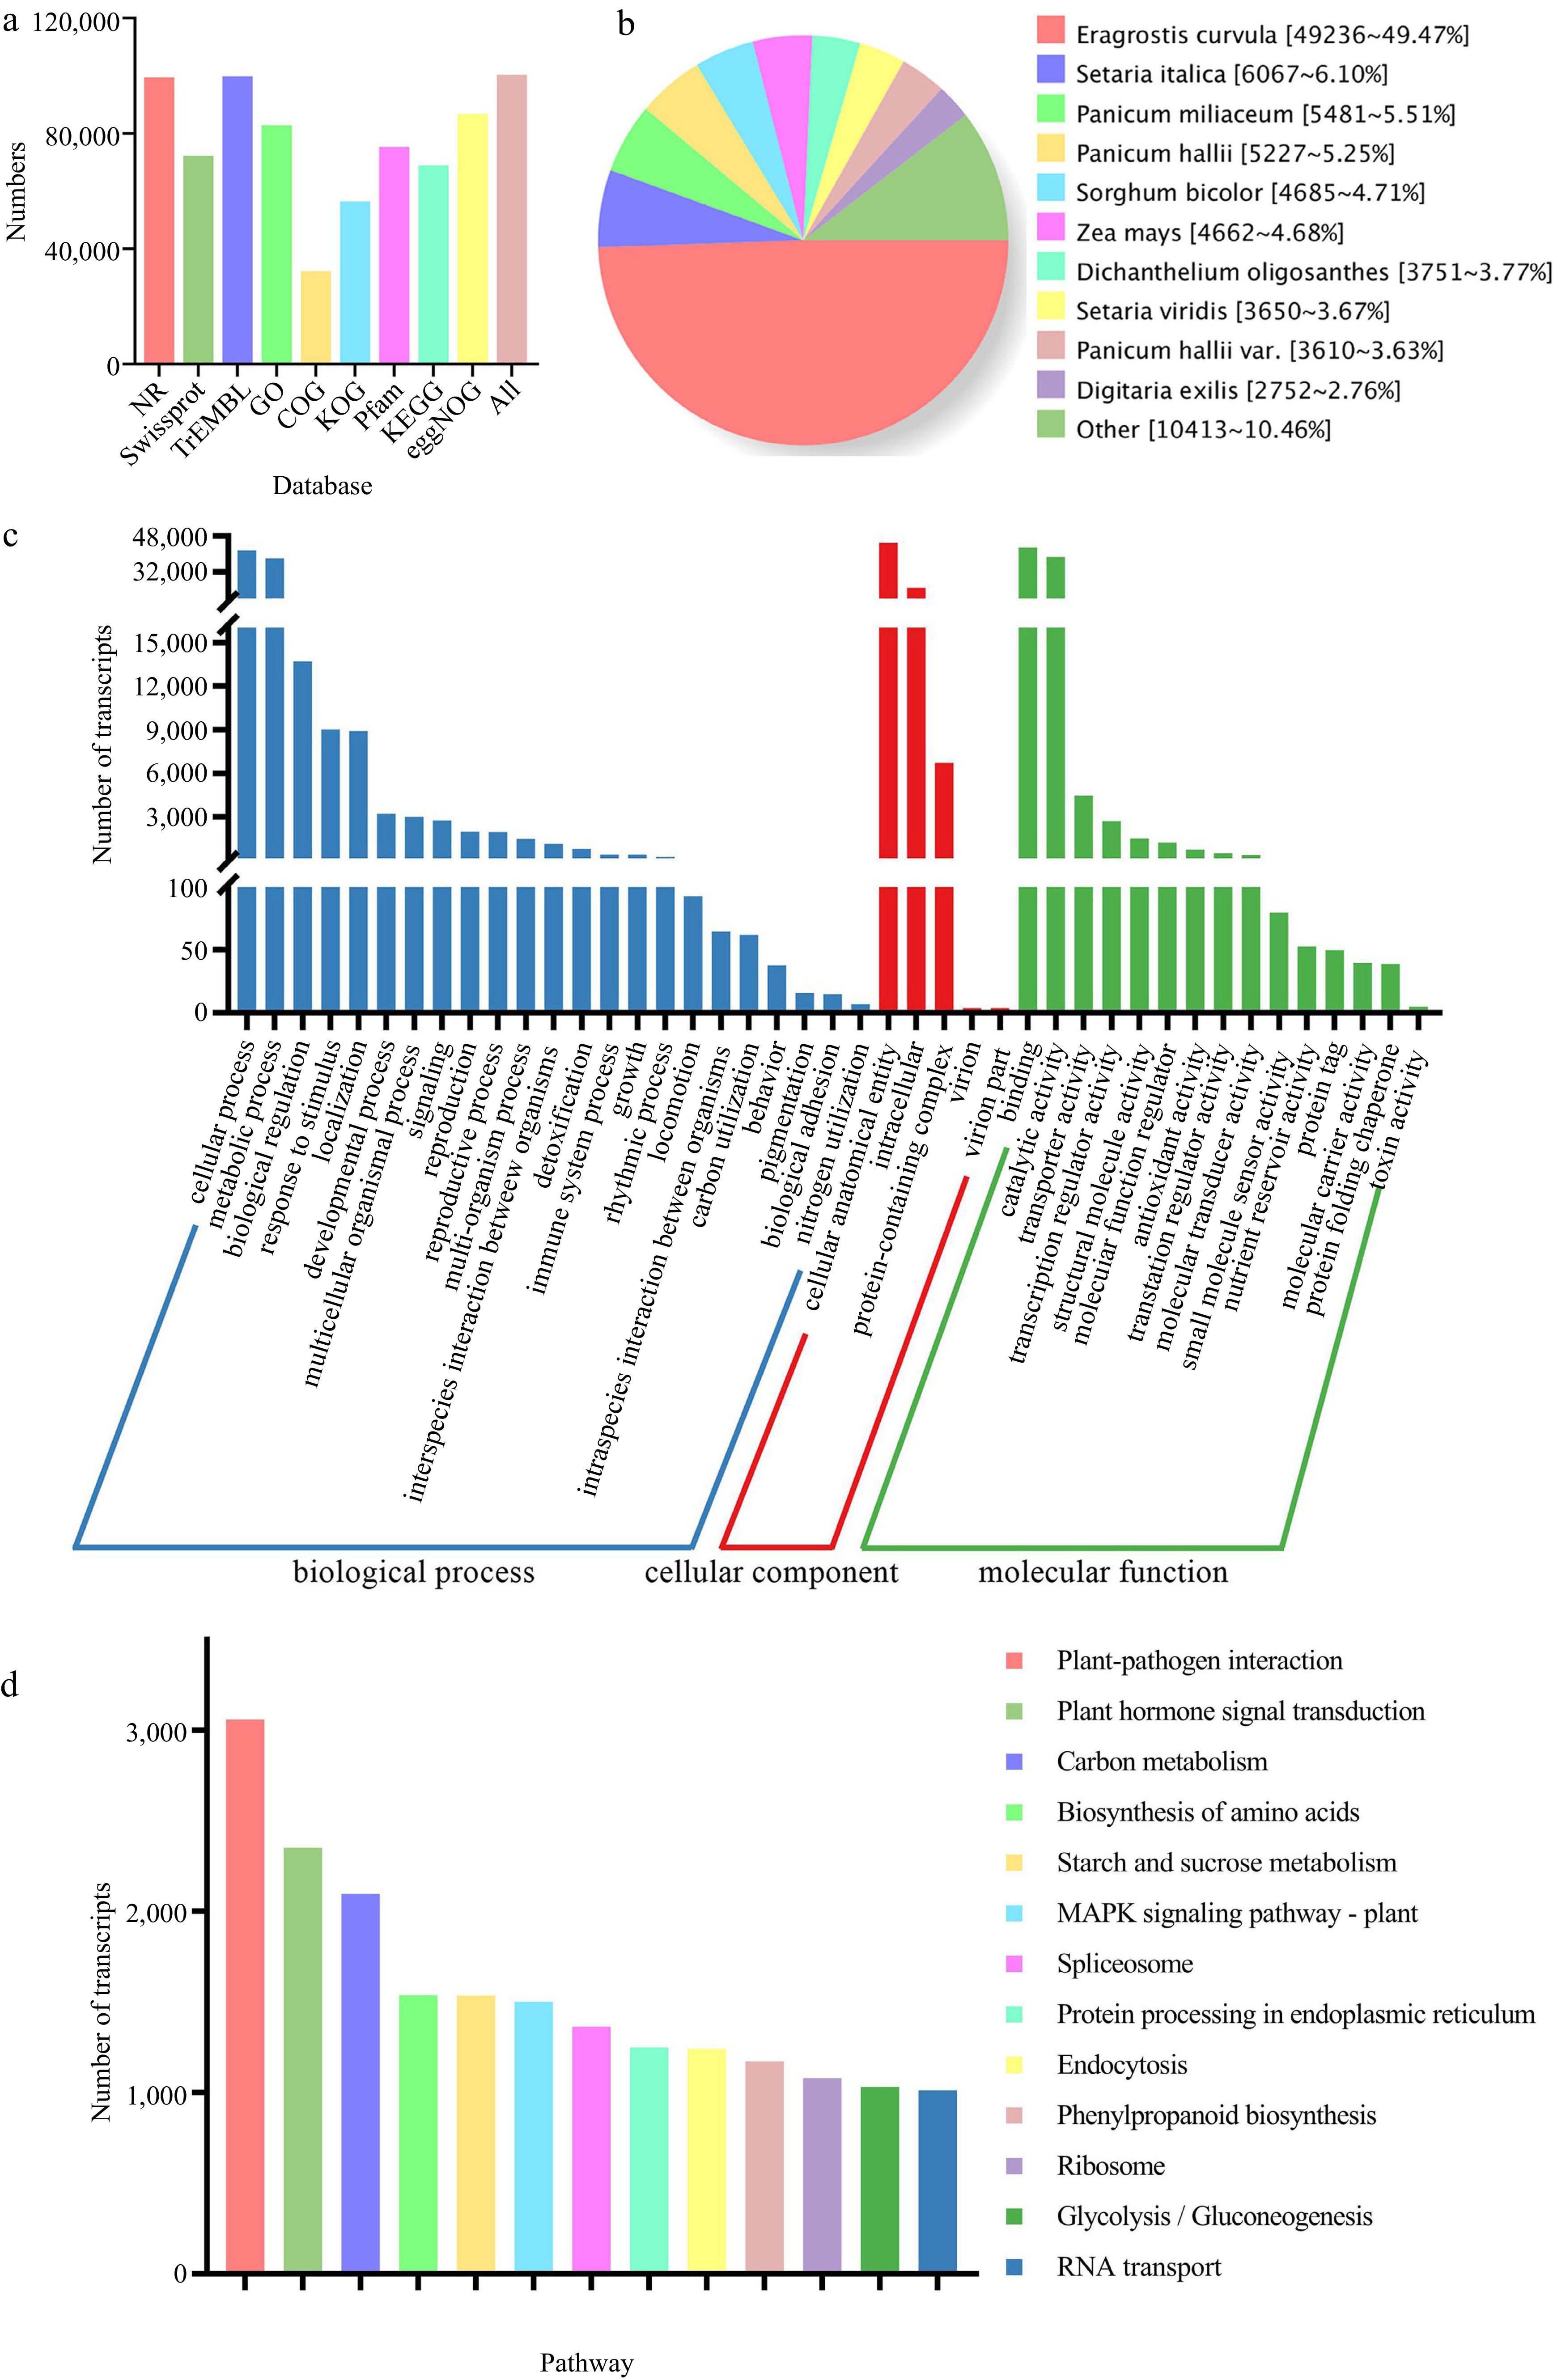
Figure 1.
Function annotation of non-redundant transcripts. (a) Function annotation of transcripts in all databases. (b) Nr homologous species distribution diagram of transcripts. (c) Distribution of GO terms for all annotated transcripts. Transcripts (82,896) were classified into three groups: 'biological process', cellular component', and 'molecular function'. (d) Thirteen KEGG pathways involving more than 1,000 transcripts.
Full-length transcriptome structure analysis
-
A total of 101,909 ORFs and 56,478 carried complete ORFs. One hundred to 200 amino acid transcripts were the most abundant, accounting for 23.92%. 94.98% of the transcript length was more than 800 bp. The length distribution of amino acid sequences in the coding region of ORFs is shown in Fig. 2a. We analyzed the over 1,000 bp transcripts to predict SSR using MISA software. Six types of SSRs, totaling 32,942 SSRs, were identified (Supplemental Table S2). Most of these SSRs were mono- and tri-nucleotide repeats, accounting for 47.1% and 31.1%, respectively. The least abundant SSRs were hexa- and penta-nucleotide repeats, accounting for 0.2% and 0.3%, respectively.
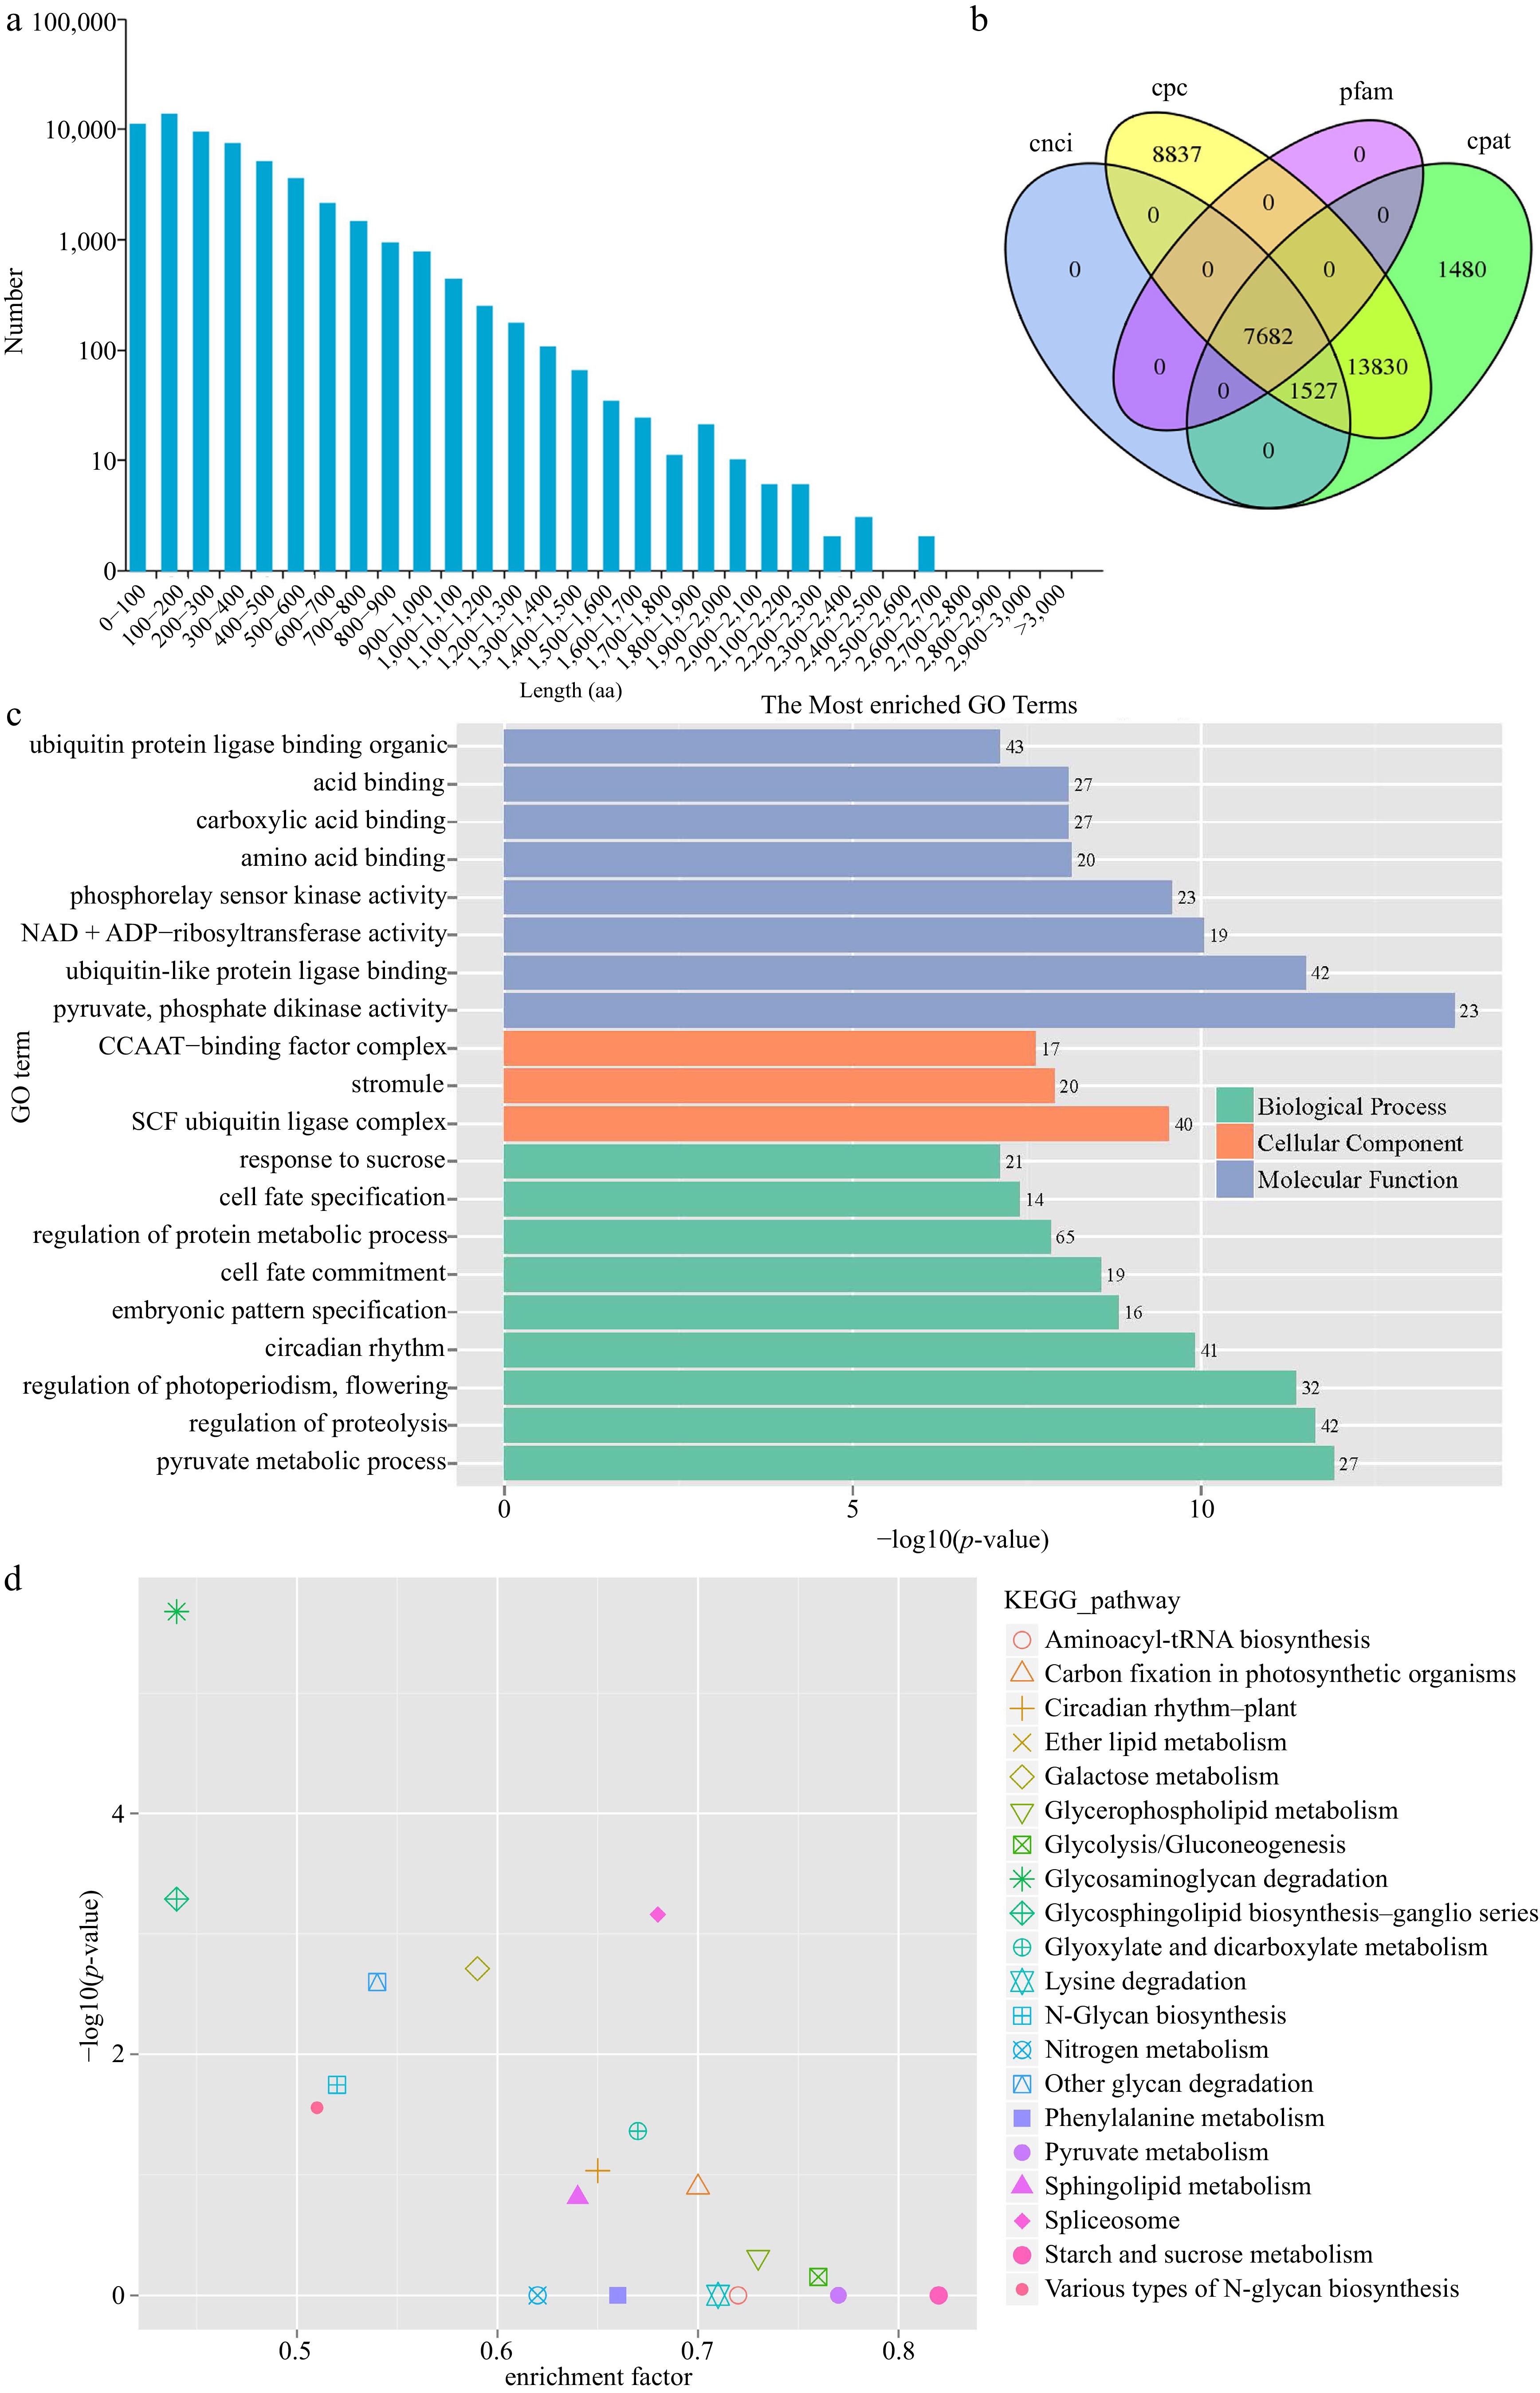
Figure 2.
Structure analysis of full-length transcripts. (a) Length distribution of amino acid sequences in the coding region of ORFs. (b) Venn diagram of lncRNAs predicted by CPC, CPAT, CNCI, and Pfam methods. (c) GO and (d) KEGG enrichment of the transcripts possessed AS events.
For lncRNA prediction, we used the method of filtering step by step: first, the intersection of CPAT and CPC prediction, then CNCI prediction, and finally, Pfam to predict CNCI results. We predicted 7,682 lncRNAs; the Venn diagram is shown in Fig. 2b. We predicted the targets of 6,474 lncRNAs using LncTar (Supplemental Table S3), accounting for 84.27%. Using BLAST software, we identified 4,091 AS events involved in 6,188 transcripts (Supplemental Table S4). To discover the critical biological processes and functions of transcripts in B. dactyloides, we completed GO and KEGG annotation and enrichment analysis of the transcripts presented in AS events. A total of 2,557 transcripts were classified into three groups: 'biological processes', 'cellular components', and 'molecular function'. We satisfied the top 20 enriched pathways (Fig. 2c), and the top five most enriched pathways were 'pyruvate, phosphate dikinase activity', 'pyruvate metabolic process, regulation of proteolysis', 'ubiquitin-like protein ligase binding', and 'regulation of photoperiodism, flowering'. Using the KEGG database, we identified 5,833 transcript annotations, including 128 KEGG pathways. KEGG pathway enrichment analysis showed that the three most enriched pathways were 'glycosaminoglycan degradation', 'Glycosphingolipid biosynthesis – ganglio series', and 'Spliceosome' (Fig. 2d).
Acquisition and mining of transcriptome data
-
The Illumina NGS reads generated in this study were submitted to the BioProject database of the National Center for Biotechnology Information (accession number PRJNA991464). Leaf samples of female, male, and monoecious plants were determined for transcriptome analysis to clarify the sex differentiation mechanism in B. dactyloides (Fig. 3a−c). Using the Illumina NovaSeq6000 platform, we obtained 191.62 million clean reads and 53.44 GB of clean data from nine samples. The GC content was more than 53.36%, and the Q30 value was more than 94.05% (Supplemental Table S5). We identified 110,870 transcript expression profiles. We evaluated the quality of transcriptomic data using PCA and Spearman rank correlation. 110,870 transcripts were divided into three groups, with good repeatability within each group based on PCA results (Supplemental Fig. S2a). The correlation diagram showed that the correlation values in the female group are > 0.918; these values are > 0.977 in the male group and > 0.975 in the monoecious group (Supplemental Fig. S2b). The above results indicated that the sequencing data was sufficient for DEG analysis. We identified 49,448 DEGs using DESeq2 software (Fig. 3d). There were 31,174 DEGs (15,670 up-regulated and 15,504 down-regulated), 30,789 DEGs (15,992 up-regulated and 14,797 down-regulated), and 31,882 DEGs (16,265 up-regulated and 15,617 down-regulated) identified in the groups 'male vs female', 'monoecious vs female', and 'monoecious vs male', respectively (Supplemental Table S6).
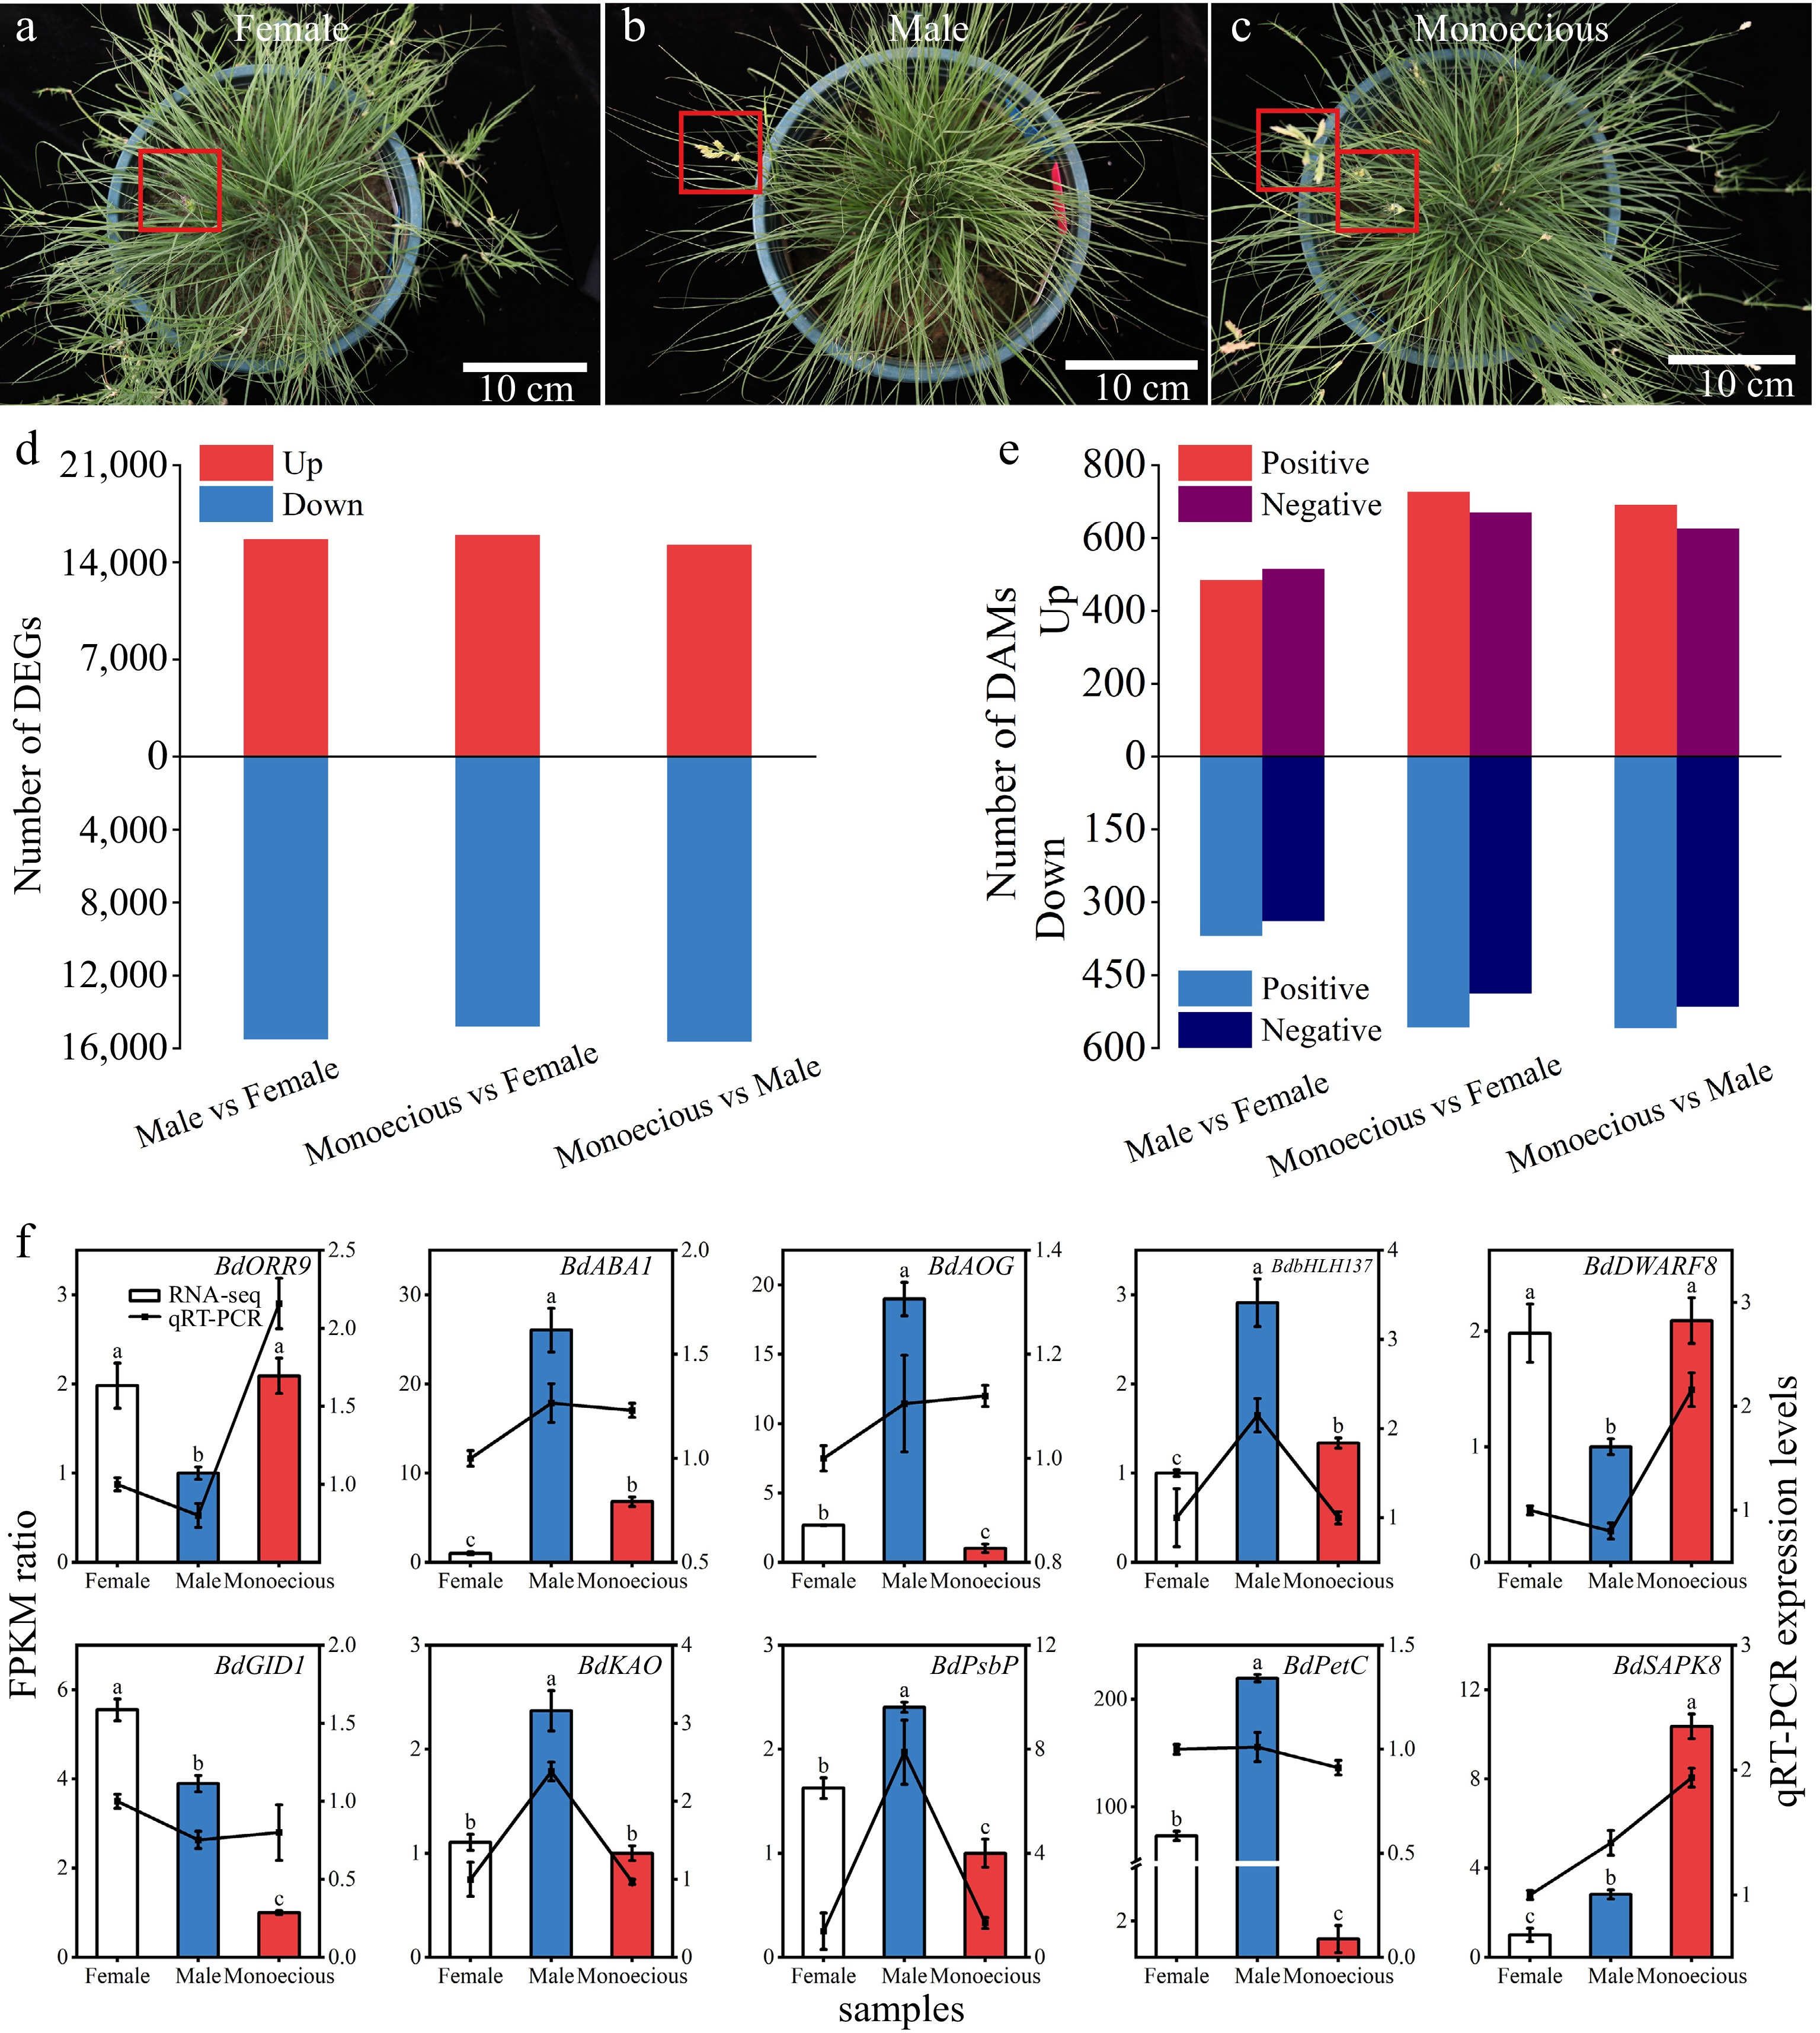
Figure 3.
(a)–(c) Differences in the appearance and the number of (d) DEGs and (e) DAMs between female, male, and monoecious sample groups in B. dactyloides. Red boxes indicate the flower of B. dactyloides. (f) Association analysis between RPKM ratio and relative expression levels of the qRT-PCR. Data represent the mean ± SD (n = 3). Bars represent RNA-seq data, and lines represent qRT-PCR data. The lower-case letters above the bars indicate a significant difference between the sample groups at p < 0.05.
We measured the expression levels of ten DEGs by qRT-PCR, including three ABA-related pathway genes (ABA1, AOG, and SnRK2), three GA-related pathways genes (KAO, GID1, and DELLA), two photosynthesis-related genes (PsbP and PetC), one CTK-related pathways gene (ARR), and one bHLH transcription factor. The qRT-PCR results validated the RNA-seq data (Fig. 3f).
We performed KEGG enrichment analysis of up-and down-regulated DEGs to reveal further the sex differentiation mechanism in B. dactyloides (Supplemental Fig. S3). For the group 'male vs female', 'synthesis and degradation of ketone bodies', 'photosynthesis – antenna proteins', and 'circadian rhythm – plant' were activated, while 'biosynthesis of various secondary metabolites – part 2', 'circadian rhythm – plant', and spliceosome were inhibited. For the group 'monoecious vs female', 'photosynthesis – antenna proteins', 'porphyrin and chlorophyll metabolism', 'circadian rhythm – plant' were activated, while diterpenoid biosynthesis, glutathione metabolism, arginine and proline metabolism were inhibited. For the group 'monoecious vs male', photosynthesis – antenna proteins, porphyrin and chlorophyll metabolism, and photosynthesis were activated, while isoflavonoid biosynthesis, monoterpenoid biosynthesis, and linoleic acid metabolism were inhibited.
Regulatory proteins dynamics during B. dactyloides sex differentiation
-
We predicted 9,916 regulatory proteins from 212 families using the iTAK prediction tool, including 4,331 TFs, 1,469 TRs, and 4,116 PKs. The top ten most numerous regulatory protein families are shown in Supplemental Fig. S4a. The top five regulatory protein families were RLK-Pelle_DLSV (520), bHLH (388), Others (309), MYB-related (300), and bZIP (252). Further, we analyzed the overlapping differentially expressed regulatory proteins between male vs female, monoecious vs female, and monoecious vs male. The result showed 688 differentially expressed regulatory proteins from 129 families in three groups (Supplemental Fig. S4b). The top ten most numerous regulatory protein families are shown in Supplemental Fig. S4c. RLK-Pelle_DLSV (62), others (31), NAC (26), bHLH (25), and MYB-related (19) were the top five regulatory protein families.
Furthermore, we concentrated on the expression patterns of regulatory protein of sex differentiation in B. dactyloides. For the group 'male vs female', 3,224 differentially expressed regulatory proteins were from 177 families (Supplemental Fig. S4d), including 1,719 up-regulated regulatory proteins from 166 families and 1,505 down-regulated regulatory proteins from 162 families. For the group 'monoecious vs female', there were 3,473 differentially expressed regulatory proteins from 179 families (Supplemental Fig. S4e), including 1,647 up-regulated regulatory proteins from 165 families and 1,826 down-regulated regulatory proteins from 158 families. For the abundant RLK-Pelle_DLSV regulatory protein family, there were 198 down-regulated regulatory proteins, whereas 80 up-regulated regulatory proteins. The number of down-regulated regulatory proteins in the WRKY family was more than seven times that of the up-regulated regulatory proteins. There were 3,515 differentially expressed regulatory proteins from 180 families for the group 'monoecious vs male' (Supplemental Fig. S4f), including 1,575 up-regulated regulatory proteins from 161 families and 1,940 down-regulated regulatory proteins from 160 families. For the abundant RLK-Pelle_DLSV regulatory protein family, there were 193 down-regulated regulatory proteins, whereas 57 up-regulated regulatory proteins. The number of down-regulated regulatory proteins in the WRKY family was more than ten times that of up-regulated regulatory proteins.
Sex-specific genes analysis
-
We found variations in gene expression among the sexes. Female plants had 588 genes relative to male and monoecious plants that deleted 2,020 genes. In addition, 1,961 genes were absent from female and monoecious plants vs male plants, and 526 genes were present only in male plants. Monoecious plants had 344 genes relative to female and male plants that deleted 1,629 genes. To identify the gene function related to plant sexual differentiation, we performed GO and KEGG enrichment of sex-specific genes (Supplemental Figs S5 & S6). Genes present only in female plants play significant roles in ADP binding (47) and defense response (41). Genes absent in female plants mainly participate in ADP binding (87) and defense response (76). Genes present only in male plants mainly participate in ADP binding (20). Genes absent in male plants are primarily involved in ADP binding (90), defense response (75), polysaccharide binding (18), rDNA binding (6), and 5S rDNA binding (6). Genes present only in monoecious plants mainly participate in ADP binding (19) and defense response (17). Genes absent in monoecious plants are the main participants in ADP binding (43), defense response (23), modification-dependent protein catabolic process (16), and dioxygenase activity (11).
In addition, for genes present only in female plants, the top three enriched pathways were plant-pathogen interaction, fatty acid elongation, and pentose phosphate. The top three enriched pathways for genes absent in female plants were phenylalanine, tyrosine and tryptophan biosynthesis, fructose and mannose metabolism, and tyrosine metabolism. Sesquiterpenoid and triterpenoid biosynthesis, ribosome, and isoquinoline alkaloid biosynthesis were the top three enriched pathways for genes present only in female plants. The top three enriched pathways for genes absent in male plants were glutathione metabolism, alpha-Linolenic acid metabolism, and peroxisome. Citrate cycle (TCA cycle), Riboflavin metabolism, and alpha-Linolenic acid metabolism were the top three enriched pathways for genes present only in monoecious plants. Alpha-Linolenic acid metabolism, fatty acid biosynthesis, and carbon fixation in photosynthetic organisms were the top three enriched pathways for genes absent in monoecious plants.
Acquisition and mining of metabolomic data
-
The metabolomics data generated in this study were submitted to MetaboLights database (accession number MTBLS8147). We scanned 10,011 peaks and 1,966 metabolites in positive code, 11,130 peaks, and 1,787 metabolites through qualitative and quantitative metabolome analysis of 18 samples using the LC-QTOF platform (Fig. 3e). We evaluated the quality of metabolomic data using PCA and Spearman rank correlation. A total of 3,753 metabolites were divided into three groups, with good repeatability within each group based on PCA results (Supplemental Fig. S2c). In addition, the correlation diagram showed that the correlation values in the female group are > 0.945; these values are > 0.922 in the male group and > 0.953 in the monoecious group (Supplemental Fig. S2d). We scanned 485 and 516 (positive and negative) up-regulated DAMs, as well as 369 and 339 down-regulated DAMs in the male vs female comparison. We observed 727 and 670 (positive and negative, the same below) up-regulated DAMs and 558 and 488 down-regulated DAMs in the monoecious vs female comparison. In the monoecious vs male comparison, we identified 691 and 626 up-regulated DAMs and 559 and 515 down-regulated DAMs (Supplemental Table S7). We performed KEGG enrichment pathway analysis based on identified DAMs. The top 20 enriched metabolic pathways in different groups are shown in Supplemental Fig. S7. For the group male vs female, the top four enriched pathways of DAMs (positive) were 'one carbon pool by folate', 'glutathione metabolism', 'pyrimidine metabolism', and 'anthocyanin biosynthesis'. The top two enriched pathways (negative) were flavone and flavonol biosynthesis and monobactam biosynthesis (Supplemental Fig. S7a). For the group 'monoecious vs female, the top four pathways (positive) were terpenoid backbone biosynthesis, glycerophospholipid metabolism, arachidonic acid metabolism, and carotenoid biosynthesis, while arachidonic acid metabolism was most enriched pathways (negative) (Supplemental Fig. S7b). For the group 'monoecious vs male', 'arginine and proline metabolism' was the top enriched pathways (positive), whereas 'phenylalanine, tyrosine and tryptophan biosynthesis', 'aflatoxin biosynthesis', and 'tyrosine metabolism' were the top three pathways (negative) (Supplemental Fig. S7c).
To further clarify the metabolic changes in response to sex differentiation, we completed KEGG pathway-based analysis with metabolites in female, male, and monoecious plants combined with positive and negative codes. We focused on the pathways involved in at least five DAMs and calculated differential abundance scores. Then we captured the tendency for DAMs in a pathway to increase or decrease than another group (Fig. 4). Among the 46 pathways identified in the group 'male vs female', three were up (> 0.5 differential abundance score, red, the same below), including bisphenol degradation, benzoate degradation, and protein digestion and absorption. During the 60 pathways found in the group 'monoecious vs female', three were up, including protein digestion and absorption, betalain biosynthesis, and central carbon metabolism in cancer. During the 71 pathways in the group 'monoecious vs male', five were up, including 'phosphotransferase system (PTS)', 'protein digestion and absorption', 'phenylalanine, tyrosine, and tryptophan biosynthesis', 'valine, leucine, and isoleucine degradation', and 'biosynthesis of various alkaloids'.
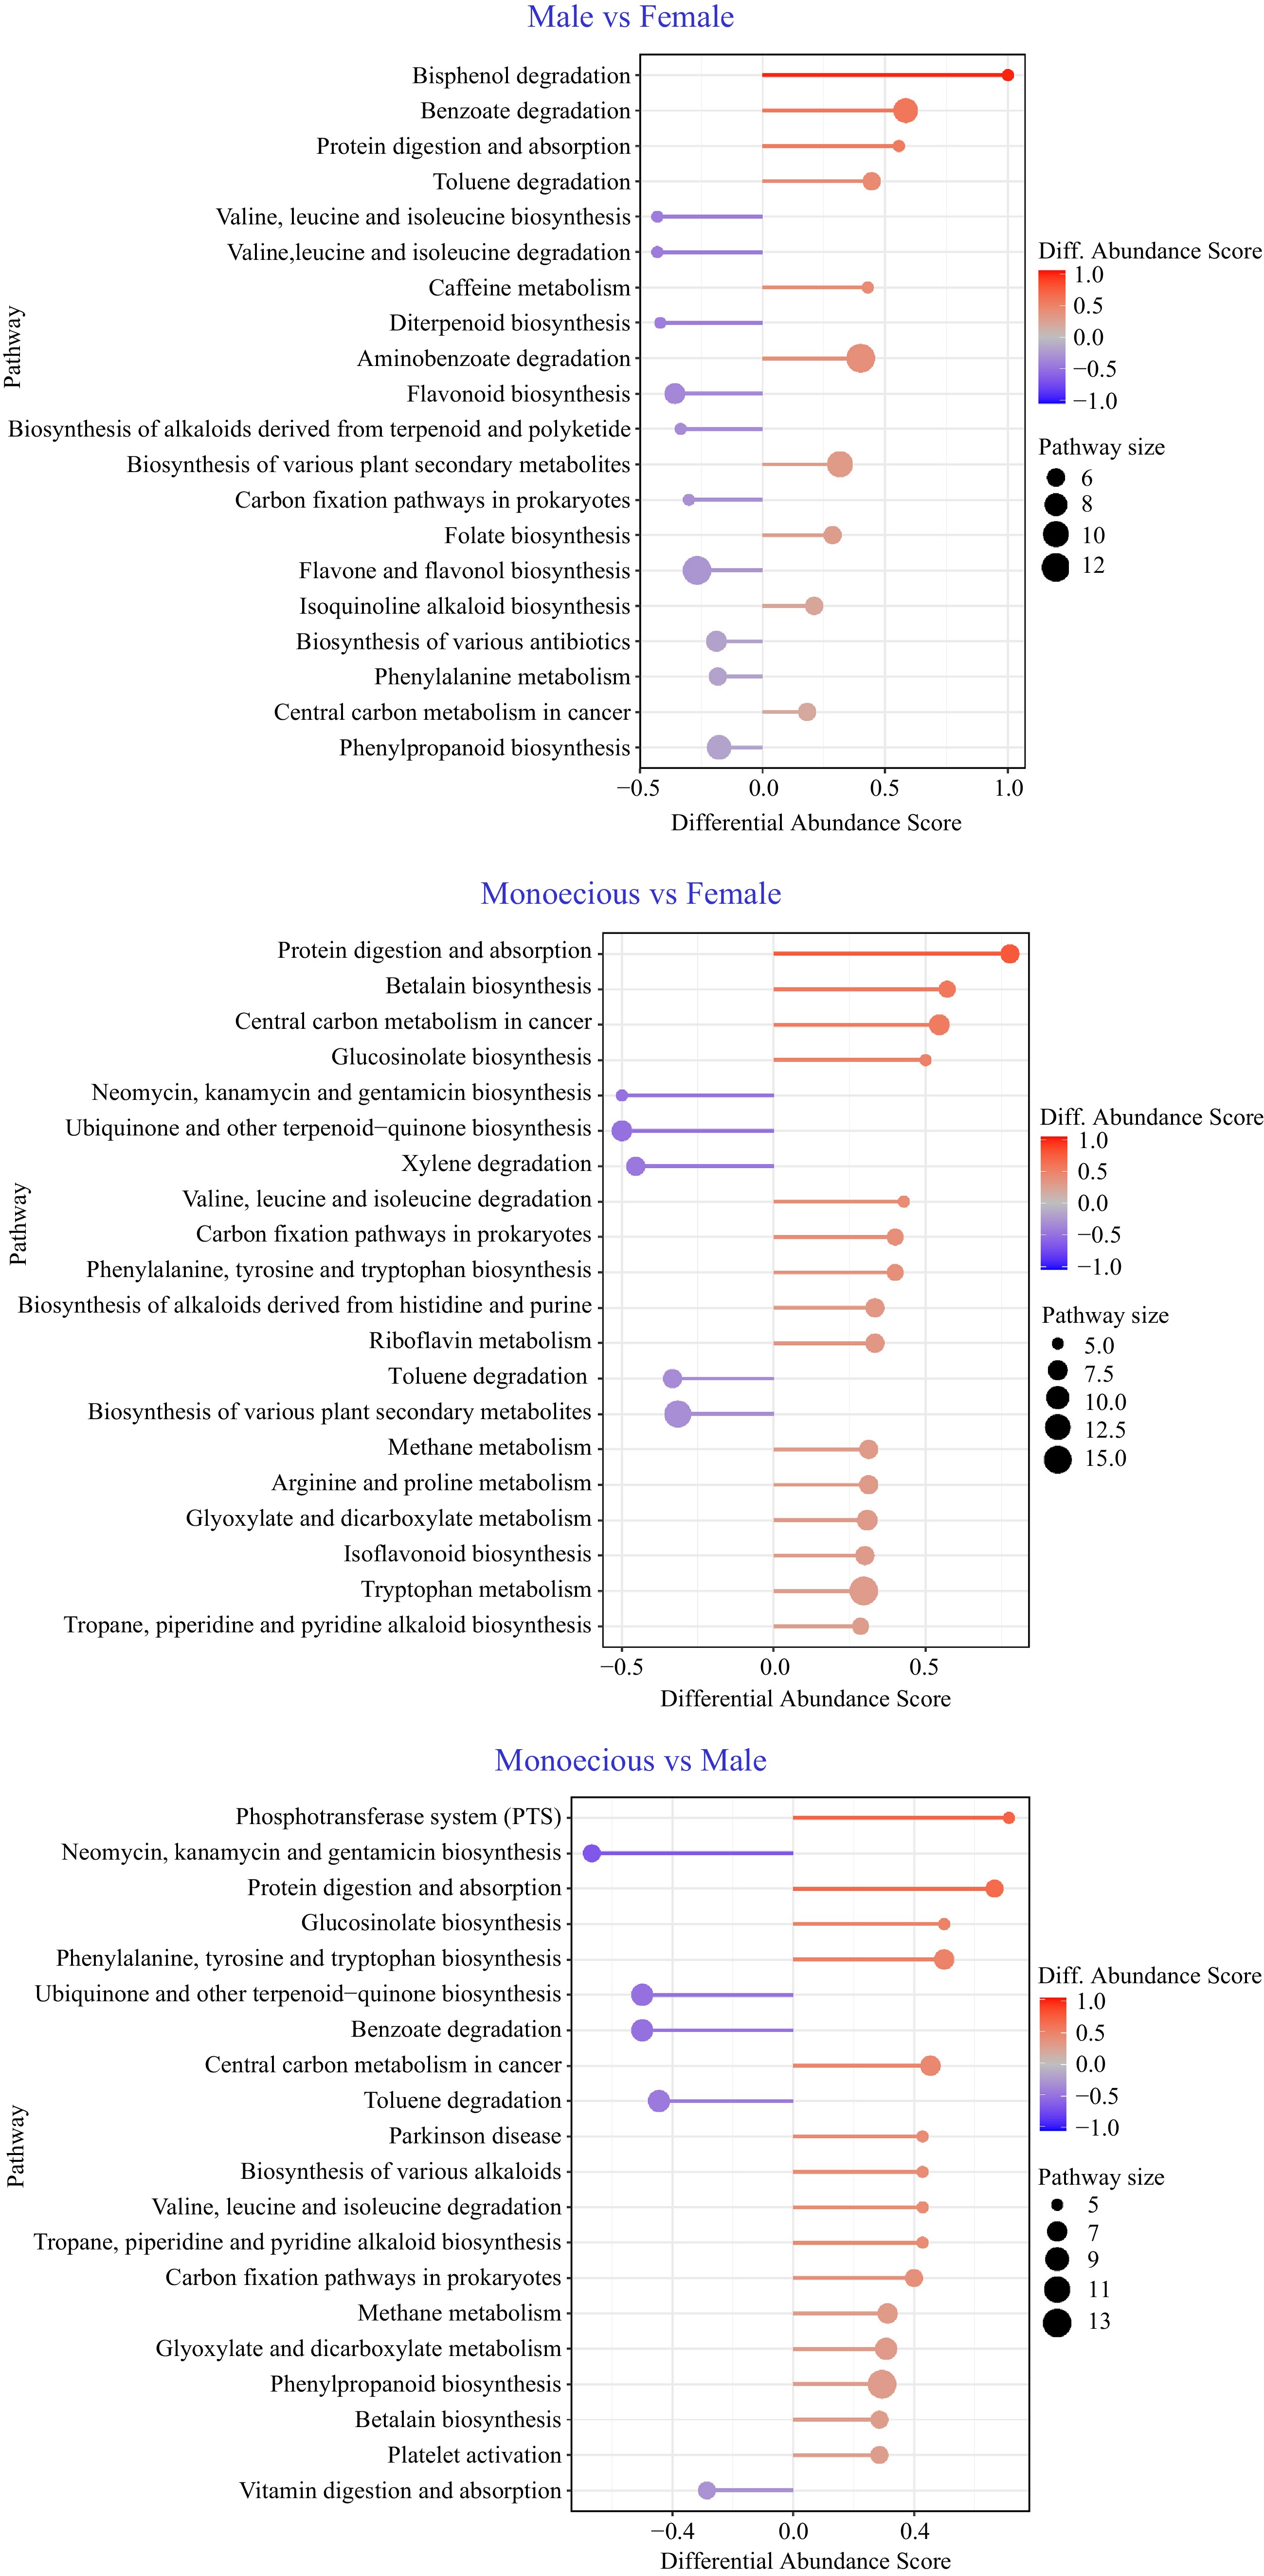
Figure 4.
Pathway-based analysis of metabolic changes on different groups. The differential abundance score captures the average, gross changes for all metabolites in a pathway. A score of 1 indicates all measured metabolites in the pathway increase, and –1 indicates all measured metabolites in a pathway decrease.
Correlation analysis of transcriptomic and metabolomic data
-
To further identify metabolic pathways associated with sex differentiation, we completed co-enrichment analyses of DEGs and DAMs (Fig. 5). Six significantly enriched pathways (p < 0.01) in the sample group (male vs female) included biosynthesis of amino acids and various secondary metabolites – part 2, carbon metabolism, photosynthesis, riboflavin metabolism, and Vitamin B6 metabolism (Fig. 5a). Seven significantly enriched pathways (p < 0.01) in sample group (monoecious vs female) included alpha-Linolenic acid metabolism, biosynthesis of amino acids and various secondary metabolites – part 2, carbon, glutathione, glyoxylate, dicarboxylate, porphyrin, and chlorophyll metabolism (Fig. 5b). Eleven significantly enriched pathways (p < 0.01) in sample group (monoecious vs female) included alpha-Linolenic acid metabolism, butanoate metabolism, glutathione metabolism, isoflavonoid biosynthesis, monoterpenoid biosynthesis, porphyrin, chlorophyll, propanoate, and riboflavin metabolism, sesquiterpenoid and triterpenoid biosynthesis, tyrosine metabolism, and Vitamin B6 metabolism (Fig. 5c).
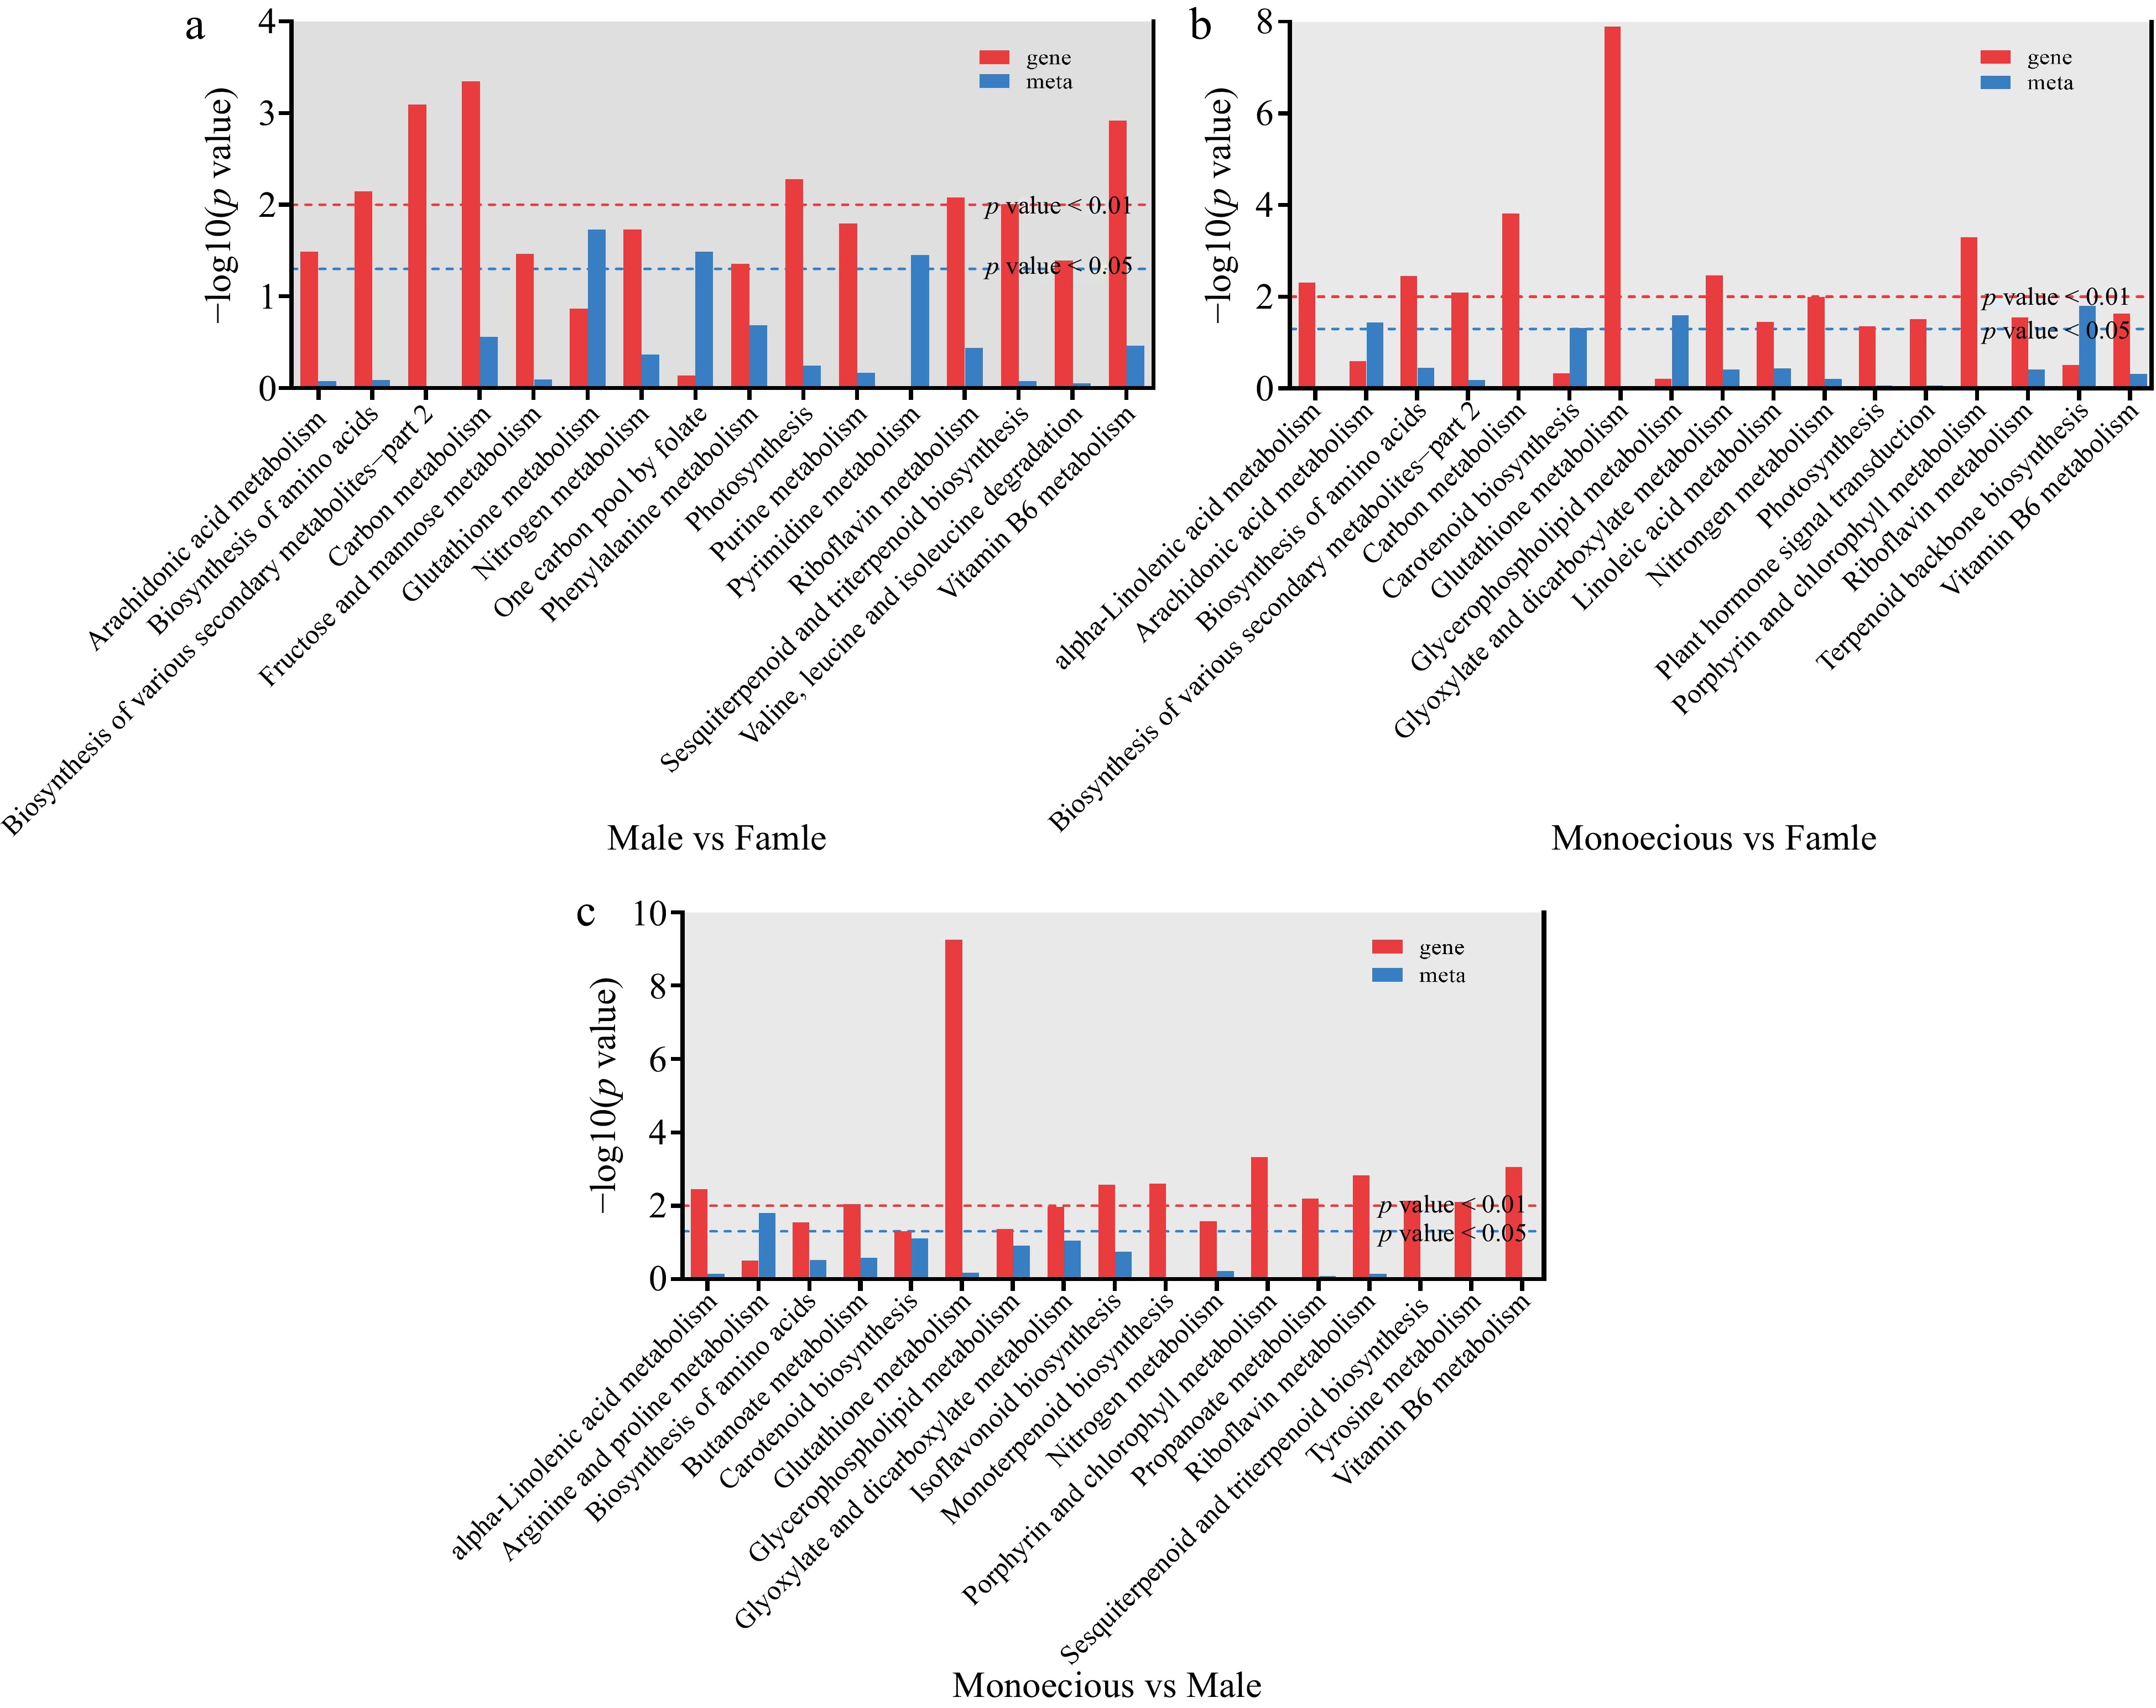
Figure 5.
Co-enrichment p-value histogram of DEGs and DAMs. (a) Male vs female. (b) Monoecious vs female. (c) Monoecious vs male.
Since these pathways are associated with glutathione metabolism, photosynthesis, and plant hormone biosynthesis and signal transduction, we mapped DEGs and DAMs simultaneously to related pathways using MapMan software better to understand the sex differentiation mechanisms in B. dactyloides.
Glutathione metabolism and photosynthetic capacity changes in response to sex differentiation
-
We draw the networks of DEGs and DAMs implicated in the glutathione metabolism pathway using MapMan software (Fig. 6a) to evaluate the impact of glutathione metabolism among sexes. The results showed that 154 genes and two metabolites were differentially expressed among the three groups. The glutamate content in monoecious plants was lower relative to male and female plants. Oxidized glutathione (GSSG) levels in female plants were lower than in male plants. GCL (encoding for glutamate-cysteine ligase catalytic subunit) and DHAR (encoding glutathione dehydrogenase/transferase) were less expressed in male plants relative to female and monoecious plants. In addition, the expression of GSS (encoding glutathione synthase) and GSR (encoding glutathione reductase) was lower in female plants than in male and monoecious plants. Many GSTs encoding glutathione S-transferase showed the highest in monoecious plants, followed by female plants, and the lowest in male plants. The results showed that the DEGs and DAMs related to glutathione metabolism were involved in response to sexual differentiation.
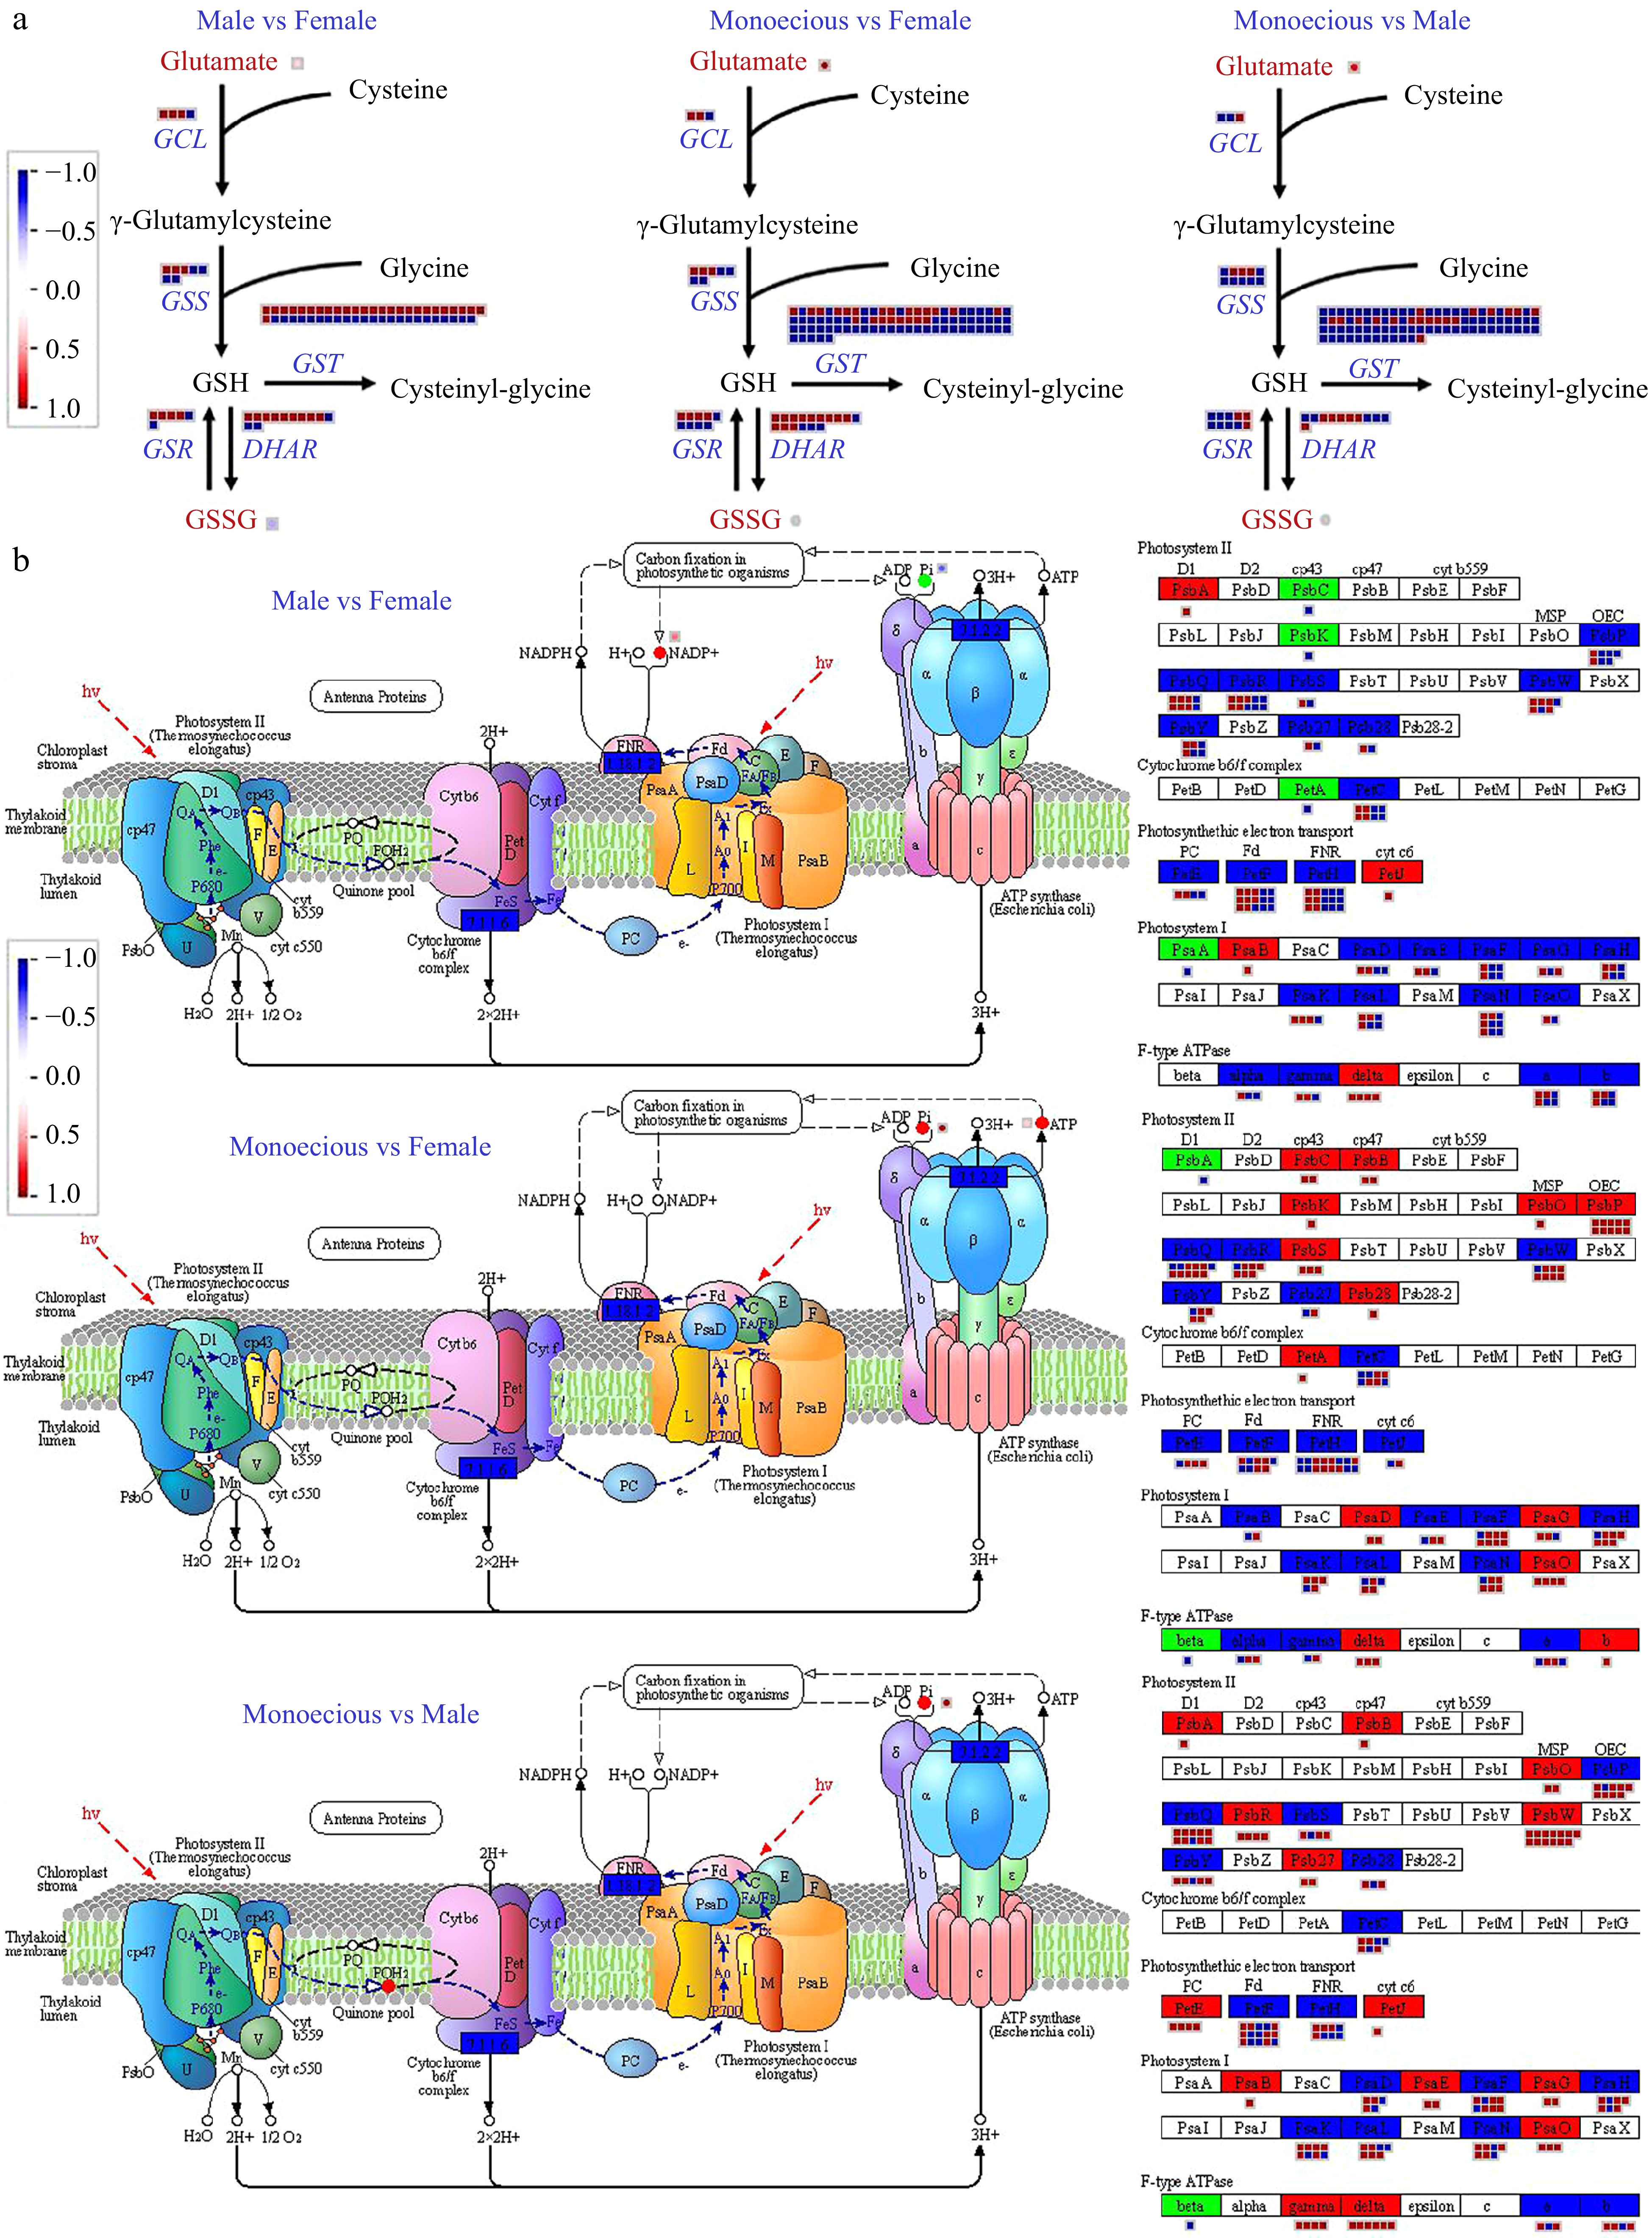
Figure 6.
Comparison of DEGs and DAMs involved in (a) glutathione metabolism and (b) photosynthesis pathways in response to sex differentiation. The red and blue text indicated DAM and DEG, respectively. The red color means up-regulation, while the blue color means down-regulation.
The DEGs and DAMs involved in photosynthesis are shown in Fig. 6b. 78.34% of DEGs in photosynthesis showed higher expression levels in male plants relative to monoecious plants, including PsbA, PsbB, PsbP, PsbR, PsbW, Psb27 proteins in photosystem Ⅱ (PSⅡ), PetH and PetJ responsible for photosynthetic electron transport, PsaB, PsaE, PsaG, and PsaO proteins in photosystem Ⅰ (PSⅠ), and the gamma and delta complexes of F-type ATPase. 73.38% DEGs in photosynthesis showed higher expression levels in female plants relative to monoecious plants, including PsbC, PsbB, PsbK, PsbO, PsbP, PsbS, PsbW, and Psb28 proteins in PSⅡ, PetA encoding cytochrome b6/f complex (Cyt b6f) subunits, PsaD, PsaG, and PsaO proteins in PSⅠ, and the delta and b sub-complexes of F-type ATPase. In addition, the expression level of photosynthesis-related genes varied in female and male plants. The PsbA, PetJ, PsaB, and delta content were higher, whereas PsbC, PsbK, PetA, and PsaA were less in female plants than in male plants. Phosphoric acid (Pi), ATP, and NADP were related to carbon fixation in photosynthetic organisms and varied among sexes. The Pi levels showed the highest in male plants, then female plants, and the lowest in monoecious plants. In female plants, the content of ATP was higher in monoecious plants, and the content of NADP was higher in male plants.
Plant hormones in response to sex differentiation
-
We examined the changes in hormone metabolites in female, male, and monoecious plants and found that abscisic acid (ABA), cytokinin (CTK), and gibberellin (GA) were differentially expressed. DEGs and DAMs involved in ABA, CTK, and GA metabolism and signaling pathways were mapped to related pathways using MapMan software to better understand the mechanism of plant hormones in response to sex differentiation.
We analyzed the levels of DAMs and DEGs encoding enzymes that participate in ABA metabolism in female, male, and monoecious plants (Fig. 7). Antheraxanthin content and the expression of DEGs encoding zeaxanthin epoxidase (ABA1/ZEP) were highest in female plants, then male plants, and lowest in monoecious plants. The neoxanthin levels were lower than in female and male plants. Compared with male plants, three out of five DEGs encoding 9-cis-epoxycarotenoid dioxygenases (NCEDs) were down-regulated in female plants. Compared with monoecious plants, four out of five DEGs encoding NCEDs were up-regulated in female plants; this value was eight out of nine in male plants. The number of overexpression DEGs encoding short-chain alcohol dehydrogenase (ABA2) and abscisic aldehyde oxidase (AAO3) was highest in monoecious plants, followed by female plants, and lowest in male plants. Compared with monoecious plants, the abscisic alcohol, ABA, and ABA glucosyl ester (ABA-GE) levels were lower than in female and male plants. 8' -hydroxy ABA was slightly down-regulated in male plants than in monoecious plants. Then we focus on the ABA catabolism enzymes abscisate beta-glucosyltransferases (AOGs) and Cytochrome P450 (CYP707A). Compared with male plants, two out of three DEGs encoding AOGs were up-regulated in female plants. Compared with monoecious plants, two DEGs encoding AOGs were up-regulated in female plants, and one DEGs encoding AOGs were up-regulated in male plants. Compared with male plants, three out of five DEGs encoding CYP707A were down-regulated in female plants. Compared with monoecious plants, three out of four DEGs encoding AOGs were up-regulated in female or male plants.
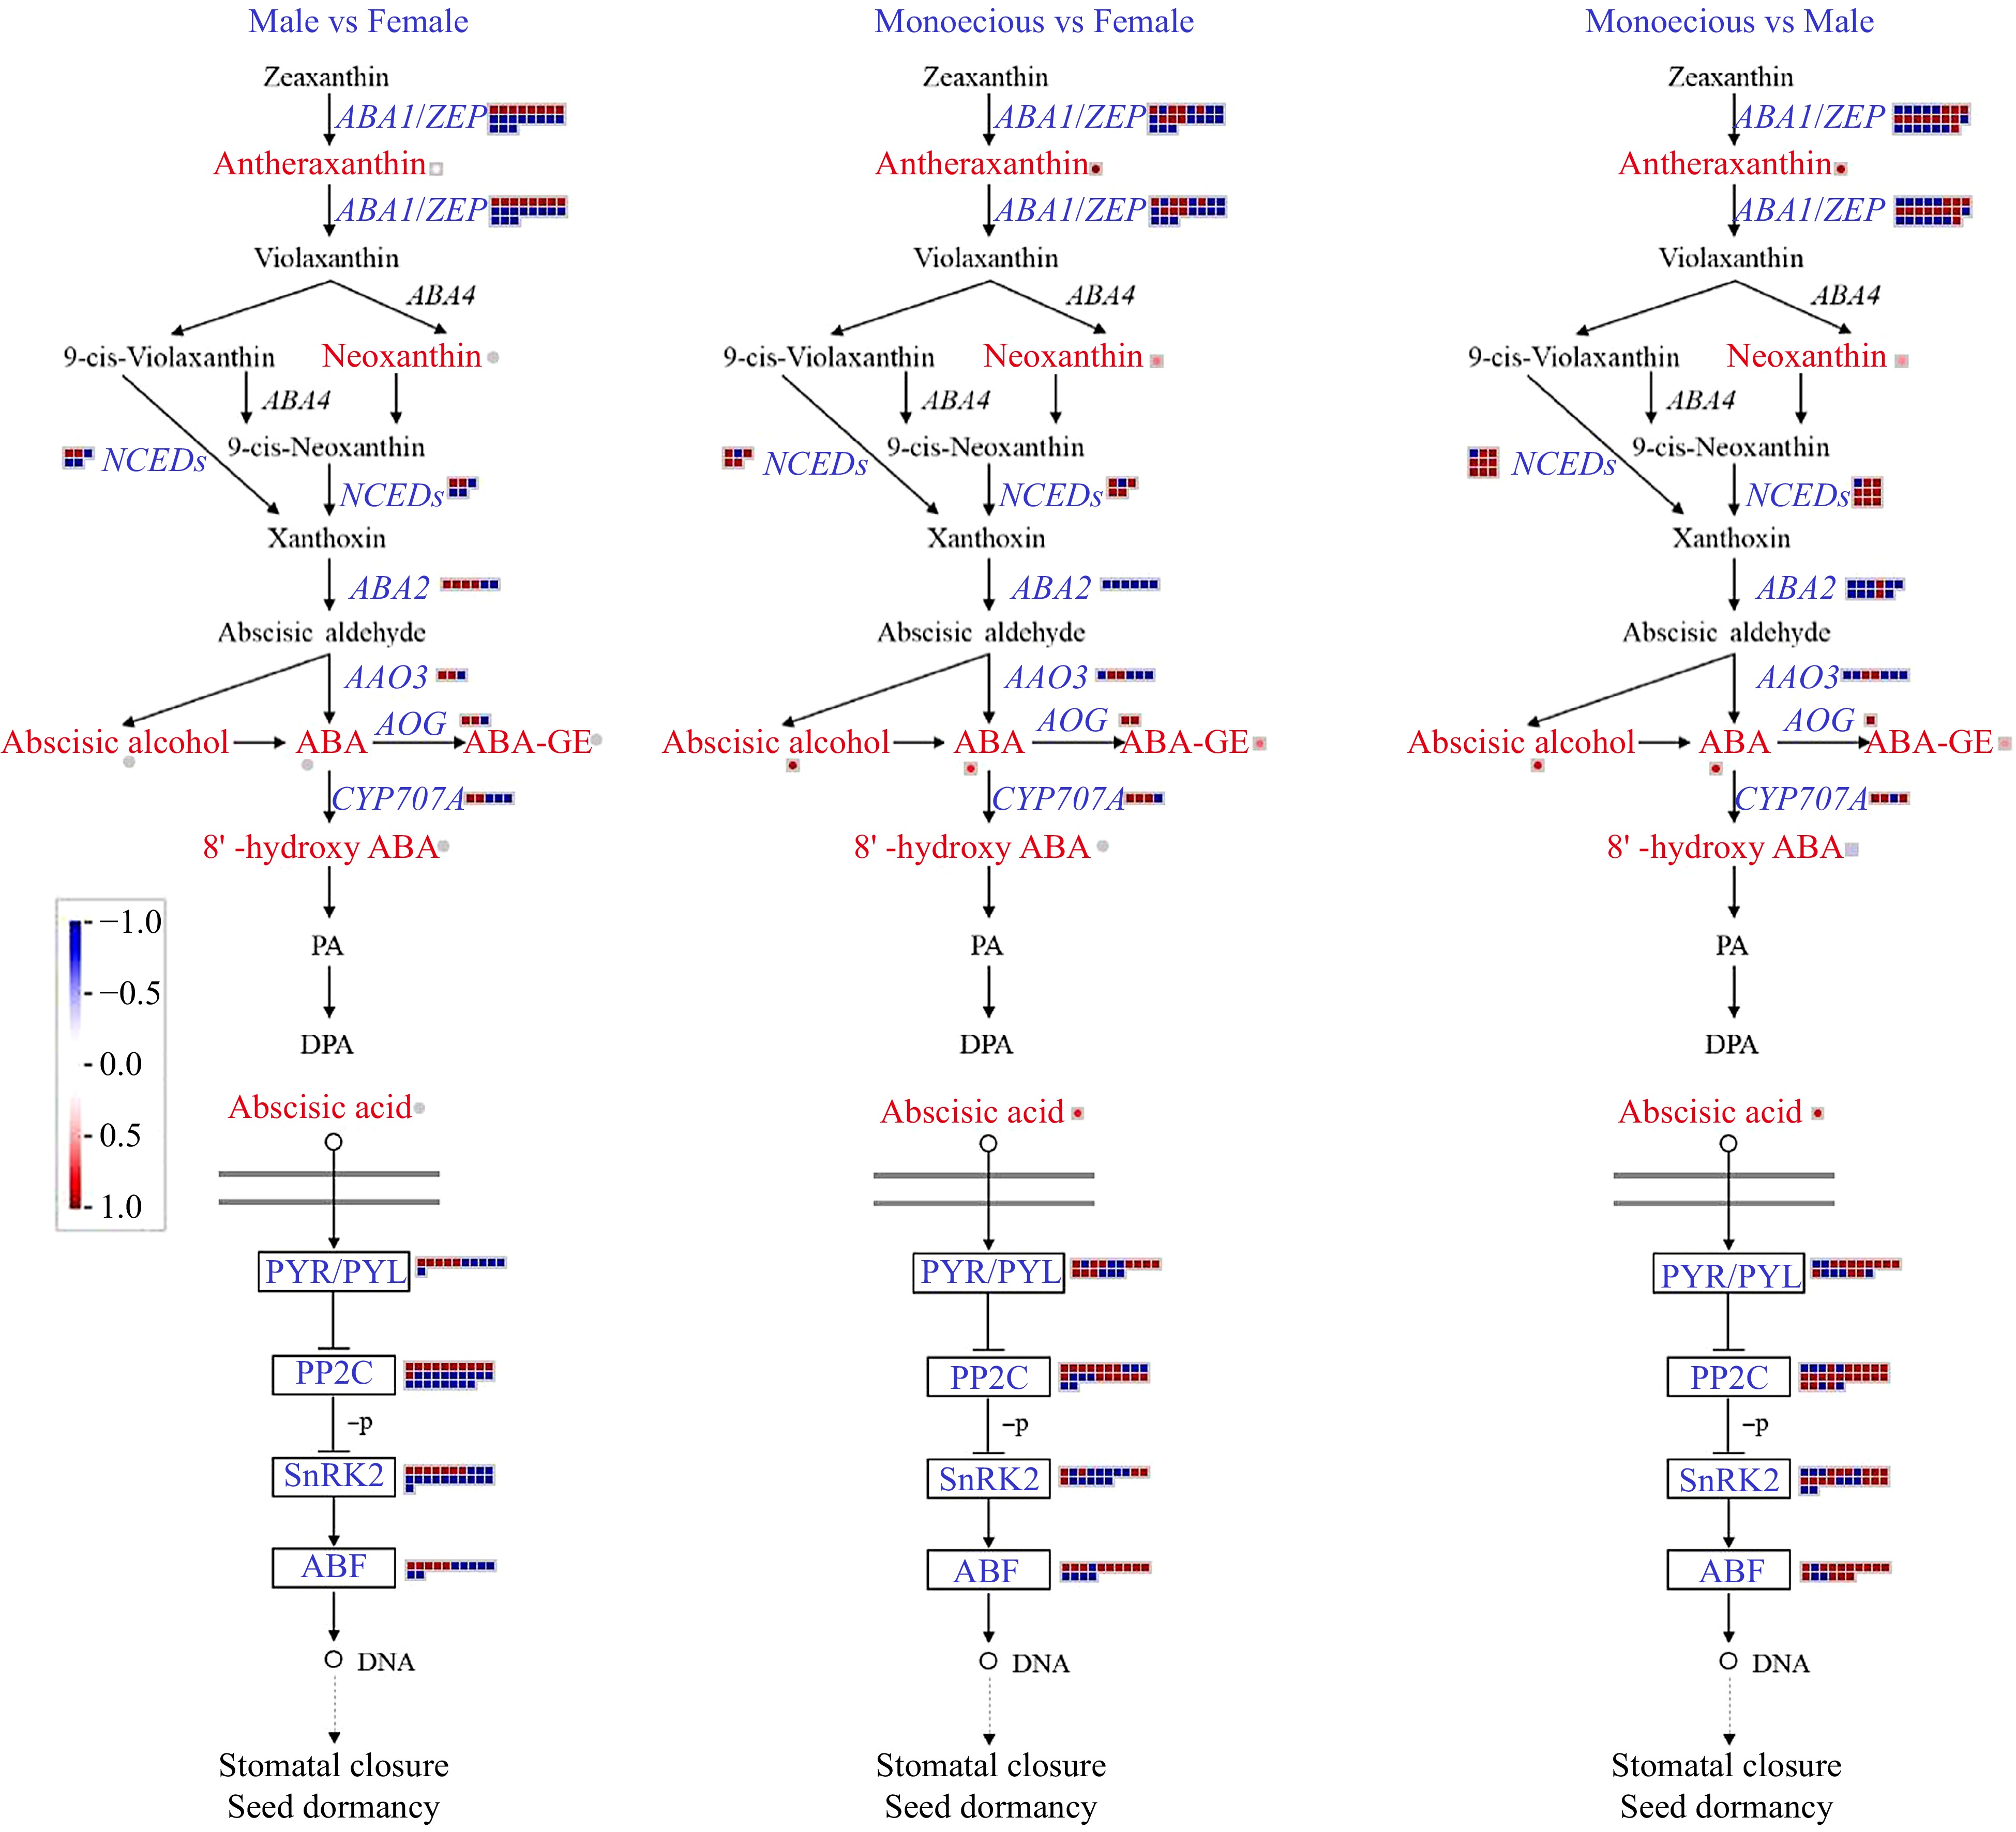
Figure 7.
Comparison of DEGs and DAMs involved in ABA biosynthetic and signaling pathways in response to sex differentiation. The red and blue text indicated DAMs and DEGs, respectively. The red color means up-regulation, while the blue color means down-regulation.
The expression patterns of ABA signaling genes were further analyzed. ABA acceptor protein PYR/PYL, Type 2C protein phosphatase (PP2C), SNF1-related protein kinase 2 (SnRK2), and transcriptional factor ABF were all differentially expressed. 71.25% and 55.22% of DEGs showed higher expression levels in male and female plants relative to monoecious plants, respectively. Furthermore, 71.61% of DEGs showed lower expression levels in female plants than in male plants.
We analyzed the GA biosynthesis, catabolism, and signal transduction pathways involving 275 DEGs and seven DAMs (Fig. 8). The expression of KS is less in the monoecious plant than in the female plant. Of the genes in the GA biosynthesis pathway, KAO and GA20ox are the most noteworthy. The essential genes, KAO and GA20ox, are more active in the male plant than in the female or monoecious plant (adjusted p-value < 0.01). PB_transcript_123979, encoding GA3ox, was expressed only in the monoecious plant. GA catabolism genes GA2ox also exist with specific expression. PB_transcript_514 was expressed only in the female plant. In contrast, PB_transcript_85857 was expressed only in male and monoecious plants. Compared with monoecious plants, about 80% of transcripts encoding GID1 (GA receptor) proteins were down-regulated in female plants, and this value was 75% in male plants. For GA signal repressors, DELLAs, there was little difference in the number of up-down and down-down DEGs among the three groups. Compared with phytochrome interacting transcription factors (PIFs) interacting with DELLA in monoecious plants, there were twice as many up-regulated DEGs as down-regulated DEGs.
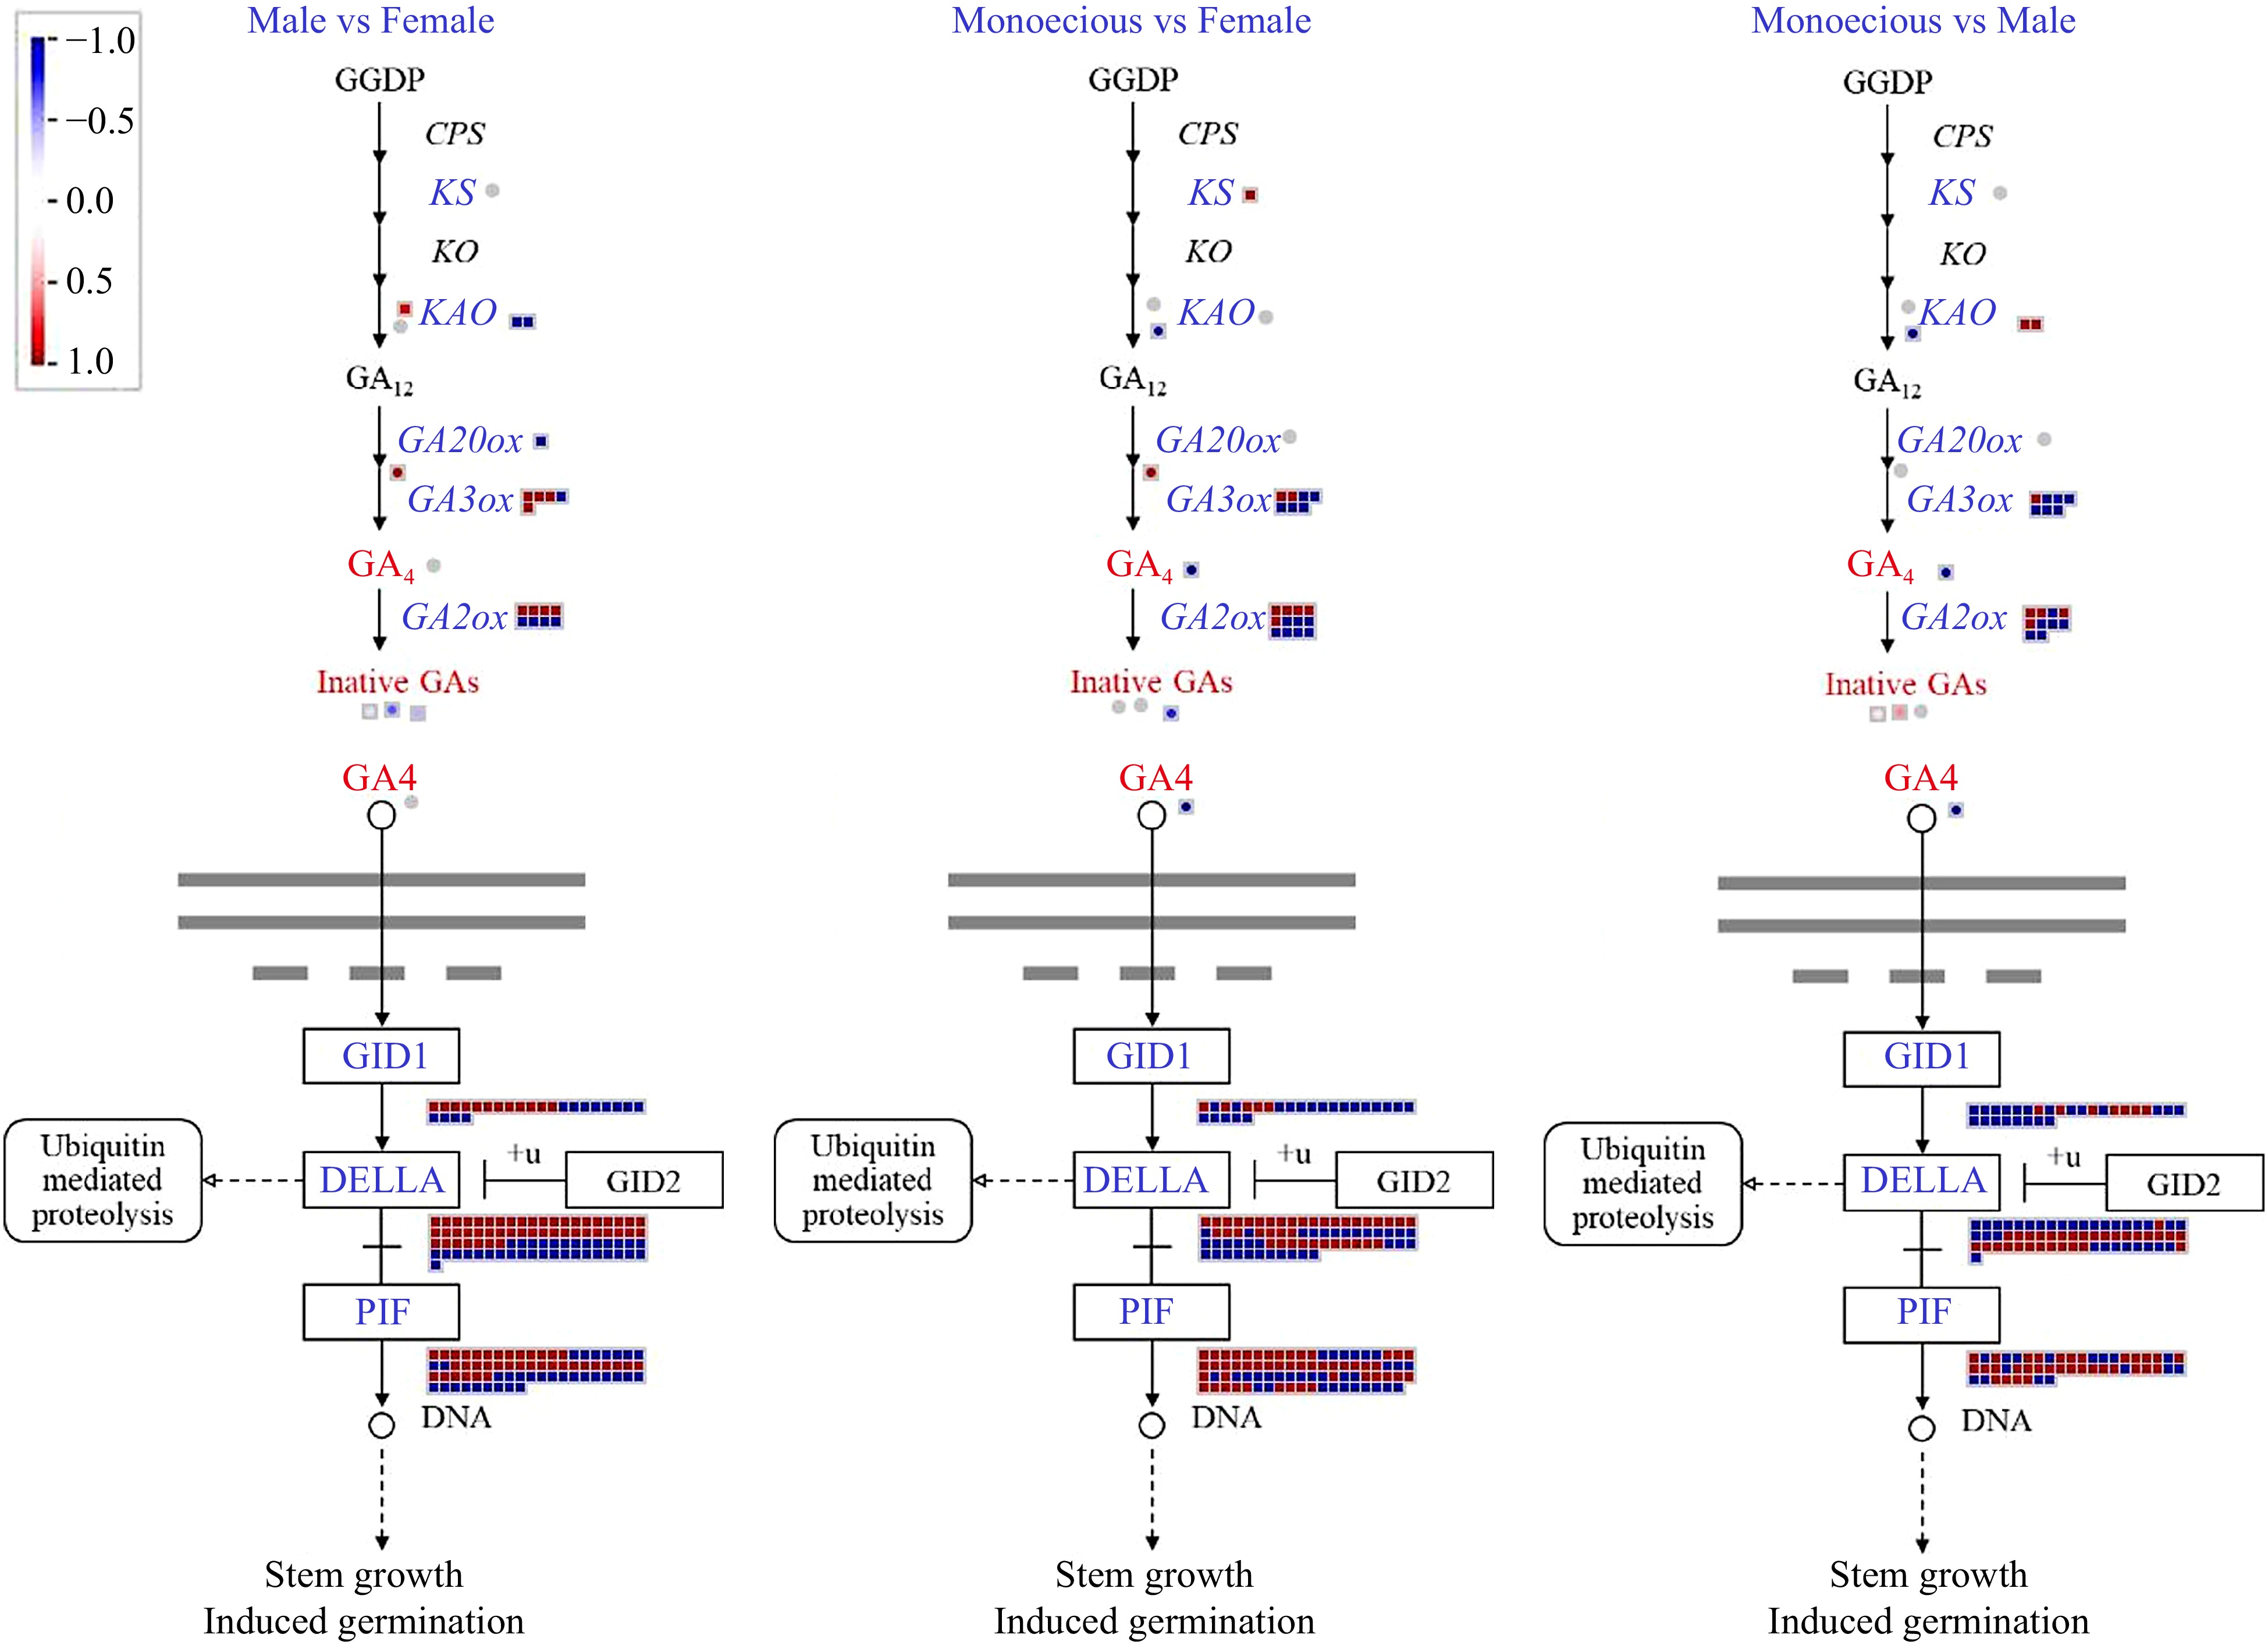
Figure 8.
Comparison of DEGs and DAMs involved in GA biosynthetic and signaling pathways in response to sex differentiation. The red and blue text indicated DAM and DEG, respectively. The red color means up-regulation, while the blue color means down-regulation. GGDP, geranylgeranyl diphosphate; CPS, ent-copalyl diphosphate synthase; KS, ent-kaurene synthase; KO, ent-kaurene oxidase; KAO, ent-kaurene acid oxidase; GA20ox, GA 20-oxidase; GA3ox, GA 3-oxidase; GA2ox, GA 2-oxidase; GID1, GA INSENSITIVE DWARF1.
We examined the expression of transcripts encoding enzymes and metabolites involved in CTK metabolism in female, male, and monoecious plants (Fig. 9). The expression of three critical enzymes involved in CTK biosynthesis, adenosine phosphate-isopentenyltransferases (IPTs), was significantly reduced in female and male plants compared with monoecious plants. The substrate synthesizing iPRPs, ATP, exhibited a higher level in male plants than in monoecious plants. Similarly, one of the iPRPs, the iPRMP in male plants, was higher than that in female and monoecious plants. The primary forms of CTK in plants are isopentenyladenine (iP), trans-zeatin (tZ), and dihydrozeatin (DZ). We found that iP exhibited a lower content in female plants, and tZ exhibited a lower level in male plants. Compared with monoecious plants, six out of seven DEGs encoding CTK oxidase (CKX) were up-regulated in female plants, while this value was six out of nine in male plants. UDP-glucose, conjugated to active CTKs, either tZ or DZ, showed a high content in male plants. The metabolites of CTK metabolism, UDP, trans-Zeatin-O-glucoside (tZOG), and O-Xylosylzeatin (OXZ), exhibited a higher level in monoecious plants than in male and female plants. The content of UDP in male plants was higher than in female plants. Likewise, the expression of DEG-encoding enzymes (UGT73C and UGT85A1) conjugated to CTKs in glucose to inactivate them was highest in monoecious plants, then male plants, and lowest in female plants. Transcripts encoding cytokinin response 1 (CRE1), histidine-containing phosphotransfer proteins (AHPs), and type-B response regulators (B-ARRs) were differentially expressed in female, male, and monoecious plants. Then we focused on the negative regulator of CTK signaling, the type-A response regulator (A-ARRs). Compared with male plants, 64.7% of DEGs encoding A-ARRs were up-regulated in female plants. Compared with monoecious plants, 57.9% of DEGs encoding A-ARRs were up-regulated in female plants, whereas this value was 33.3% in male plants.
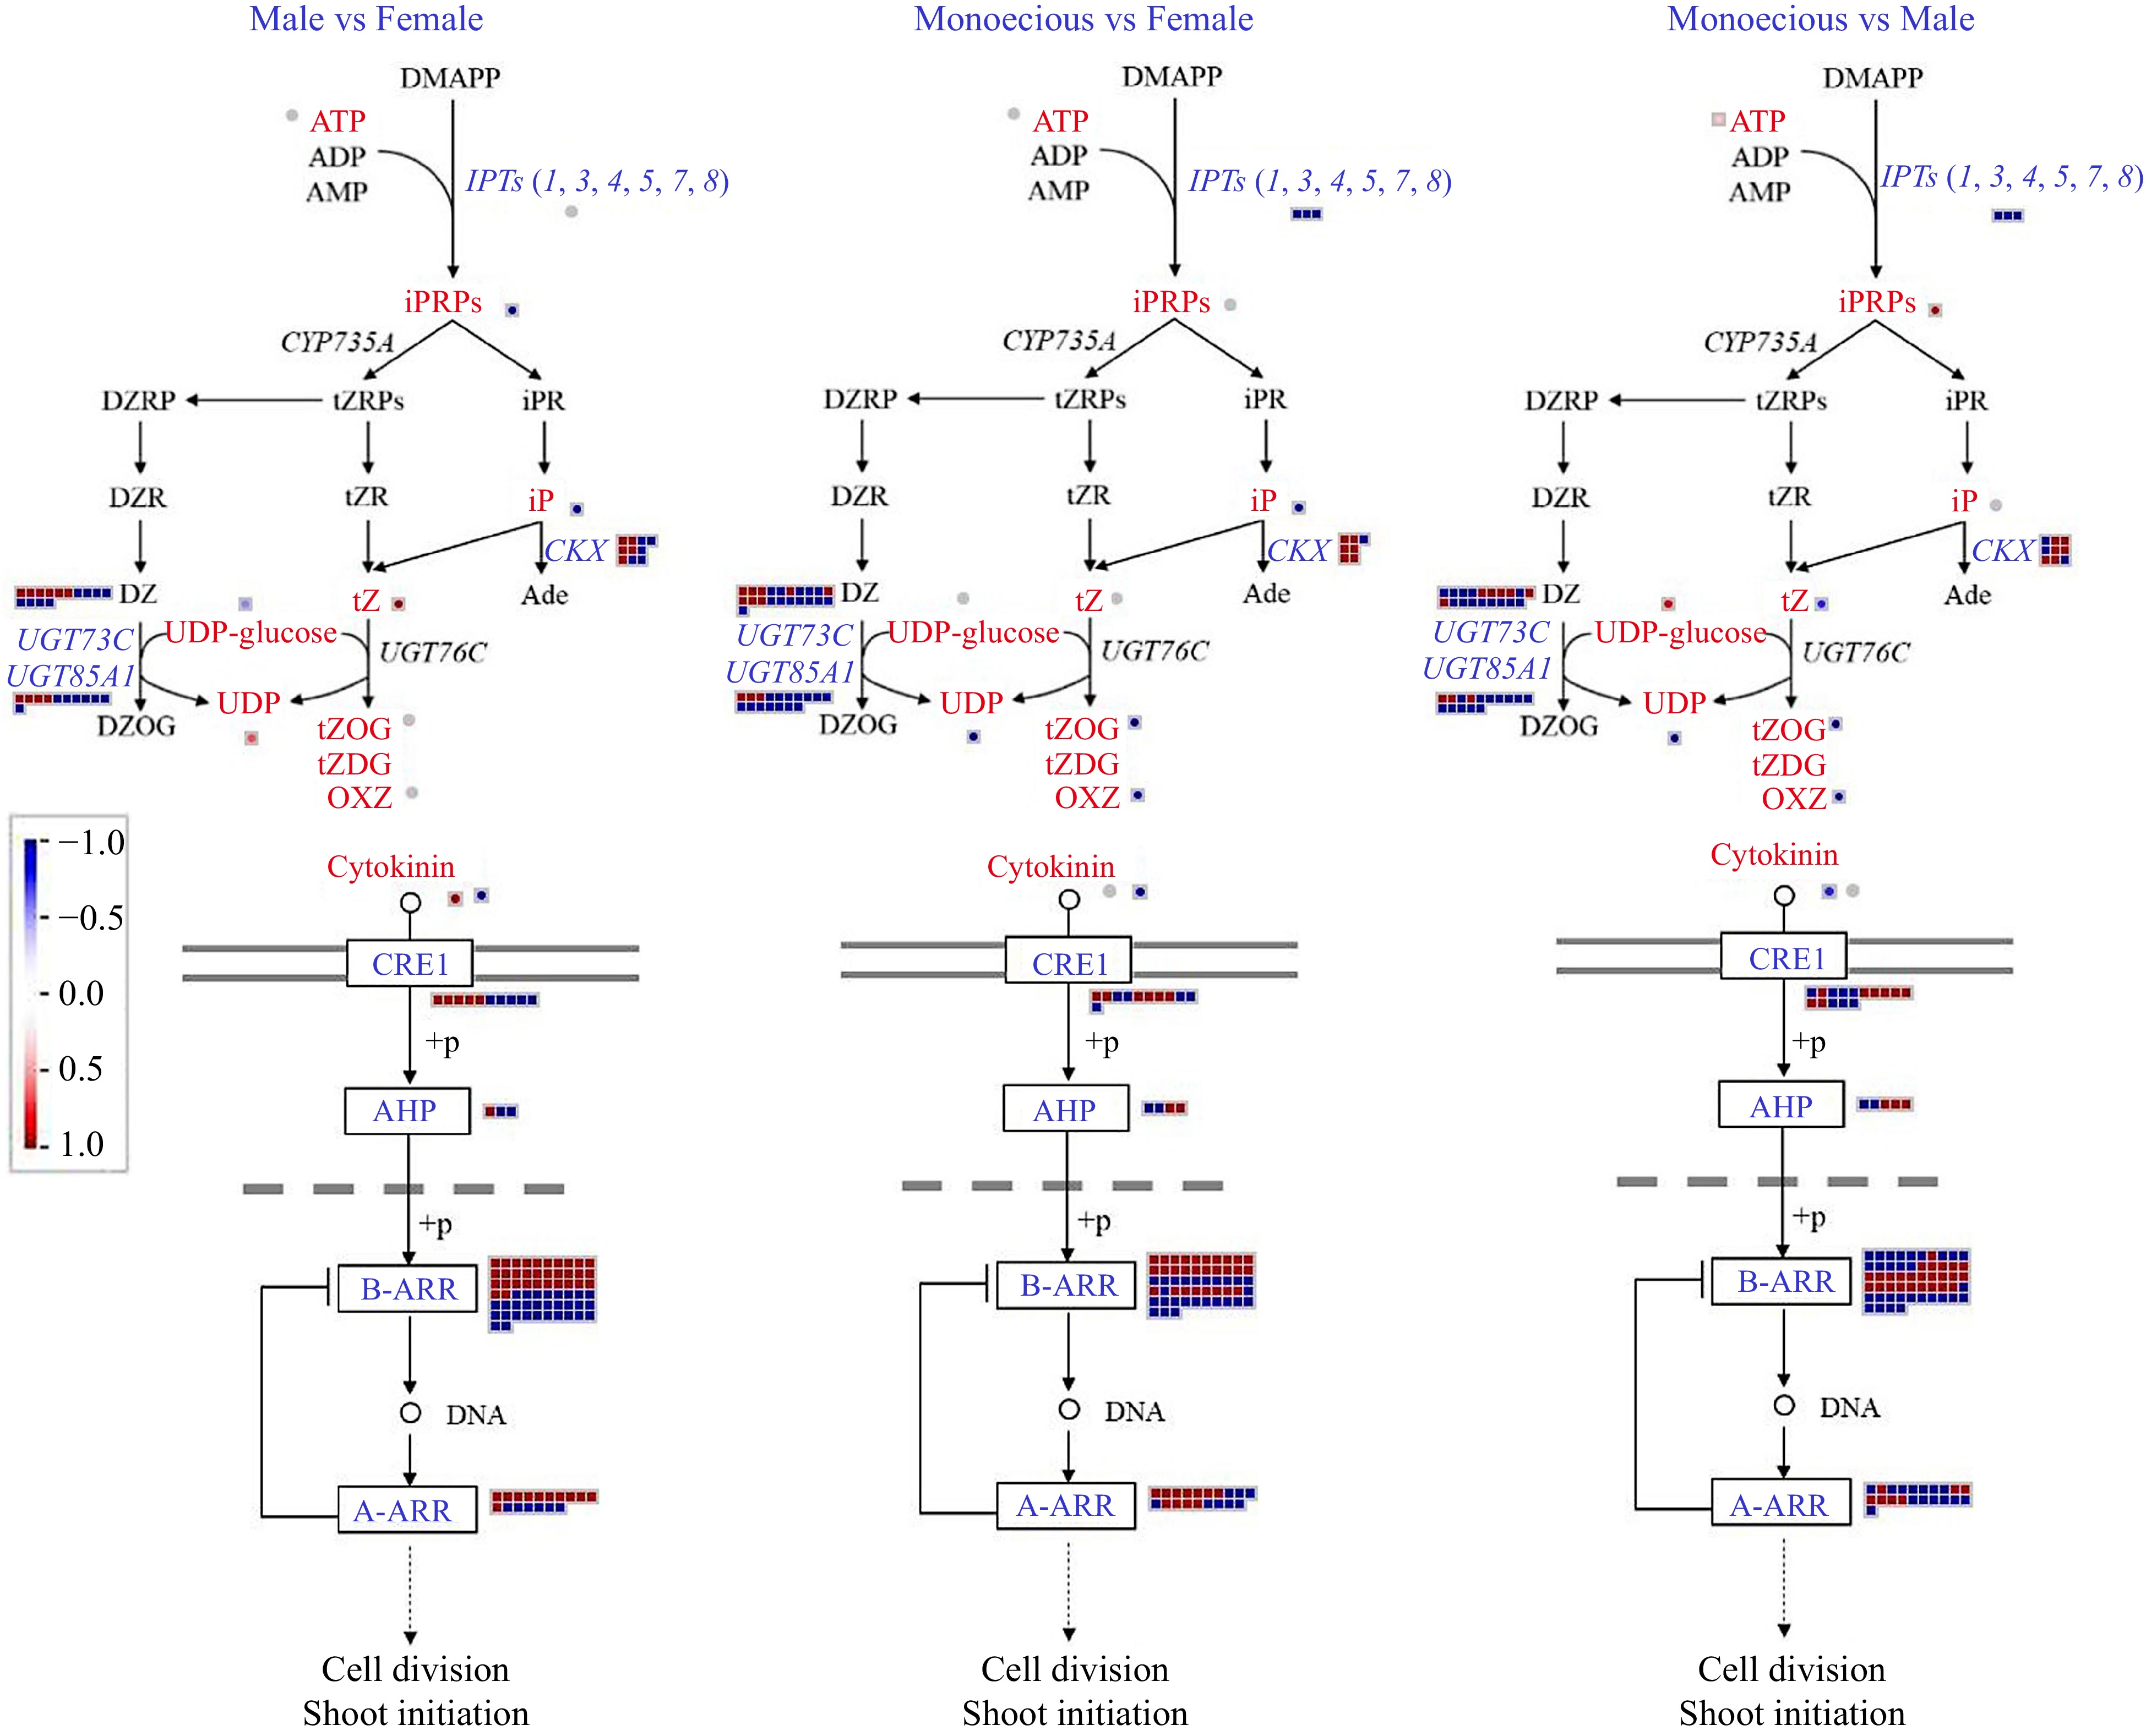
Figure 9.
Comparison of DEGs and DAMs involved in CTK biosynthetic and signaling pathways in response to sex differentiation. The red and blue text indicate DAM and DEG, respectively. The red color means up-regulation, while the blue color means down-regulation.
-
Buffalograss is a perennial warm-season grass species of Gramineae used commonly as pasture, ecological, or lawn grass[42]. Buffalograss plays a vital role in environmental restoration, creating economic benefits and promoting the high-quality development of the grassland and turf industries[3]. Buffalograss is a dioecious plant, and a few are monoecious. The visual and functional quality of the female plant in B. dactyloides is better than the male plant because when the male plant enters the flowering stage, there is a distinct yellow color due to the flower shaft being higher than the bush, and the female plant does not have such a problem[5]. There are both dioecious and monoecious plants in buffalograss, providing great convenience for studying sex differentiation. The identification of sex differentiation candidate genes (e.g., male sterility) is an essential step to proclaim the practical value of B. dactyloides and may provide necessary information for sex differentiation-related pathway elucidation.
The missing genome sequence and full-length cDNAs of B. dactyloides limit our research. This study first provided the full-length transcriptome of B. dactyloides and completed 90.52% of transcript function annotation using PacBio SMRT technology. Recent studies have shown that long non-coding RNAs (lncRNAs) play critical functions in various biological processes[43,44]. lncRNAs could interact with proteins, RNAs, and DNA to perform complex and diverse functions[28]. Therefore, identifying lncRNAs and their targets helps understand the biological processes and mechanisms of plants. We predicted 7,682 lncRNAs and target genes for 6474 lncRNAs. AS allows the plant to enhance gene coding potential, regulate gene expression via different mechanisms, and play essential functions in plant development[45,46]. We identified 4,091 AS events involved in 6,188 transcripts. Interestingly, 32 transcripts in AS events participate in the regulation of photoperiodism, flowering with a p-value of 1.08 × 10⁻⁸.
The correlation analysis of transcriptomic and metabolomic data better explains transcription regulation mechanisms in metabolic pathways[47,48]. To characterize sex differentiation in the buffalograss transcriptome and its regulation, we measured and analyzed the transcriptional and metabolomic responses of B. dactyloides to sex differentiation. The most important pathways responding to sex differentiation were glutathione metabolism, photosynthesis, and plant hormone metabolism in B. dactyloides.
The study demonstrated that glutathione metabolism was the most significantly enriched pathway in response to sex differentiation. One hundred and fifty four genes and two metabolites (glutamate and GSSG) related to glutathione metabolism had altered contents. GCL, GSS, GSR, DHAR, and GST participate in glutathione metabolism to generate glutamate, cysteine, and glycine, which are involved in several critical cellular functions, such as scavenging H2O2 and protecting cells from oxidative stress[47,49]. Based on our data, we can infer that glutathione metabolism was in response to sexual differentiation.
Notably, most DEGs were upregulated in male and female plants relative to monoecious plants, including those encoding PSⅡ proteins (such as PsbB and PsbO), cytochrome b6/F complex (such as PetA and PetC), electron transport proteins (such as PetE and PetJ), PSⅠ proteins (such as PsbB and PsbO), and ATP production proteins (gamma and delta). These genes govern light harvesting, electron transport, reduction-oxidation reactions, and ATP production[41,50]. The increased ATP and Pi levels aligned with this result. The above results supported the positive functions of maintaining the photosynthetic activity of leaves in male and female plants.
Three hormones (ABA, GA, and CTKs) varied in metabolite content among the sexes. NCEDs are a crucial enzyme in ABA biosynthesis[51]. We found the disruption of multiple NCEDs and the lowest abscisic alcohol and ABA levels in monoecious plants relative to female and male plants. Interestingly, we found the expression profile between NCEDs and ABA2/AAO3 in female, male, and monoecious plants was opposite, which suggests NCEDs, ABA2, and AAO3 were candidate genes involved in ABA homeostasis. ABA-GE, a stored form of ABA[51], consistently performs with abscisic alcohol and ABA in response to sexual differentiation. The lowest ABA content and disruption of multiple AOGs and CYP707A were found in monoecious plants compared to female and male plants, which suggests that reduced ABA leads to reduced ABA catabolism. In addition, we found that ABA signal transduction was more active in female and male plants than in monoecious plants. The above results showed that ABA biosynthesis, catabolism, and signaling synergize in response to sexual differentiation.
The active GAs (mainly GA4) are essential for stamen development and control of pistil growth in Arabidopsis[52]. The GA biosynthesis essential genes, KAO and GA20ox, are more active in male plants than female plants (adjusted p-value < 0.01). Furthermore, GA4 signal transduction was most active in female plants, followed by male plants, and inhibited in male plants. The above results showed that GA biosynthesis is inconsistent with GA signaling in response to sexual differentiation.
Compared with male and female plants, we found the overexpression of all three IPTs, the disruption of multiple CKXs, and the highest tZ and iP levels in monoecious plants. The results were in line with the previous report that tZ and iP levels are regulated and fine-tuned by IPTs and CKXs[53]. In addition, tZ deactivation was associated with the up-regulation of CTK modification enzymes, UGT73C and UGT85A1, and the results corresponded with the previous report[51]. The cytokinin receptor CRE1 and critical regulators (AHPs and B-ARRs) function in CTK perception and signaling[53]. Surprisingly, there was little difference in the number of DEGs encoding the proteins CRE1, AHPs, and B-ARRs in female, male, and monoecious plants, which is likely due to compensatory changes in the expression of CTK signaling genes to maintain the appropriate level of CTK function[53]. A-ARRs are considered CTK signaling negative regulators[51,53]. Compared with female and monoecious plants, we found disruption of multiple A-ARRs and the lowest tZ levels in male plants. The results suggest that reduced tZ leads to reduced CTK signaling[51]. The results above suggest that active CTKs and genes encoding IPTs, CKXs, UGT73C, UGT85A1, and A-ARRs involved in CTK metabolism and signaling play critical roles in response to sex differentiation.
-
Few studies have investigated transcript annotation and complete mRNA structure in B. dactyloides, and the pathways of species-specific factors in sex differentiation remain unclear. We performed full-length transcriptome, second-generation transcriptome, and metabolome analysis to specify candidate factors influencing sex differentiation. We first provided the full-length transcriptome of B. dactyloides, identified 110,870 full-length transcripts, and obtained 90.52% of transcript annotation information. Then we identified 49,448 DEGs and 3,070 DAMs in female, male, and monoecious leaf samples. The co-enrichment analysis indicated that sexual differentiation was regulated by glutathione metabolism, photosynthesis, plant hormone biosynthesis, catabolism, and signaling. The identification of DEGs and DAMs that participate in glutathione metabolism, photosynthesis, ABA, CTK, and GA biosynthesis, catabolism, and signaling has helped illuminate the roles of plant hormones in the sex differentiation of B. dactyloides. The full-length transcriptomic data will allow further functional gene studies. Integrating transcriptomic and metabolomic data advances knowledge of the molecular mechanism of sex differentiation and provides information on breeding programs for B. dactyloides.
-
The authors confirm contribution to the paper as follows: methodology, investigation, writing-original draft preparation, writing-reviewing and editing: Guan J; investigation, supervision, validation: Muye Liu; investigation: Yue Y; investigation, formal analysis, visualization: Yin S; investigation, validation: Teng W; investigation, validation: Zhang H, Wen H; resources, investigation, validation: Wu J; conceptualization, resources, writing-reviewing and editing, funding acquisition: Teng K; conceptualization, supervision, writing - review & editing: Fan X. All authors reviewed the results and approved the final version of the manuscript.
-
The PacBio SMRT reads and the Illumina NGS reads generated in this study were submitted to the BioProject database of the National Center for Biotechnology Information (accession numbers PRJNA991319,
https://dataview.ncbi.nlm.nih.gov/object/PRJNA991319?reviewer=d9n2nbtdcpp1l5q6keuit0ih0b ; PRJNA991464,https://dataview.ncbi.nlm.nih.gov/object/PRJNA991464?reviewer=7lj1iamddr3jk1nhtvf6fikp7i ). The metabolomics data generated in this study were submitted to MetaboLights database (accession number MTBLS8147,https://www.ebi.ac.uk/metabolights/editor/MTBLS8147/descriptors ). This work was funded by the Scientific Funds of Beijing Academy of Agriculture and Forestry Sciences (Grant Number: KJCX20210431) and Key R&D projects of Yunnan Province (Grant Number: 202203AP140153).
-
The authors declare that they have no conflict of interest.
- Supplemental Table S1 Primers used for qRT-PCR validation.
- Supplemental Table S2 Prediction of Simple sequence repeats (SSRs) out of transcript datasets.
- Supplemental Table S3 List of targets of lncRNA in B. dactyloides.
- Supplemental Table S4 Summary of AS events in B. dactyloides.
- Supplemental Table S5 Illumaina Sequencing Data Assessment.
- Supplemental Table S6 Differentially expressed genes identified between different sample groups.
- Supplemental Table S7 Differentially accumulated metabolites identified between different sample groups.
- Supplemental Fig. S1 Summary of SMRT sequencing. (A) CCS read length distribution. (B) FLNC sequences read length distribution. (C) Consensus isoforms read length distribution.
- Supplemental Fig. S2 The quality evaluation of transcriptomic and metabolomic data. PCA analysis of all transcripts (A) and metabolites (B), respectively. Heatmap analysis of correlation between samples in all transcripts (C) and metabolites (D), respectively.
- Supplemental Fig. S3 KEGG enrichment of the up-regulated and down-regulated DEGs identified in Male vs Female (A), Monoecious vs Female (B), and Monoecious vs Male (C), respectively.
- Supplemental Fig. S4 Prediction of regulatory proteins. A Number and family of top ten regulatory proteins predicted by SMRT sequencing data. B Venn diagram of differentially expressed regulatory proteins. C Number and family of top ten differentially expressed regulatory proteins. D-F The differentially expressed regulatory proteins predicted in Male vs Female, Monoecious vs Female, and Monoecious vs Male, respectively.
- Supplemental Fig. S5
- Supplemental Fig. S5 GO enrichment of sex-specific genes. (A) Genes present only in female plants. (B) Genes absent in female plants. (C) Genes present only in male plants. (D) Genes absent in male plants. (E) Genes present only in monoecious plants. (F) Genes absent in monoecious plants.
- Supplemental Fig. S6 KEGG enrichment of sex-specific genes. (A) Genes present only in female plants. (B) Genes absent in female plants. (C) Genes present only in male plants. (D) Genes absent in male plants. (E) Genes present only in monoecious plants. (F) Genes absent in monoecious plants.
- Supplemental Fig. S7 KEGG enrichment analysis of DAMs in the positive (left) and negative (right) ion mode in the comparison of Male vs Female (A), Monoecious vs Female (B), and Monoecious vs Male (C) sample groups.
- Copyright: © 2023 by the author(s). Published by Maximum Academic Press, Fayetteville, GA. This article is an open access article distributed under Creative Commons Attribution License (CC BY 4.0), visit https://creativecommons.org/licenses/by/4.0/.
-
About this article
Cite this article
Guan J, Yue Y, Yin S, Teng W, Zhang H, et al. 2023. Integration analysis of full-length transcriptomics and metabolomics provides new insights into the mechanism of sex differentiation in buffalograss (Buchloe dactyloides). Grass Research 3:24 doi: 10.48130/GR-2023-0024 

Integration analysis of full-length transcriptomics and metabolomics provides new insights into the mechanism of sex differentiation in buffalograss (Buchloe dactyloides)
- Received: 25 September 2023
- Accepted: 02 November 2023
- Published online: 05 December 2023
Abstract: The study of sexual and evolutionary differences has long been imperative in the field of biology. Unlike animals, dioecious angiosperms account for only about 6% of the total. Buffalograss (Buchloe dactyloides) plays a vital role in environmental restoration, creating economic benefits and promoting the high-quality development of the grassland and turf industries. Its natural populations contain differing ratios of male, female, and monoecious plants. The value of buffalograss for studying the sex differentiation mechanism in plants cannot be ignored. However, few studies have investigated transcript annotation and complete mRNA structure in B. dactyloides, and the pathways of species-specific factors in sex differentiation remain unknown. We integrated the full-length transcriptome, second-generation transcriptome, and metabolome to specify candidate factors influencing sex differentiation. We identified 110,870 full-length transcripts and obtained 100,362 (90.52%) transcript and annotation information. Then we identified 49,448 differentially expressed genes (DEGs) and 3,070 differentially accumulated metabolites (DAMs) in female, male, and monoecious leaf samples. The co-enrichment analysis indicated that sexual differentiation was regulated by glutathione metabolism, photosynthesis, plant hormone biosynthesis, catabolism, and signaling. The identification of DEGs and DAMs that participate in glutathione metabolism, photosynthesis, abscisic acid (ABA), cytokinin (CTK), and gibberellin (GA) biosynthesis, catabolism, and signaling has helped illuminate the roles of plant hormones in the sex differentiation of B. dactyloides. The full-length transcriptomic data will facilitate additional studies on functional genes. Integration of transcriptomic and metabolomic data advances knowledge of the molecular mechanism of sex differentiation and provides information for B. dactyloides breeding programs.
-
Key words:
- Buchloe dactyloides /
- Angiosperm /
- Sex differentiation /
- Full-length transcriptome /
- Metabolome