


-
The genus Cynodon (L.) Rich. is typically grown in tropical, subtropical, and warm temperate regions[1] and has multiple uses of high economic and ecological significance[2]. The genus is comprised of diploid, triploid, tetraploid, pentaploid, and hexaploid with x = 9[3]. The interspecific hybrid bermudagrass (C. dactylon × C. transvaalensis; 2n = 3x = 27 and 2n = 3x = 36) is the most widely used warm season turfgrass[4] with a considerable genetic diversity in morphological, developmental, and adaptation attributes. Hybrid bermudagrasses are widely used worldwide because of their ability to grow in different soil types, good abiotic stress tolerance, high traffic tolerance, low growing stature, and aggressive sod-forming growth habits[5, 6].
While bermudagrass germplasm has considerable genetic variability for turf characteristics, a lack of cost-effective high throughput phenotyping (HTP) systems that could provide layered trait information has restricted the ability to dissect the genetics of turf quality characteristics[7]. Consequently, conventional bermudagrass breeding is predominantly based on selection for morphological traits, growth attributes, and agronomic characteristics (including biotic and abiotic tolerance, and sod harvestability, etc.)[8]. This conventional selection technique based on visual evaluation or physical measurement is subjective technique in which genetic variations of genotypes are often concealed. Furthermore, significant amount of time, space and resources are required in the identification of parental genotypes as well as in the selection of the hybrids. Consequently, a superior turfgrass cultivar can take over ten years to develop without a state-of-the-art germplasm enhancement program[9].
To better understand crop responses to various environmental conditions or to select genotypes in plant breeding activities, spectral sensors are used to collect vegetation reflectance or image data. Depending upon the wavelength of the radiation as well as the characteristic features of the plant canopy, the electromagnetic spectrum that strikes the plant surface can either be absorbed, transmitted through the plant tissue, or reflected into the atmosphere[10−13]. Leaves absorb, scatter, and transmit sunlight at all wavelengths across the visible, near-infrared, and shortwave-infrared spectrum[14]. Electromagnetic radiation reflected from vegetation can be sensed from the visible (400−700 nm), near-infrared (700−1,300 nm), and short-wavelength infrared (1,400−3,000 nm) regions using ground-based or air-borne platforms to diagnose plant physiological status, including pigments, structural constituents, and water content[15−17]. Green plants absorb photosynthetically active radiation (PAR) (400−700 nm) as the most important source of energy[18] and harness part of that energy in photosynthesis to reduce CO2 into simple sugar.
Remote or proximal sensing using different optical sensors is a non-destructive technique that has opened a new horizon and greatly aided in identifying plant genotypes with superior traits, for increased selection efficiency, and shortening the time period required for cultivar development[19]. Spectral reflectance from plant leaves and canopies can be used to quickly estimate a variety of plant morpho-physiological, and biochemical traits[20, 21]. This non-destructive HTP technology allows for the quick, accurate, and economical screening of a large number of germplasm by identifying inherent differences between genotypes or treatments. Numerous traits, including chlorophyll content[22], mineral nutrient contents[23, 24], proteins and amino acids[25] have been estimated in various plant species.
Spectral reflectance has been used as an objective measurement of turfgrass visual appearance[26] and precision turfgrass management[27]. Normalized difference vegetation index (NDVI) has been used in turfgrass for its good correlation with visual quality ratings[28−30] and water stress index[31]. Furthermore, a range of prediction models such as partial least square regression (PLSR)[32, 33] and regression shrinkage and selection via lasso[34] were implemented. Using PLSR, various studies estimated physiological traits with a reputable level of accuracy, including genetic variation in photosynthesis, leaf mass per area, stomatal conductance, early stress symptoms and growth dynamics in plants[35−37].
With a steadfast demand to develop turfgrass varieties with improved abiotic and biotic stress tolerances[38], there is a renewed interest in rapid and in situ phenotyping of turfgrasses. Both ground- and aerial-based platforms that are equipped with advanced remote sensor technologies are employed in systematic collection of multispectral images. The implementation of these remote and proximal sensing technologies enables to characterize large numbers of germplasm and improve cultivar development efficiency to meet current and future demands of the turfgrass industry.
Numerous spectral vegetation indices representing statistical transformations of canopy spectral reflectance have been formulated to characterize vegetation canopy status[39, 40] for optimum crop management practices or assess genetic diversity within and among species. These spectral vegetation indices derived from plant canopy reflectance image have become robust proxies for traditional agronomic traits[41]. In addition to documenting genetic variation for efficient selection in the breeding process, these vegetation indices may accelerate the study of genes controlling natural variation in turfgrass biochemical and physiological traits. To simplify this process, a universal index has been proposed to estimate leaf foliar traits such as chlorophyll content, nitrogen (N) content, and photosynthetic radiation use efficiency from reflectance data[42, 43].
The amount of canopy chlorophyll is a valuable indicator of plant health and performance in turfgrass and it can be estimated using vegetation indices calculated from reflectance in red-edge and near infrared (NIR)[44, 45]. Considering photosynthetic area and chlorophyll content, genetic variability is particularly important in turfgrass for fast establishment and aesthetic appeal. This study was conducted with the aim to assess genetic variation among bermudagrass hybrids based on several spectral vegetation indices (SVI) that are related to photosynthetic area and chlorophyll content.
-
In this study, a total of 50 genotypes of hybrid bermudagrass (C. dactylon × C. transvaalensis) were used in the greenhouse, out of which 48 were planted in the field experiment. The hybrids were developed at Oklahoma State University by mating various genotypes of common (tetraploid) bermudagrass with African (diploid) bermudagrass.
Greenhouse study
-
The plants were grown in a greenhouse at the US Arid-Land Agricultural Research Center in Maricopa, Arizona (USA). Stolon cuttings from the genotypes were taken and planted in 27.95 cm × 55.88 cm watertight plastic trays with 36 square cell pack insert filled with optimal porosity growth mix (coarse sphagnum peat moss (80%−90%), perlite (Berger, Saint-Modeste, Canada). The planting of the cuttings was conducted mid April 2021. The greenhouse's growing temperature was set to 32/27 °C (day/night) for the experiment with the natural summer season day light duration. The plants were kept in a well-watered state by watering every other day with one drip emitter per flat. After establishment, the plants were equally divided into three, 12 plugs each and arranged in replications. Then the experiment was laid out in a randomized complete block design with three replications. To simulate the same age and canopy height, all the plants were mowed to approximately 7.5 cm height using Makita cordless grass shears a week before data collection.
Crop Circle RapidScan CS-45 (Holland Scientific, Lincoln, NE, USA), a height-independent active crop canopy sensor, was used to collect the canopy reflectance data at bands of 670, 730, and 780 nm. Each flat was scanned for about two seconds while the device was held steady at a height of 0.7 m above the canopy. The data were collected twice from all the three replicates the same day and the average was considered for analysis. From the reflectance data recorded at 670, 730, and 780 nm bands, six SVI known to estimate photosynthetic area and chlorophyll content were calculated (Table 1).
Table 1. Published formulae for different spectral vegetation indices used in the study.
Spectral reflectance indices Formula References Normalized difference vegetation index (NDVI) (R780 − R670)/
(R780 + R670)[46] Normalized difference red edge index (NDRE) (R780 − R730)/
(R780 + R730)[47] The chlorophyll index using red edge (CIRE) (R780/R730) −1 [48] Normalized difference vegetation index-Red-Red edge (NDRRE) (R730 − R670)/
(R730 + R670)[49] The MERIS terrestrial chlorophyll index (MTCI) (R780 − R730)/
(R730 − R670)[50] Canopy chlorophyll content index (CCCI) NDRE/NDVIR [51] Field study
-
The field experiment was established with 48 genotypes in a randomized complete block design with two replications. Field plots were planted late-August 2021 at Maricopa Agricultural Center near Maricopa, Arizona, USA (33.079 °N, 111.977 °W). Four plugs were planted at a square of 0.5 m in the middle of 1.5 m × 1.5 m plot. The canopy reflectance data were collected following the method described above from the center of each plot twice in mid-July 2022. The establishment rate was visually estimated every month and recorded in percentages until at least 90% of the 1.5 m × 1.5 m square plot area is covered. Winter color data were recorded mid December 2021 and mid January 2022 using 1−9 scale (1 = brown, 9 = fully green).
Statistical data analysis
-
The data were tested for normal distribution and the absolute values of skewness and kurtosis was less than 1.0, suggesting underlying assumption in parametric testing is fulfilled. Analysis of variance was conducted using the aov() function in R [52]. It was thought that the genotype had a random effect. For mean separation, the least significant difference (LSD) at p ≤ 0.05 probability was utilized.
Scatter plot, frequency distribution, and correlation analysis among the indices was conducted using the PerformanceAnalytics package in R[52]. The range of indices among the accessions was depicted using box plots.
To identify superior genotypes among the 50 bermudagrass genotypes evaluated based on their performance for all the indices, a multi-trait selection index analysis was performed using the multi-trait genotype-ideotype distance index (MGIDI)[53]. To illustrate the correlations between the six indices, principal component analysis was computed using genotype means.
To select superior genotypes based on multiple spectral indices, each index was analyzed following the mixed-effect model:
$ y=Xb+Zu+e $ Estimation of the multi-trait genotype-ideotype distance index (MGIDI) was calculated using
$MGIDIi=[{\sum }_{j\; =\; 1}^{f}(\gamma ij-\gamma j)$ -
Each of the indices' data distribution and density heatmap are shown using a modified box and whisker plot (Fig. 1). As a result, the MTCI has a wide range, ranging from 0.7 to 1.2 with a mean value of 0.9. The average chlorophyll index (CIRE) was 0.5, with a range of 0.29 to 0.75. NDVI and NDRRE had intermediate ranges, while NDRE and CCCI exhibited narrower ranges, distributed quite near to the mean than the others.
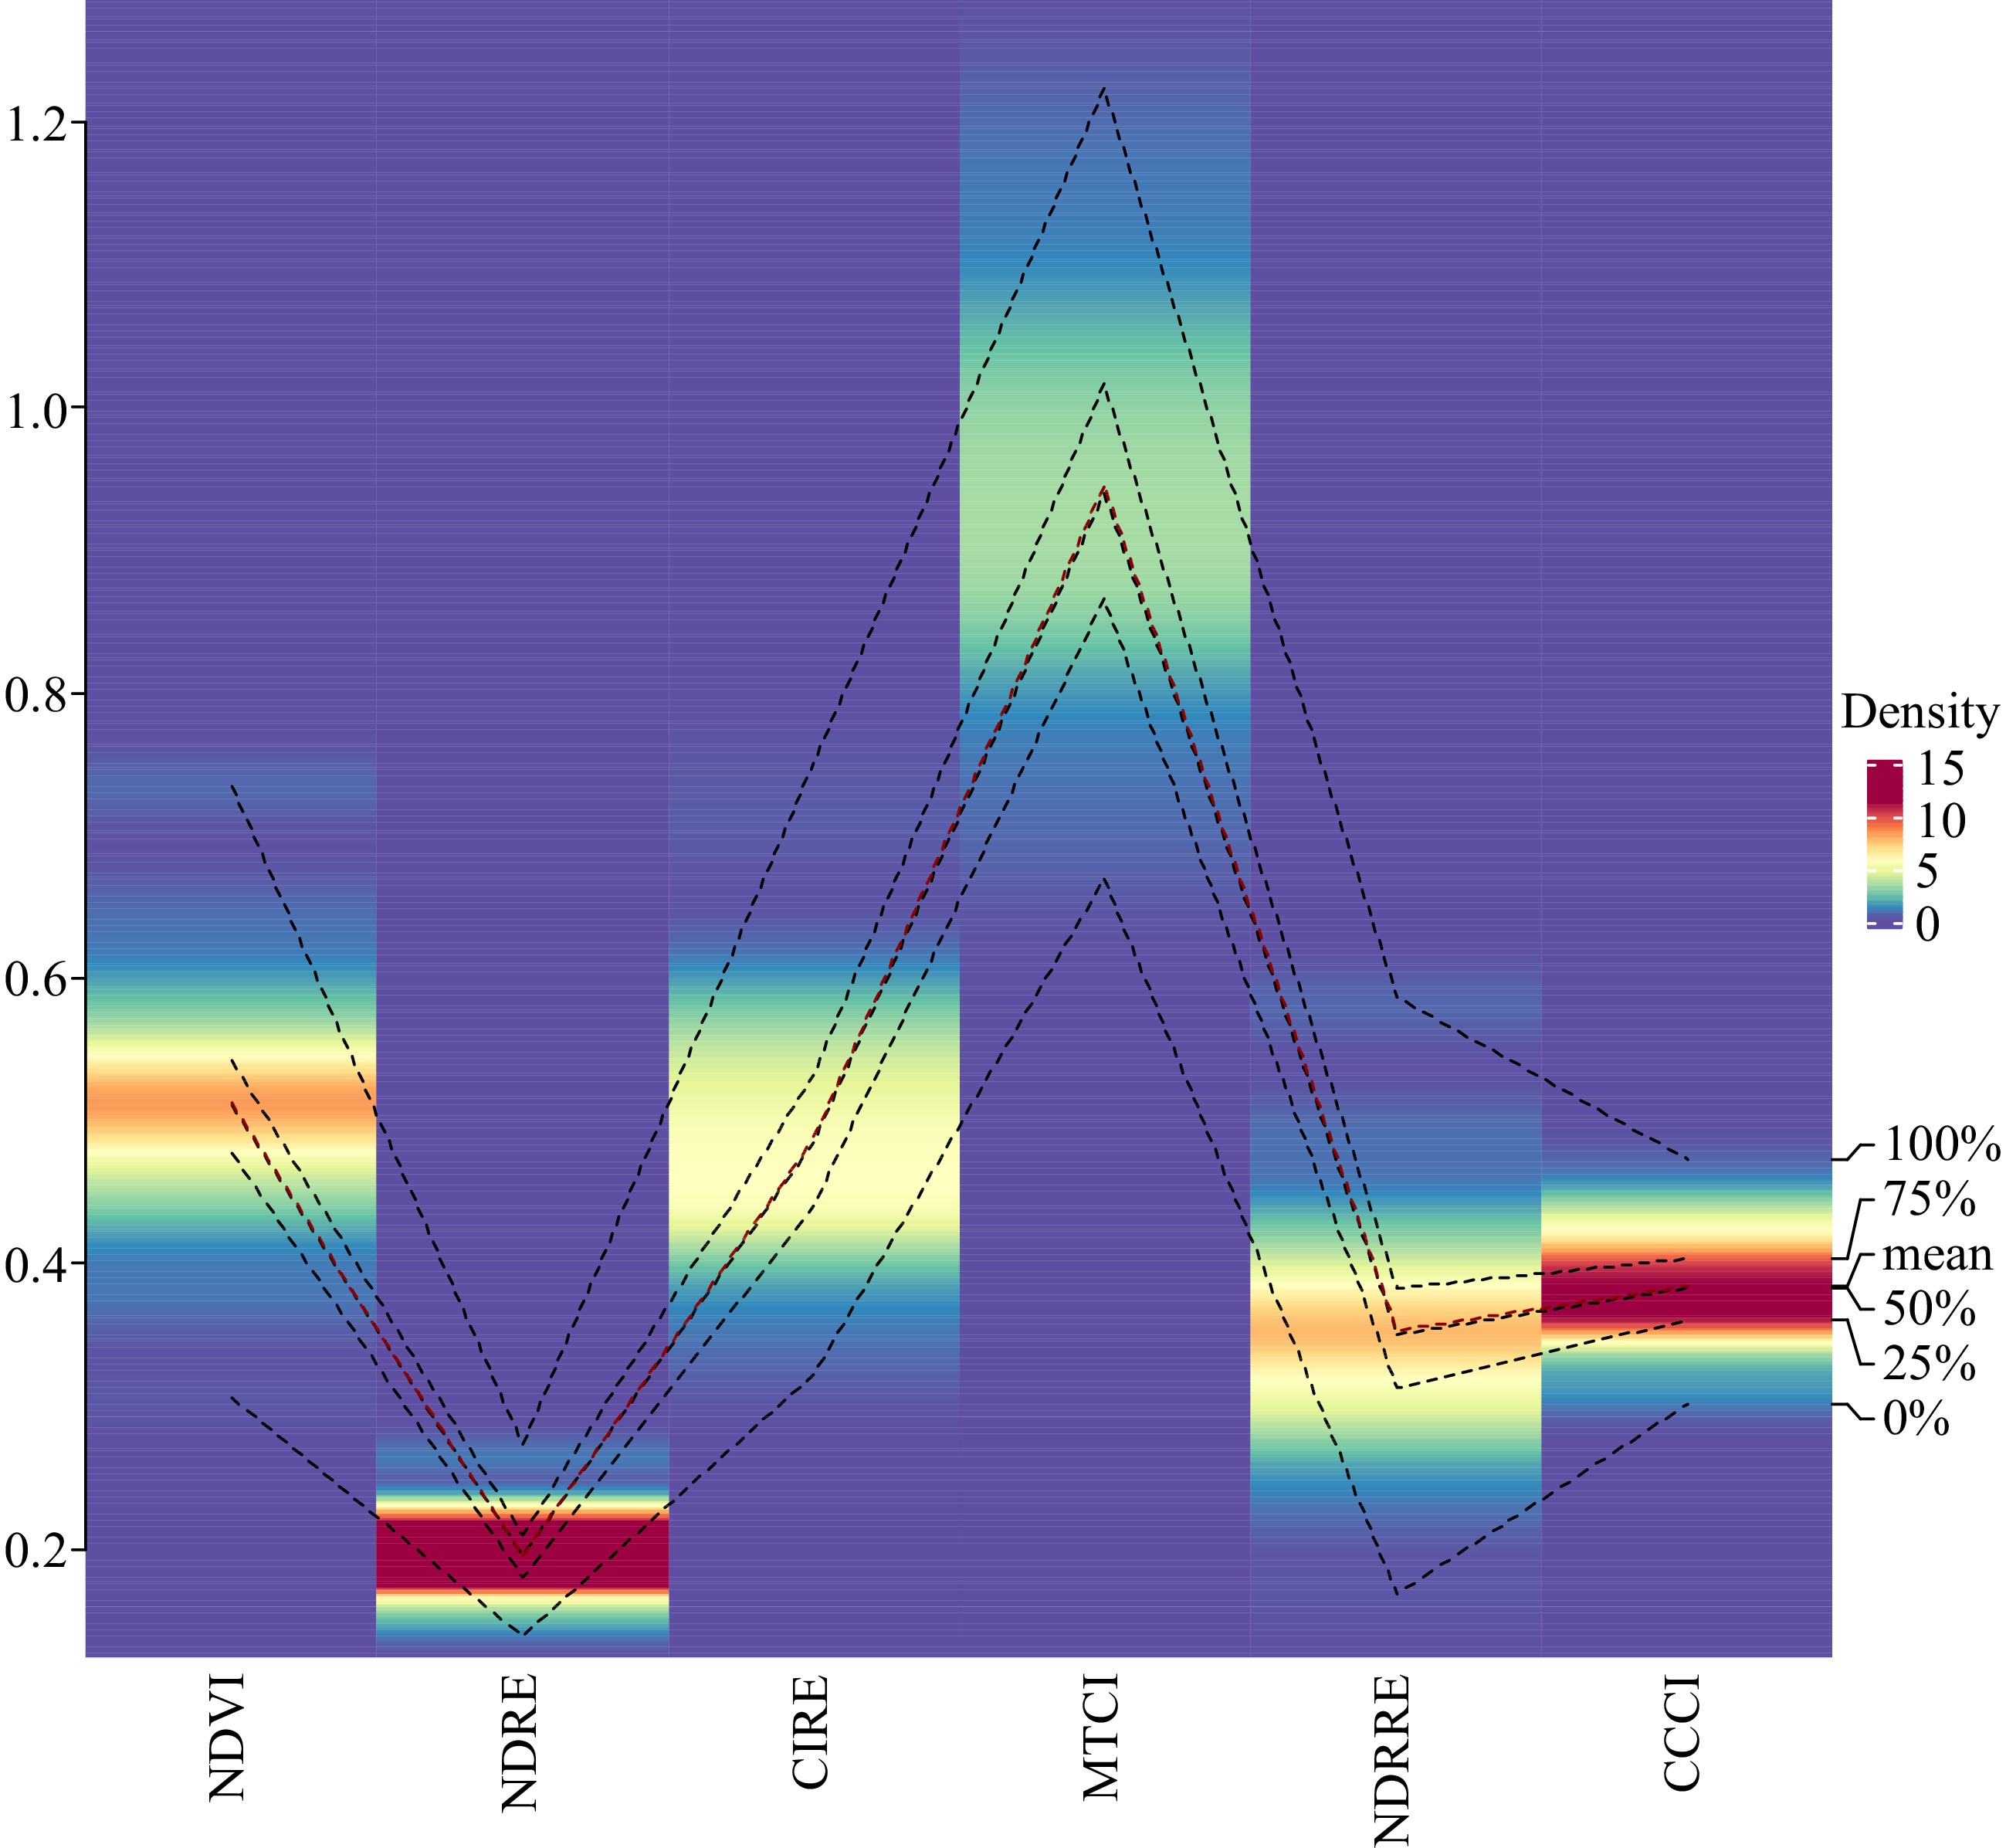
Figure 1.
Density heatmap of the range of indices used to evaluate 50 turf type bermudagrass genotypes.
The analysis of variance revealed significant differences among the genotypes for all the estimated indices from the reflectance data taken at 670, 730, and 780 nm, despite variances in the ranges of indices (Table 2). These variations among genotypes call for additional investigation to determine the role of various SVI in identifying superior genotypes among turf bermudagrass experimental hybrids.
Table 2. Analysis of variance for hybrid bermudagrass spectral reflectance indices calculated using published formulae.
Source DF Mean squares NDVI NDRE CIRE NDRRE MTCI CCCI Replication 2 0.0023 0.0003 0.0024 0.0035* 0.0341* 0.0025* Genotype 49 0.0107*** 0.0011*** 0.0111*** 0.0105*** 0.0208*** 0.0018*** Error 98 0.0009 0.0002 0.0017 0.0010 0.0091 0.0006 DF = Degree of freedom; NDVI = Normalized difference vegetation index; NDRE = Normalized difference red edge index; CIRE = Chlorophyll index using red edge; NDRRE = Normalized difference vegetation index red-red edge; MTCI = MERIS terrestrial chlorophyll index; and CCCI = Canopy chlorophyll content index; *, **, *** = significant at p = 0.05, 0.01, or 0.001, respectively. Data from the performance analysis of 50 genotypes of hybrid bermudagrass were displayed as scatter plots, frequency distributions, and relationships between the six indices (Fig. 2). A histogram with a data distribution curve traced diagonally showed that the data were distributed normally or nearly so. The scatter plots and regression lines used to trace them highlight the correlation between the indices. A linear regression model can account for most of the relationship. MTCI and CCCI, however, displayed a non-linear relationship with the other indices.
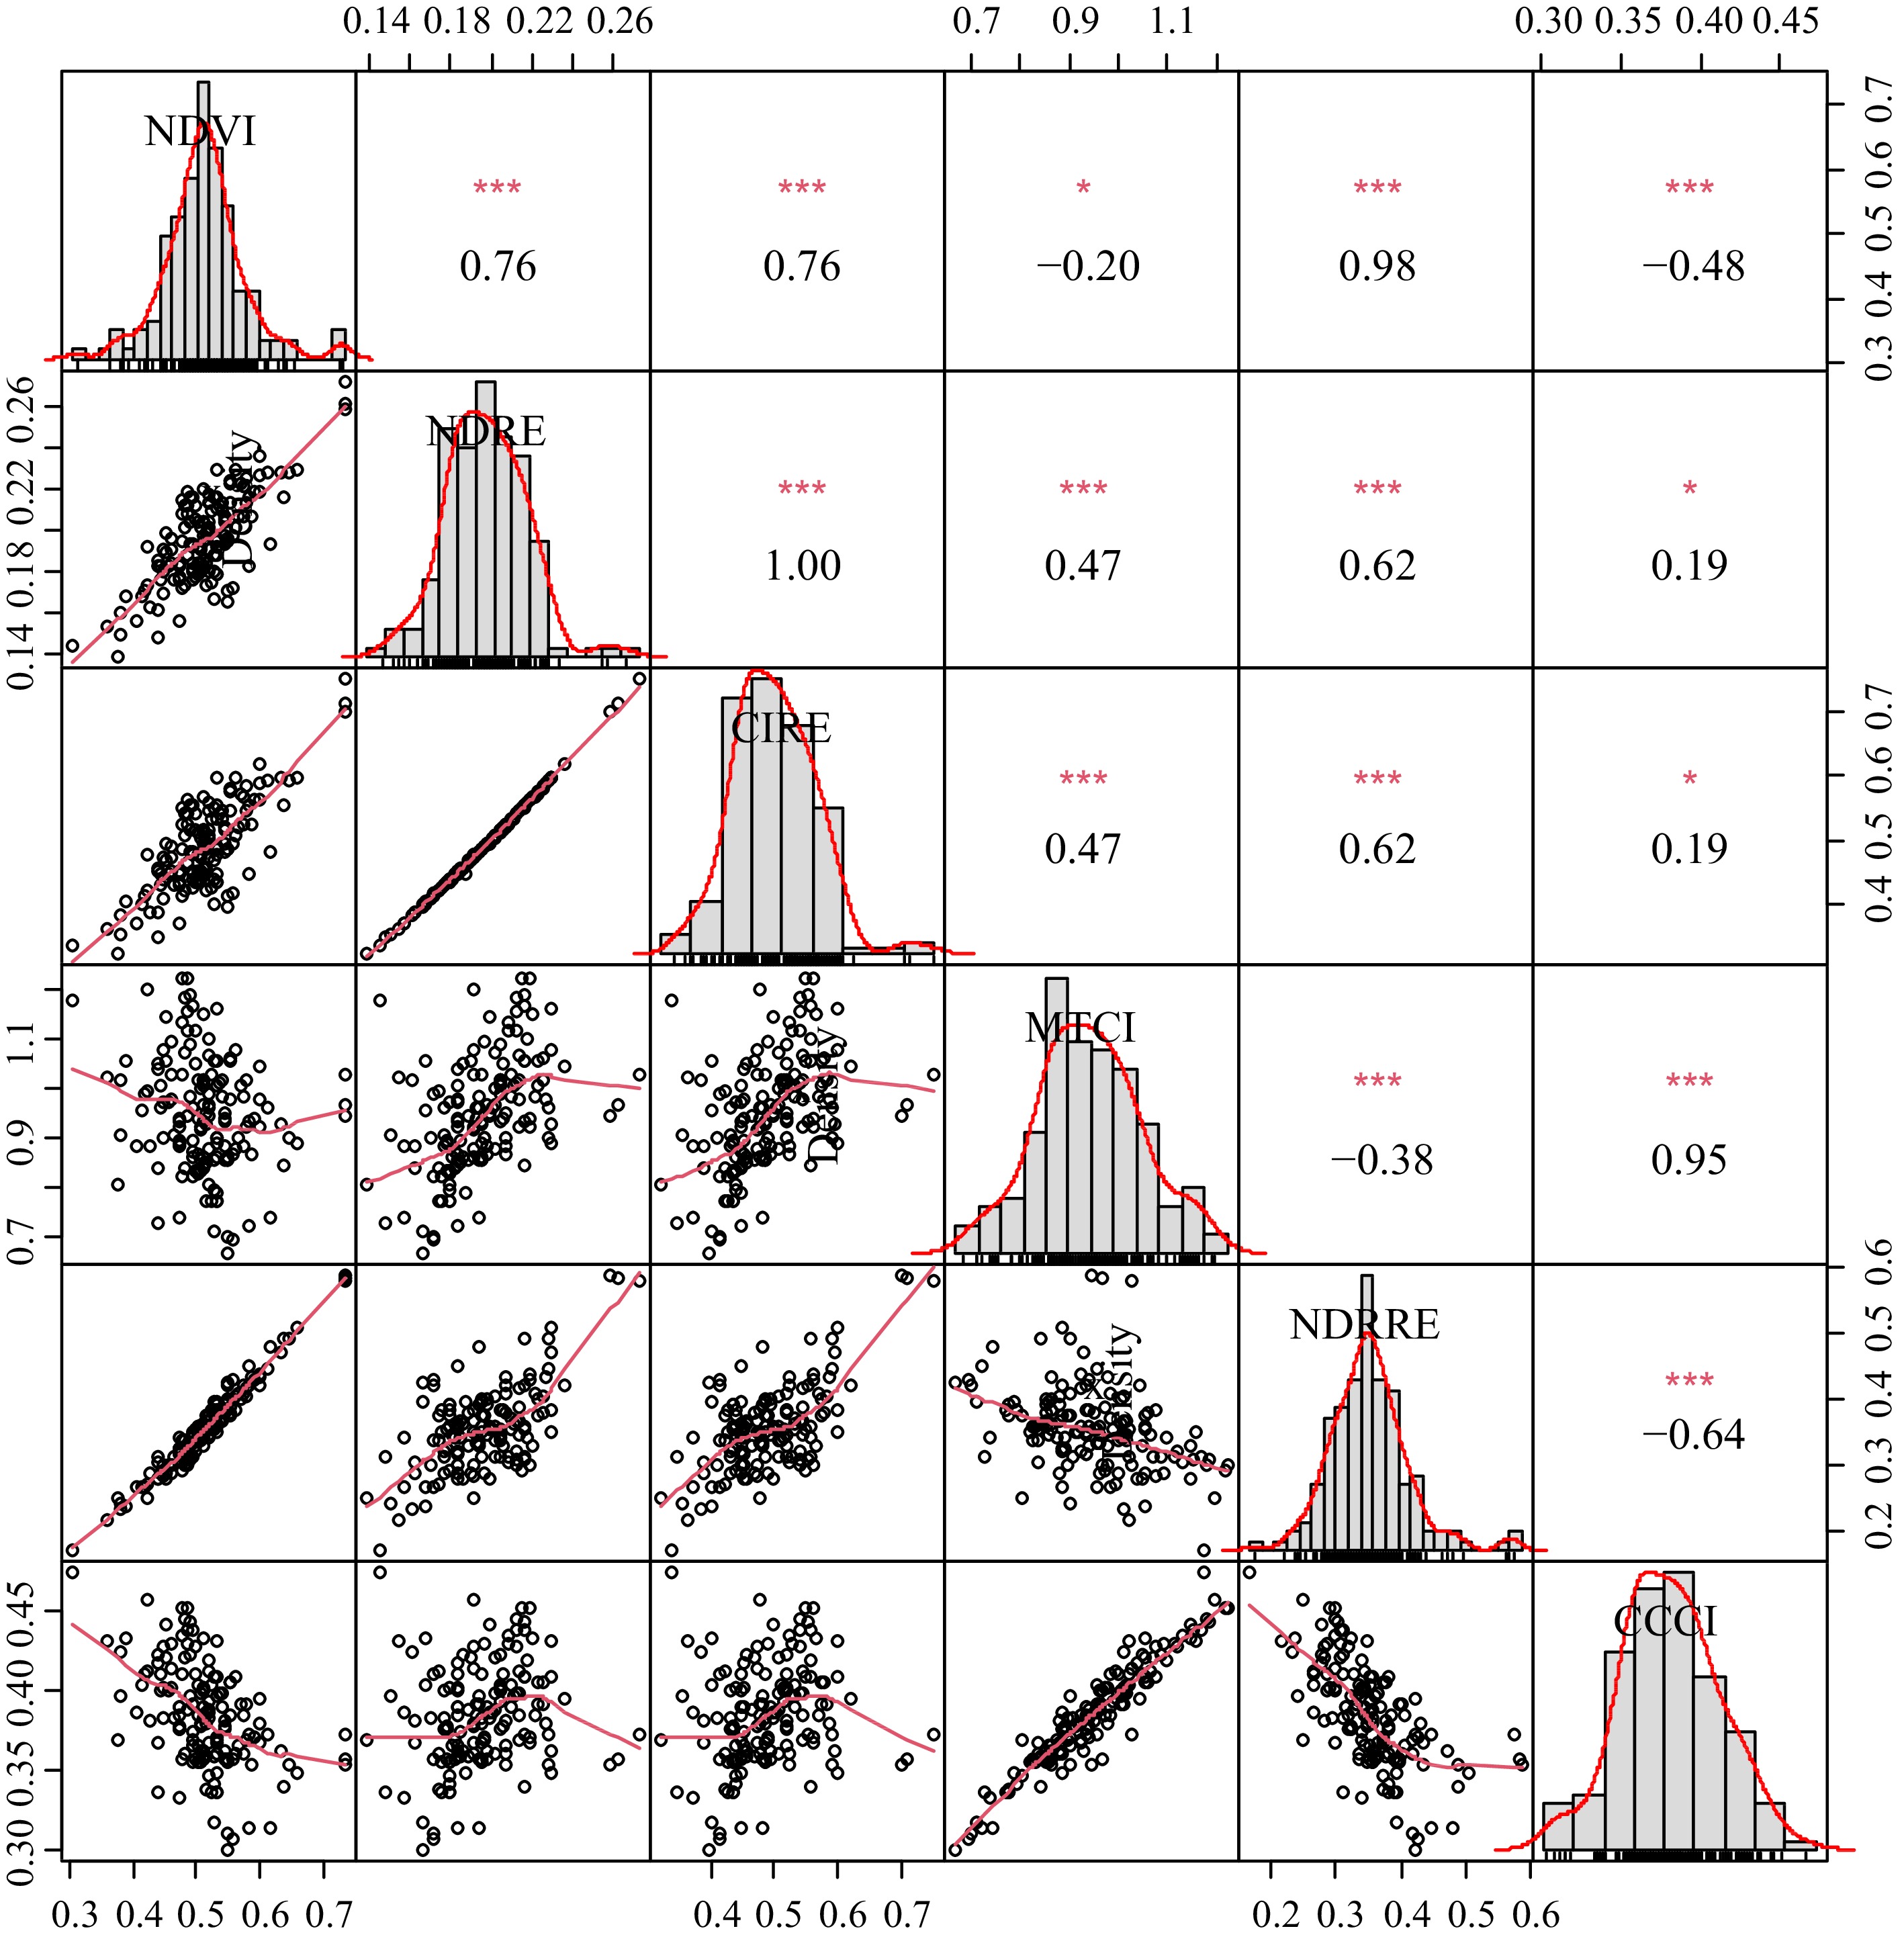
Figure 2.
Scatter plots, frequency distributions, and correlations among the six spectral reflectance indices used to evaluate 50 hybrid bermudagrass genotypes for genetic variation based on canopy reflectance at different wavelengths.
The correlation coefficients among the indices indicated that NDVI was highly correlated with NDRRE (r = 0.98), CIRE (r = 0.76), and NDRE (r = 0.76). NDRE was perfectly correlated with CIRE (r = 1.00). It was also highly positively correlated with NDRRE (r = 0.62) and MTCI (r = 0.47). CIRE was highly correlated with NDRRE (r = 0.62). Similarly, MTCI and CCCI were highly correlated (r = 0.95) but were weakly or negatively correlated with the rest of the indices used in this study. As such CCCI was negatively correlated with NDRRE (r = −0.64) and NDVI (r = −048).
Multi-indices selection
-
Principal component analysis using MGIDI revealed two principal components accounting for a total of 99.8% (PC1 = 67.3% and PC2 = 32.5%) of the variations in spectral reflectance among the genotypes.
Factor analysis using indices as selection differentials selected OSU2102, OSU2120, OSU2053, OSU2108, OSU2039, OSU2123, OSU2075, OSU2015, OSU2118, and OSU2124 as superior over the others (Fig. 3). On the other hand, OSU2106, OSU2109, and OSU2037 were very close to the threshold line. Tifway, which was included as a check was very close to these three. The other cultivar used as a check, TifTuf was not close to the selected lines and had average MGIDI. According to the selection index analysis, OSU2115 and OSU2114 were the least in MGID index and forms the base of the index.
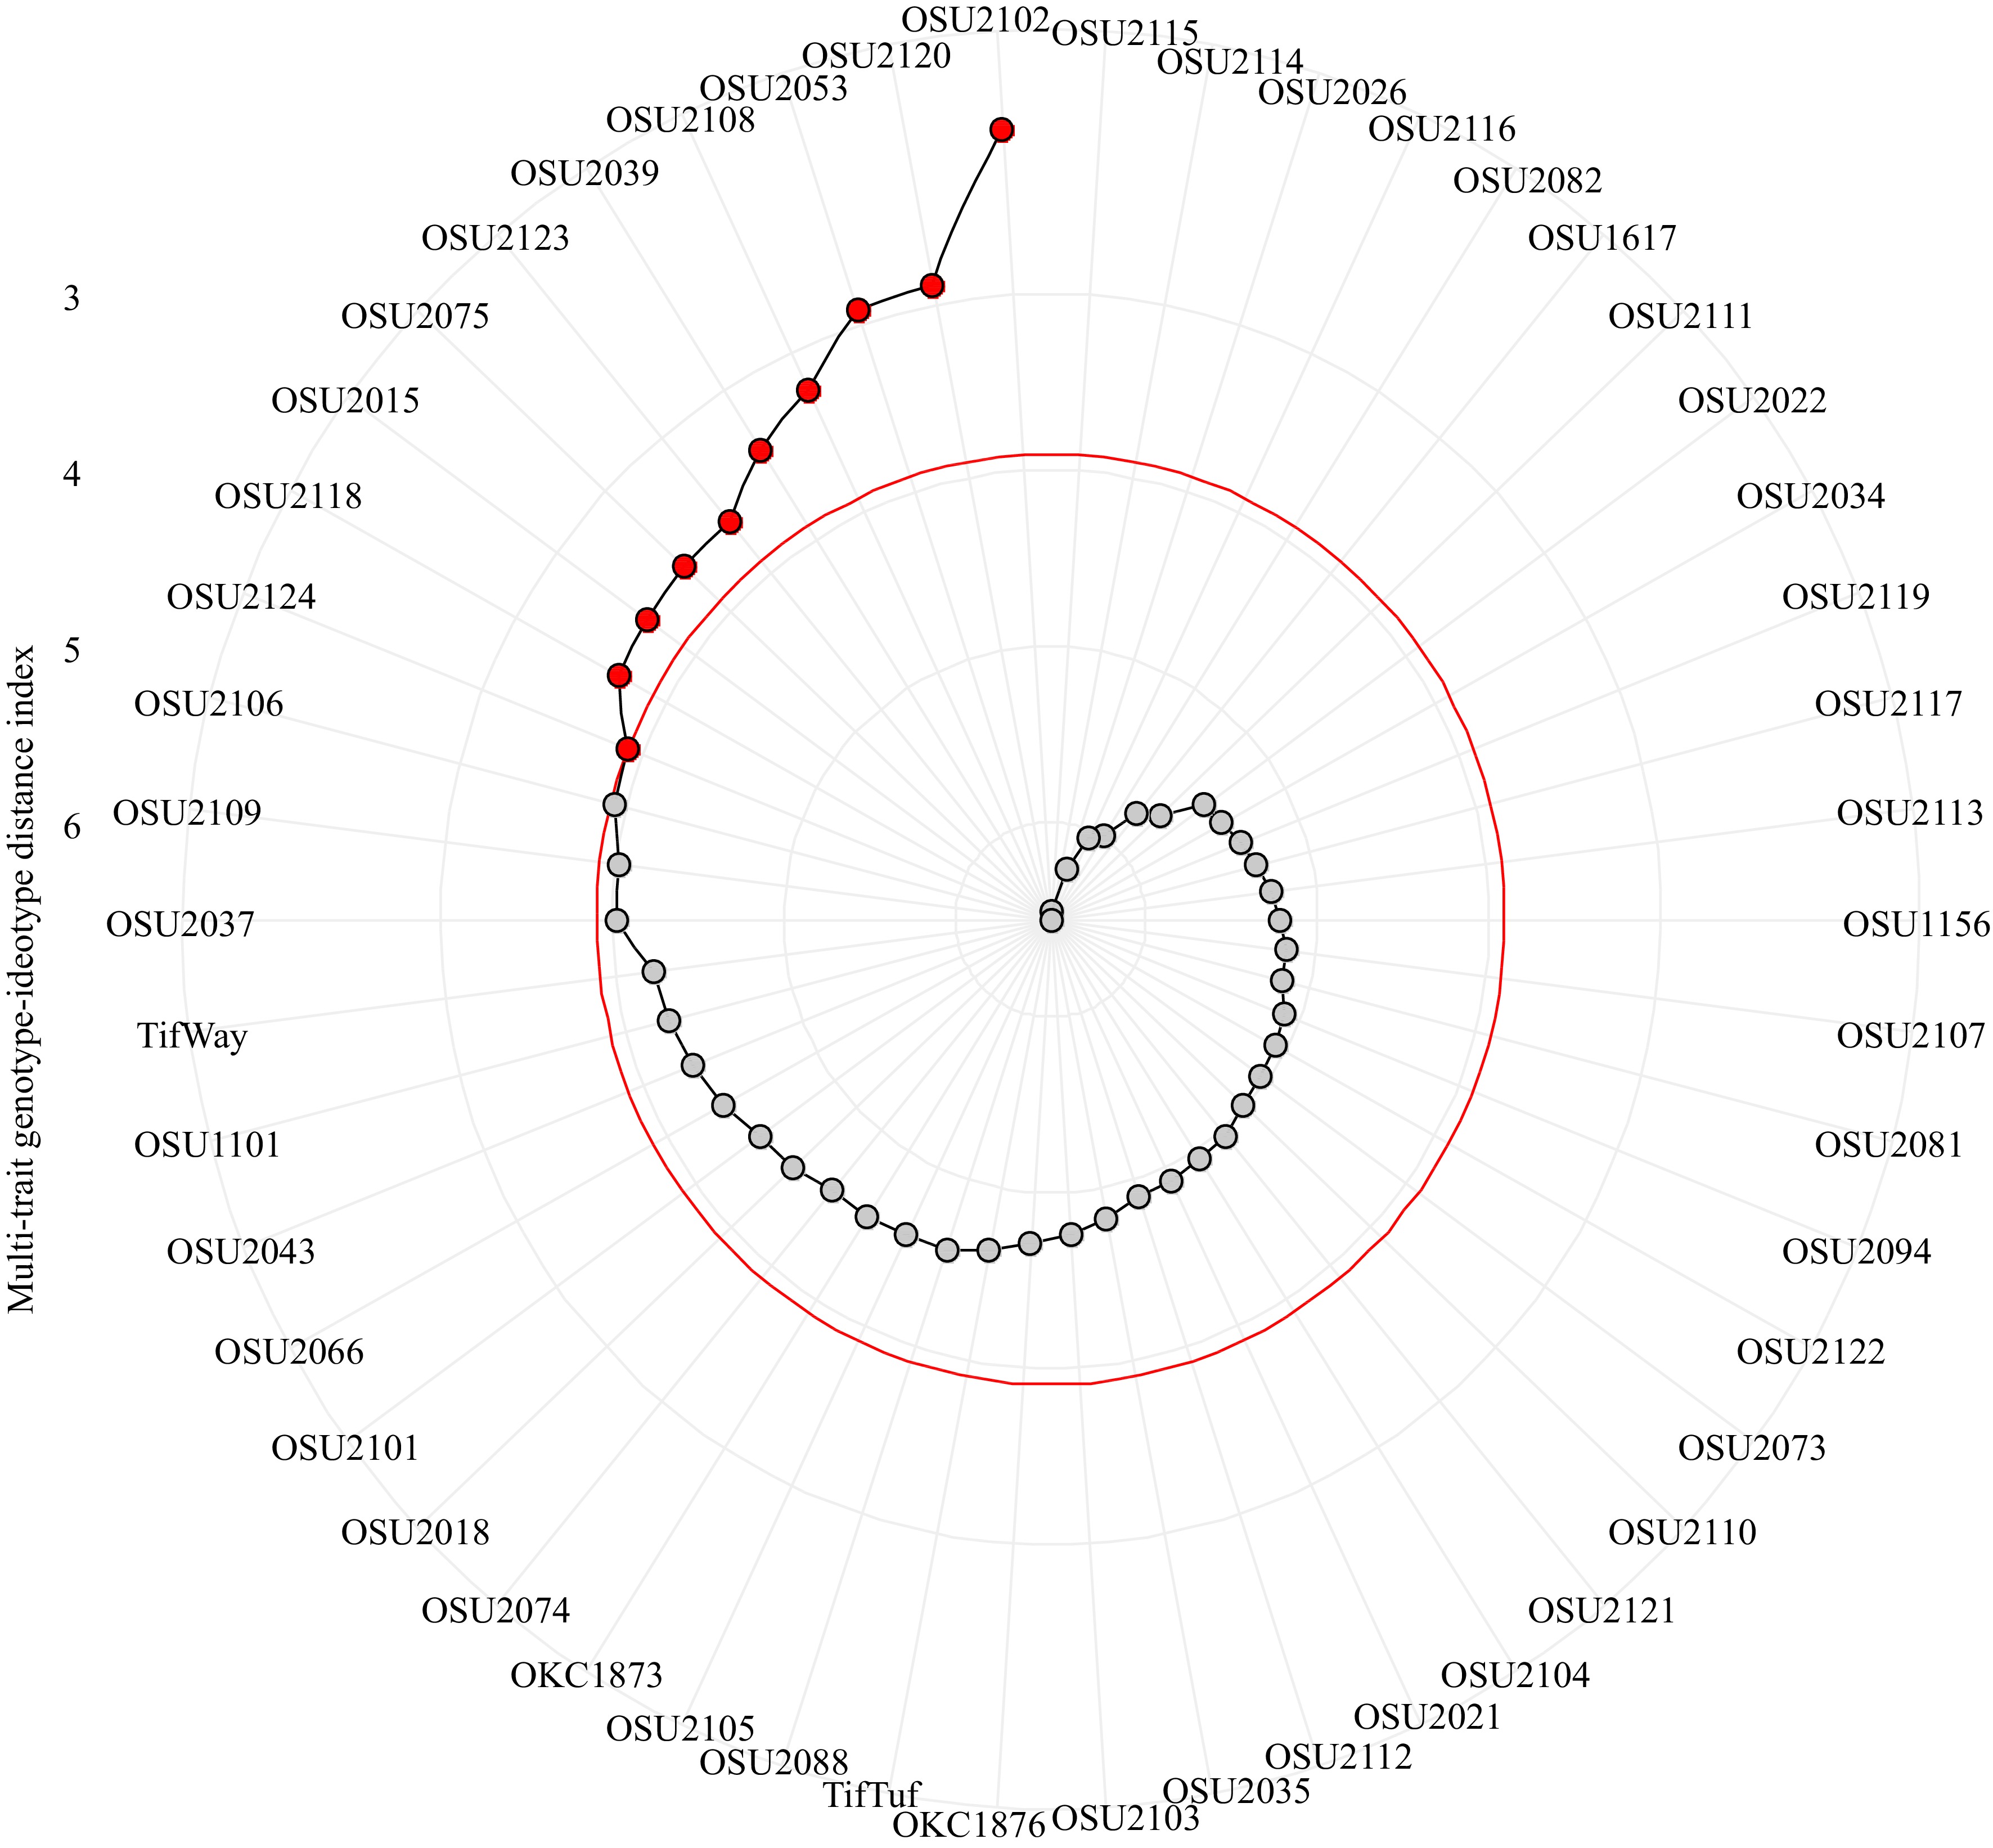
Figure 3.
Genotype rankings for multi-trait genotype-ideotype distance index (MGIDI). The selected genotypes based on MGIDI index are shown in red.
Factors analysis to the MGIDI indicated that genotypes OSU2102 and OSU2039 have strong contribution in factor 1 (FA1) (Fig. 4). OSU2053, OSU2075, OSU2123, OSU2015, OSU2118, and OSU2124 have strong contribution to factor 2 (FA2) (MTCI and CCCI). The smallest contribution of FA1 on OSU2053 and OSU2075 suggests that these genotypes have high measure in SVI related to chlorophyll content but weak in SVI related to photosynthetic area. On the other hand, OSU2102 has the smallest contribution of FA2 indicating its good photosynthetic area but weak in chlorophyll content. Genotypes OSU2039 and OSU2015 were selected based on the modest contribution of both factors (FA1 and FA2) implying their good photosynthetic area and chlorophyll content.
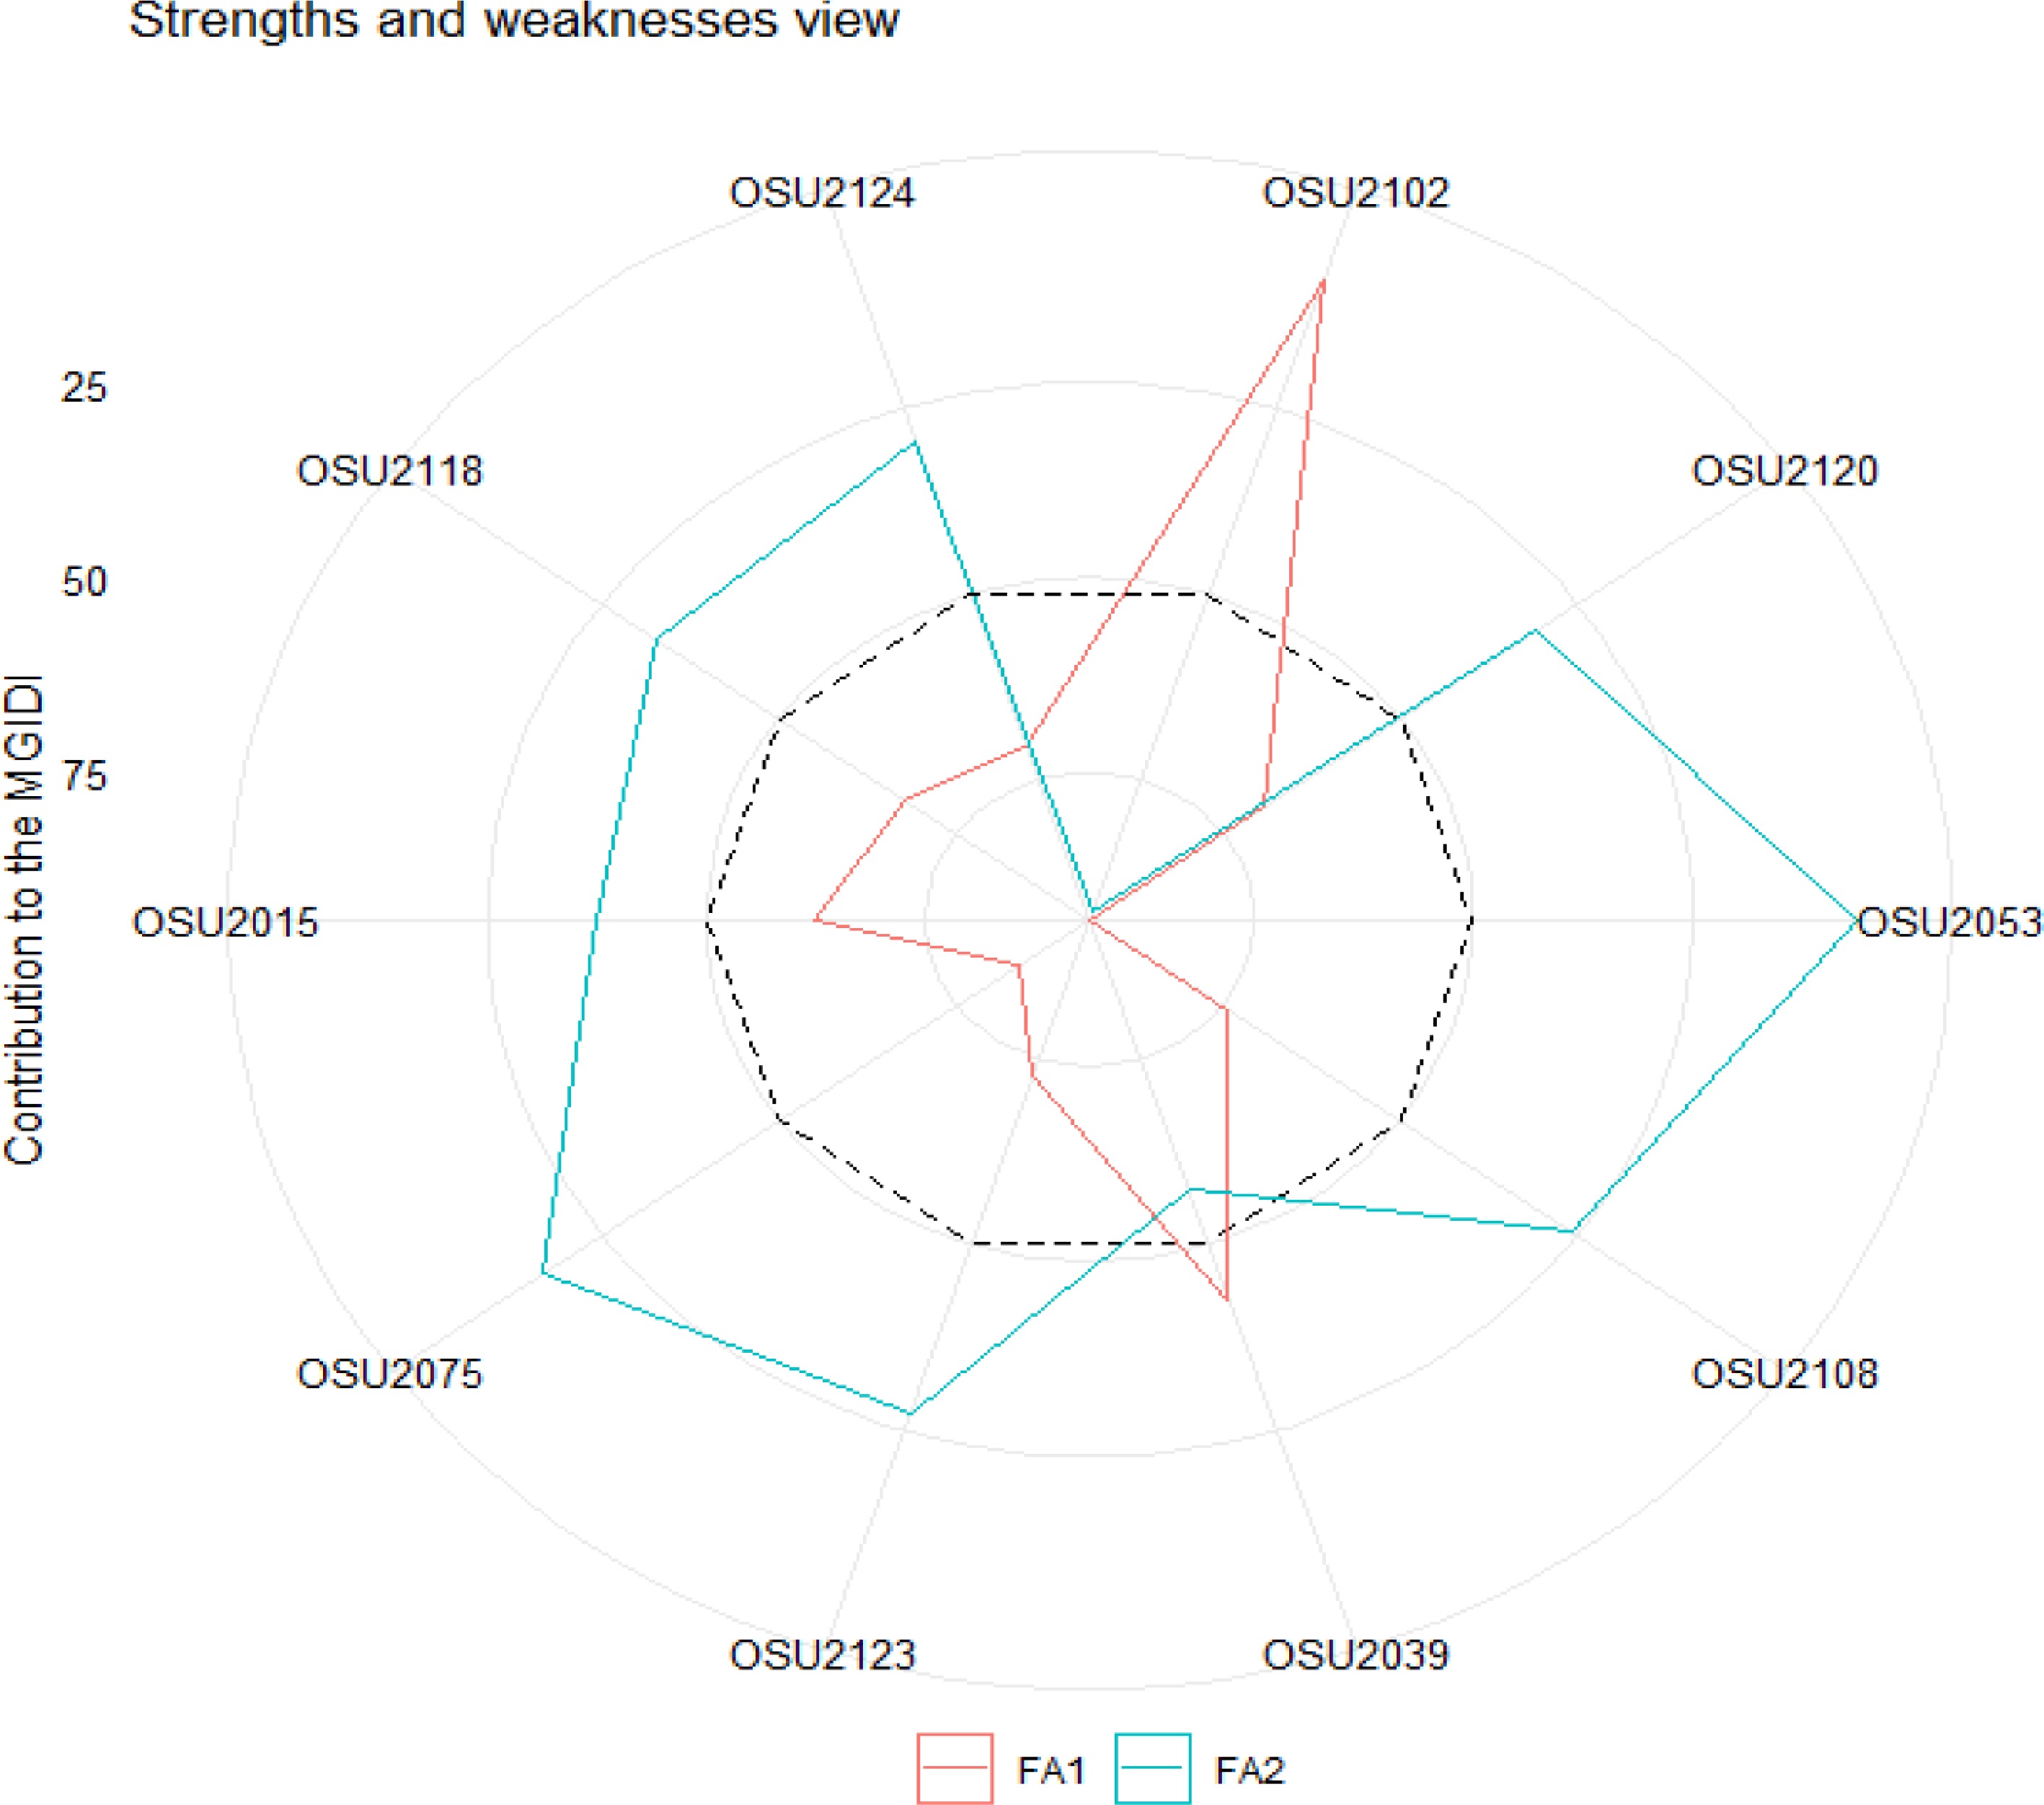
Figure 4.
The strength and weakness view of the selected genotypes with the proportion of the contributing factors to the computed multi-trait genotype-ideotype distance index (MGIDI). The dashed line represents the average of the two factors (FA1 and FA2).
Regression analysis of indices for establishment and winter color
-
Simple linear regression was conducted to test the predictive ability of two vegetation indices (NDVI and CIRE) that are related to photosynthetic area and chlorophyll content for spreading (establishment rate) and two others (MTCI and CCCI) that are related to chlorophyll content for winter color retention (Fig. 5). There was significant (p < 0.10) positive correlation of NDVI and CIRE with establishment rate. Similarly, MTCI and CCCI showed significant (p <0.05) correlation with winter color. The extent of spreading regressed with two spectral indices revealed the important relationship of photosynthetic area with shoot growth rate. The likely importance of chlorophyll content for fall and winter color retention as measured by CCCI, MTCI, and CIRE was also high.
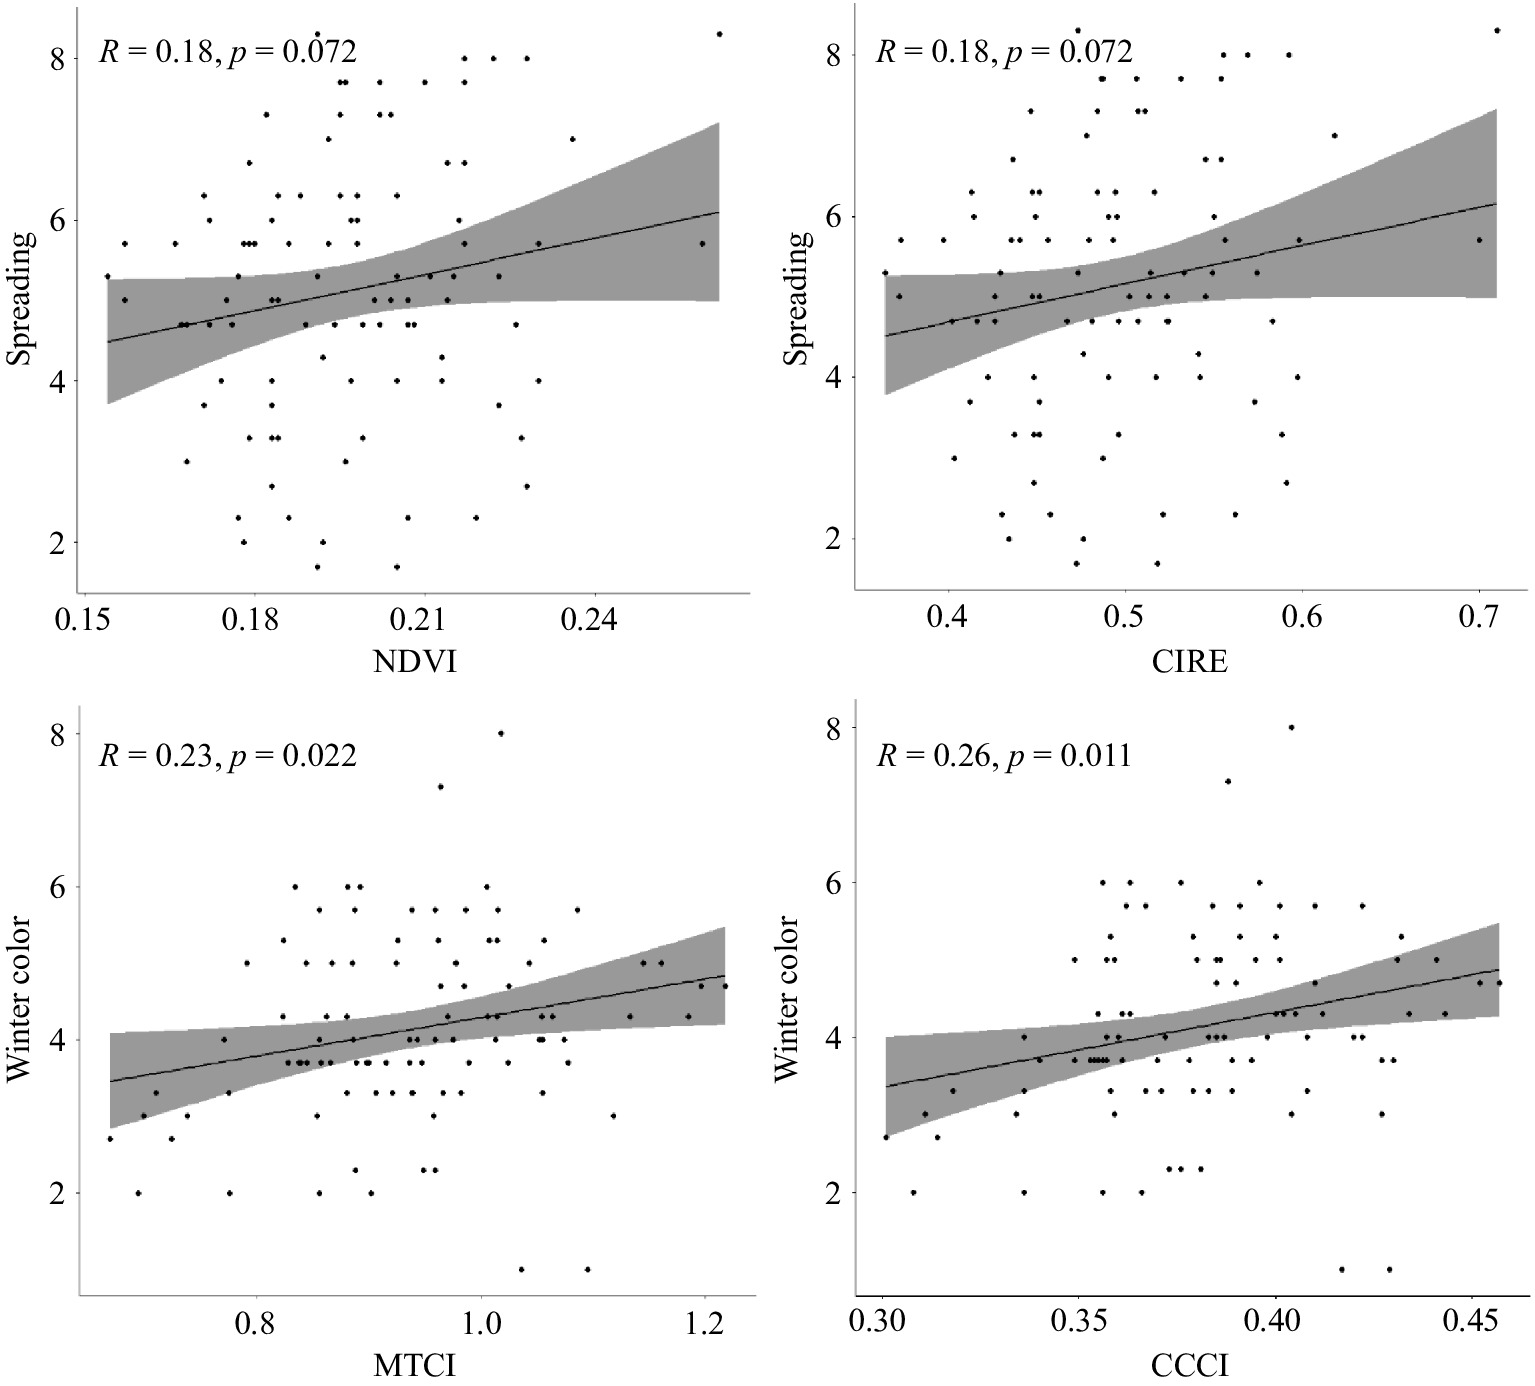
Figure 5.
Correlation of spectral indices related to photosynthetic area and chlorophyll content with establishment and winter color retention in bermudagrass hybrids. Only four out of six spectral vegetation index (SVI) are presented here.
-
From spectral reflectance data of hybrid bermudagrass selections captured at 670 nm, 730 nm, and 780 nm bands, we calculated six different vegetation indices related to photosynthetic area (NDVI, NDRE, and NDRRE) and chlorophyll content (CIRE, MTCI, and CCCI). These six indices were calculated to capture physiological properties of the plants such as chlorophyll content and photosynthetic area at the leaf and canopy scales[54]. Chlorophyll is the most important plant pigment that largely influences photosynthetic capacity for normal plant growth and survival[55−57]. As photochemical reflectance index serves as an indicator of photosynthetic radiation use efficiency[58], inherent genetic differences among the bermudagrass hybrids investigated evidently contributed to the variation in vegetation indices.
Analysis of spectral reflectance data in bermudagrass variety trials demonstrated it is a promising tool to reduce time and improve precision of selection[59]. Spectral reflectance in the red edge spectrum (680 nm to 780 nm) is valuable for assessment of vegetative chlorophyll status and leaf area index independently of ground cover variations[60, 61]. Bell et al.[62] reported the effectiveness of optical sensing as a quantitative and rapid field estimates of turfgrass shoot growth rate. This indicates that spectral reflectance could be used for detection of genotypic differences.
The analysis of variance revealed highly significant differences among the studied genotypes for all the six vegetation indices. Since spectral vegetation indices such as NDVI are highly correlated with turfgrass visual assessment rates, shoot density, and turf chlorophyll content[27, 28], the statistically significant difference among the genotypes for the indices reflect their inherent genetic variation. As the experiment was conducted under controlled environment, confounding effect of environmental factors in the result is minimal.
The correlation analysis among the six indices showed mostly positive association except CCCI with NDVI and NDRRE as well as MTCI with NDRRE. The correlation coefficients among the indices revealed a general tendency that genotypes with high photosynthetic area are low in chlorophyll content. Although different formulae are used for NDRE and CIRE, they had perfect correlation. Furthermore, indices estimating chlorophyll content such as MTCI and CCCI were correlated with green color retention in chilling temperature. It has been known that chlorophyll content decreases under cold stress, probably because of low temperature suppressed chlorophyll biosynthesis enzyme activity[63, 64]. The observed positive correlation of MTCI and CCCI is attributed to the chlorophyll content synthesized during normal growth period.
A previous application of spectral reflectance for quantitative measures of turfgrass performance in hybrid bermudagrass variety trial demonstrated reasonable relationship between vegetation indices and turfgrass quality and percent green cover under field condition[59]. A study conducted on different species of turfgrass quality aspects under different soil types and irrigation treatments reported variation in sensitivity to a deficit irrigation on turfgrass quality[65]. In this particular study, NDVI, soil adjusted vegetation index (SAVI)[66], and the visible atmospherically resistant index (VARI)[67]; and the grass water stress index consistently showed a non-linear relationship with the irrigation rate. Bartlet et al.[68] also reported near-linear correlation of NDVI to the proportion of PAR intercepted and net carbon dioxide exchange rates in grasses.
The result of our study suggested that the spectral vegetation indices are applicable for the assessment of genetic variation and turf performance of different turfgrass germplasm. The application of optical sensors in turfgrass germplasm characterization using these set of indices is vital as vegetation indices were highly heritable and phenotypic selection based on the indices would be effective[69]. As variation in foliar reflectance at different wavelengths of the electromagnetic spectrum is specific to different chemical and structural components of leaves[15, 54], differences in canopy reflectance among crop genotypes is imminent. The reflectance spectrum of a leaf and difference in this reflectance spectrum can be a useful source of biochemical and physiological information as a function of genetic variation[12].
We applied a recently developed selection index that account for multiple indices to identify superior genotypes. Based on a powerful tool to analyze plant multivariate data (MGIDI)[53], we could stratify the genotypes based on their rank for the indices. With the twenty percent selection set, we identified ten genotypes that were superior for the indices. The selection of plants based on multi-trait selection indices has been practiced as the best strategy since the development of discriminant function for plant selection[70]. Regularized selection indices that integrate techniques commonly used in high-dimensional phenotypic regressions and vegetation indices commonly used to predict agronomic traits offer consistently higher accuracy than those achieved by standard selection indices[71]. This implies that multi-trait selection index that integrates all the six reflectance indices is better than an individual vegetation reflectance index to identify a better performing genotype.
Breeder-friendly HTP technologies based on spectral vegetation reflectance can produce data on different phenotypes. Prediction of breeding values of genotypes based on these data can accelerate genetic gains and boost translational research[72]. As spectral reflectance of plants is closely associated with inherent plant characteristics or growing conditions[19], selection based on spectral indices is expected to improve genetic gains for different important traits. A potential limitation of the study is that, we replicated the experiment three times in the greenhouse and two times in the field due to space limitations in the greenhouse and irrigation treatment in the field.
-
The authors confirm contribution to the paper as follows: Serba DD conceptualized the idea, executed the experiment, and drafted the manuscript. Wu Y contributed the study material, edited, and refined the manuscript. Hejl RW, Williams CF, and Bronson KF edited and refined the manuscript. All authors reviewed the results and approved the final version of the manuscript.
-
The datasets generated during and/or analyzed during the current study are available from the corresponding author on reasonable request.
This research was part of USDA-ARS National Program 215: Pastures, Forage and Rangeland Systems. Mention of a trade names or commercial products in this publication is solely for the purpose of providing specific information and does not imply recommendation or endorsement by the US Department of Agriculture or any part herein. USDA is an equal opportunity provider and employer.
-
The authors declare no conflict of interest. Yanqi Wu is the Editorial Board member of Grass Research who was blinded from reviewing or making decisions on the manuscript. The article was subject to the journal's standard procedures, with peer-review handled independently of this Editorial Board member and the research groups.
- Copyright: © 2023 by the author(s). Published by Maximum Academic Press, Fayetteville, GA. This article is an open access article distributed under Creative Commons Attribution License (CC BY 4.0), visit https://creativecommons.org/licenses/by/4.0/.
-
About this article
Cite this article
Serba DD, Wu Y, Hejl RW, Williams CF, Bronson KF. 2023. Spectral reflectance estimated genetic variation in hybrid turf bermudagrass. Grass Research 3:22 doi: 10.48130/GR-2023-0022 

Spectral reflectance estimated genetic variation in hybrid turf bermudagrass
- Received: 09 May 2023
- Accepted: 02 November 2023
- Published online: 20 November 2023
Abstract: High throughput phenotyping (HTP) utilizing both remote and proximal sensing technologies has emerged as a vital tool for evaluating the biophysical characteristics of turfgrass. This study was conducted to assess the genetic diversity of hybrid turf bermudagrass using spectral reflectance indices and use of HTP for germplasm enhancement. A total of 50 accessions of the hybrid bermudagrass (Cynodon dactylon × C. transvaalensis) were grown in the greenhouse in three replications. The spectral data were gathered using a height independent active crop canopy sensor, 'RapidScan CS-45', which measures canopy reflectance at the wavelengths of 670 nm, 730 nm, and 780 nm. The reflectance data were used to derive three indices related to canopy photosynthetic area and other three related to chlorophyll content. All vegetation indices showed significant genotype-to-genotype variation. Ten superior genotypes were identified using the multi-trait genotype-ideotype distance index (MGIDI) as a selection differential. On 48 of the genotypes that were established in the field in two replications, establishment rate and winter color data were also gathered. The results of a linear regression analysis demonstrated the importance of spectral vegetation indices (SVI) for the turfgrass quick establishment (percentage area coverage) and winter color retention. This study brings attention to the potential use of the proximal sensing in turfgrass germplasm enhancement for establishment speed, aesthetic value, and mild-winter color retention.