-
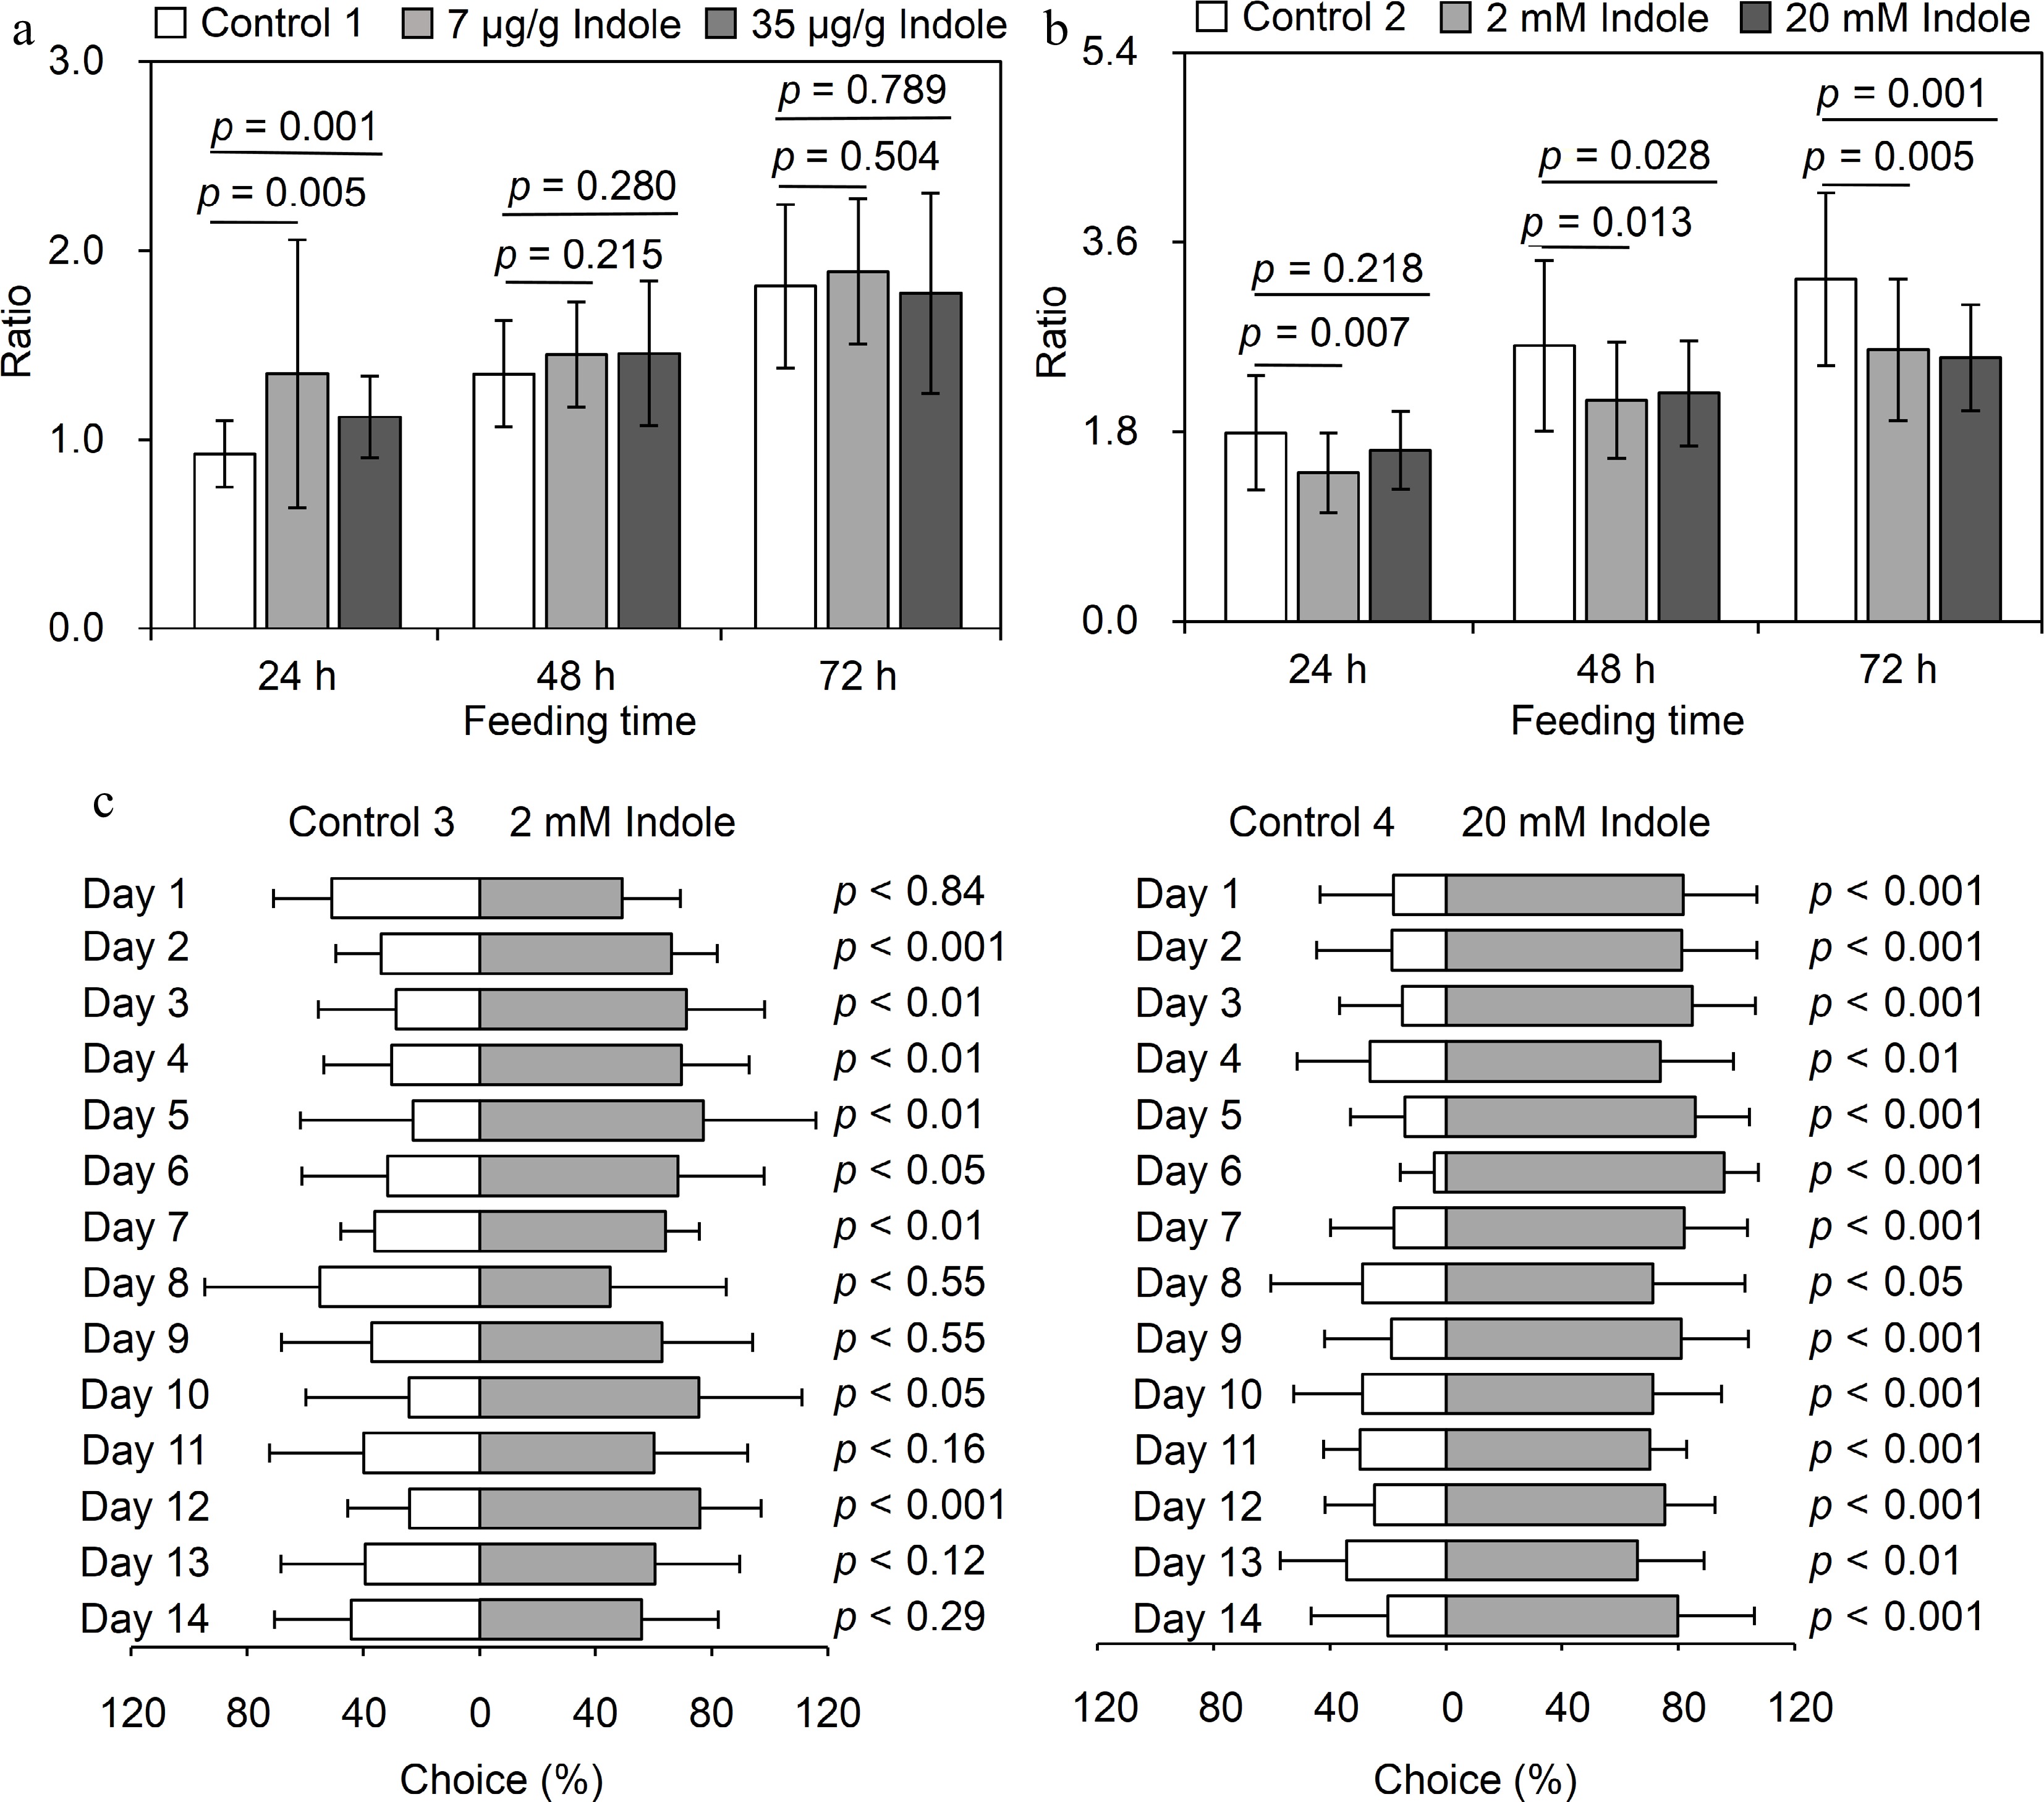
Figure 1.
Evaluation of anti-insect property of indole. (a) Exploration of direct defense. Control 1: water containing 1% ethanol was added to tea powder; Low concentration treatment: 7 μg/g indole (containing 1% ethanol) was added to tea powder; High concentration of treatment: 35 μg/g indole (containing 1% ethanol) was added to tea powder. (b) Exploration of signal transduction. Control 2: tea branches were fumigated with dichloromethane; Low concentration treatment: tea branches were fumigated with 2 mM indole dissolved in dichloromethane; High concentration treatment: tea branches were fumigated with 20 mM indole dissolved in dichloromethane. Data are expressed as mean ± SD (n = 25). Significance was indicated between indole treatment and its corresponding control (p ≤ 0.05). (a, b): The ratio in the y axis means the weight of insects after feeding treatment (24, 48 and 72 h) to the weight of insects before feeding treatment (0 h). (c) Exploration of attracting natural enemy. Control 3 and Control 4, dichloromethane; Low concentration: 2 mM indole dissolved in dichloromethane; High concentration treatment: 20 mM indole dissolved in dichloromethane. Each treatment had 14 biological replicates and 12 technical replicates per replicate, respectively.
-
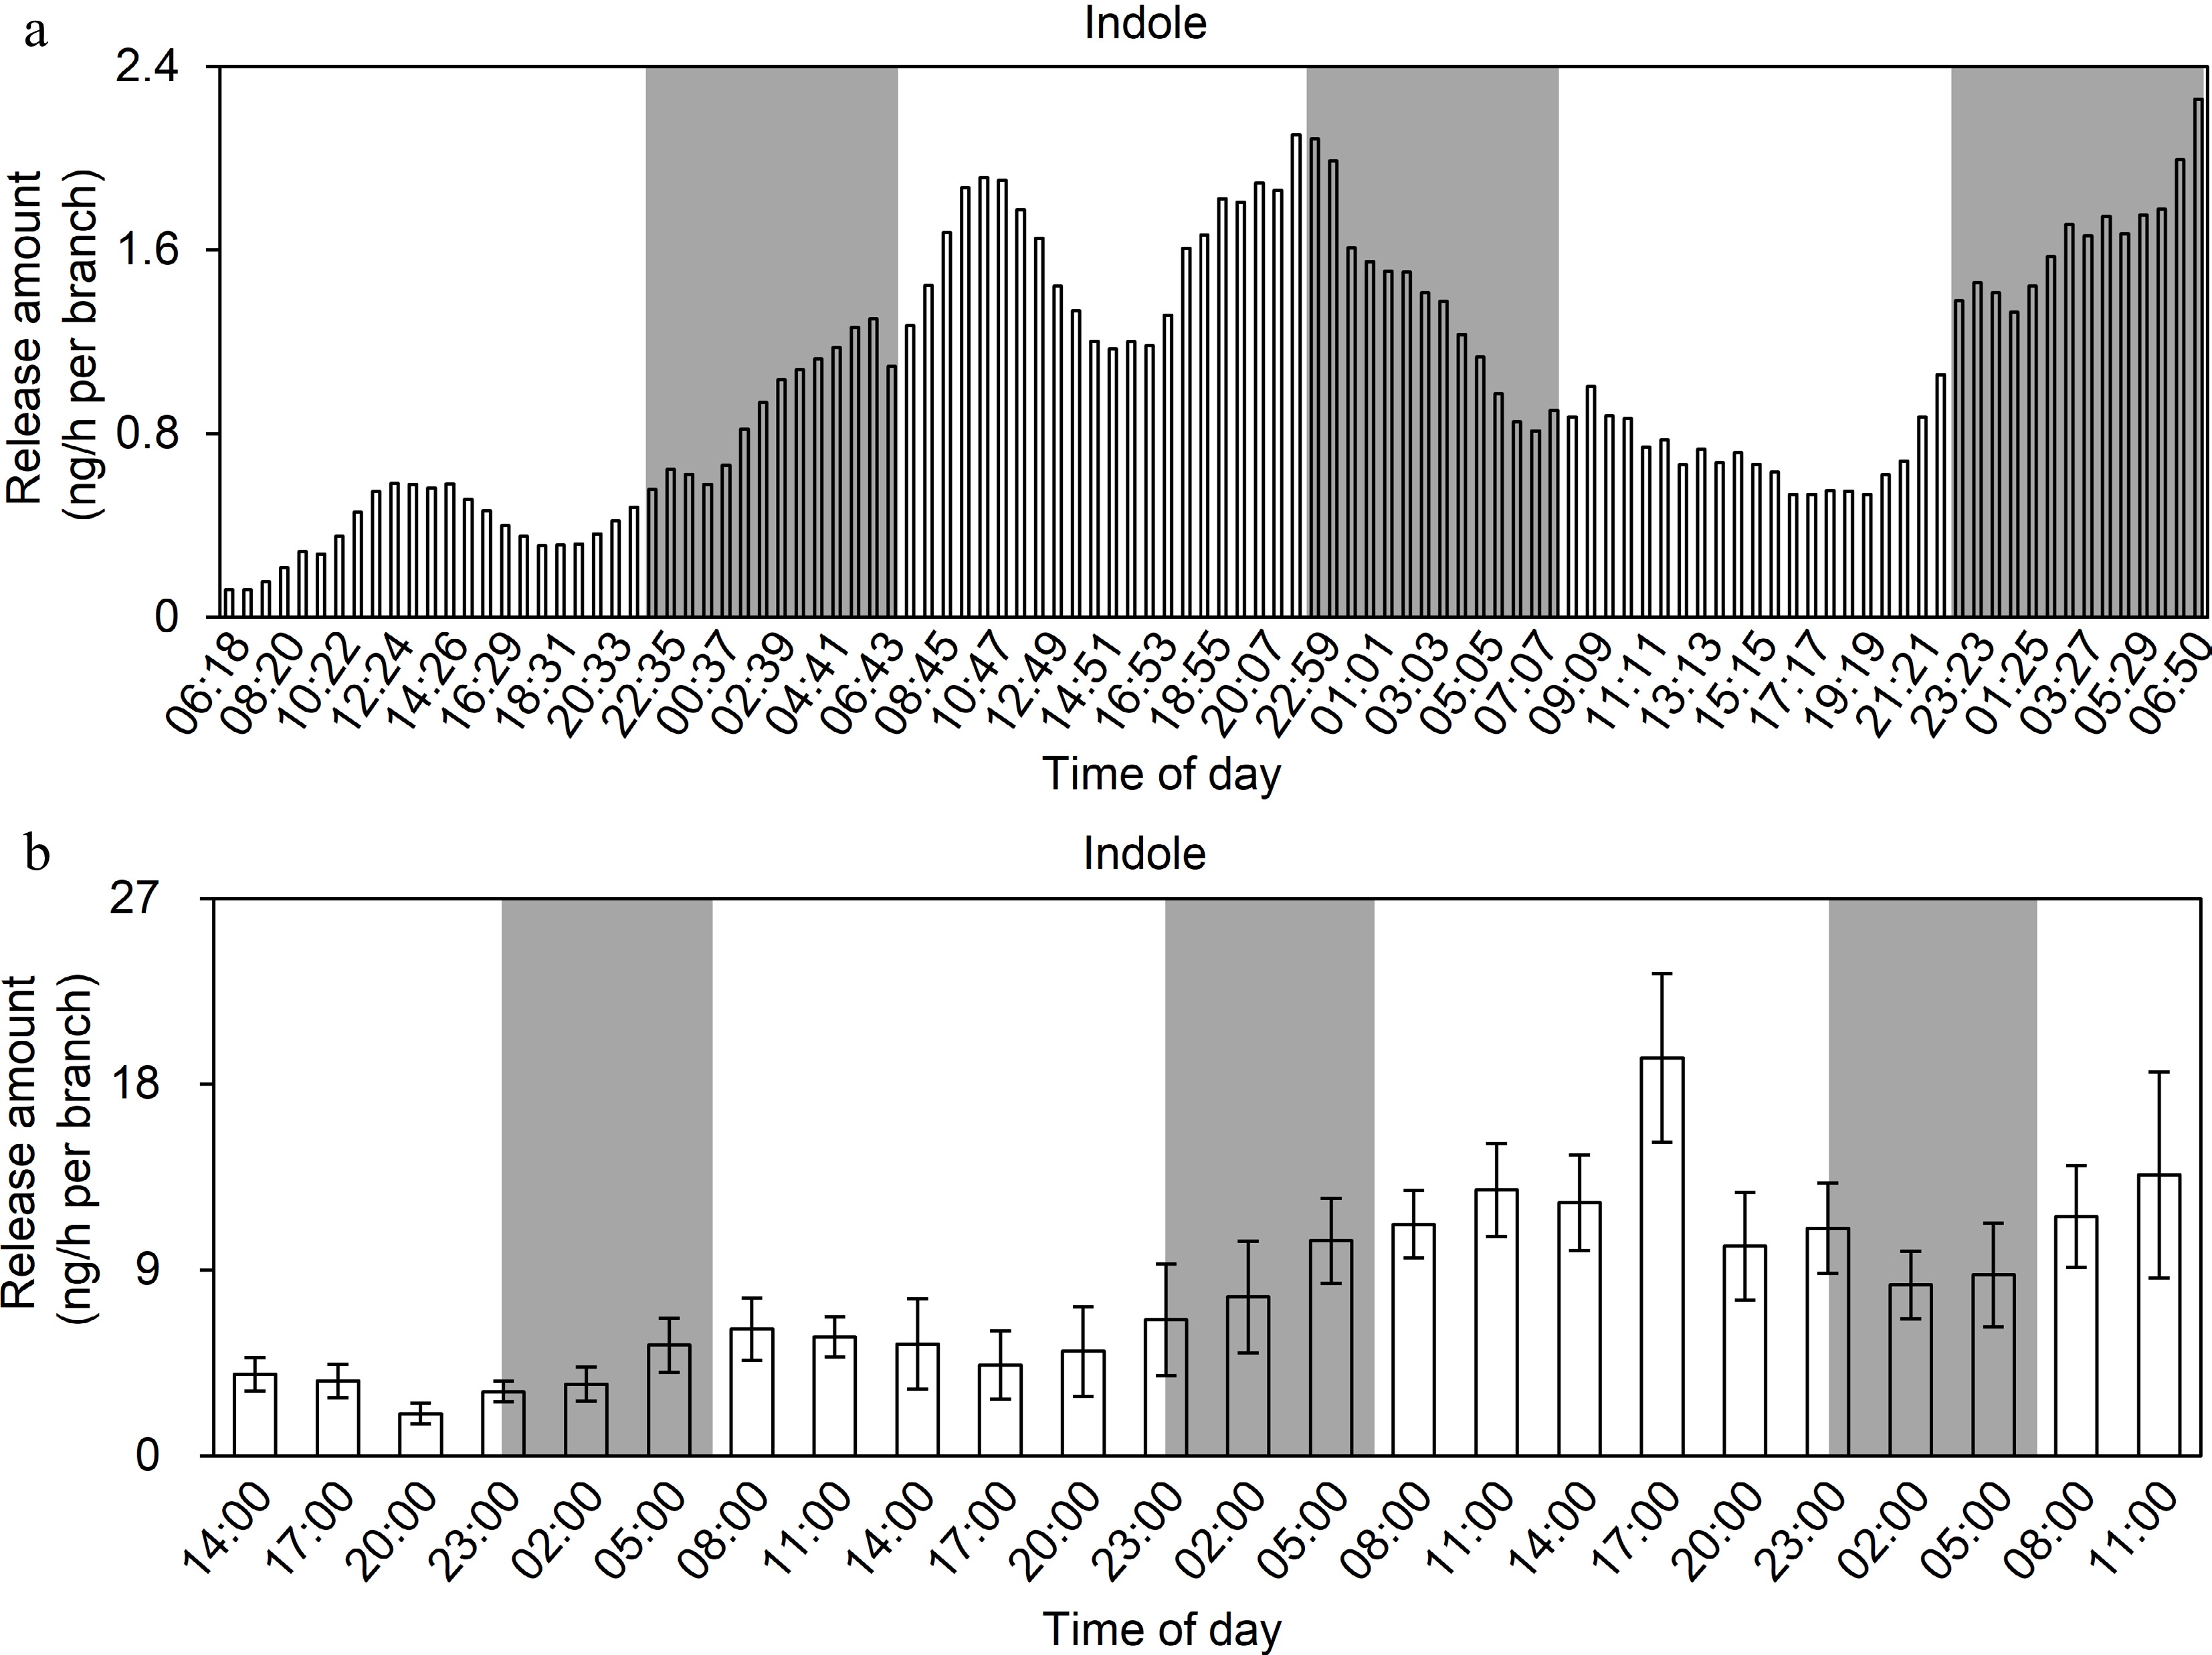
Figure 2.
Analysis of the emission pattern of indole in tea leaves under insect attack. (a) Real-time online analysis. Eight tea branches were attacked by five tea geometrids (3rd instar) in this experiment. Continuous monitoring with real-time online collection and analysis instrument. White background represents daytime and gray background represents night. (b) Analysis of TDU-GC–MS. Four tea branches were attacked by four tea geometrids (3rd instar) in this experiment. The volatiles were collected on PTFE columns and the columns were changed every 3 h. Data are expressed as mean ± SD (n = 8). White and gray background represents day and night, respectively.
-
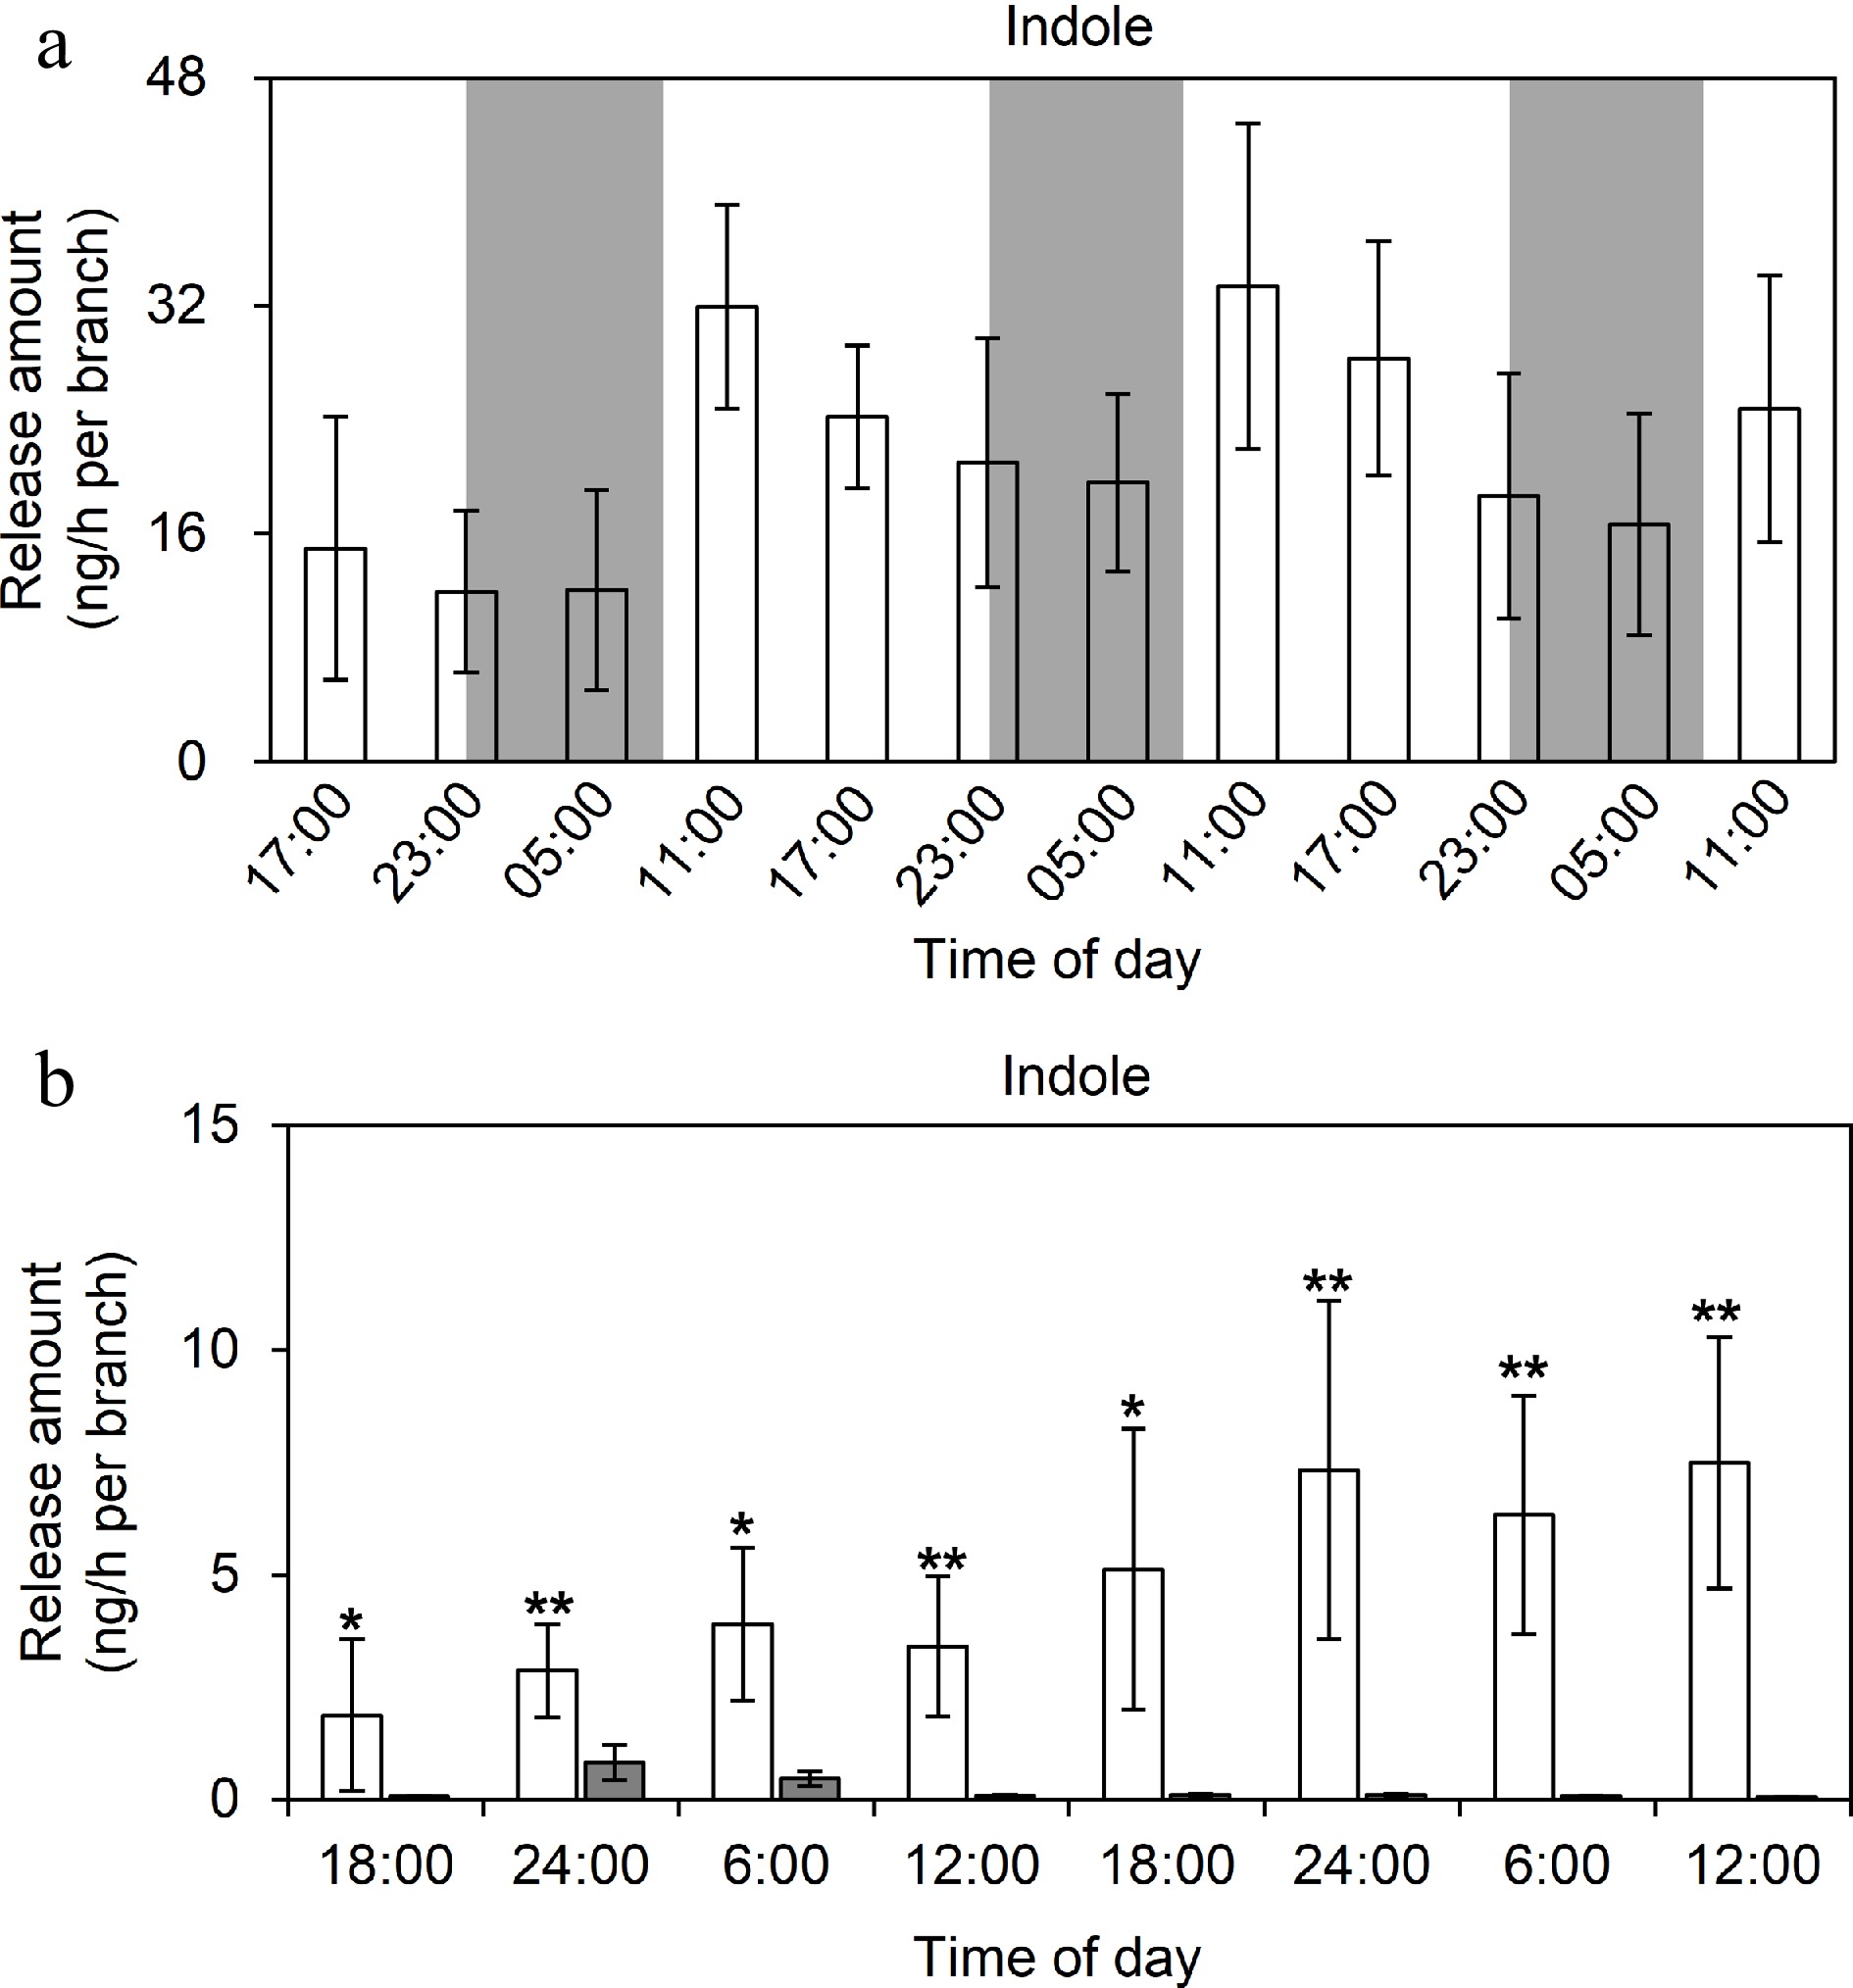
Figure 3.
TDU-GC-MS analysis of indole emission patterns under different light conditions. (a) The pattern of indole emission under normal photoperiods. Eight replicates were performed, and three tea branches were placed in each replicate, and the columns were changed every 6 h and two holes were punched into each leaf using a 3 mm caliber perforator. Data are expressed as mean ± SD (n = 8). White and gray background separately represents day and night, respectively. (b) The pattern of indole emission under continuous light or continuous dark. Five replicates were performed, five tea branches were placed in each replicate, and the columns were changed every 6 h and two holes were punched into each leaf using a 3 mm caliber perforator. Data are expressed as mean ± SD (n = 5). White and gray background represents continuous light and continuous dark, respectively. * and ** indicate significant differences between two treatments at the same time-point (p ≤ 0.05 and p ≤ 0.01, respectively).
-
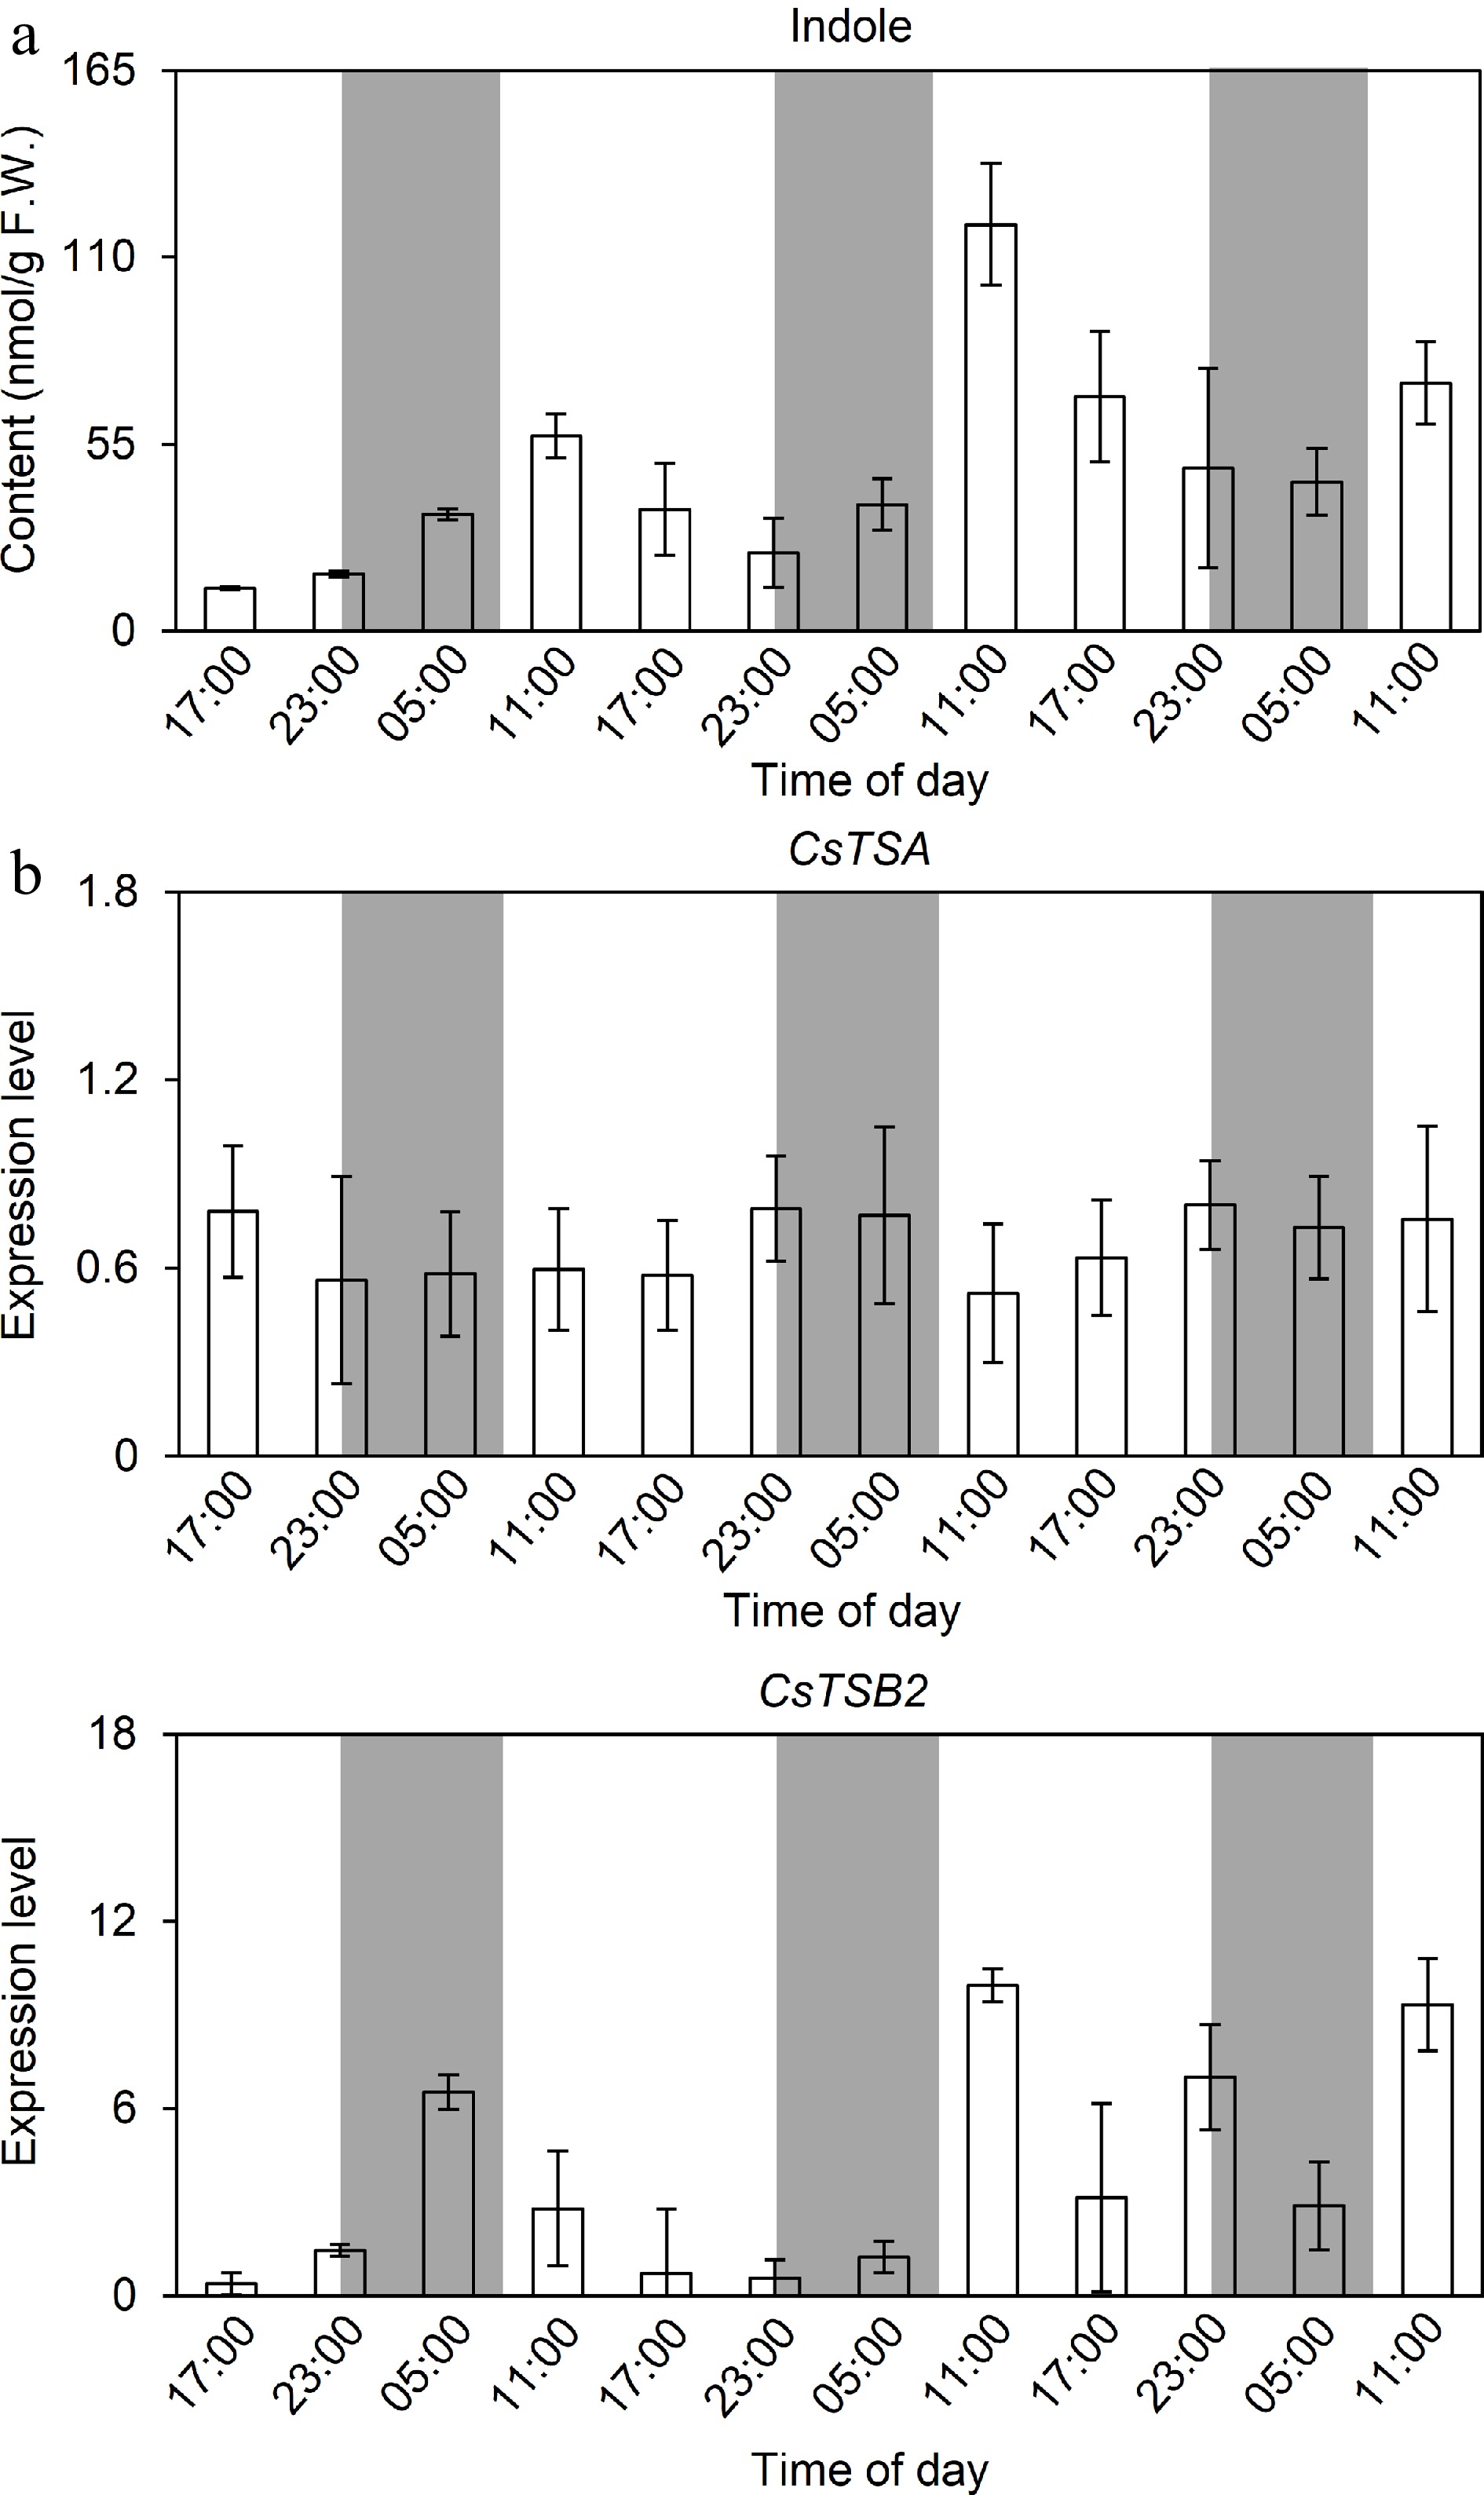
Figure 4.
Variation of endogenous indole content and expression level of its structural genes under mechanical damage. (a) Variation of endogenous indole content under continuous mechanical damage. (b) Variation of expression level of synthesizing genes under mechanical damage. Samples were collected at 6 h intervals, and five replicates with three tea branches placed in each replicate were performed. Each leaf was punched once/3 h per leaf by a 3 mm caliber punch. Data are expressed as mean ± SD (n = 5). White and gray background represents day and night, respectively.
-
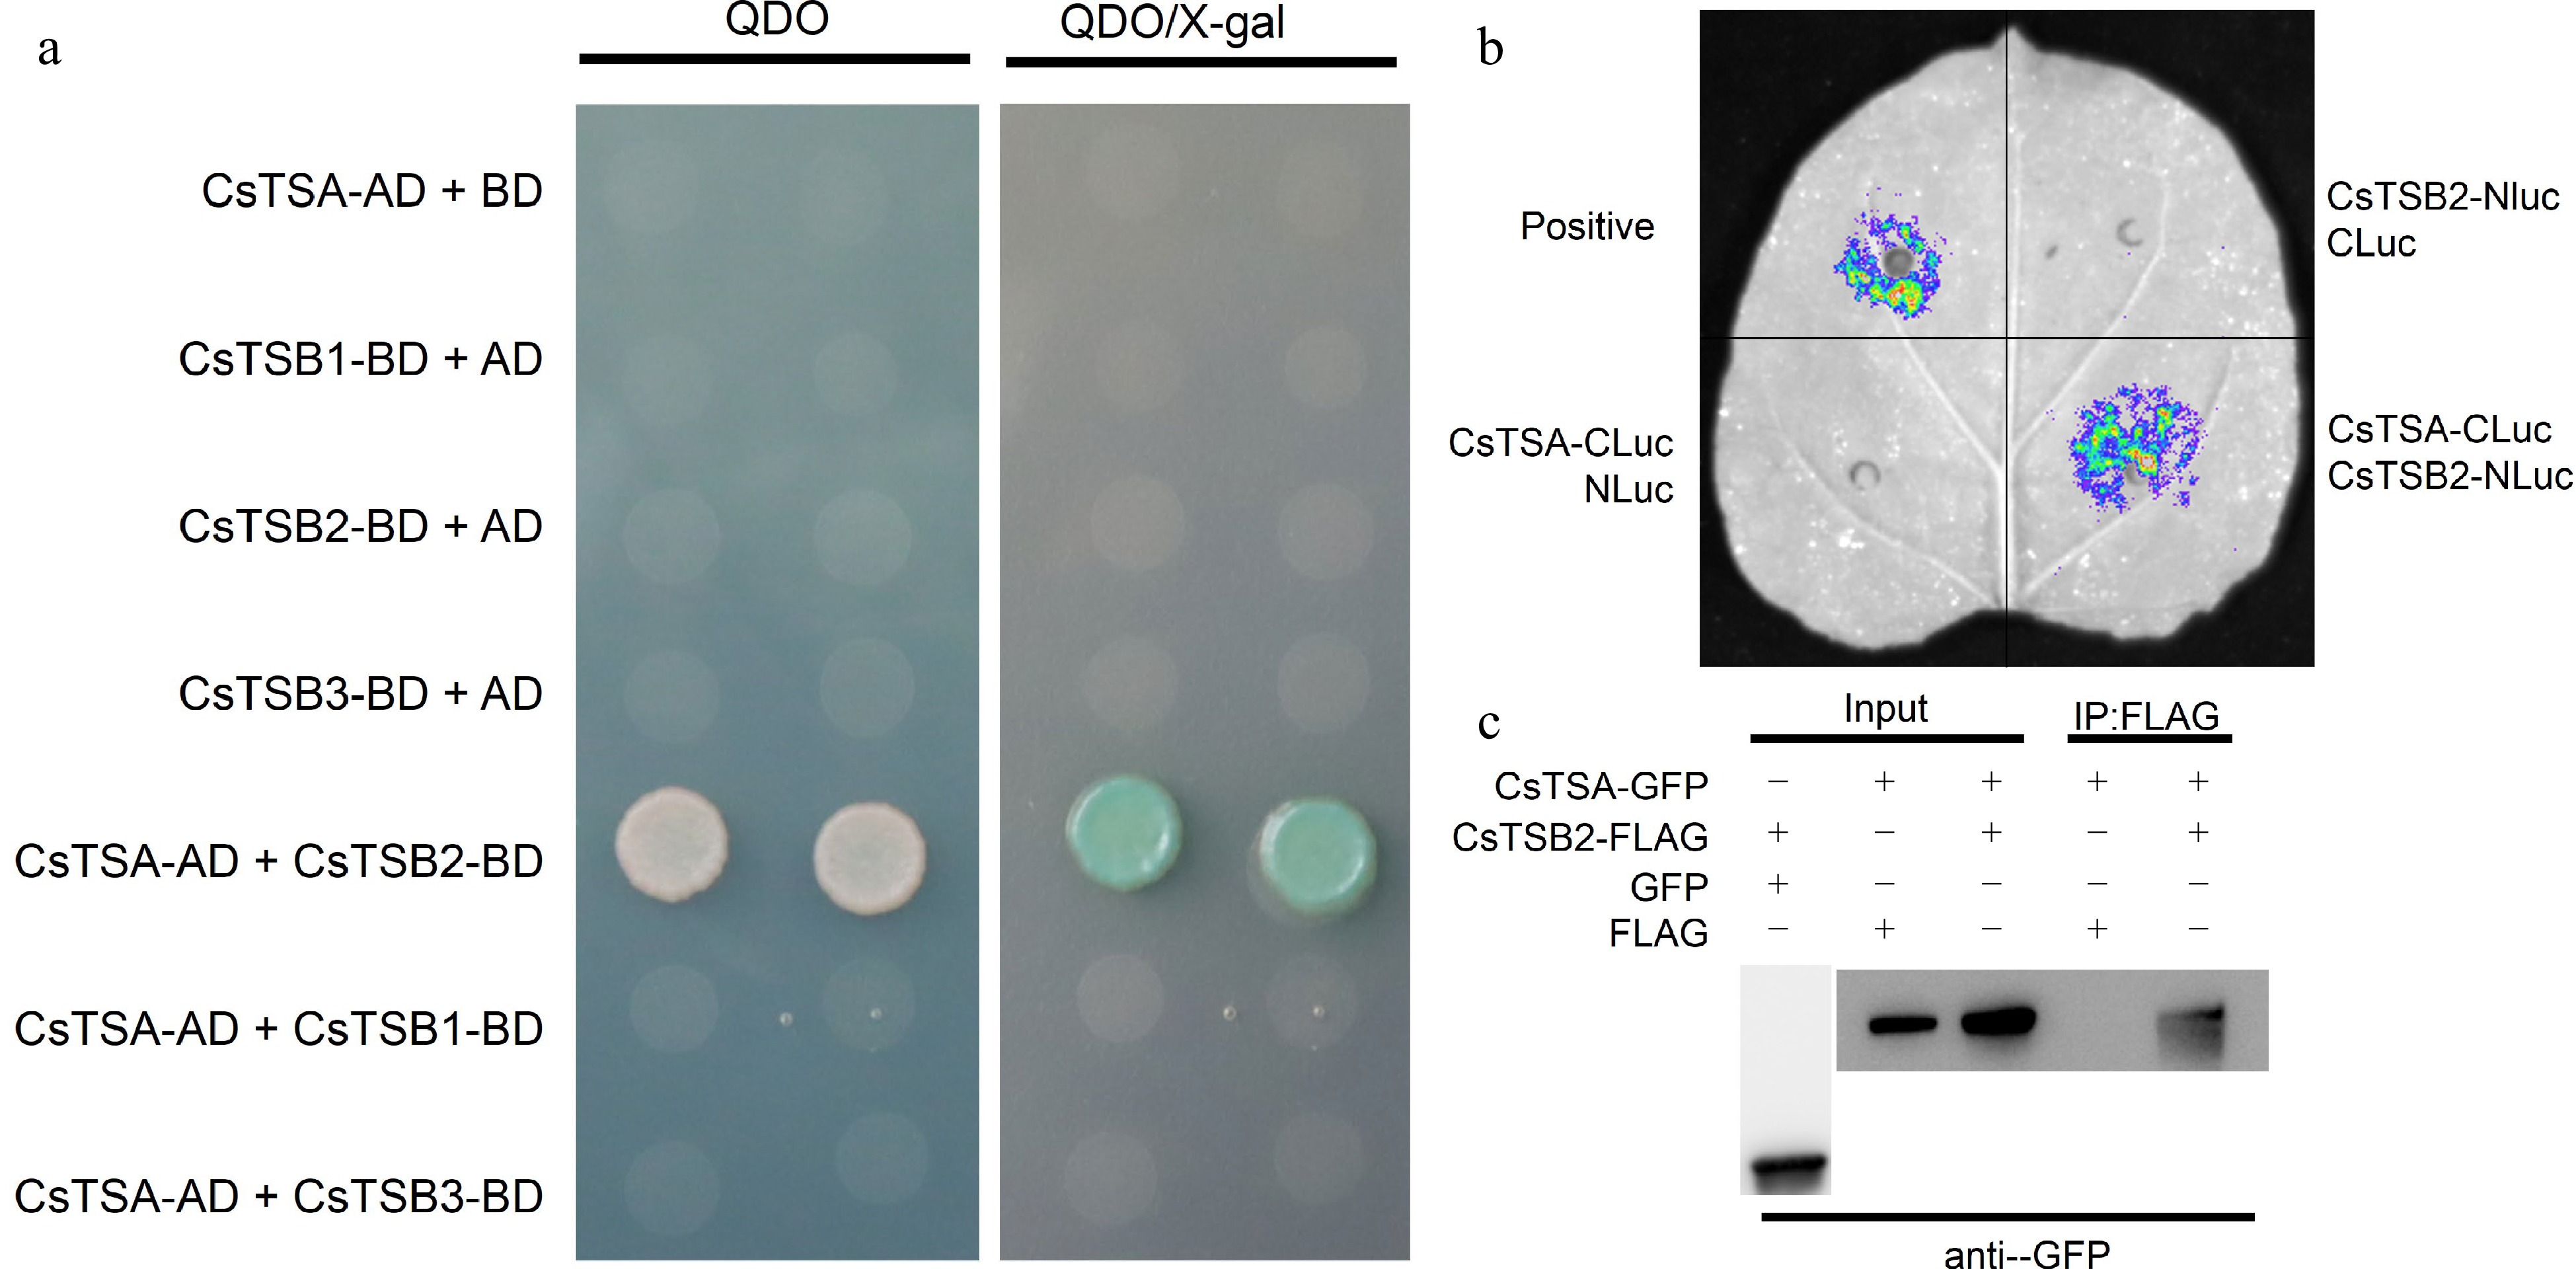
Figure 5.
Interaction between CsTSA and CsTSB2 in vitro and in vivo. (a) Interaction analysis of CsTSA and CsTSB2 in yeast two-hybrid assay. The full-length ORFs of CsTSA and CsTSB2 were fused with AD and BD vectors, co-transfected into yeast cells, and detected for possible interactions in QDO selection medium. QDO, SD/-Leu/-Trp/-His/-Ade. x-gal, X-a-gal. (b) Interaction analysis of CsTSA and CsTSB2 in LCI assay. CsTSA-CLuc and CsTSB2-NLuc were cotransformed into tobacco leaves, and CsTSA-CLuc and CsTSB2-NLuc were cotransformed with NLuc or CLuc, respectively, as a negative control, and fluorescence signals were detected by spraying the lower epidermis of the leaves with fluorescein (100 μM). (c) Interaction analysis of CsTSA and CsTSB2 in Co-IP assay. Total proteins were extracted from tobacco leaves of co-transformed tobacco, respectively. The protein extracts were incubated with anti-FLAG antibody and then immunoprecipitated proteins were detected by western blotting using anti-GFP antibody. Control proteins were detected with anti-GFP and anti-FLAG antibodies, respectively.
-
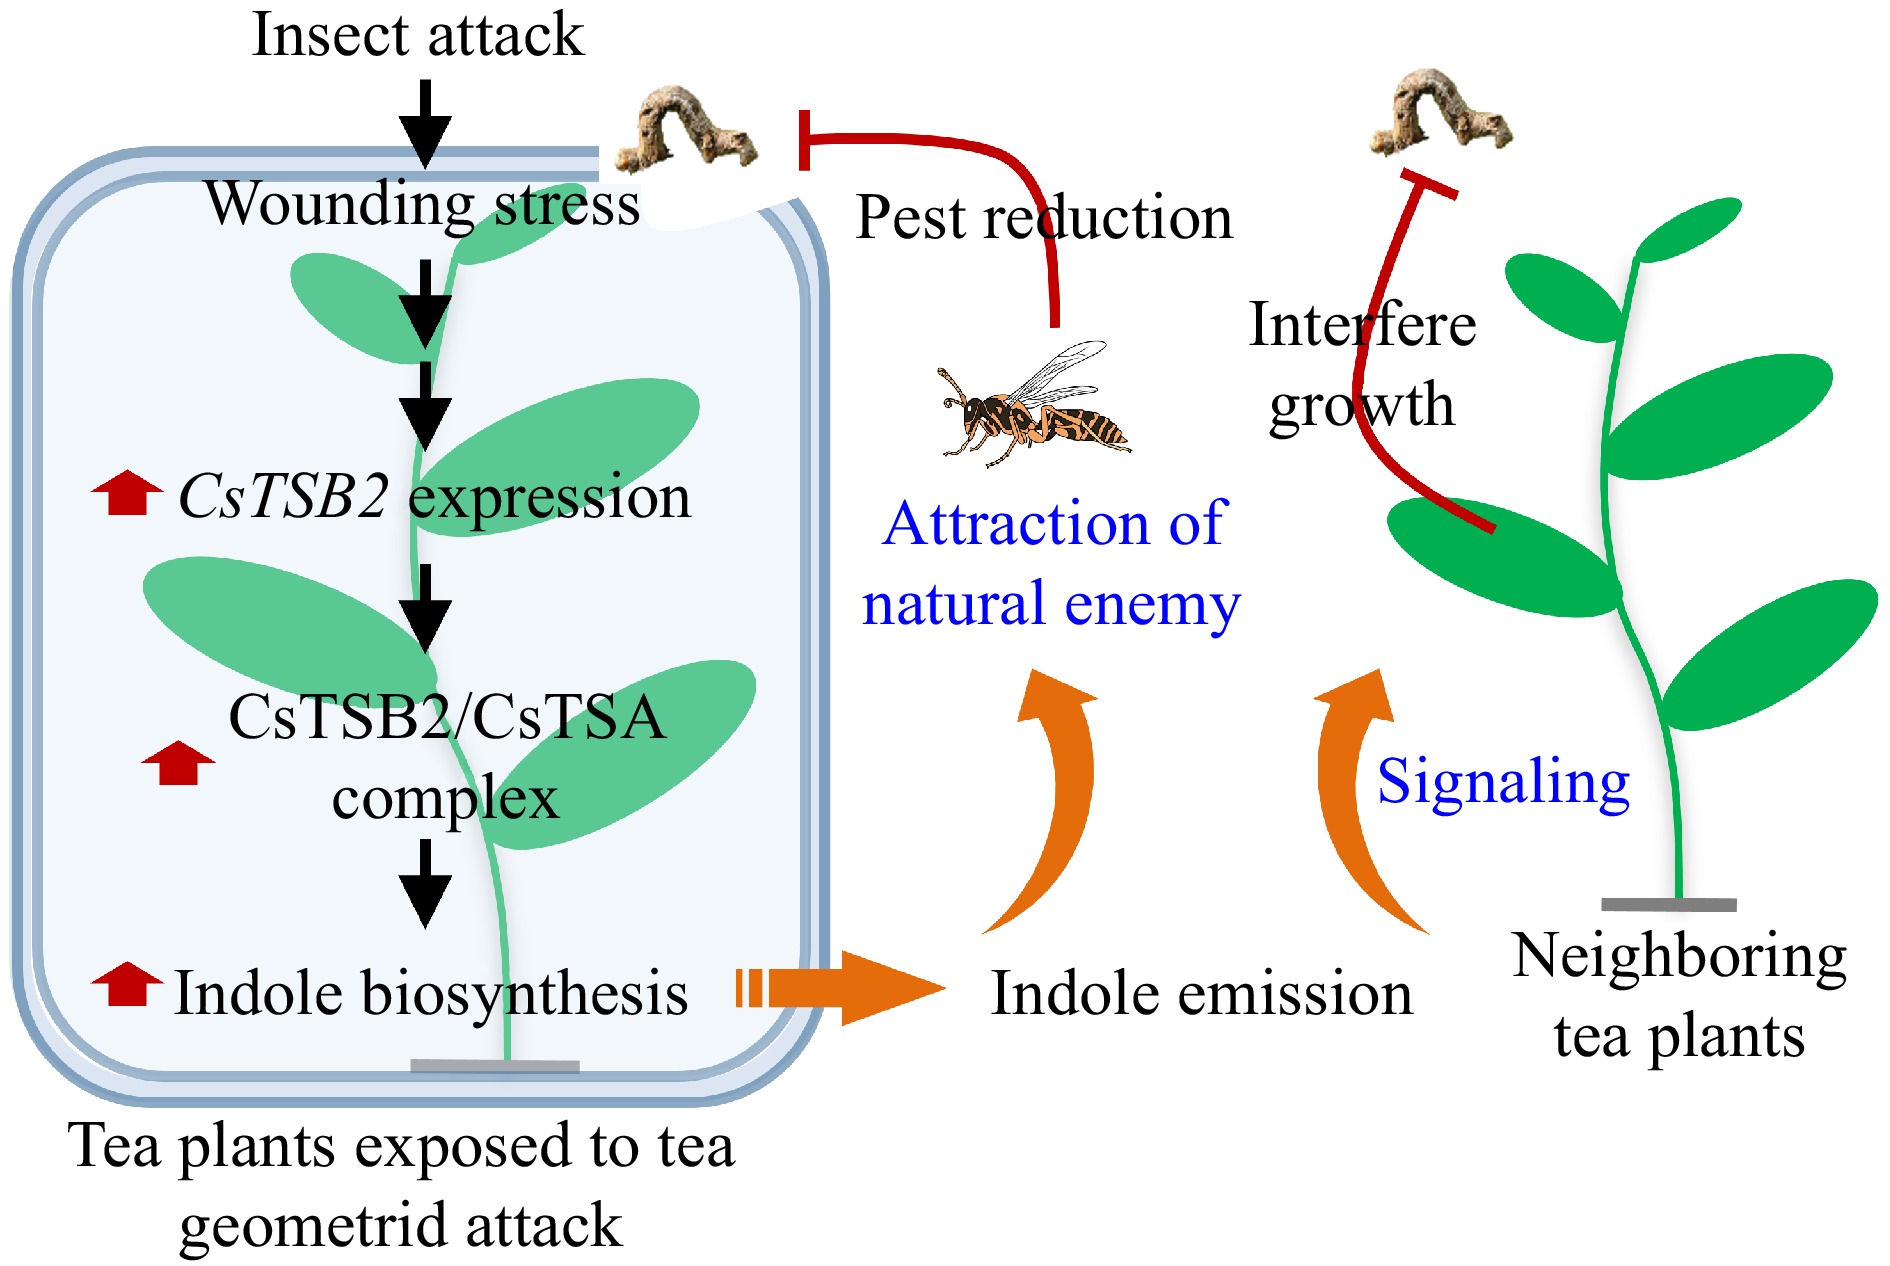
Figure 6.
Insect attack induces emission of indole with indirect anti-insect function in tea plant. Insect attack significantly up-regulated the expression of CsTSB2, a key synthesis gene of indole. CsTSB2 formed a complex with CsTSA to co-regulate indole synthesis. When released, indole improved the ability of neighbouring plants to resist pests by signalling. Indole also acted as an attractant to attract natural enemy of the pest. CsTSA, tryptophan synthase α-subunit; CsTSB, tryptophan synthase β-subunit.
Figures
(6)
Tables
(0)