-
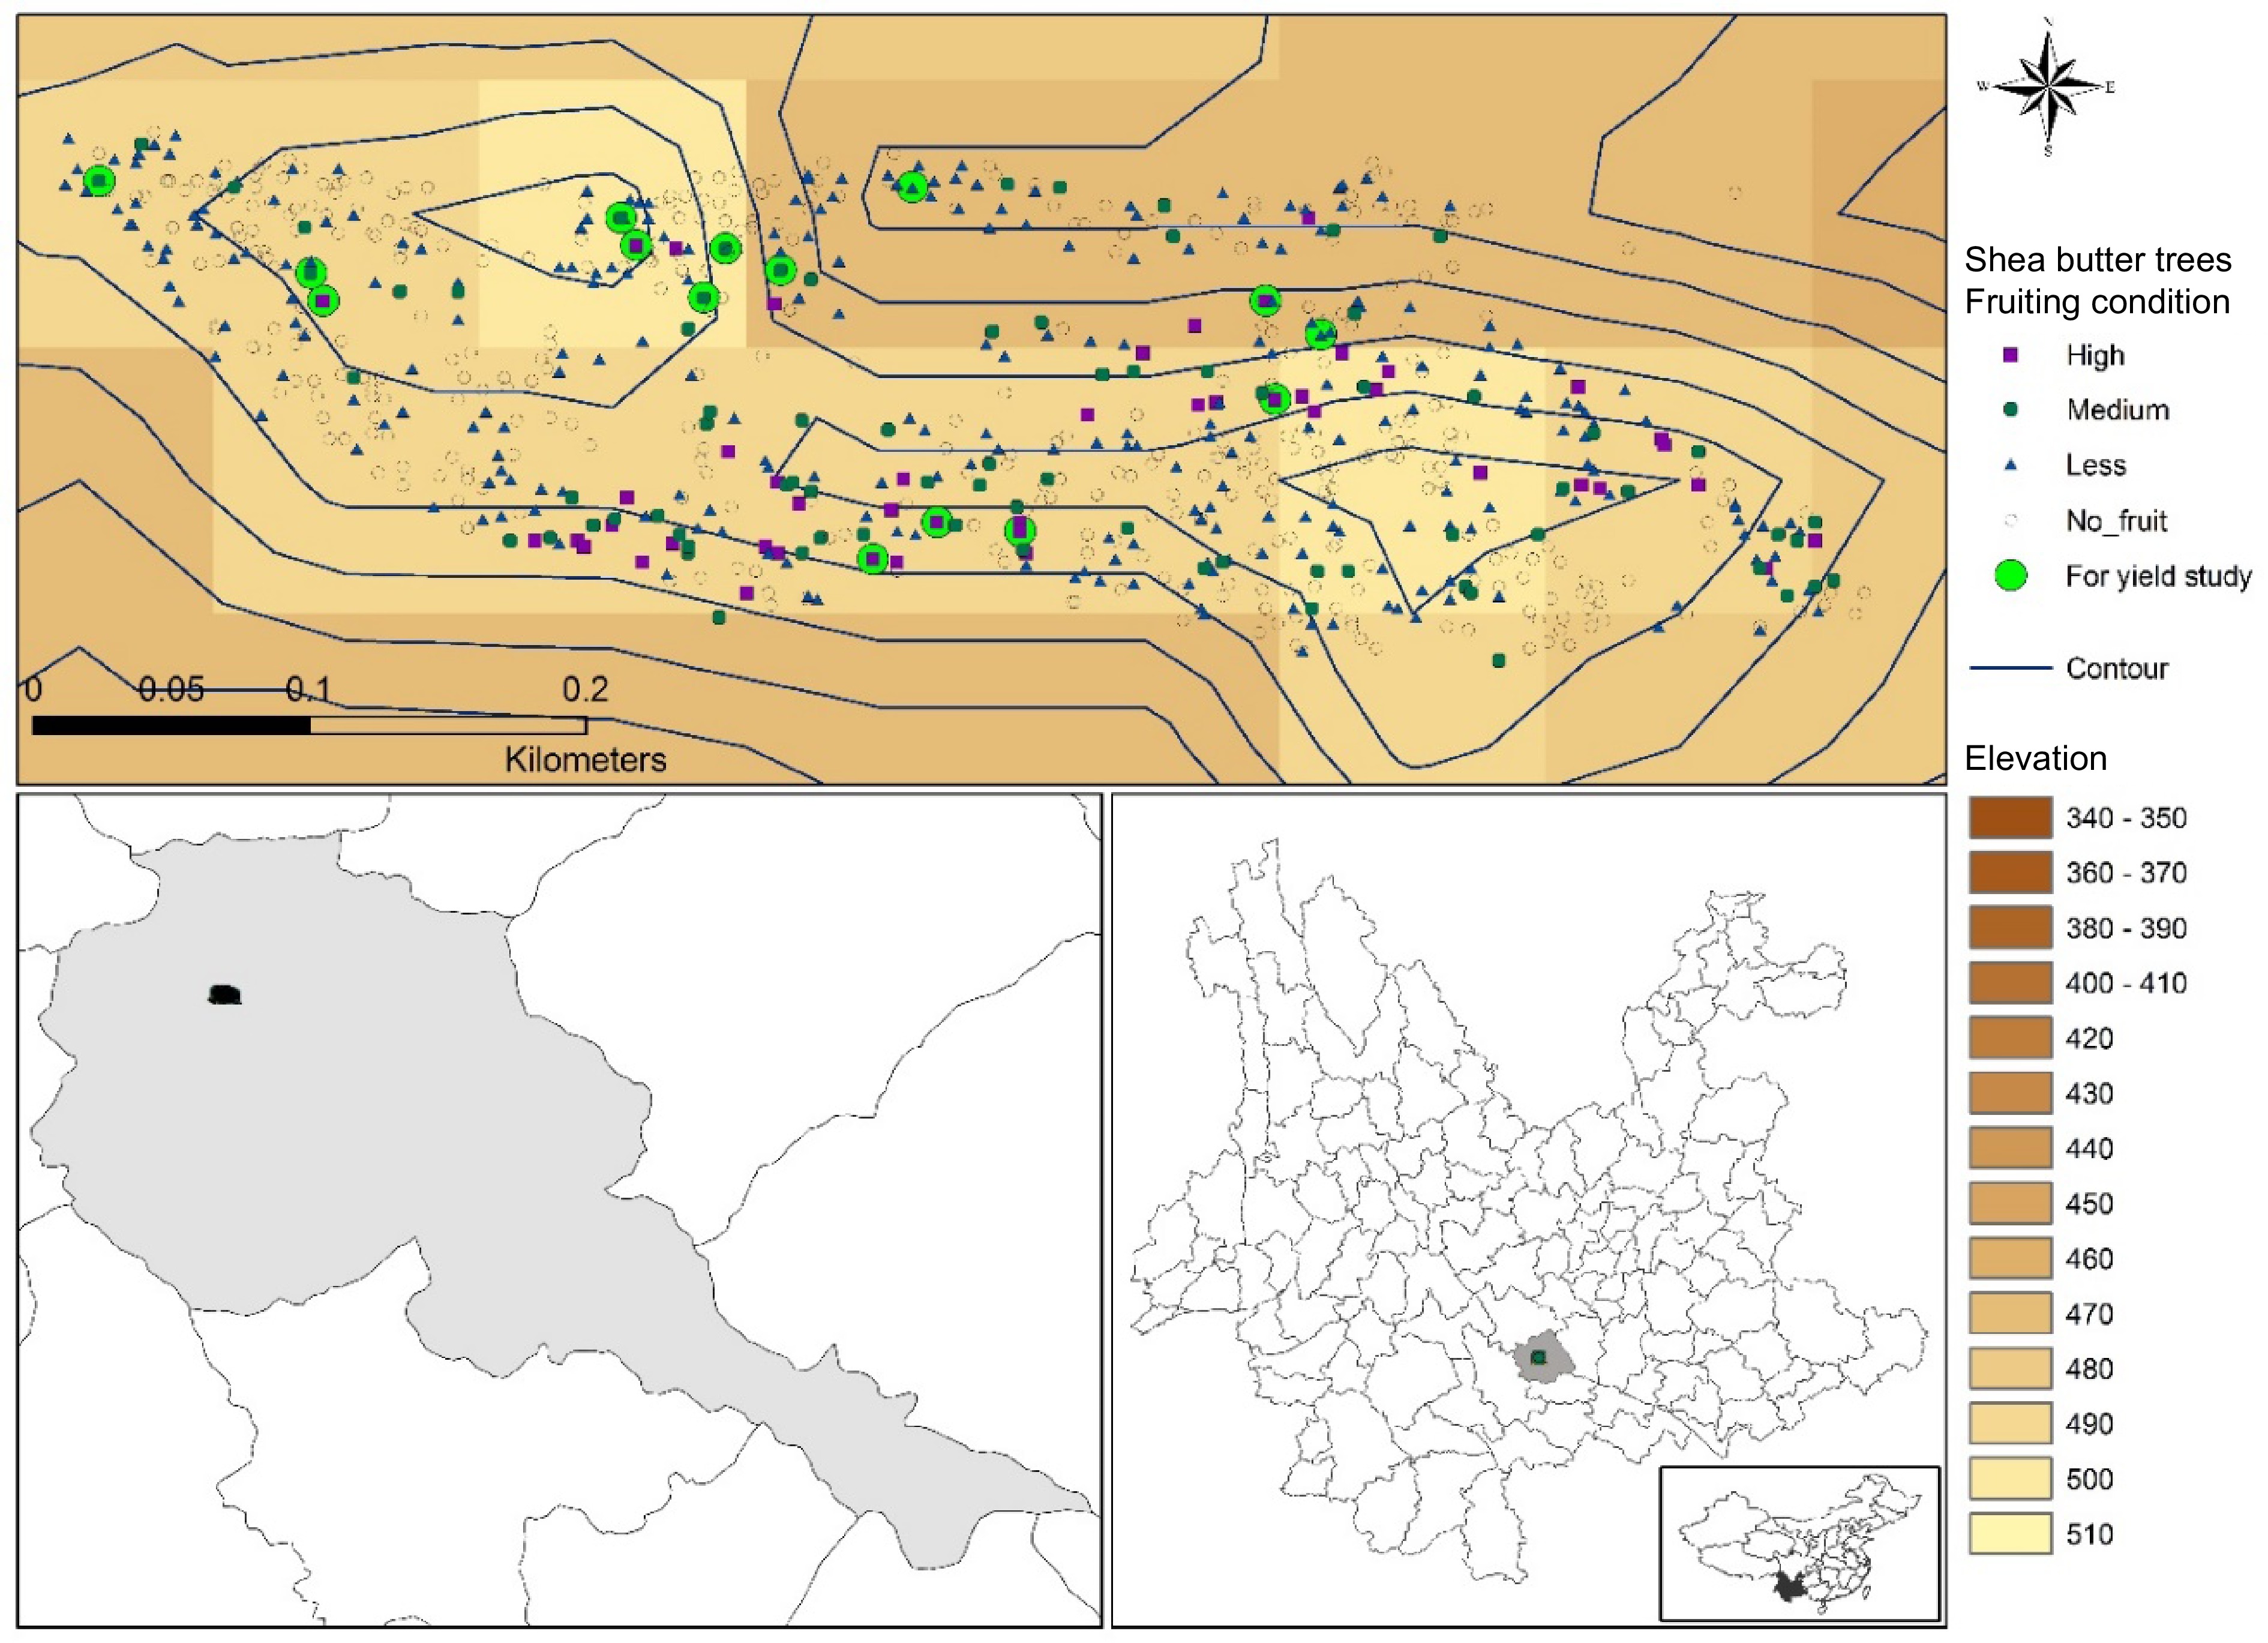
Figure 1.
Plantation area of shea butter in Yunnan, China. Shea butter distribution in the plantation site were mapped along with fruiting trees and fruiting intensity.
-

Figure 2.
(a) Temperature and (b) precipitation trend from weather data between 1973 to 2018 recorded at the Yuanjiang, China meteorological station.
-
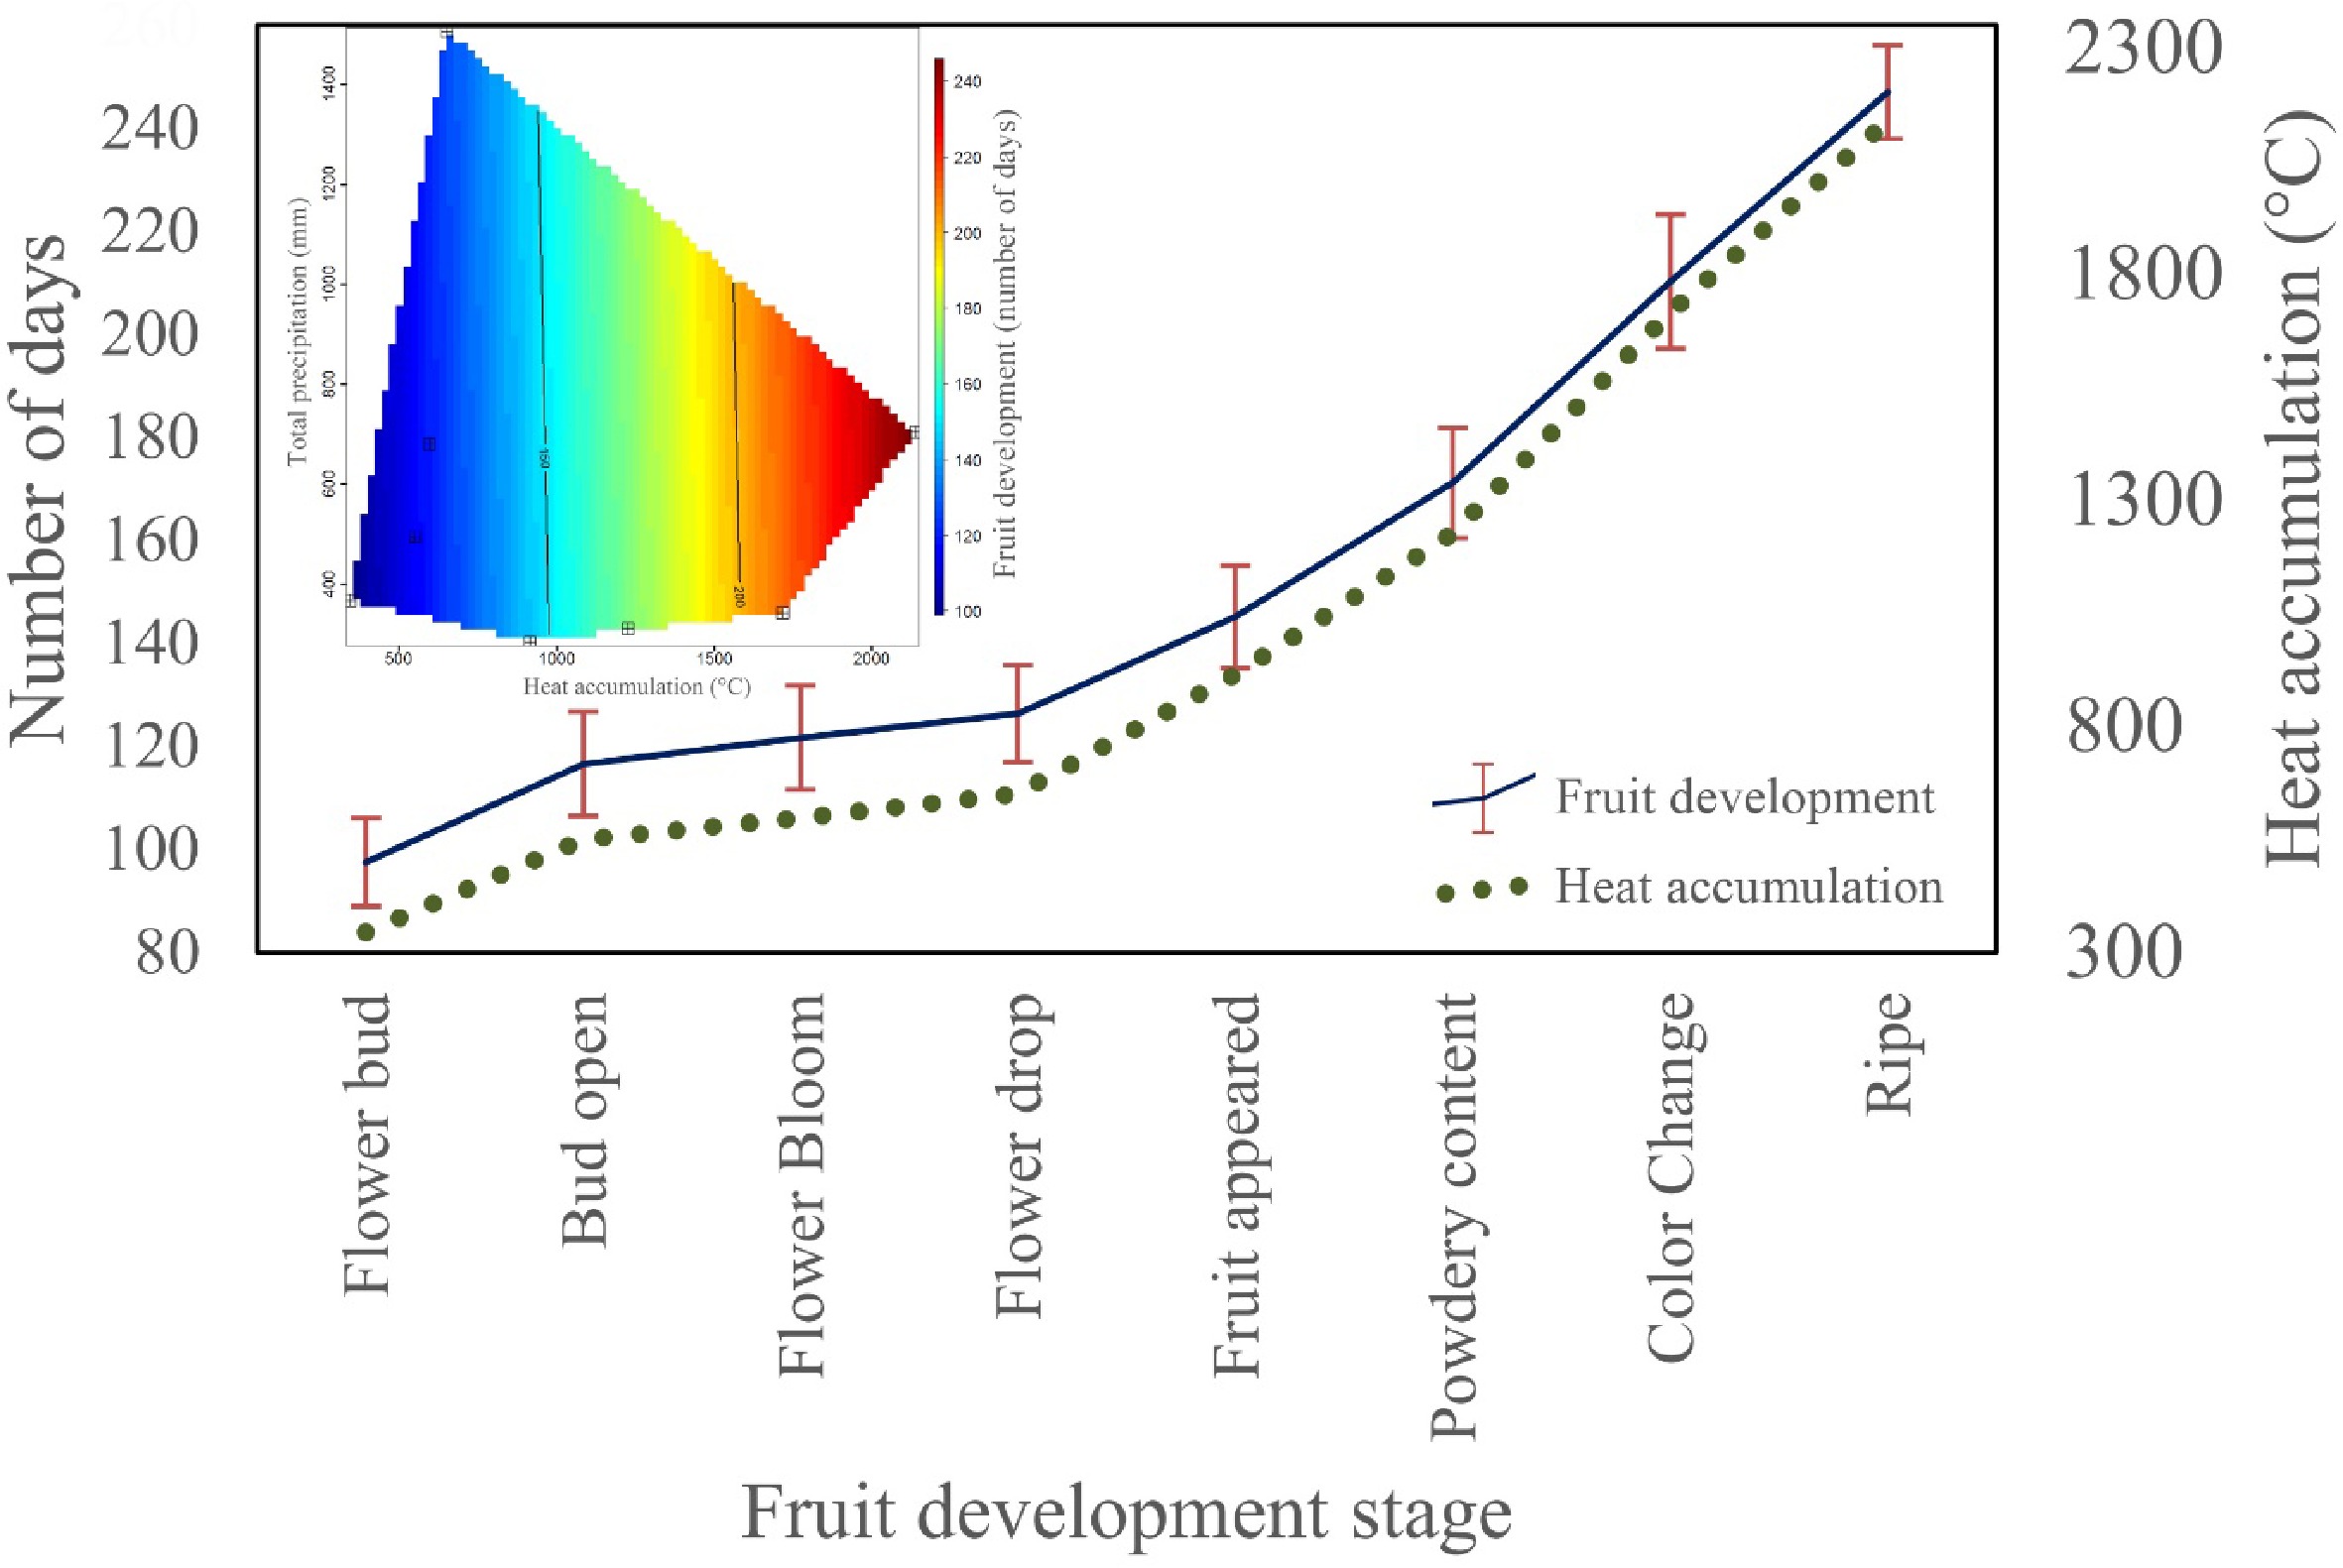
Figure 3.
The response of phenological stage to heat accumulation and precipitation. Variation in color reflects change in the phenological stages from flower to fruit.
-
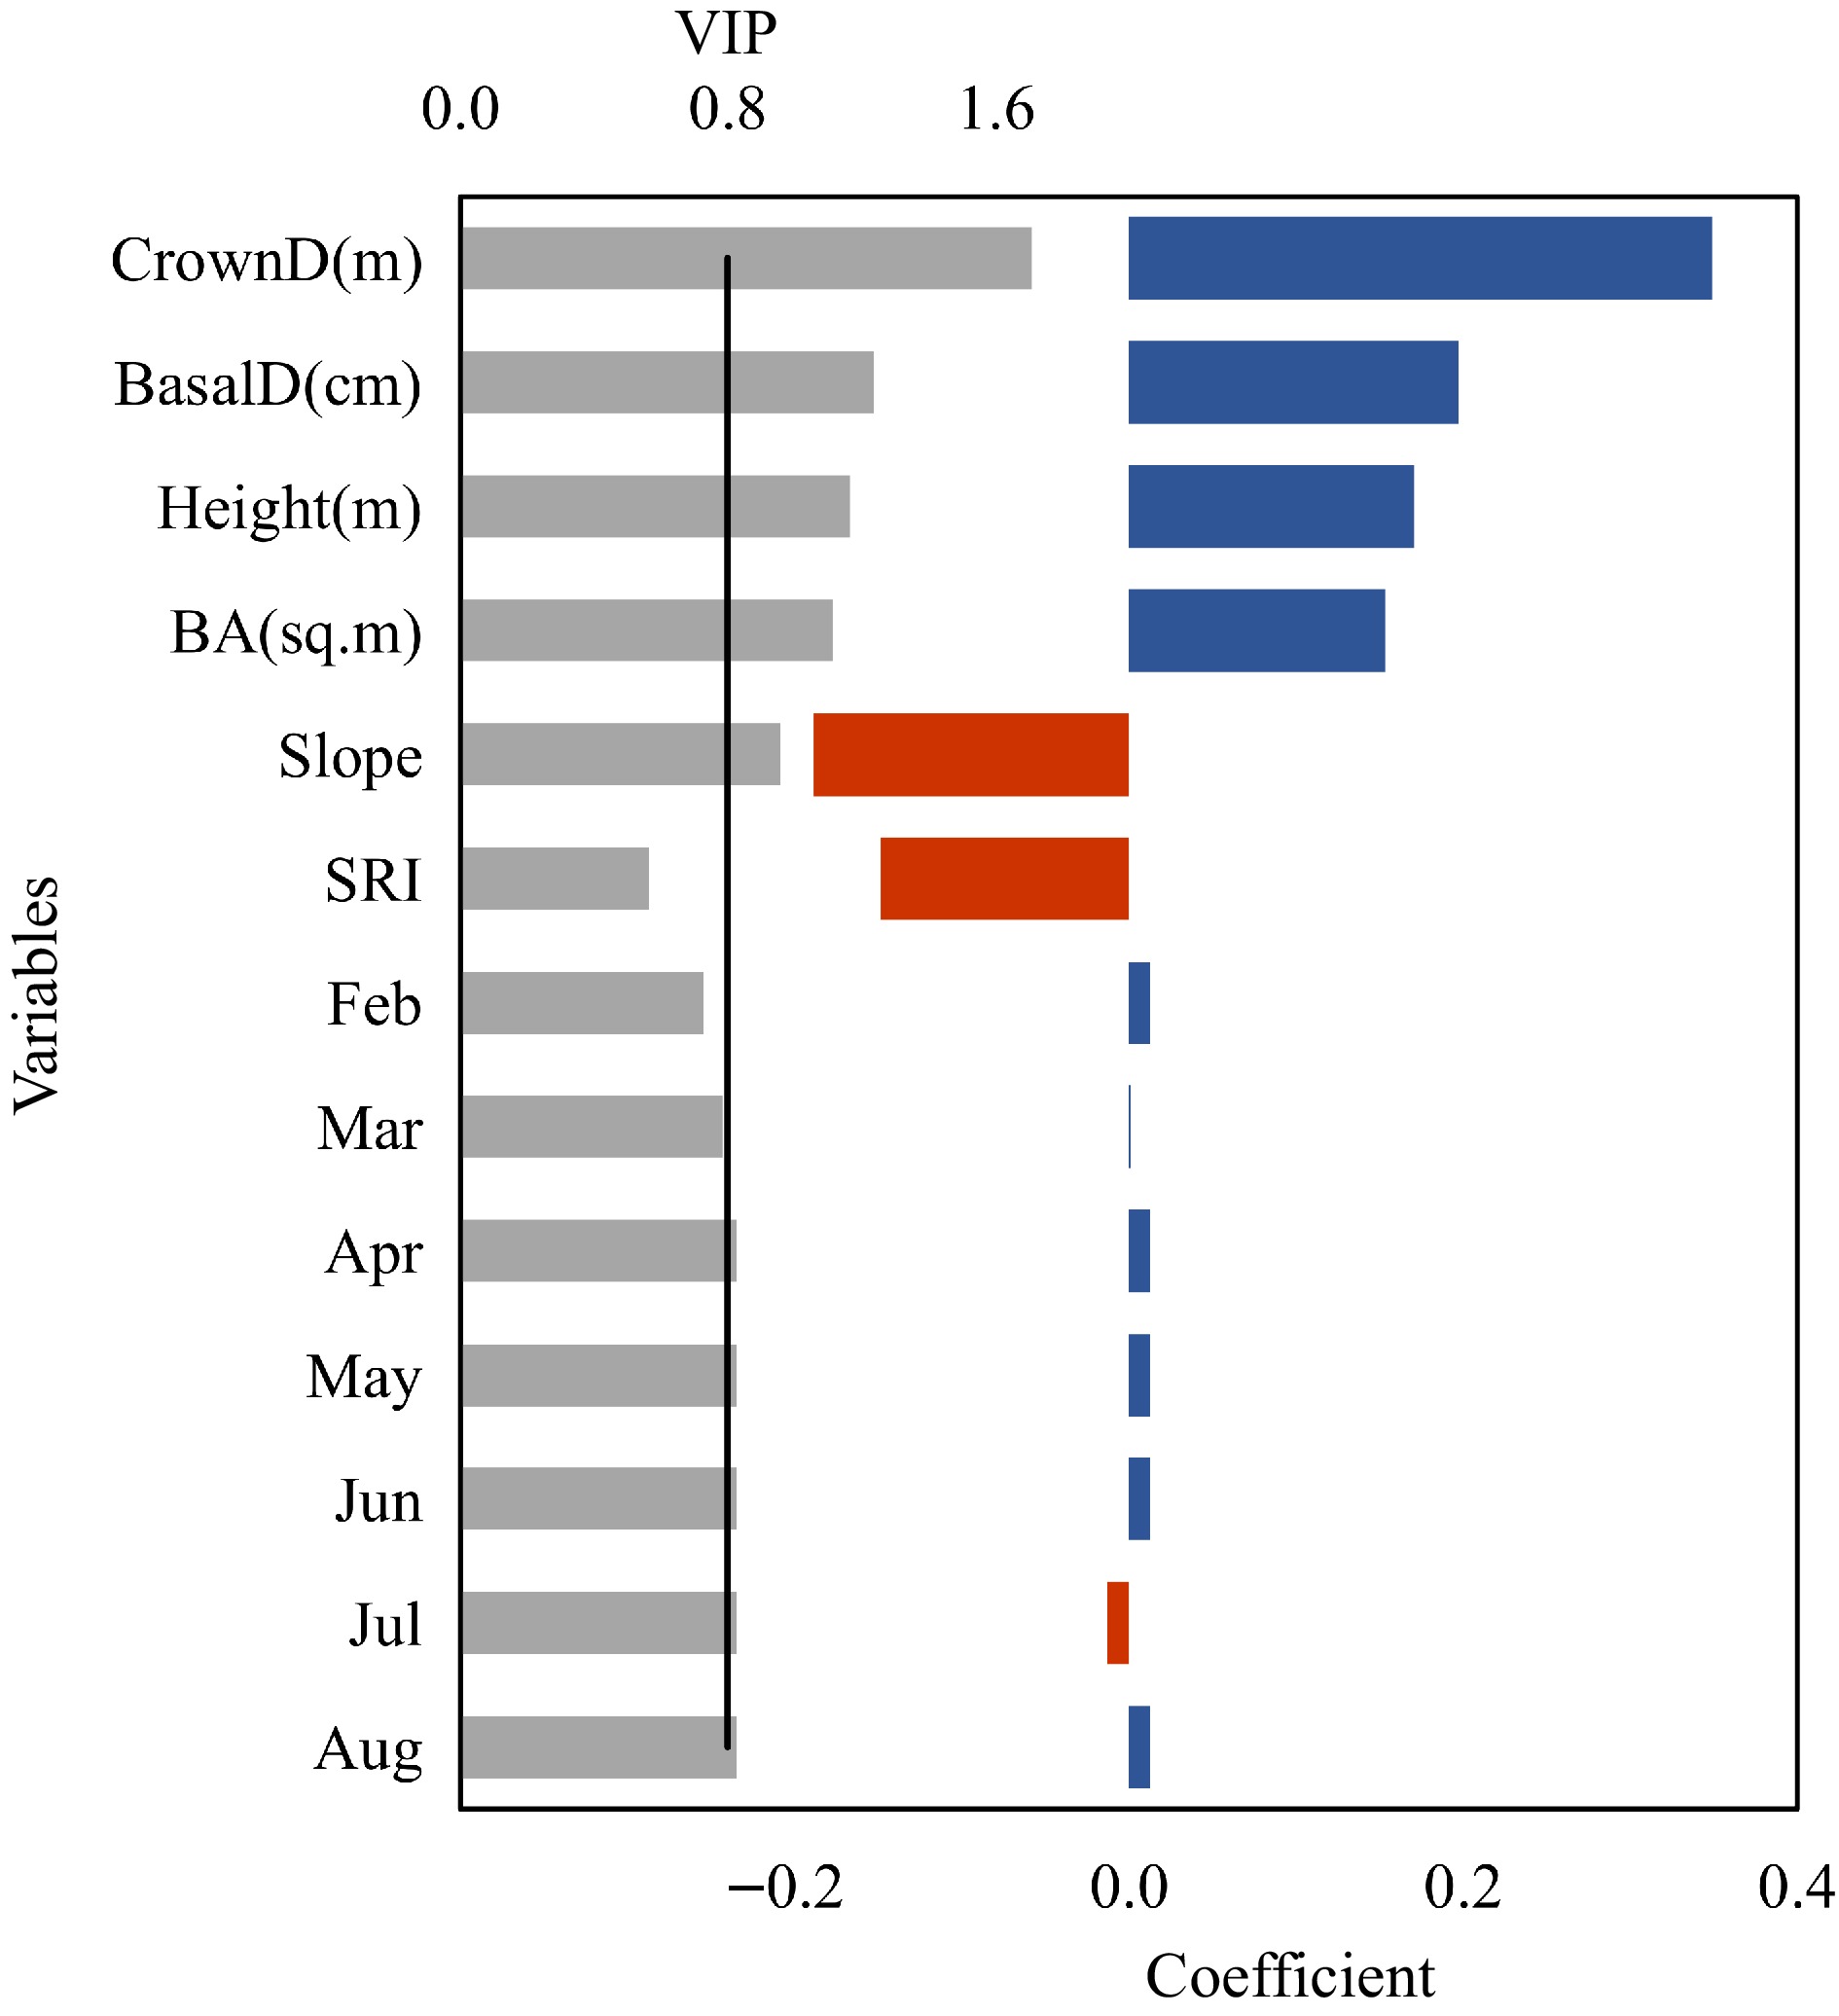
Figure 4.
PLS analysis showing VIP and model coefficient.
-
Statistic Height (m) DBH (cm) Basal
diameter (cm)Crown
diameter (m)Altitude (m) Minimum 5.2 17.2 17.5 2.4 451 Maximum 14.5 40.3 52.5 10.6 509 Mean 9.3 28.2 32.4 6.1 487 Standard deviation (n-1) 1.7 4.9 5.9 1.1 10.1 Number of trees (n) = 794. Table 1.
Tree and site characteristics in the study site.
-
Year 'no fruit' 'less' 'medium' 'high' Total 2018 395 273 79 47 794 2019 365 173 142 102 782 In 2019, 12 trees were felled. Table 2.
The number of fruiting trees at different levels in 2018 and 2019.
-
Variable p-value (2018) p-value (2019) BA (m2) 0.38 0.09 Basal diameter (cm) 0.11 0.12 Crown diameter (m) 0.04* 0.02* DBH (cm) 0.38 0.09 Height (m) 0.23 0.49 * Significant at p < 0.05. Table 3.
Summary of Kruskal-Wallis test showing dendrometric characters for various fruiting conditions.
-
Variables BA Basal D Crown D DBH Height Slope SRI Yield BA 0.85 0.49 0.93 0.77 −0.44 0.18 0.46 Basal D 0.26 0.92 0.84 −0.17 0.21 0.55 Crown D 0.31 0.23 −0.43 −0.42 0.50 DBH 0.76 −0.35 0.29 0.50 Height −0.26 0.24 0.42 Slope −0.18 −0.14 SRI −0.27 VIF 12.77 11.64 2.80 17.57 4.05 1.91 1.85 VIF 6.51 6.33 2.59 3.60 1.78 1.82 Variables in bold represent the response variable while all others were explanatory variables. Variable highly correlated (> 0.65) are italicized. BA, basal area; D, diameter; DBH, Diameter at breast height; SRI, solar radiation index. VIF stands for variance inflation factor that quantifies the severity of multicollinearity. Table 4.
Correlation matrix of dendrometric and geographical variables (explanatory and response) used in PLS regression and results of multi-collinearity test among explanatory variables.
Figures
(4)
Tables
(4)