-
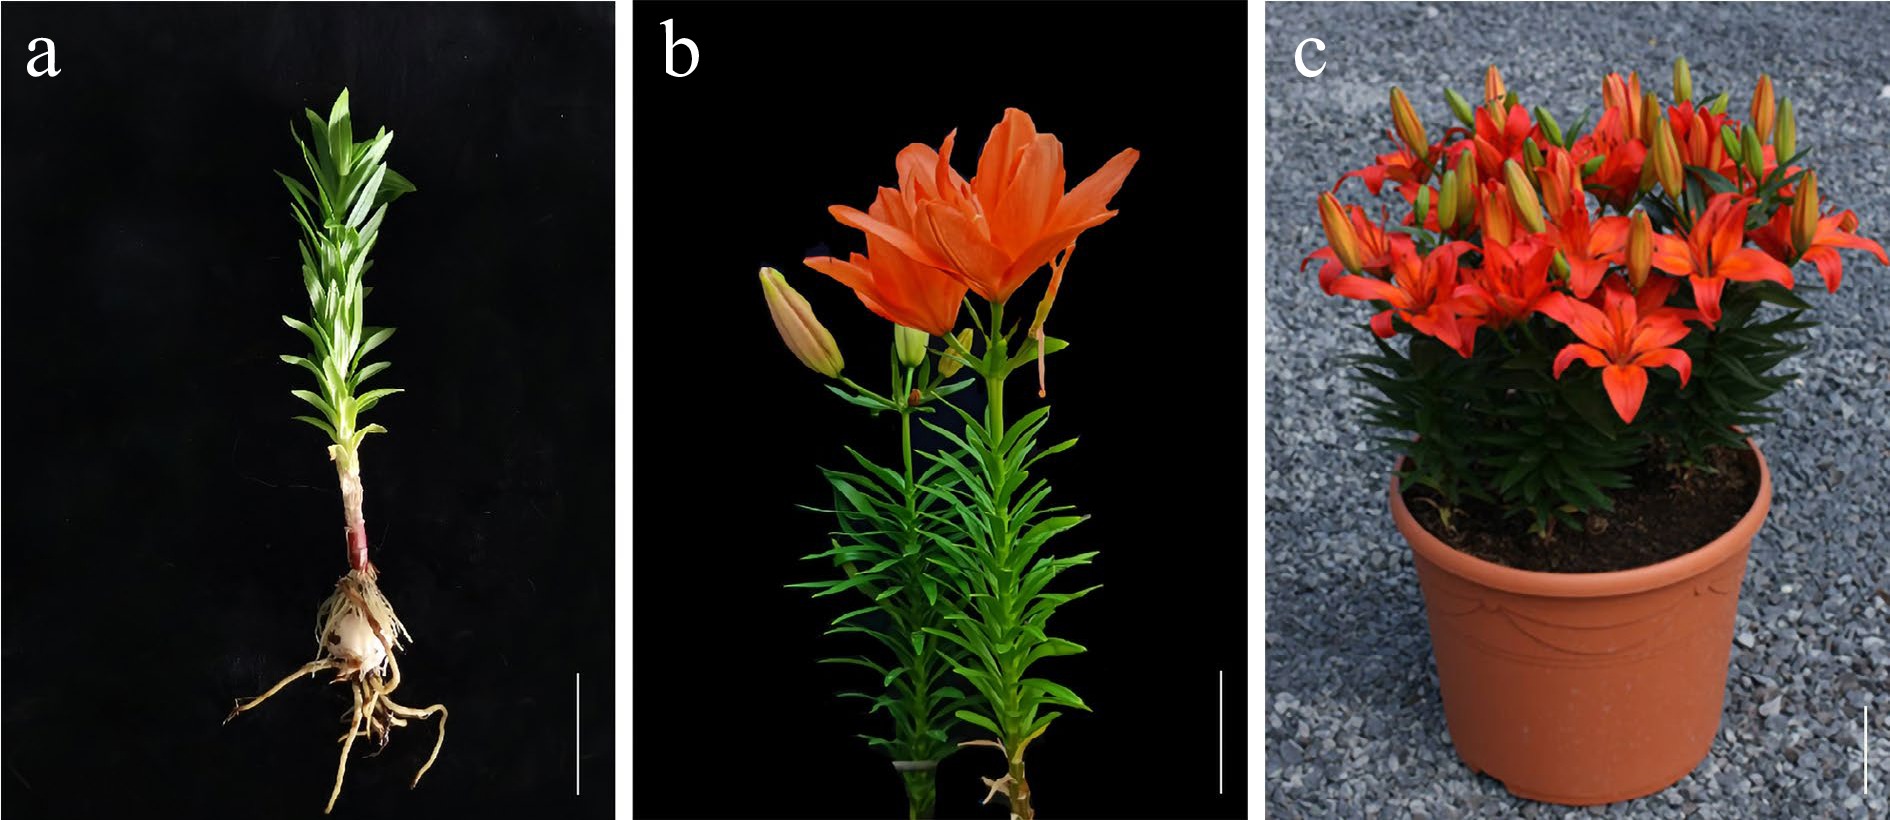
Figure 1.
The lily cultivar 'Matrix'. (a) The 'Matrix' at 30 DAP (days after planting into the soil). Dormancy-broken bulbs were used for planting. (b) The 'Matrix' at 50 DAP. The first flower opens approximately 45 DAP. (c) The potted 'Matrix'. Scale bars = 5 cm.
-
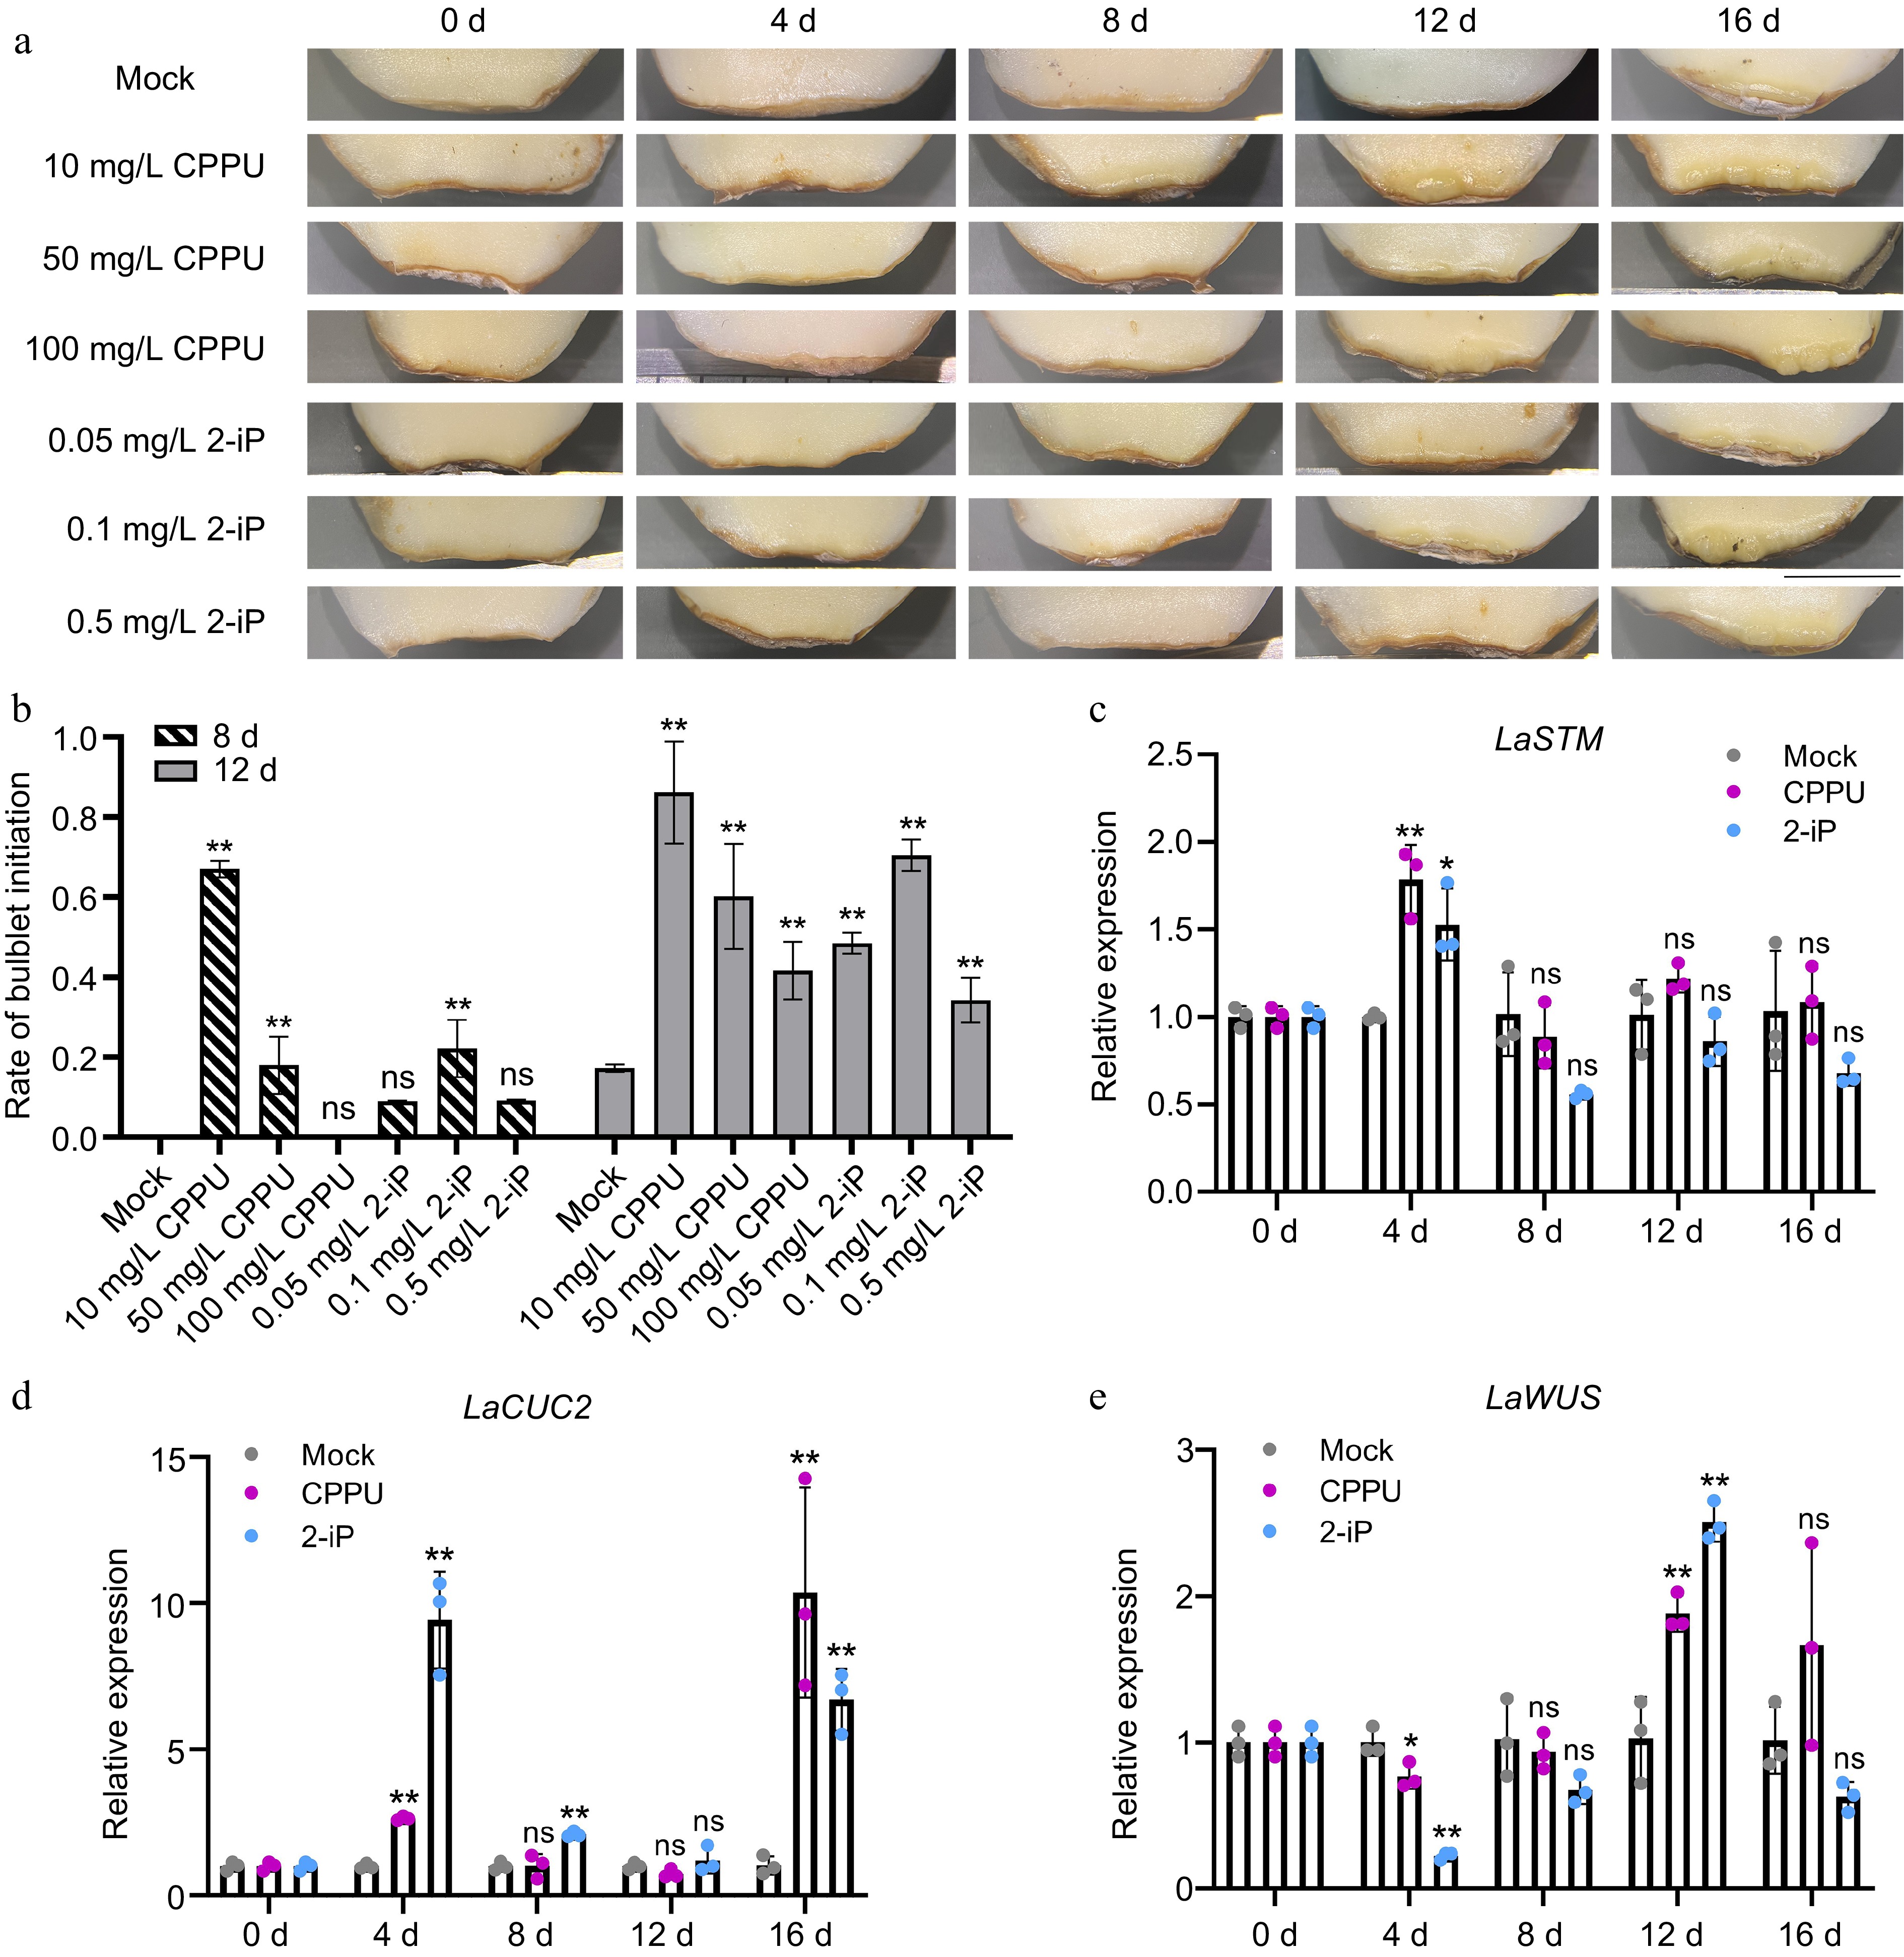
Figure 2.
Effects of CPPU and 2-iP treatments on the initiation rate of bulblets and the relative expression of organogenesis-related genes. The scales were derived from 'Matrix' bulbs stored at low temperature (4 °C) for two months. The data were collected every 4 d (0 d, 4 d, 8 d, 12 d, 16 d). (a) Morphological analysis of the initiation of the bulblet under different treatments. Bar = 0.5 cm. (b) CPPU (10 mg/L) and 2-iP (0.1 mg/L) treatments resulted in the occurrence of more bulblets at the base of scales than the control treatment (Mock). Data are from 8 and 12 d, n = 30 scales per treatment. Expression pattern of organogenesis-related genes, (c) LaSTM, (d) LaCUC2, and (e) LaWUS in the Mock, 10 mg/L CPPU, and 0.1 mg/L 2-iP treatments. qRT-PCR values were determined using the 2−ΔΔCᴛ approach. The control group for each time point was set as 1, and the treatment group was compared to its respective control group. Data are presented as the means of three biological replicates with standard deviation (SD) error bars (Student's t-test; *: p < 0.05; **: p < 0.01; ns: no significance).
-
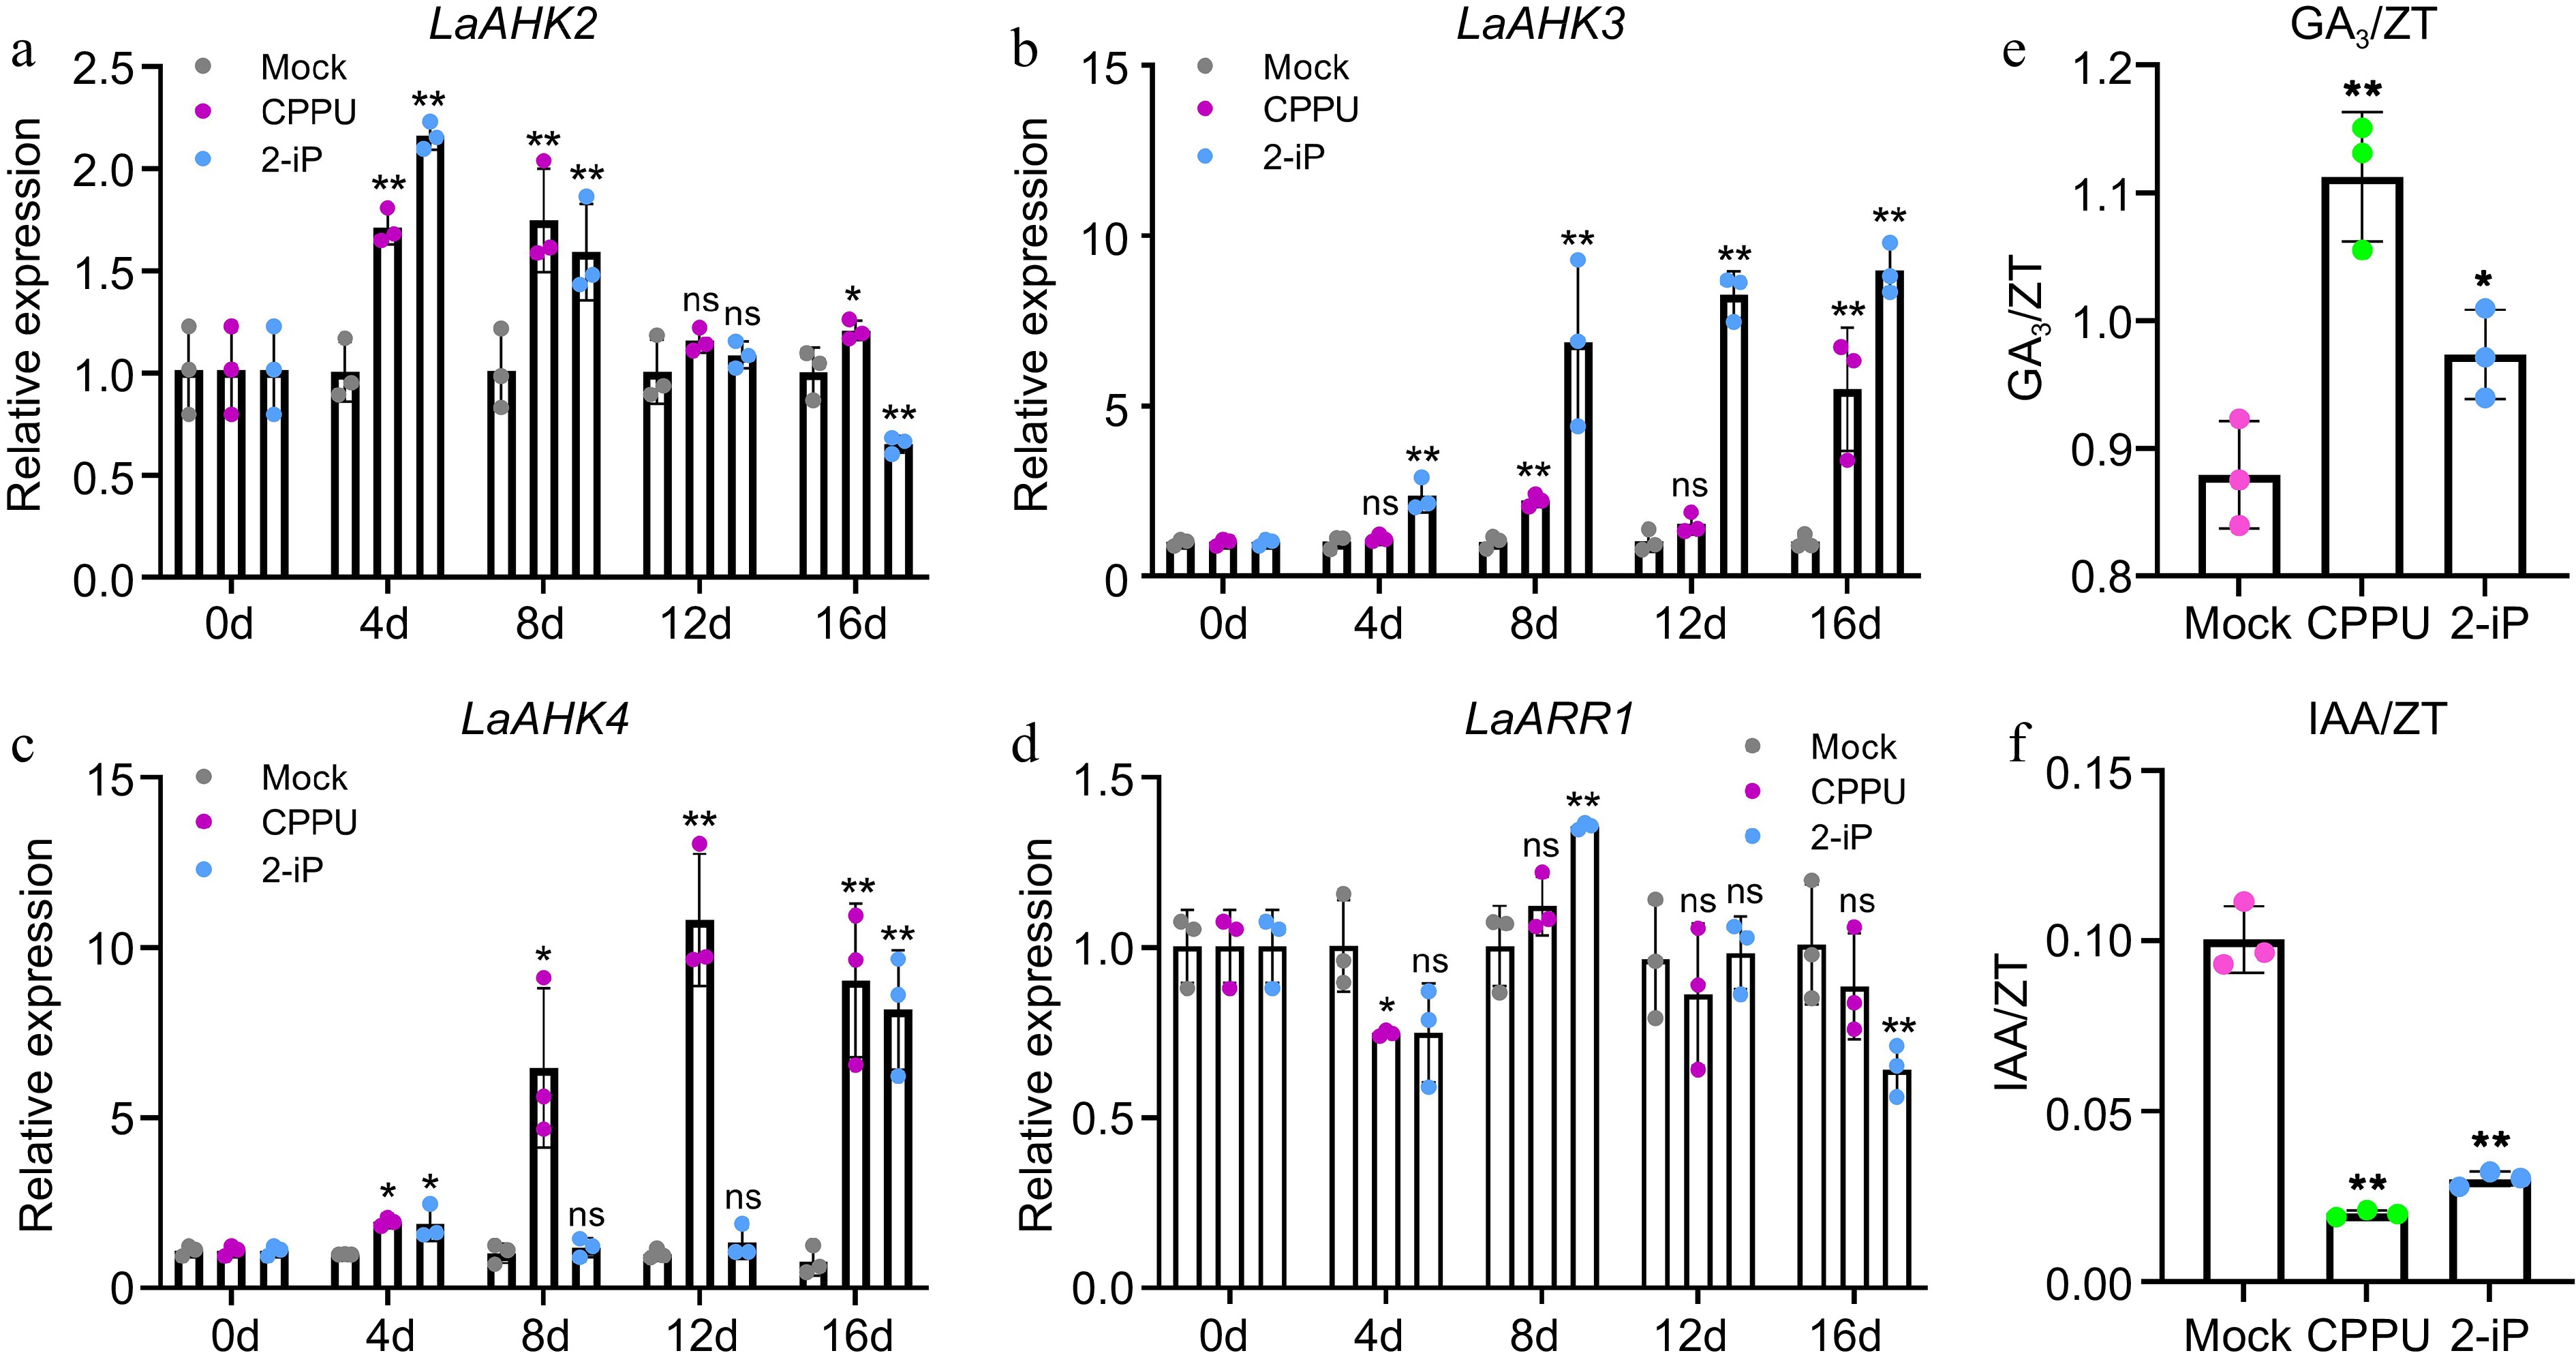
Figure 3.
Expression patterns of cytokinin signaling pathway genes and endogenous hormones with ZT in the control, 10 mg/L CPPU, and 0.1 mg/L 2-iP treatments during bulblet initiation. Relative expression of cytokinin signal genes, (a) LaAHK2, (b) LaAHK3, (c) LaAHK4, and (d) LaARR1 in the control, CPPU, and 2-iP treatments. The control group for each time point was set as 1, and the treatment group was compared to its respective control group. (e), (f) Endogenous hormones (GA3 and IAA) with ZT in the control, CPPU, and 2-iP treatments at 12 d. Data are presented as the means of three biological replicates with SD error bars (Student's t-test; *: p < 0.05; **: p < 0.01; ns: no significance).
-
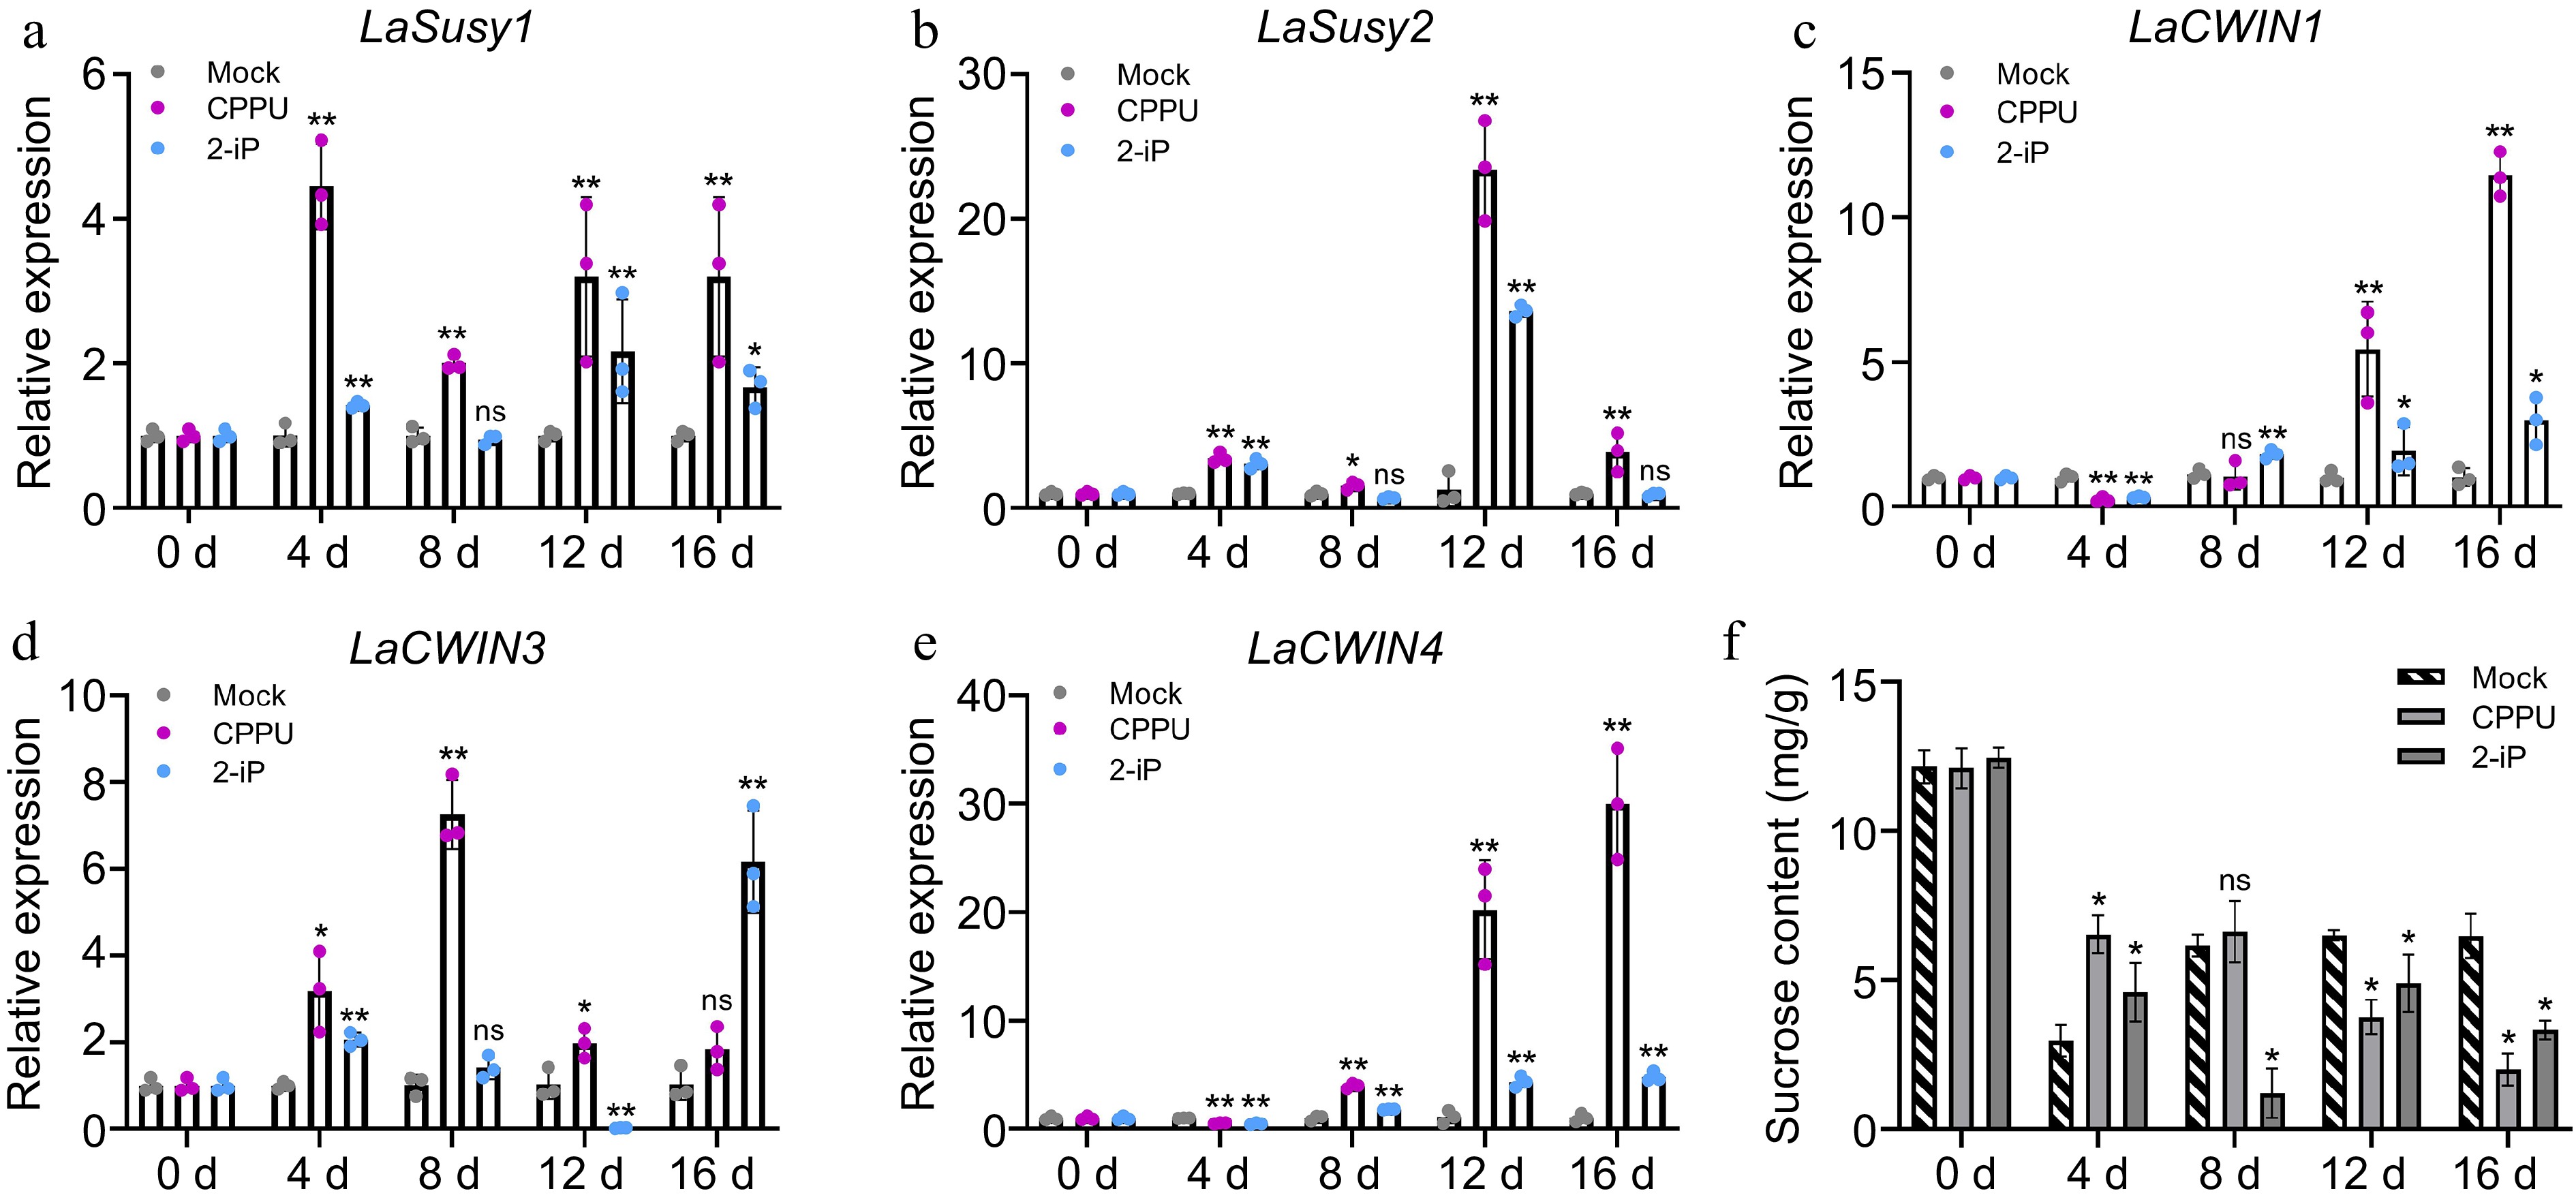
Figure 4.
Sucrose content and expression pattern of sucrose metabolism-related genes in the control, 10 mg/L CPPU, and 0.1 mg/L 2-iP treatments during the bulblet initiation process. Relative expression of (a) LaSusy1, (b) LaSusy2, (c) LaCWIN1, (d) LaCWIN3 and (e) LaCWIN4 in the control, CPPU, and 2-iP treatments. The control group for each time point was set as 1, and the treatment group was compared to its respective control group. (f) Sucrose content in the control, CPPU, and 2-iP treatments. Data are presented as the means of three biological replicates with SD error bars (Student's t-test; *: p < 0.05, **: p < 0.01; ns: no significance).
-
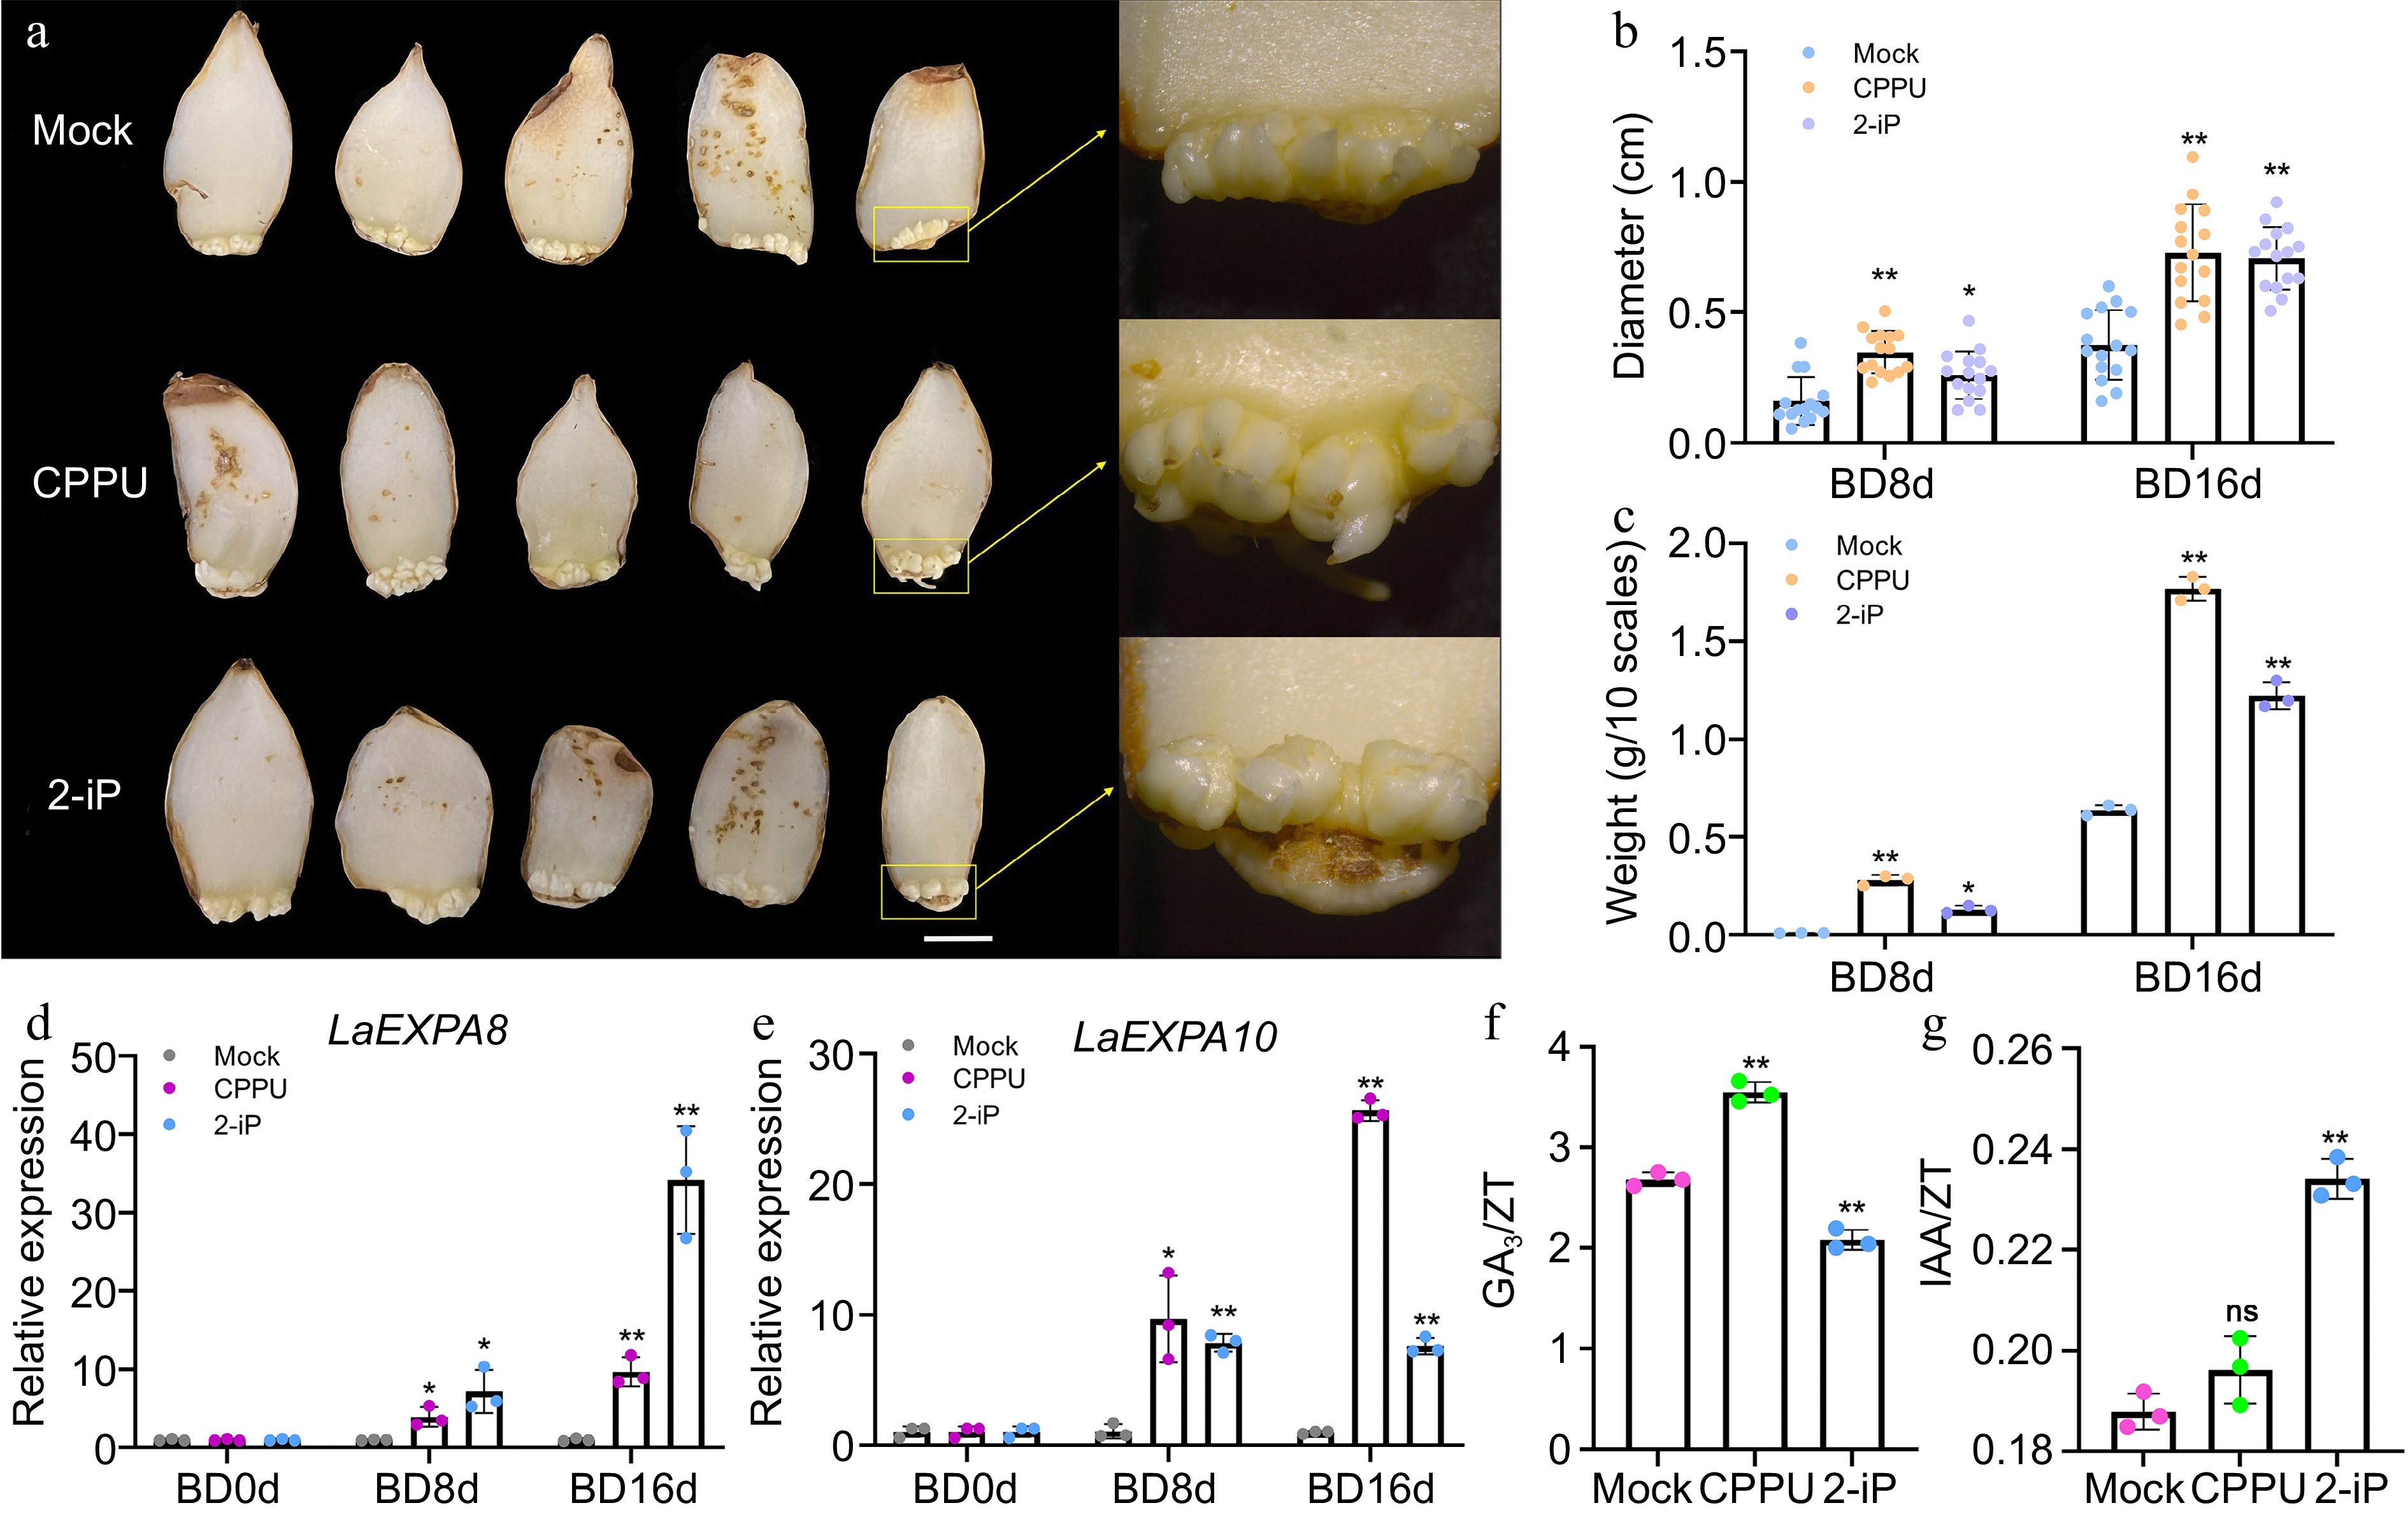
Figure 5.
10 mg/L CPPU and 0.1 mg/L 2-iP treatments promote bulblet development. (a) Morphological analysis of the development of the 'Matrix' bulblet under different treatments at BD16d. Bar = 1 cm. (b) Diameter and (c) weight of bulblets in the control, CPPU, and 2-iP during bulblet development. Each dot on panel (b) represent the average diameter of bulblets generated by a single maternal scale, n = 15. Each dot on panel (c) represents the weight of bulblets produced from 10 maternal scales. Relative expression of (d) LaEXPA8 and (e) LaEXPA10 in the control, CPPU, and 2-iP treatment groups during bulblet development. The control group for each time point was set as 1, and the treatment group was compared to its respective control group. (f)–(g) Endogenous GA3/ZT and IAA/ZT in the control, CPPU, and 2-iP treatments at BD16d during bulblet development. Data are presented as the means of three biological replicates with SD error bars (Student's t-test; *: p < 0.05; **: p < 0.01; ns: no significance).
-
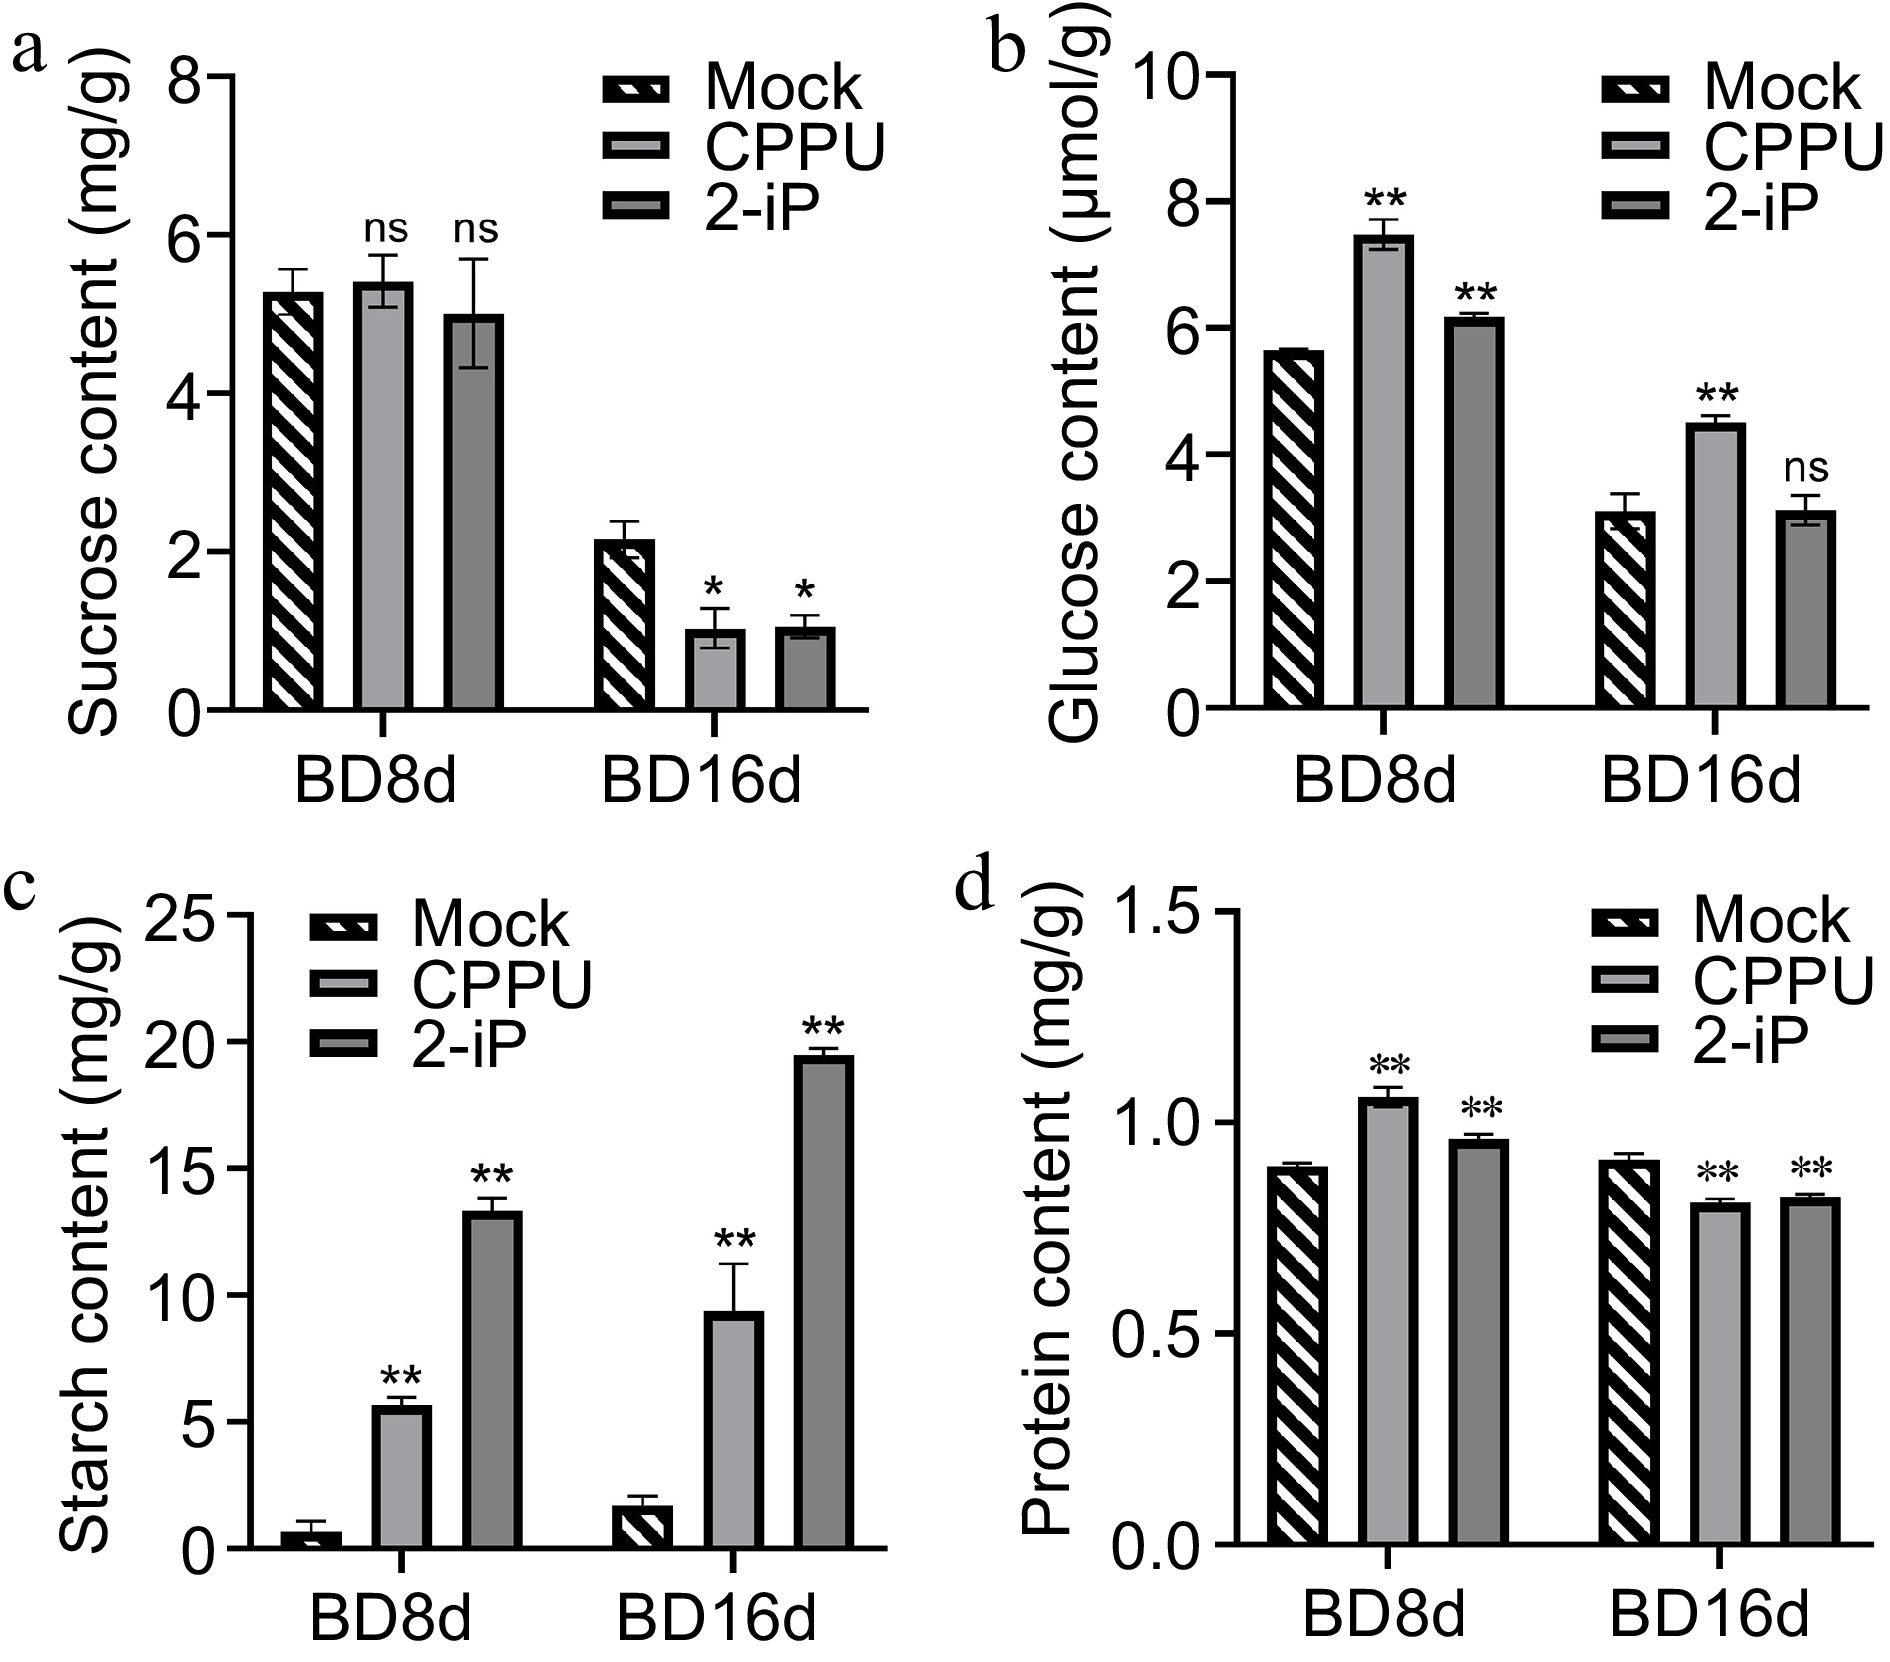
Figure 6.
Endogenous sucrose, glucose, starch, and protein content in the control, 10 mg/L CPPU, and 0.1 mg/L 2-iP treatments at BD16d. Data are presented as the means of three biological replicates with SD error bars (Student's t-test; *: p < 0.05, **: p < 0.01; ns: no significance).
-
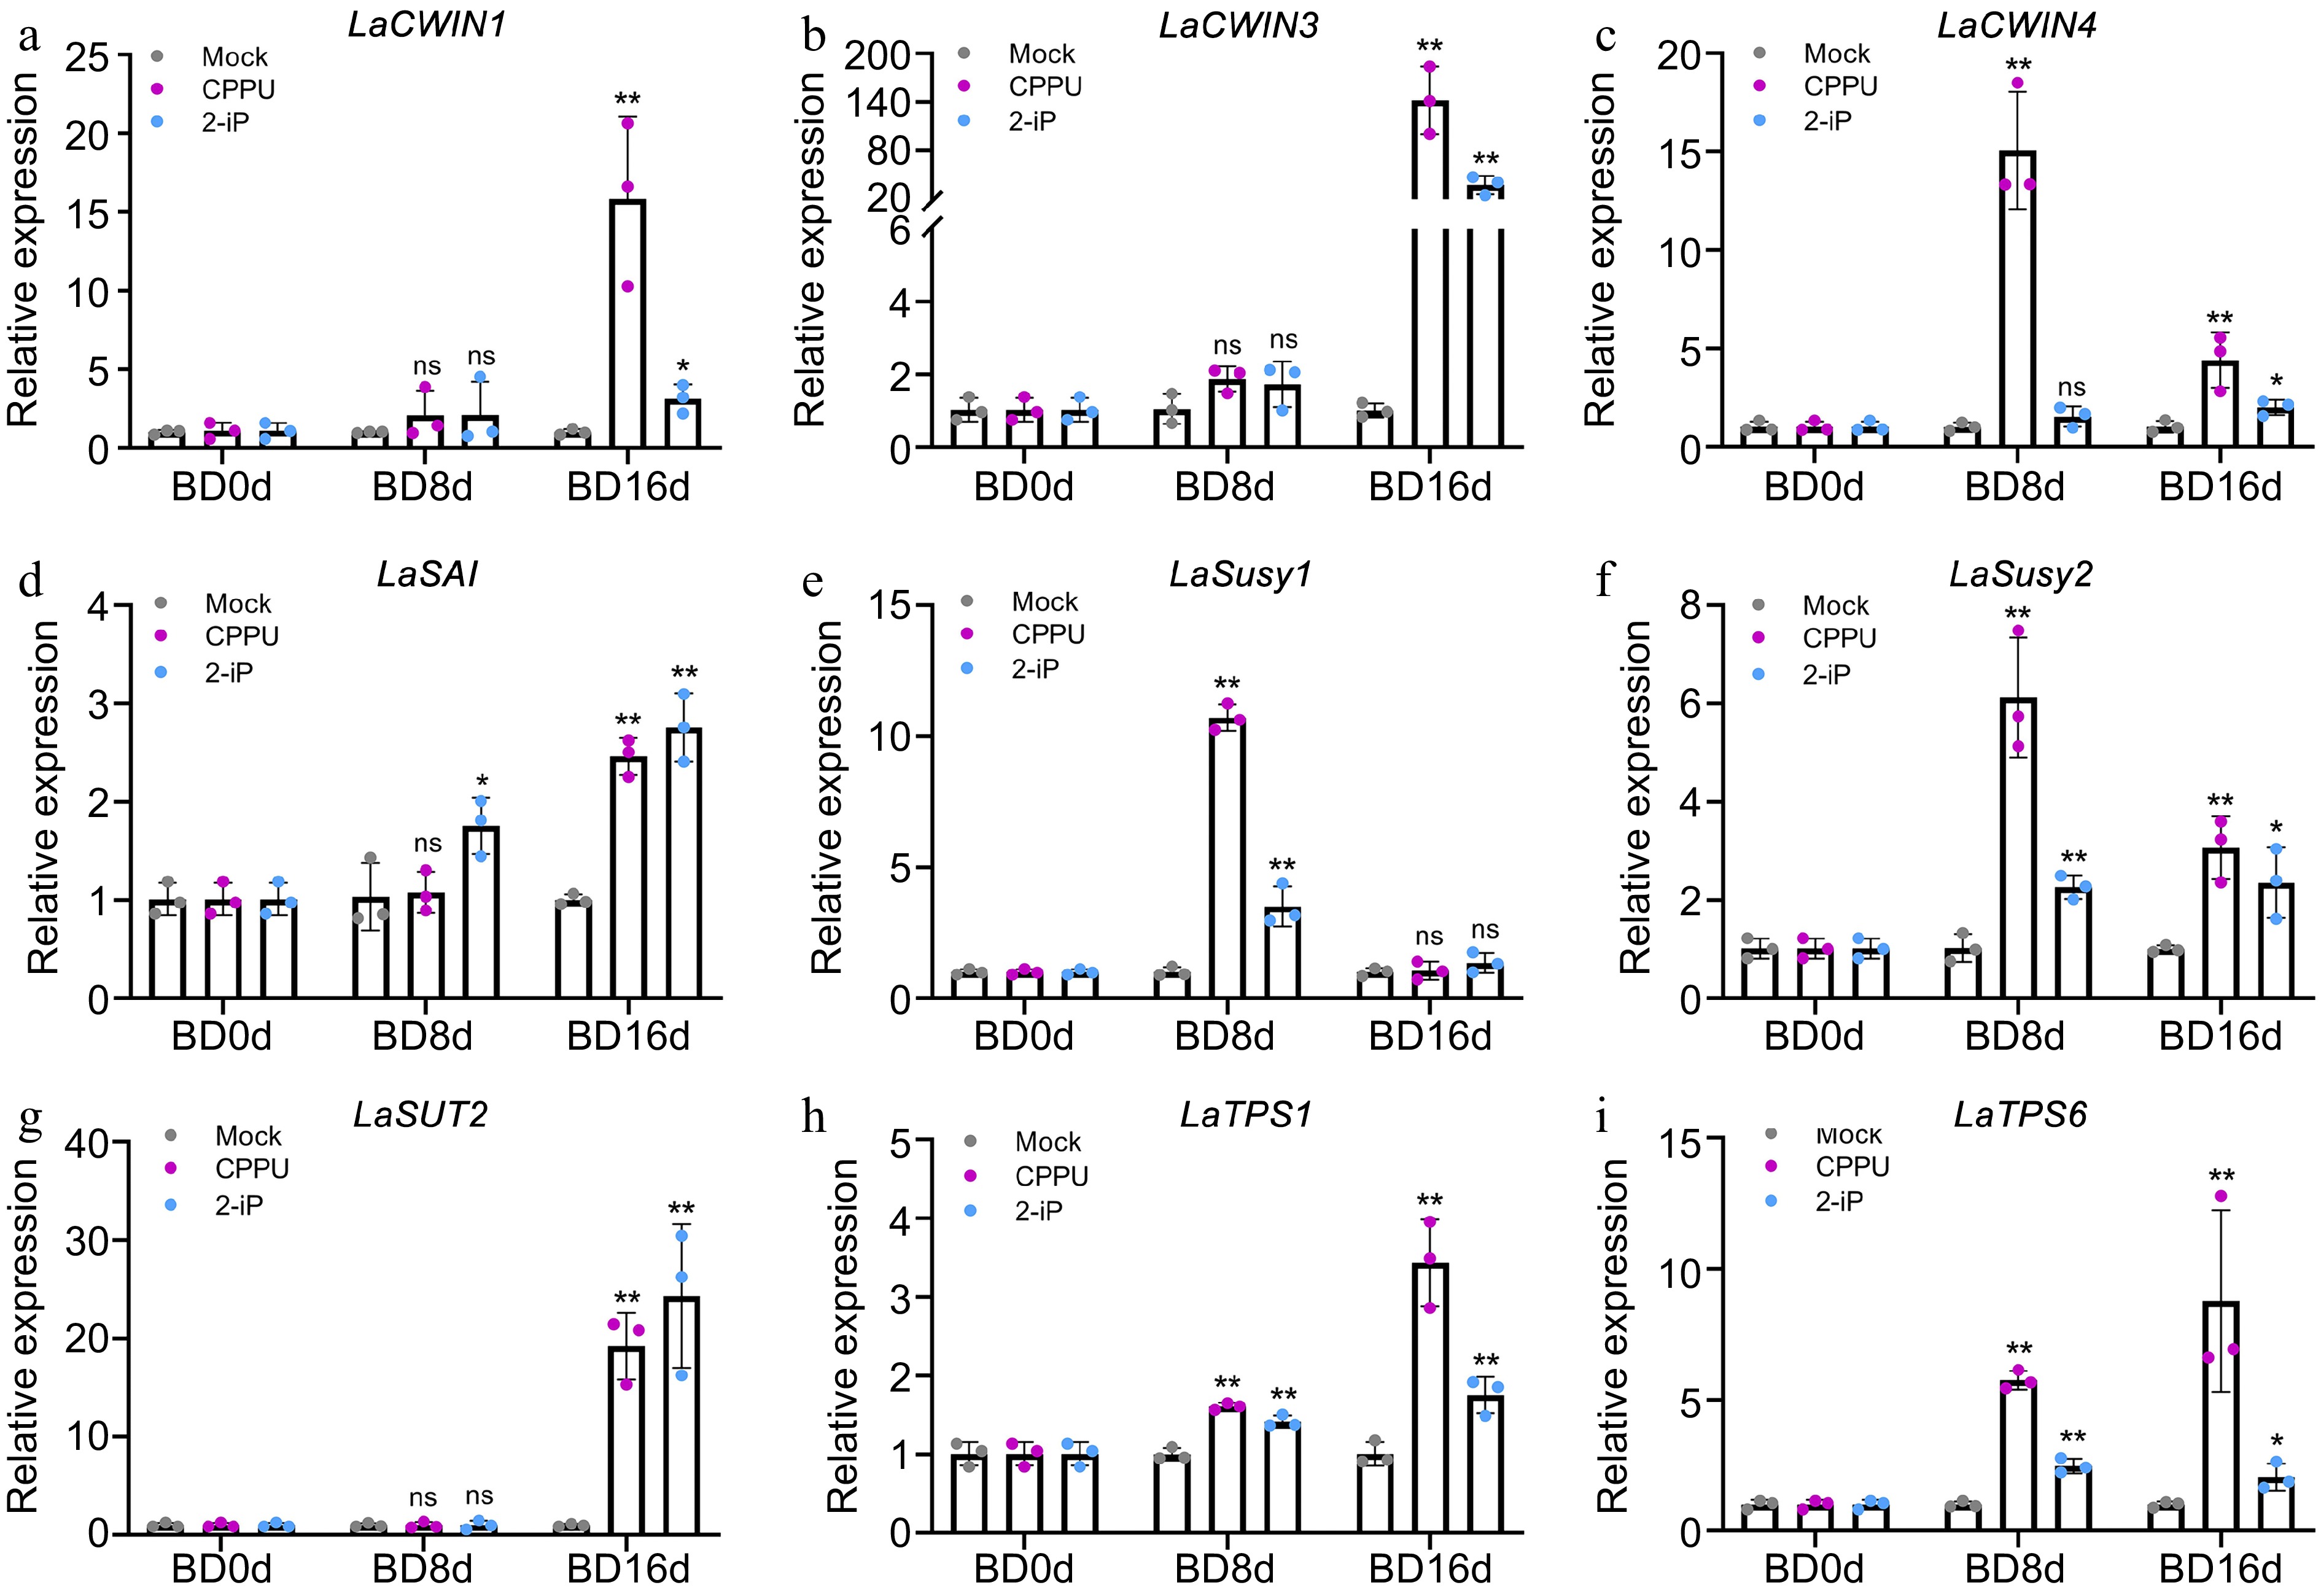
Figure 7.
Expression patterns of sugar metabolism-related genes in the control, 10 mg/L CPPU, and 0.1 mg/L 2-iP treatments during bulblet development. The control group for each time point was set as 1, and the treatment group was compared to its respective control group. Data are presented as the means of three biological replicates with SD error bars (Student's t-test; *: p < 0.05, **: p < 0.01; ns: no significance).
-
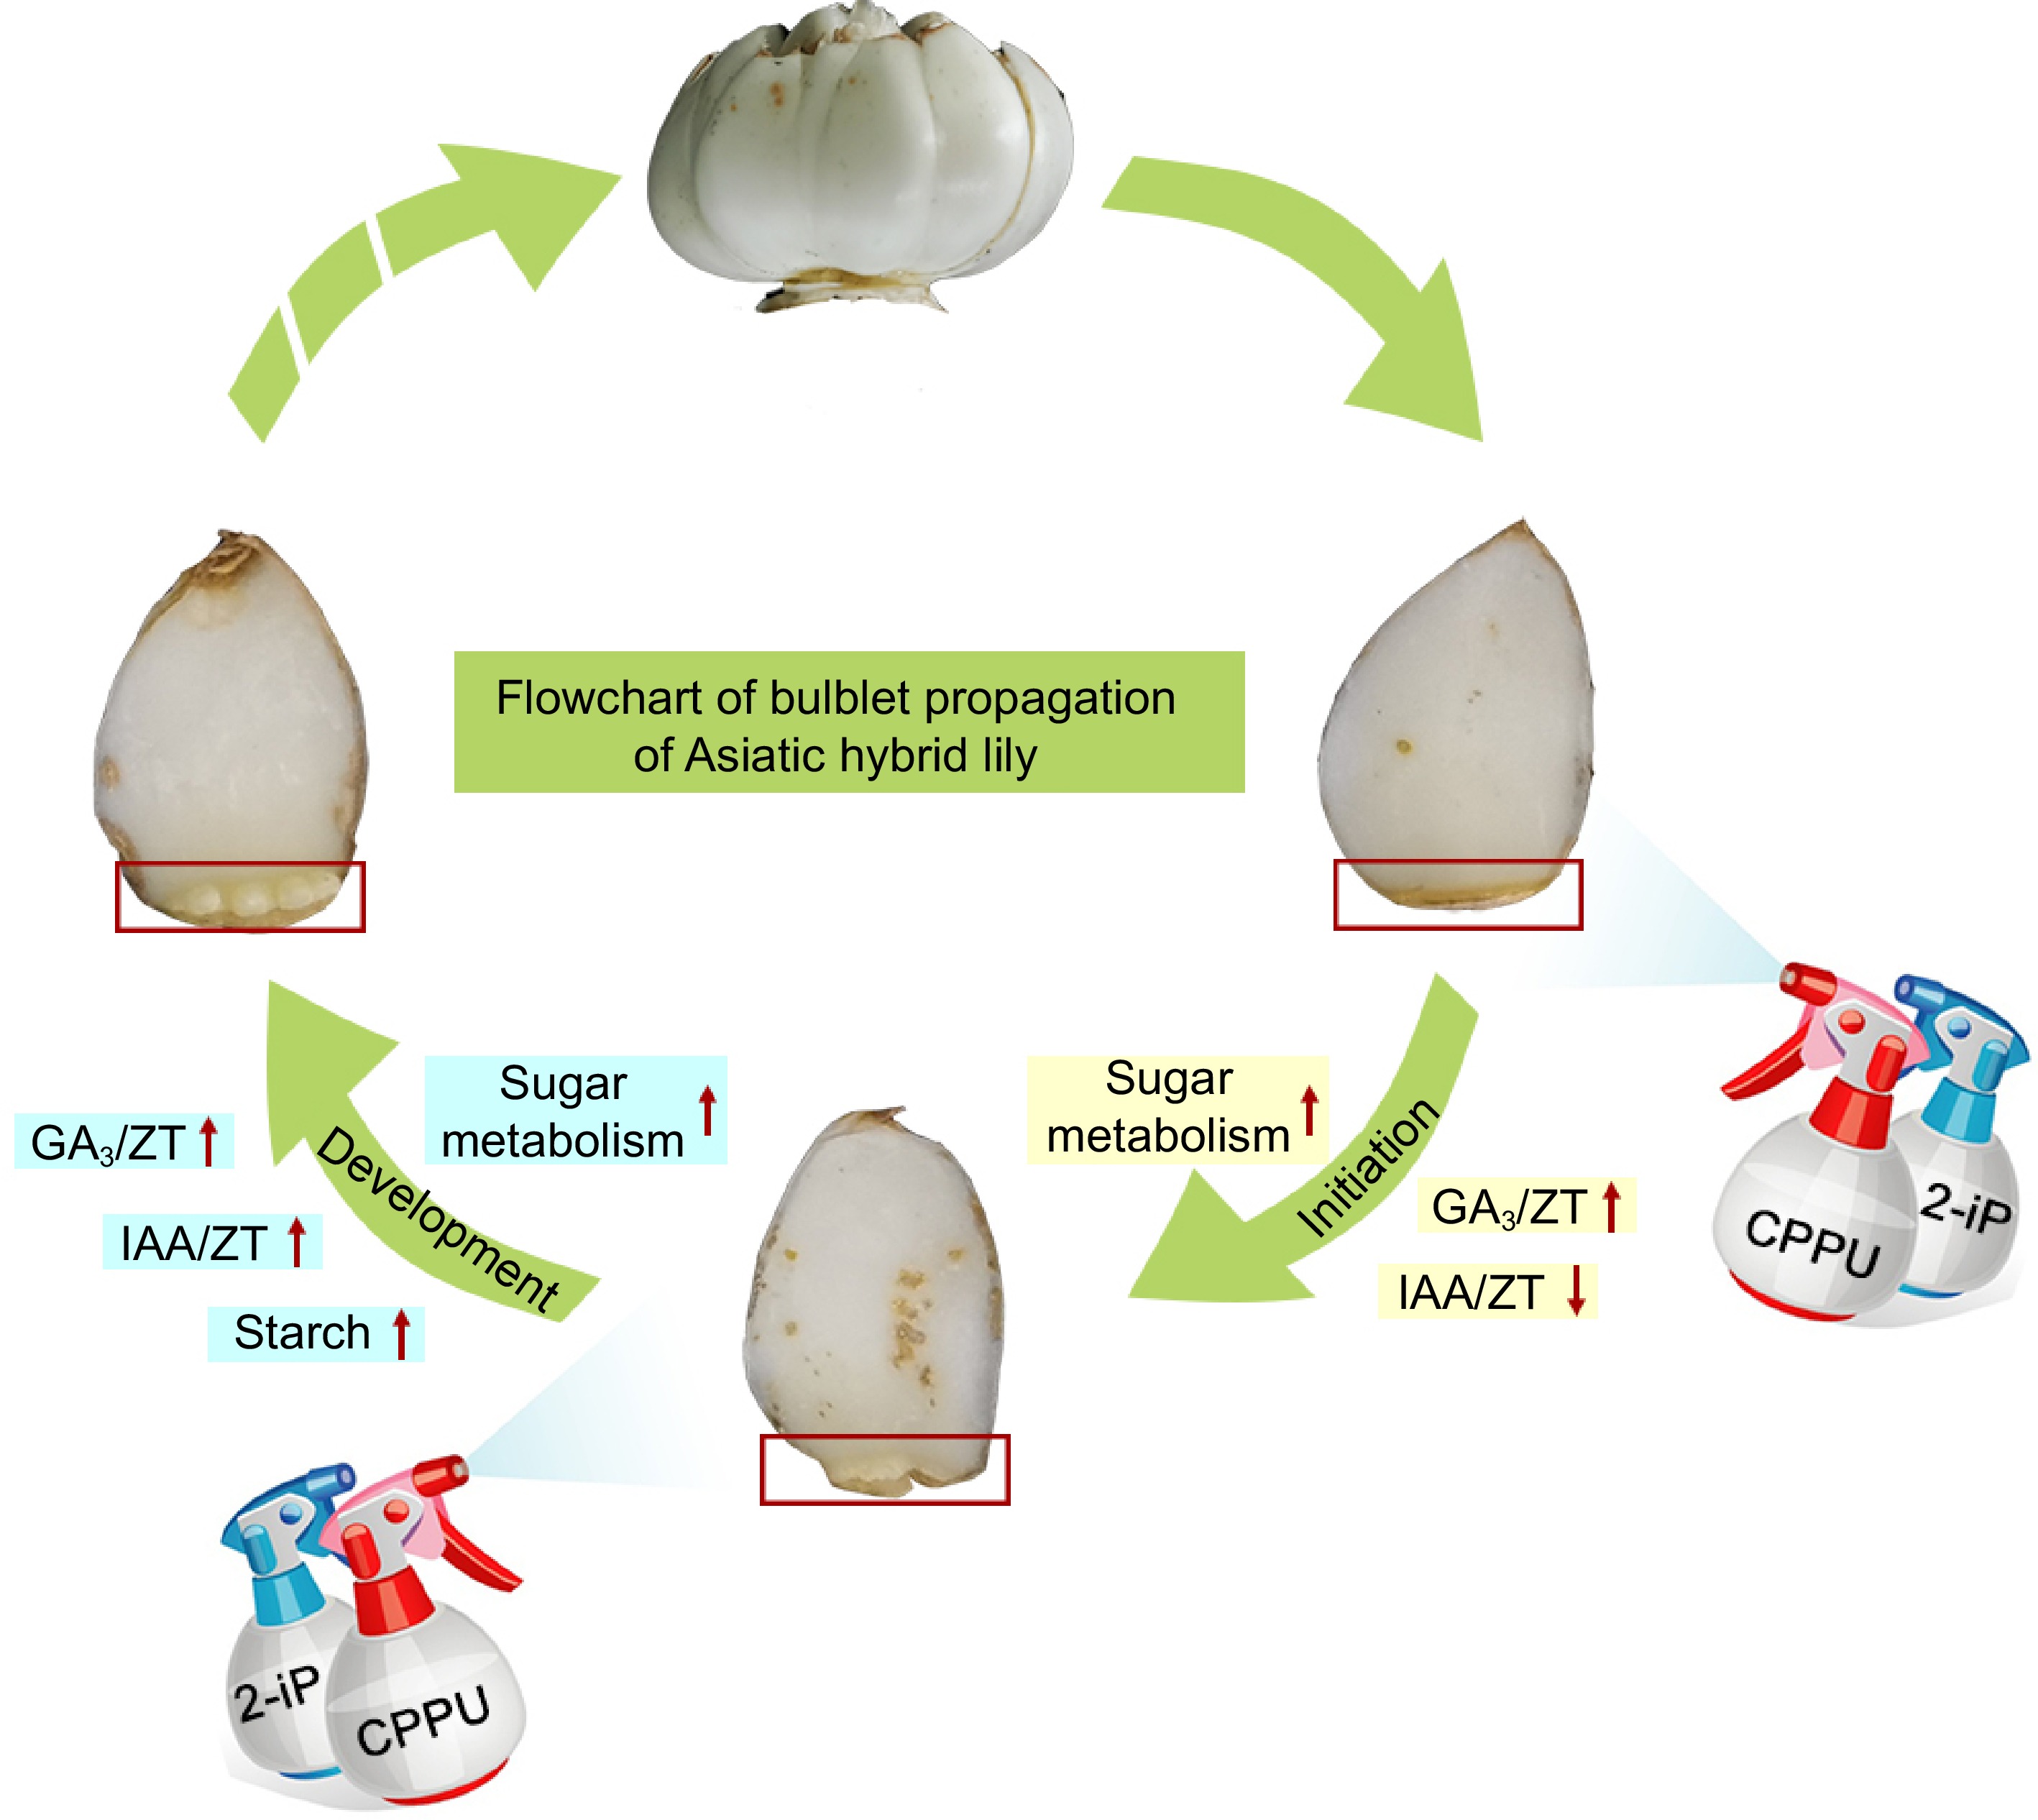
Figure 8.
Schematic model showing the promotion of bulb formation by CPPU and 2-iP in Asiatic hybrid lily.
Figures
(8)
Tables
(0)