-
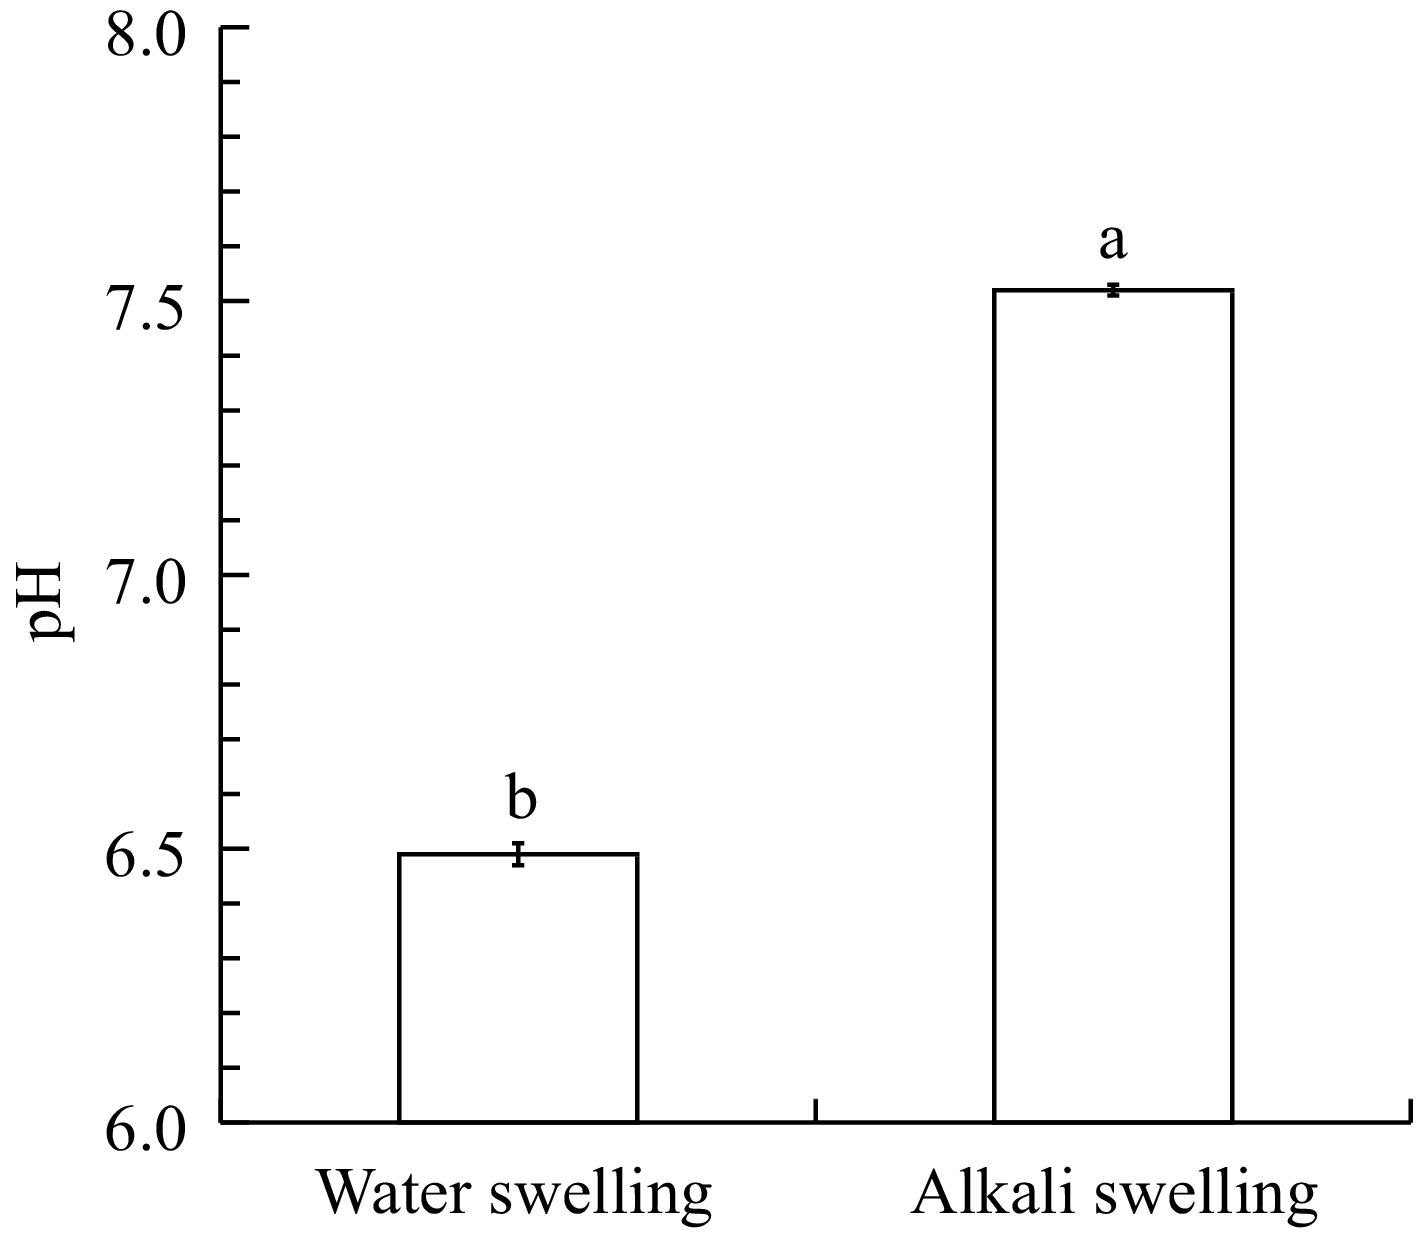
Figure 1.
Effect of water and alkali swelling on the pH of dried Abalone muscle. Each value represents the mean ± SD, n = 3. Different superscripts in the same column indicate significant differences (p < 0.05).
-
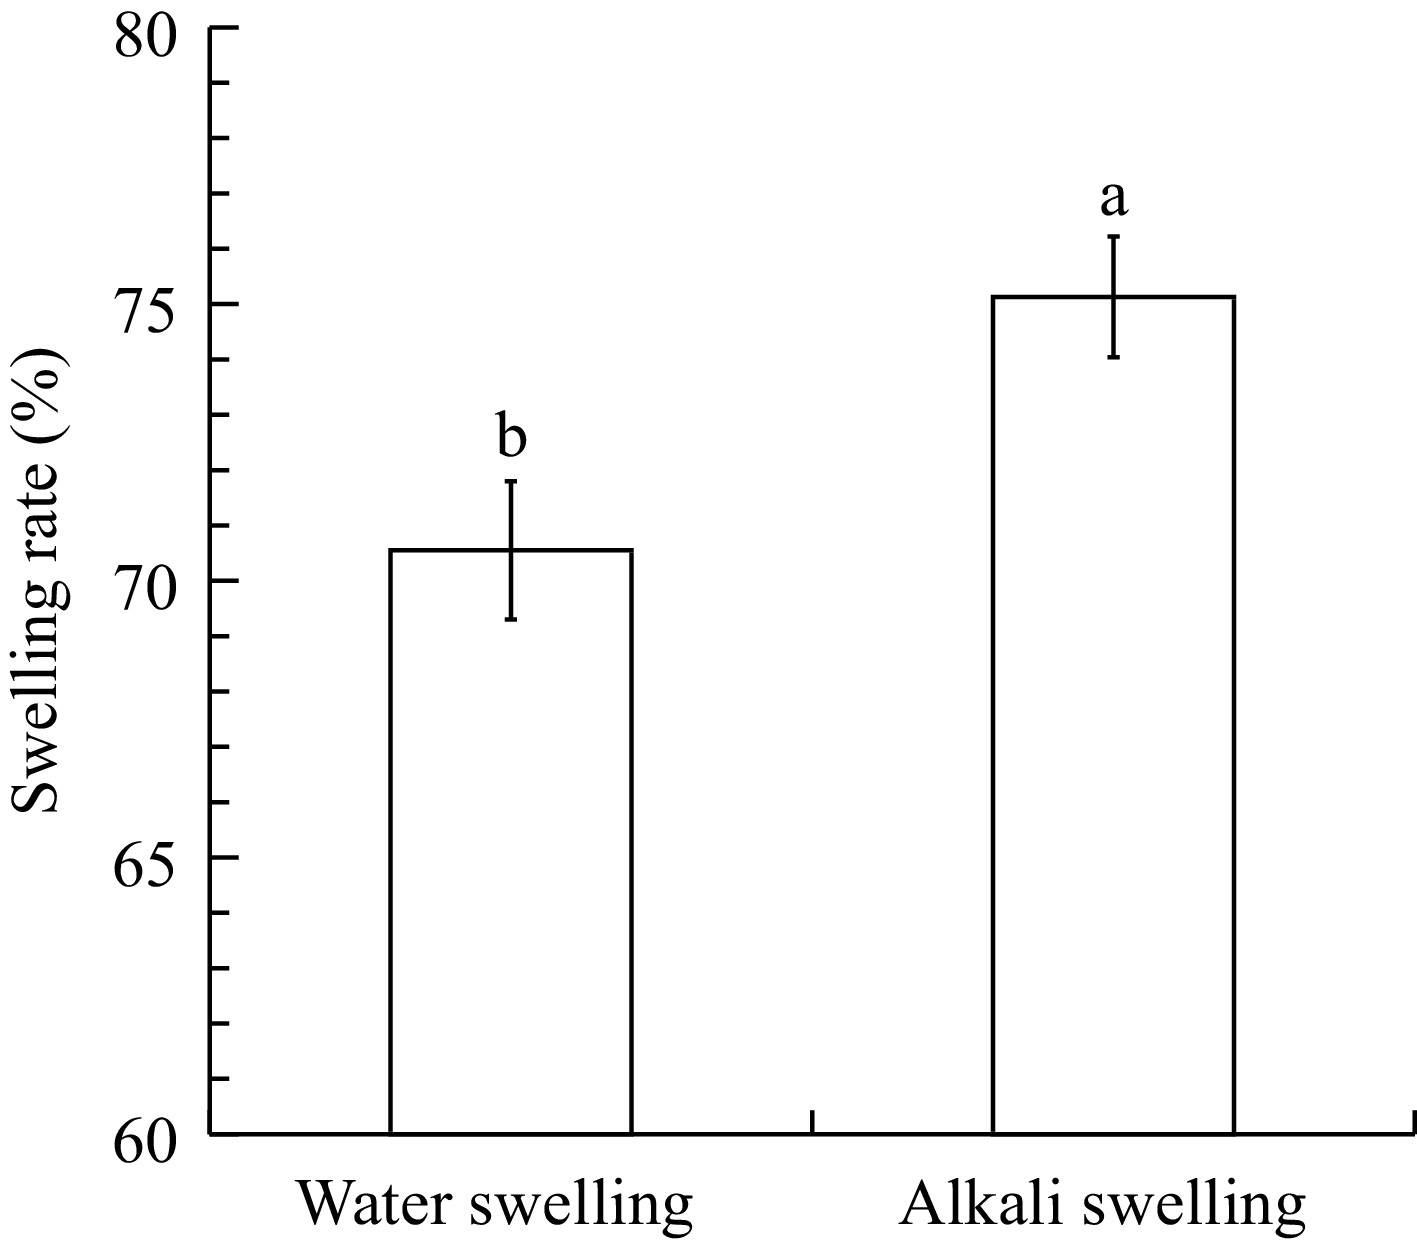
Figure 2.
Effect of water and alkali swelling on the swelling rate of dried Abalone muscle. Each value represents the mean ± SD, n = 3. Different superscripts in the same column indicate significant differences (p < 0.05).
-
Swelling method Centrifugal loss (%) Cooking loss (%) Water swelling 5.15 ± 0.38b 12.26 ± 0.42b Alkali swelling 7.29 ± 0.03a 15.30 ± 0.88a Each value represents the mean ± SD, n = 3. Different superscripts in the same column indicate significant differences (p < 0.05). Table 1.
Effect of water and alkali swelling on the centrifugal loss and cooking loss of dried Abalone muscle.
-
Swelling method Hardness (N) Springiness Cohesiveness Chewiness (N.mm) Shear force (N) Water swelling 69.23 ± 0.22b 0.926 ± 0.005a 0.830 ± 0.018b 51.83 ± 0.44d 32.40 ± 0.34a Alkali swelling 78.82 ± 0.35a 0.902 ± 0.008b 0.886 ± 0.022a 64.81 ± 0.25a 35.31 ± 0.21b Each value represents the mean ± SD, n = 3. Different superscripts in the same column indicate significant differences (p < 0.05). Table 2.
Effect of water and alkali swelling on the texture properties and shear force of dried Abalone muscle.
-
Color Water swelling Alkali swelling L* 60.67 ± 0.36b 69.47 ± 0.43a a* 1.25 ± 0.34b 3.17 ± 0.18a b* 19.41 ± 0.34b 21.37 ± 0.23a Each value represents the mean ± SD, n = 3. Different superscripts in the same column indicate significant differences (p < 0.05). Table 3.
Effect of water and alkali swelling on the color of dried Abalone muscle.
-
Swelling method Initial relaxation time (ms) Peak ratio (%) T2b T21 T22 P2b P21 P22 Water swelling 1.65 ± 0.17a 57.23 ± 3.63b 627.00 ± 54.09b 0.93 ± 0.09a 80.03 ± 1.07a 19.22 ± 0.78b Alkali swelling 1.73 ± 0.13a 97.92 ± 5.27a 907.86 ± 51.20a 0.95 ± 0.08a 75.65 ± 1.33b 24.21 ± 0.90a Each value represents the mean ± SD, n = 3. Different superscripts in the same column indicate significant differences (p < 0.05). Table 4.
Effect of water and alkali swelling on the initial relaxation time (ms) and peak ratio (%) of dried Abalone muscle.
Figures
(2)
Tables
(4)