-

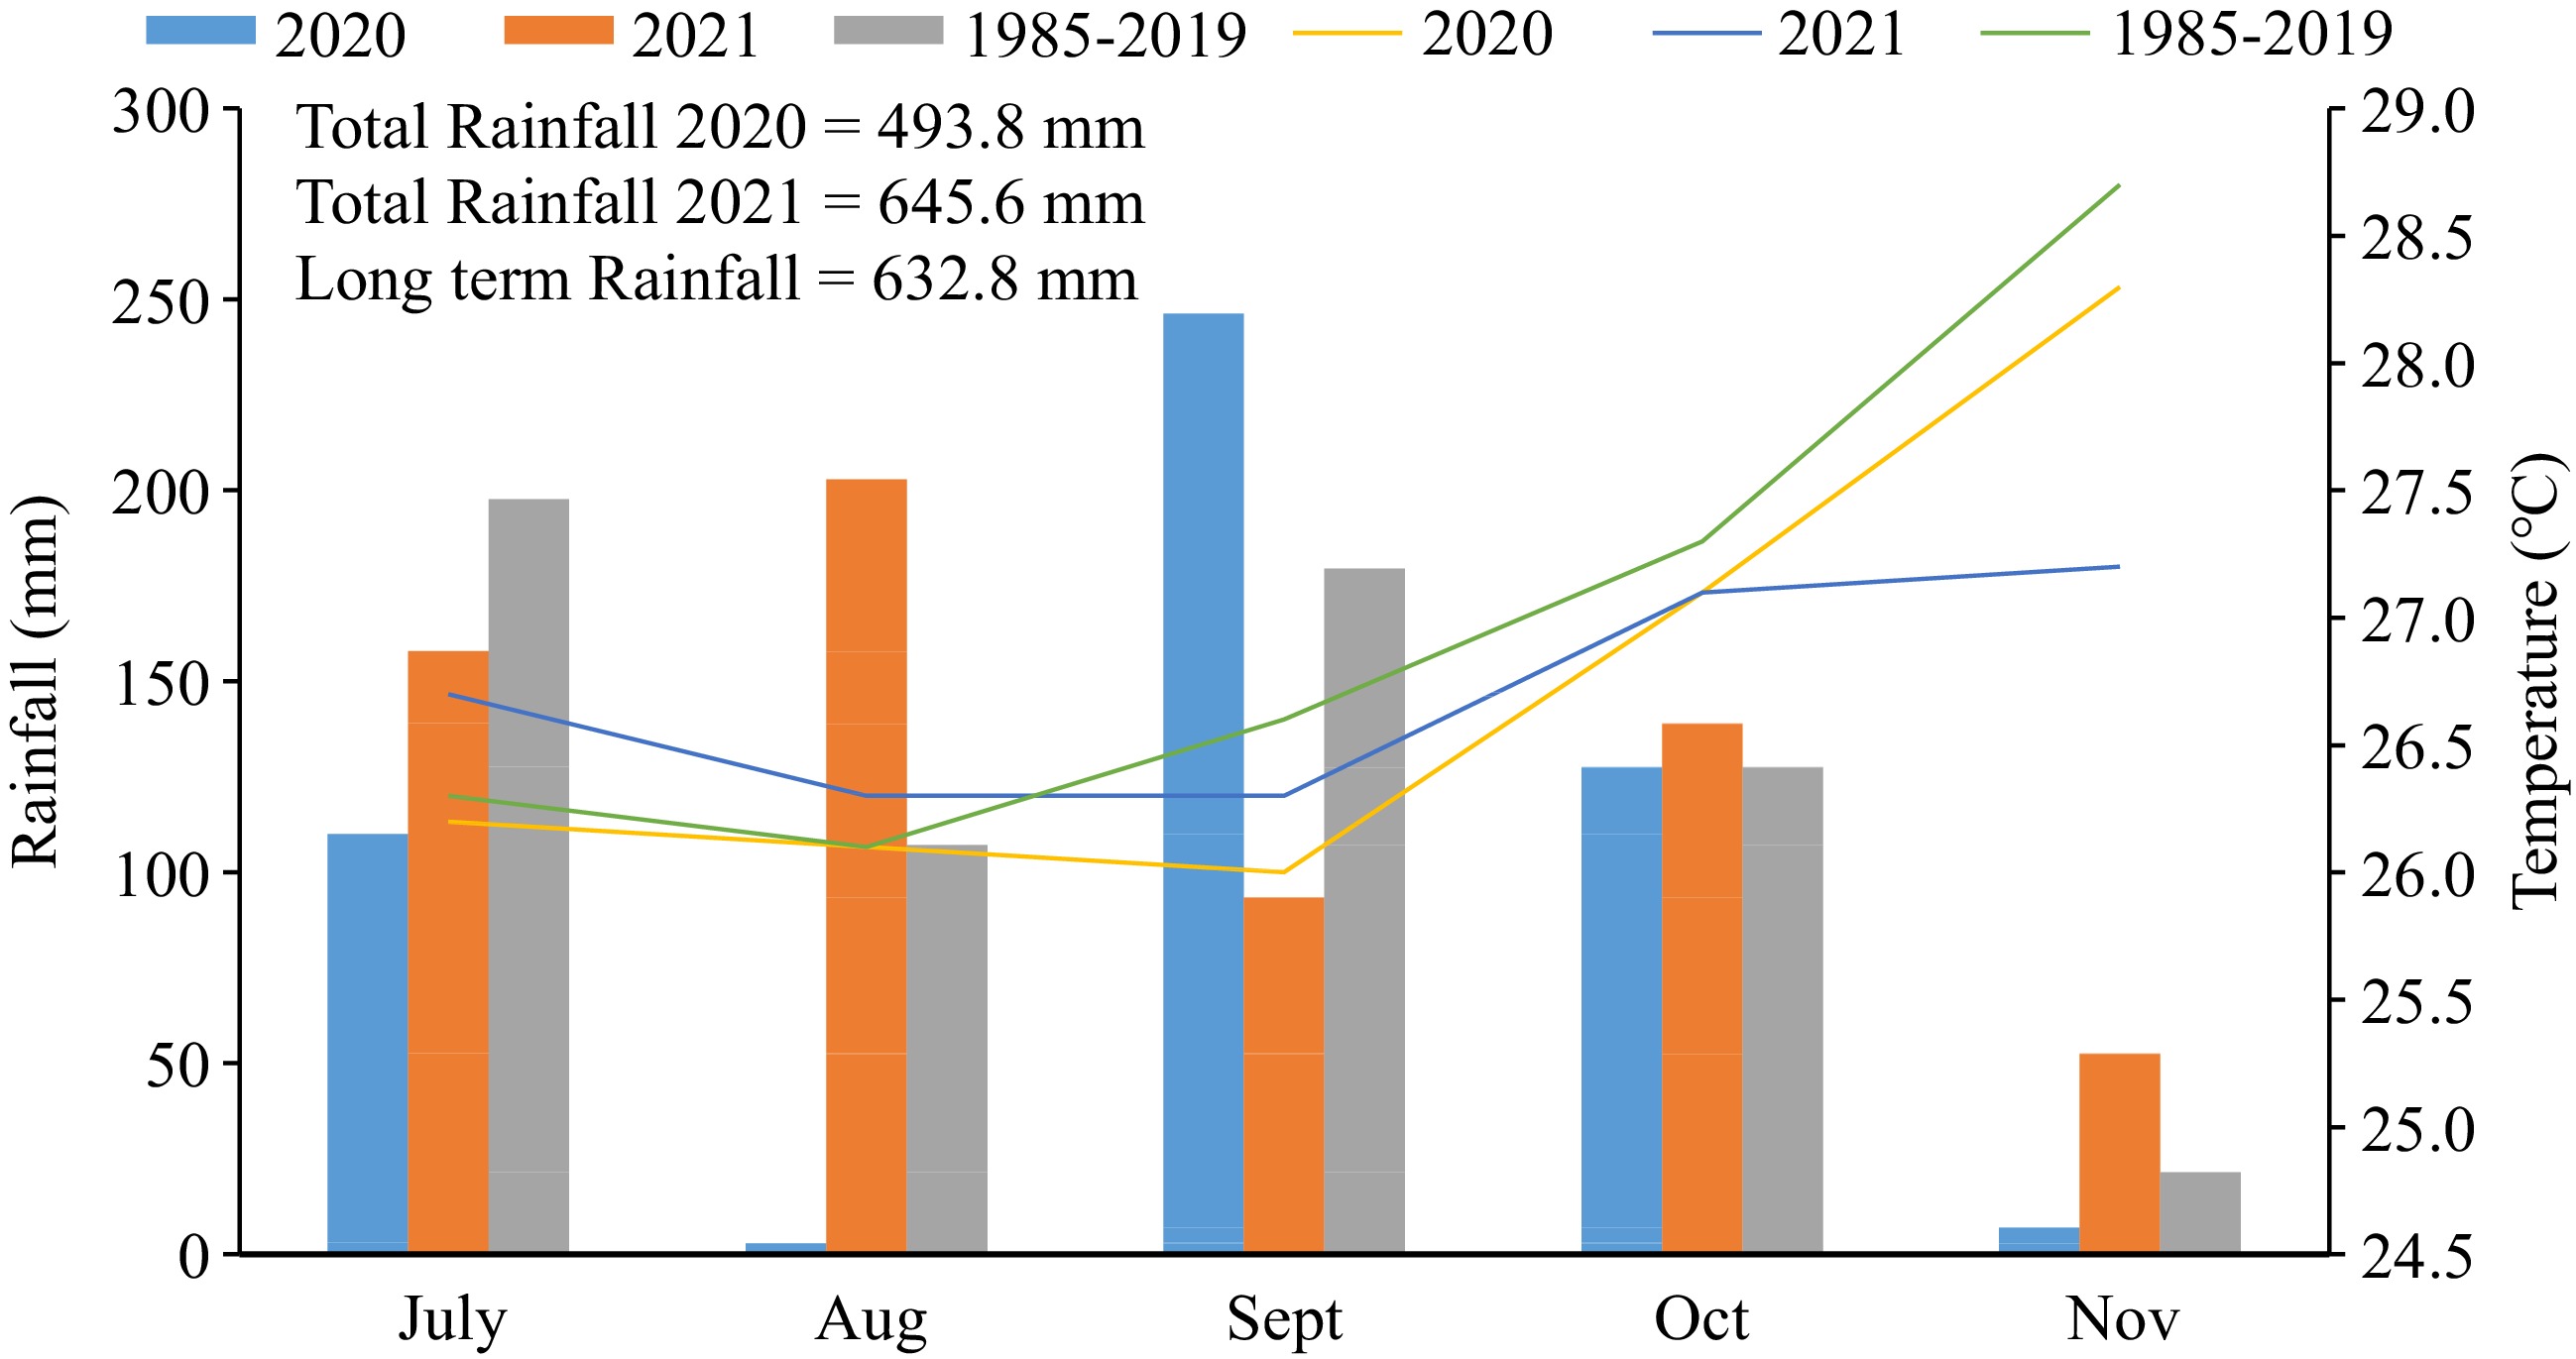
Figure 1.
Monthly rainfall and mean monthly temperature during the late cropping season (July–Nov.) of 2020, 2021 and long-term period (1985–2019). Source: Department of Agro Meteorology and Water Management Station, FUNAAB.
-

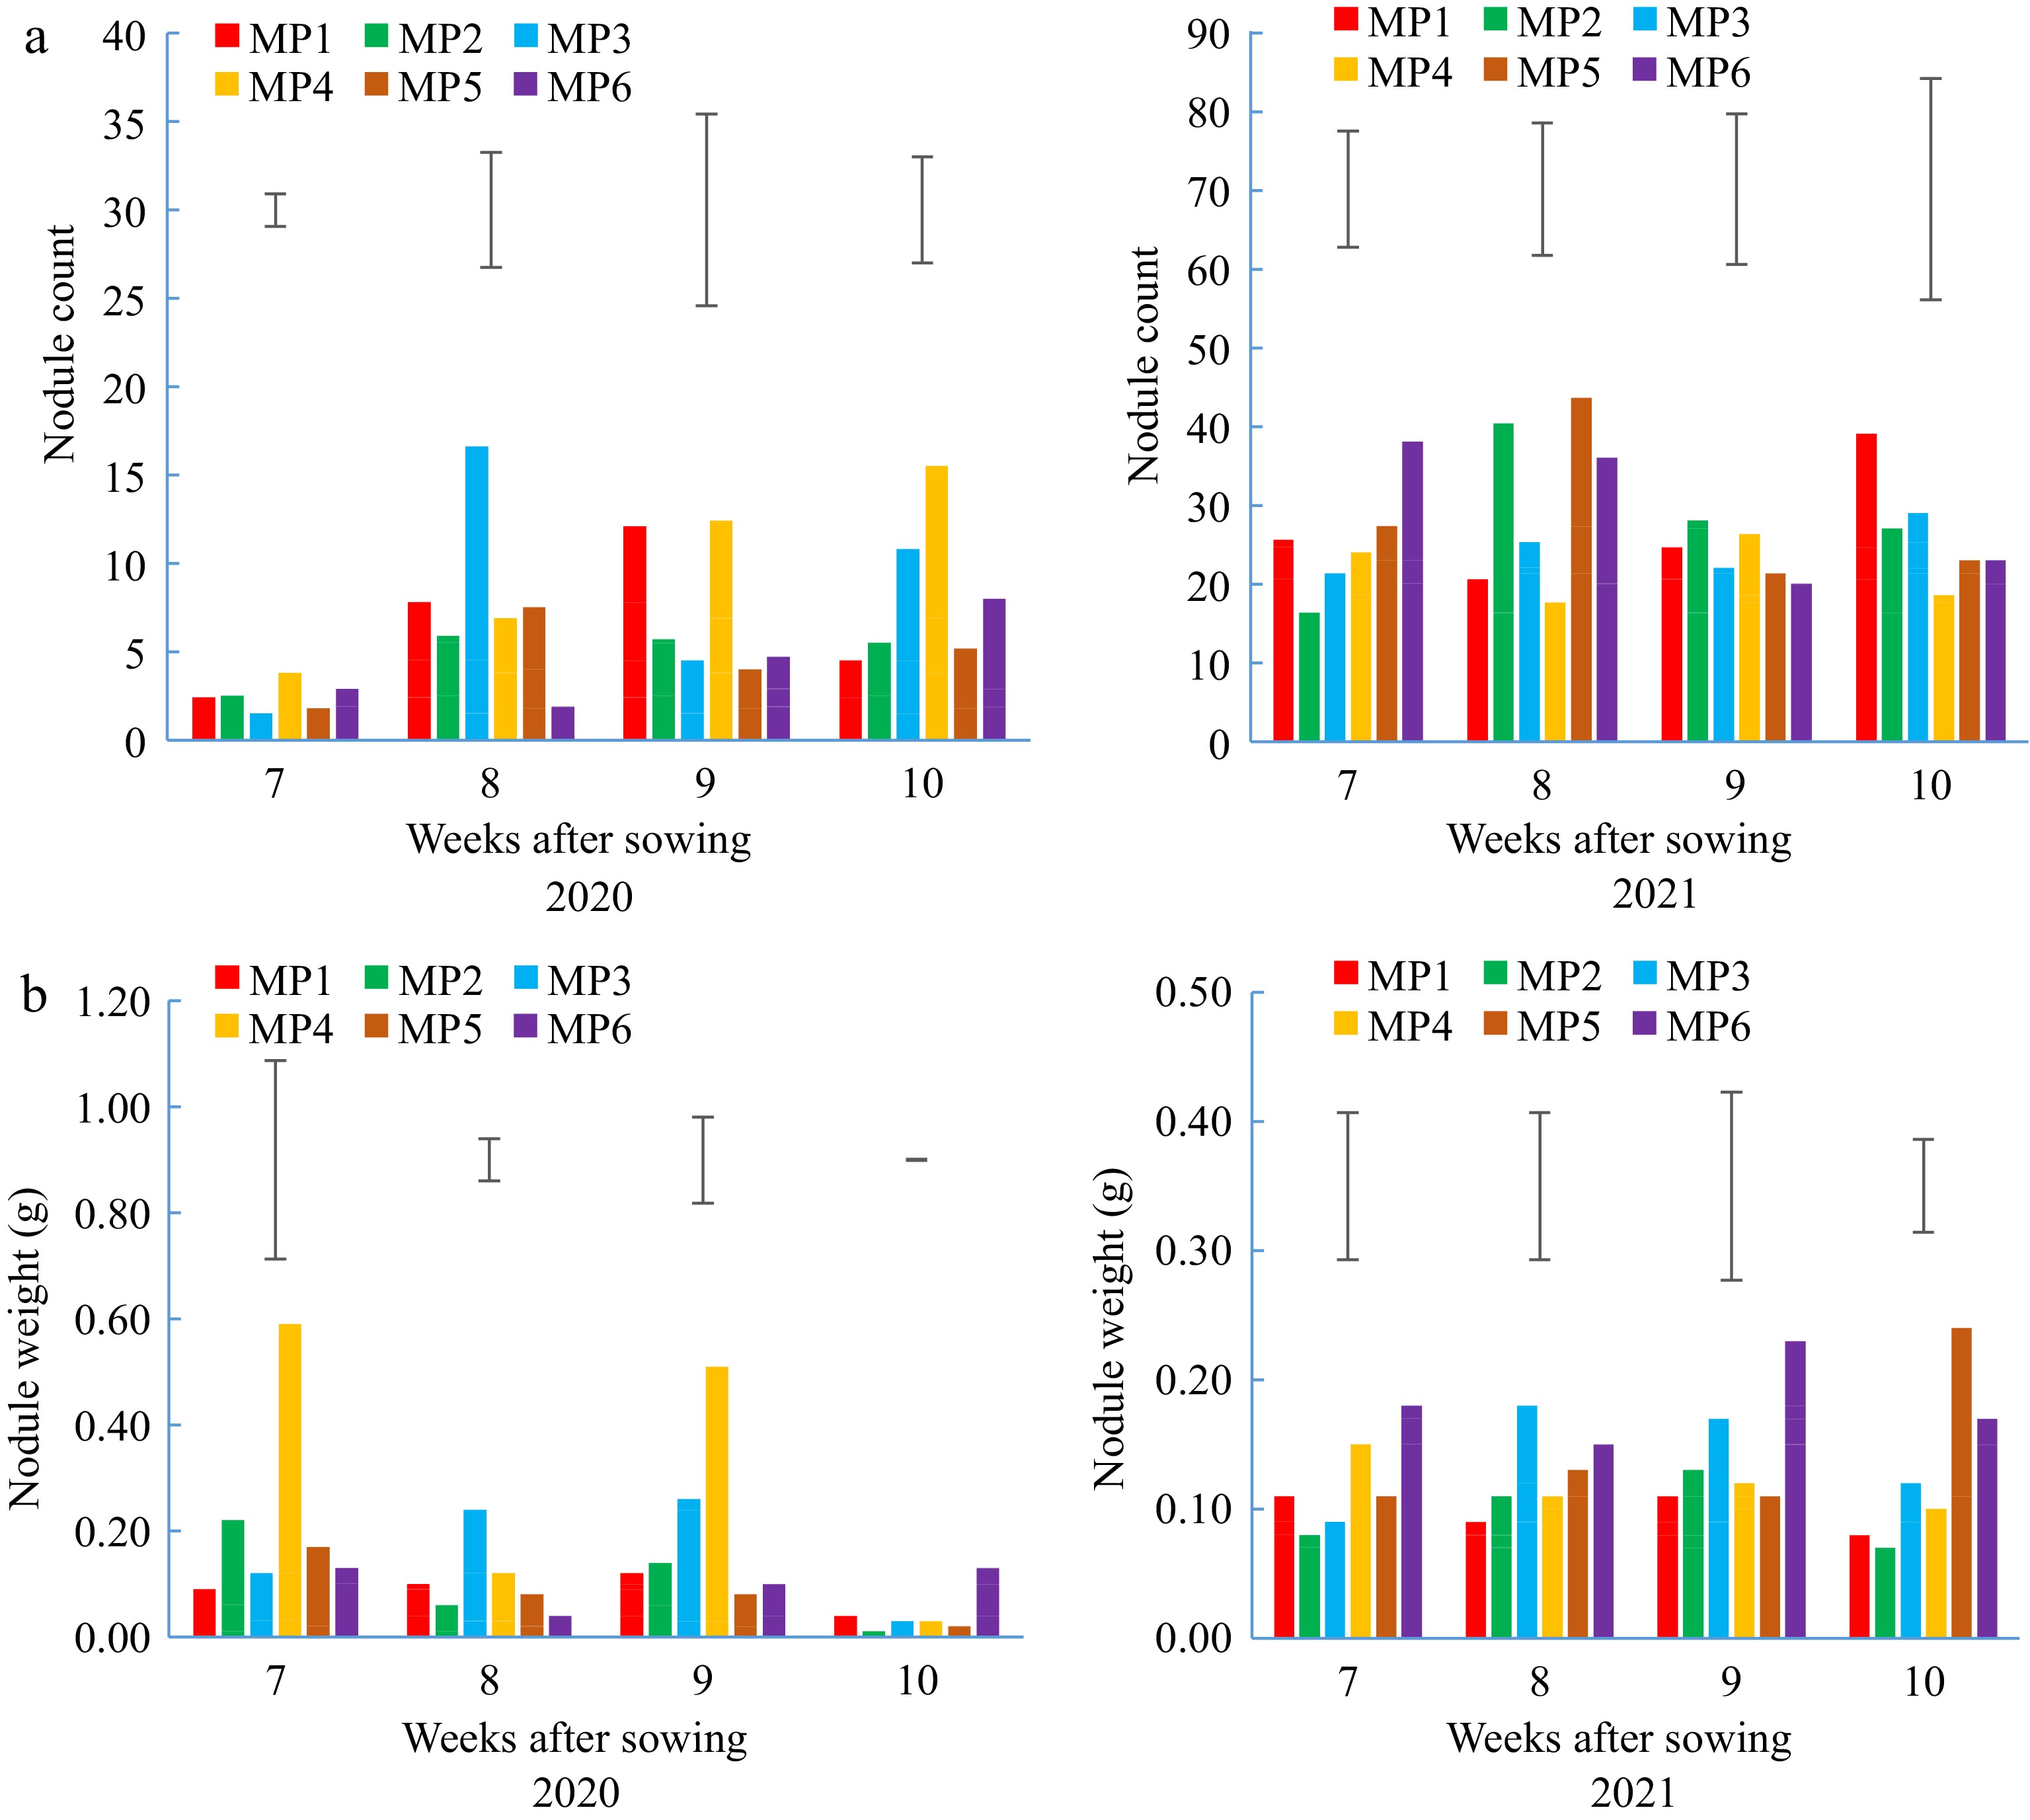
Figure 2.
(a) Nodule count and (b) nodule weight of soybean in 2020 and 2021; MP1, Control; MP2 NoduMax; MP3, Organic fertilizer; MP4, Nodumax and Organic fertilizer; MP5, Conventional system; MP6, Nodumax and Conventional system at 7, 8, 9 and 10 weeks after sowing, WAS. Capped vertical lines represent SED (df + 10).
-
Parameters Conventional plot Organic plot 2020 2021 2020 2021 Physical properties Sand (%) 88.3 85.4 87.7 79.2 Silt (%) 11.0 11.4 10.9 17.7 Clay (%) 0.7 3.2 1.4 3.1 Textural class LS LS LS LS Chemical properties pH 7.25 7.55 7.34 6.98 N (g/kg) 0.60 0.61 0.62 0.49 OM (g/kg) 12.07 12.27 12.47 9.85 P (mg/kg) 44.81 39.82 29.59 48.87 K (mg/kg) 0.25 0.84 0.27 0.83 Ca (mg/kg) 671.44 905.18 631.62 682.73 Mg (mg/kg) 410.84 258.14 410.11 357.28 Na (mg/kg) 99.67 39.96 90.01 48.79 Mn (mg/kg) 4.20 3.07 4.70 4.55 Fe (mg/kg) 13.60 7.56 18.80 12.65 Zn (mg/kg) 6.80 9.75 9.70 8.33 Table 1.
Pre-planting physical and chemical properties of soil in 2020 and 2021
-
Parameters Year 2020 2021 N (g/kg) 12.30 10.30 P (g/kg) 3.40 2.90 K(g/kg) 2.00 3.50 Ca (cmol/kg) 1.90 1.00 Mg (cmol/kg) 1.10 0.50 Na (cmol/kg) 0.30 0.10 Mn(mg/kg) 53.70 44.80 Fe (mg/kg) 28.10 12.80 Zn (mg/kg) 10.30 11.00 Table 2.
Nutrient composition of Aleshinloye organic fertilizer Grade B (Abattoir-based) in 2020 and 2021.
-
Management
practicesNumber of days to Grain filling
periodR2 R5 R6 R7 MP1 59.00c 86.00a 99.00a 107.00ab 13.00a MP2 61.33b 89.00a 100.00b 106.33ab 11.00a MP3 60.33bc 89.67a 100.67a 107.33ab 11.00a MP4 61.00b 90.00a 102.00a 106.33b 12.00a MP5 61.00b 88.00a 98.67a 109.00ab 10.33a MP6 63.33a 90.33a 101.00a 110.00a 10.67a SE ± (df-10) 0.615 2.388 2.346 1.358 1.653 MP1 – Control, MP2 – NoduMax, MP3 – Organic fertilizer, MP4 – NoduMax + Organic fertilizer, MP5 – Conventional, MP6 – Conventional + NoduMax, R2 – Full bloom, R5 – Initial seed filling, R6 – Full Seed, R7 – Physiological maturity. Means with the same letter along the column are not significantly different according to Duncan's Multiple Range Test (DMRT) at 5% probability level. Table 3.
Effects of management practices on the phenology of soybeans in 2020.
-
Management
practicesNumber of days to Grain filling
periodR2 R5 R6 R7 MP1 59.33b 80.00c 94.33c 110.67a 13.67b MP2 61.33a 80.33c 99.67ab 112.67a 19.67a MP3 59.67b 82.00b 101.33a 111.67a 20.00a MP4 61.67a 83.33a 99.67ab 109.33a 18.00a MP5 59.33b 80.67c 97.00b 110.67a 16.33b MP6 59.67b 80.67c 97.33b 110.00a 16.67b SE ± (df 10) 0.577 0.494 1.517 1.512 1.723 MP1 – Control, MP2 – NoduMax, MP3 – Organic fertilizer, MP4 – NoduMax + Organic fertilizer, MP5 – Conventional, MP6 - Conventional + NoduMax, R2 – Full bloom, R5 – Initial seed filling, R6 – Full Seed, R7 – Physiological maturity. Means with the same letter along the column are not significantly different according to Duncan's Multiple Range Test (DMRT) at 5% probability level. Table 4.
Effects of management practices on the phenology of soybeans in 2021.
-
Management practices PHTR7 NBR NPODS NSEEDS SWT (g) PWT (g) 100SWT (g) GYD (kg/ha) MP1 54.80ab 3.33b 40.07c 68.80d 4.70c 8.47c 6.90a 846.00c MP2 52.67ab 4.77b 79.57bc 97.93bcd 7.57b 12.83bc 7.73a 1362.00b MP3 56.77a 8.43ab 138.87a 137.20a 10.90a 24.17a 8.00a 1962.00a MP4 56.33a 8.57ab 86.87abc 126.90ab 9.37a 14.97abc 7.57a 1686.00a MP5 42.70b 11.50a 102.37ab 111.33abc 9.47a 19.53ab 6.57a 1704.00a MP6 49.43ab 5.90ab 112.63ab 79.53cd 6.47b 23.47ab 8.20a 1164.00b SE ± (df-10) 5.152 2.632 21.852 14.782 0.772 4.601 1.271 138.901 MP1 – Control, MP2 – NoduMax, MP3 – Organic fertilizer, MP4 – NoduMax + Organic fertilizer, MP5 – Conventional, MP6 – Conventional + NoduMax, PHTR7 – Plant height at physiological maturity, NBR – Number of branches, NPODS – Number of pods, NSEDDS – Number of seeds, SWT – Weight of seeds, PWT – Pod weight, 100SWT (100 seed weight), GYD – Grain yield. Means with the same letter along the column are not significantly different according to Duncan's Multiple Range Test (DMRT) at 5% probability level. Table 5.
Effects of management practices on seed yield and yield attributes of soybeans in 2020.
-
Management practices PHTR7 (cm) NBR NPODS NSEEDS SWT (g) PWT (g) 100SWT (g) GYD (kg/ha) MP1 70.60a 4.47b 37.47a 166.13b 2.27c 6.33a 8.92a 754.80c MP2 72.00a 4.87ab 39.13a 212.30b 3.47abc 12.00a 8.12a 1155.40abc MP3 71.80a 4.03b 33.13a 189.53b 3.60ab 8.10a 7.37abc 1198.80ab MP4 67.87a 5.67ab 39.87a 241.47b 4.20ab 10.27a 7.59ab 1398.60ab MP5 59.27a 5.47ab 57.93a 413.93b 4.67a 9.00a 4.87b 1554.00a MP6 59.80a 7.13a 55.40a 819.57a 3.03b 9.33a 5.02b 999.03b SE ± (df-10) 5.677 1.012 12.089 182.192 0.548 3.532 1.121 182.836 MP1 – Control, MP2 – NoduMax, MP3 – Organic fertilizer, MP4 – NoduMax + Organic fertilizer, MP5 – Conventional, MP6 – Conventional + NoduMax, PHTR7 – Plant height at physiological maturity, NBR – Number of branches, NPODS – Number of pods, NSEDDS – Number of seeds, SWT – Weight of seeds, PWT – Pod weight, 100SWT (one hundred seed weight), GYD – Grain yield. Means with the same letter along the column are not significantly different according to Duncan's Multiple Range Test (DMRT) at 5% probability level. Table 6.
Effects of management practices on seed yield and yield attributes of soybeans in 2021.
Figures
(2)
Tables
(6)