-
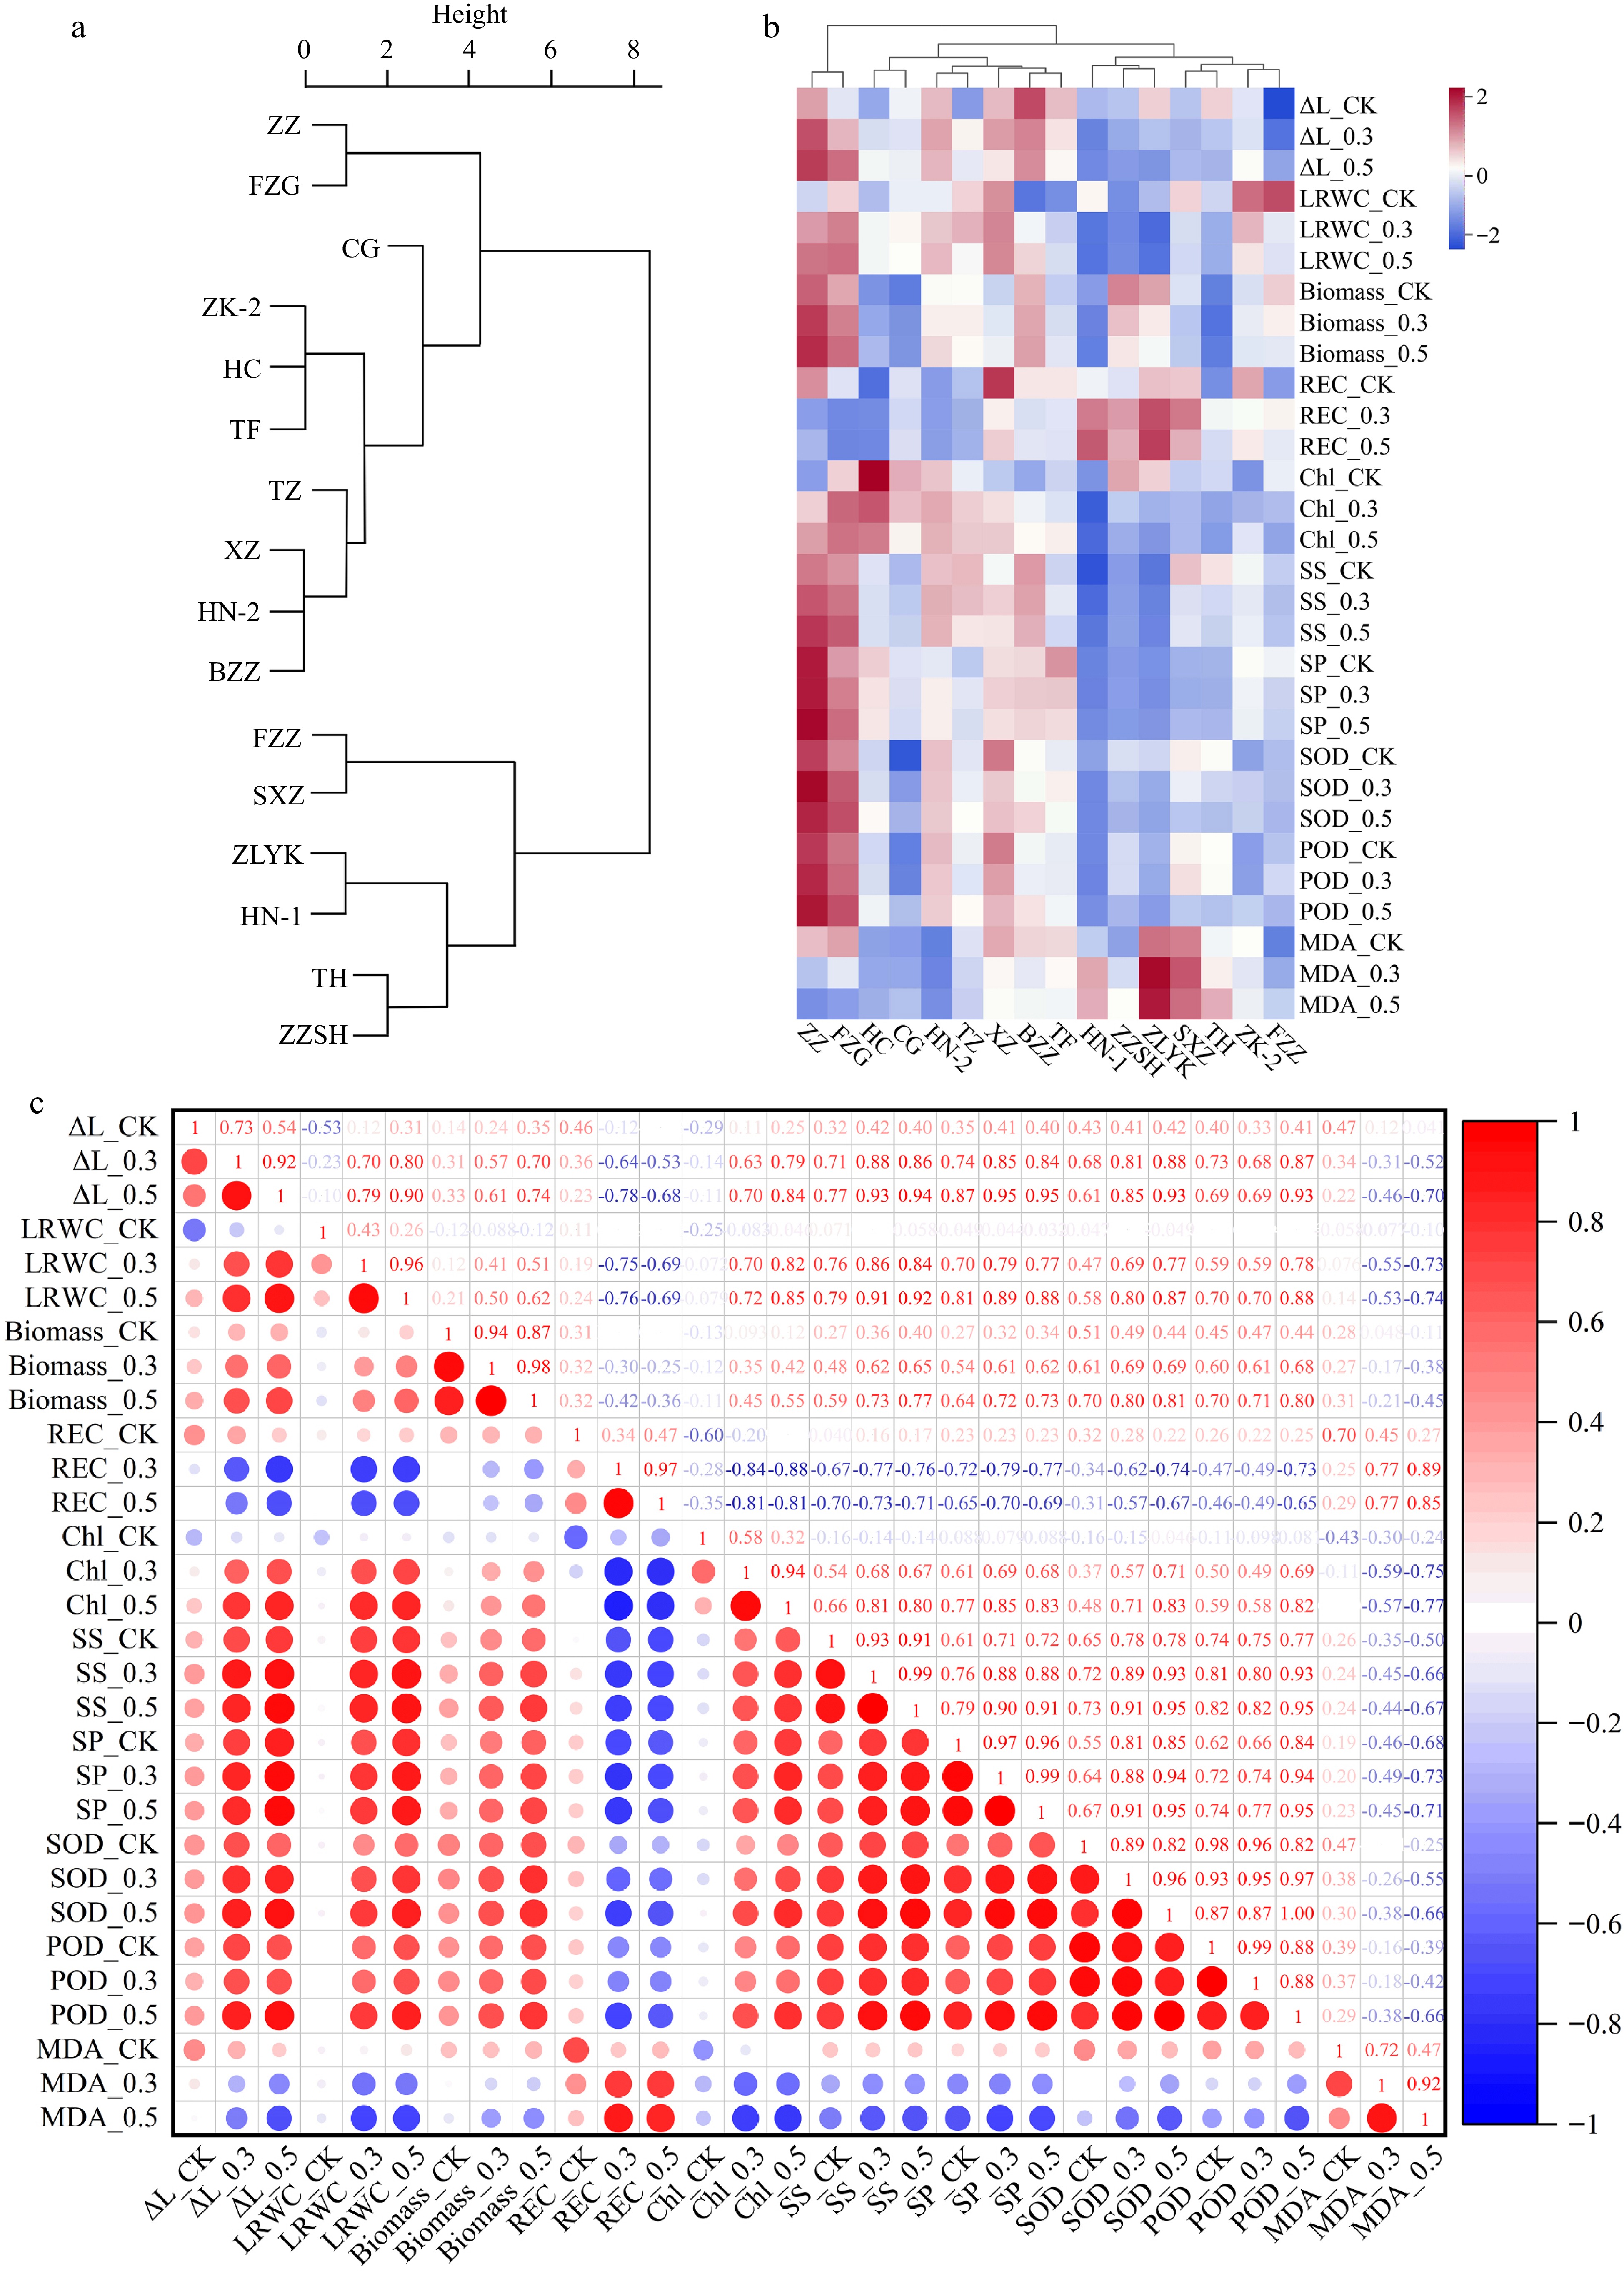
Figure 1.
Analysis of salt tolerance of 16 R. rugosa germplasms. (a) Cluster analysis of salt tolerance in R. rugosa according to salt injury index. (b) Clustering heatmap of growth and physiological indicators. (c) Correlation analysis of growth and physiological indicators.
-
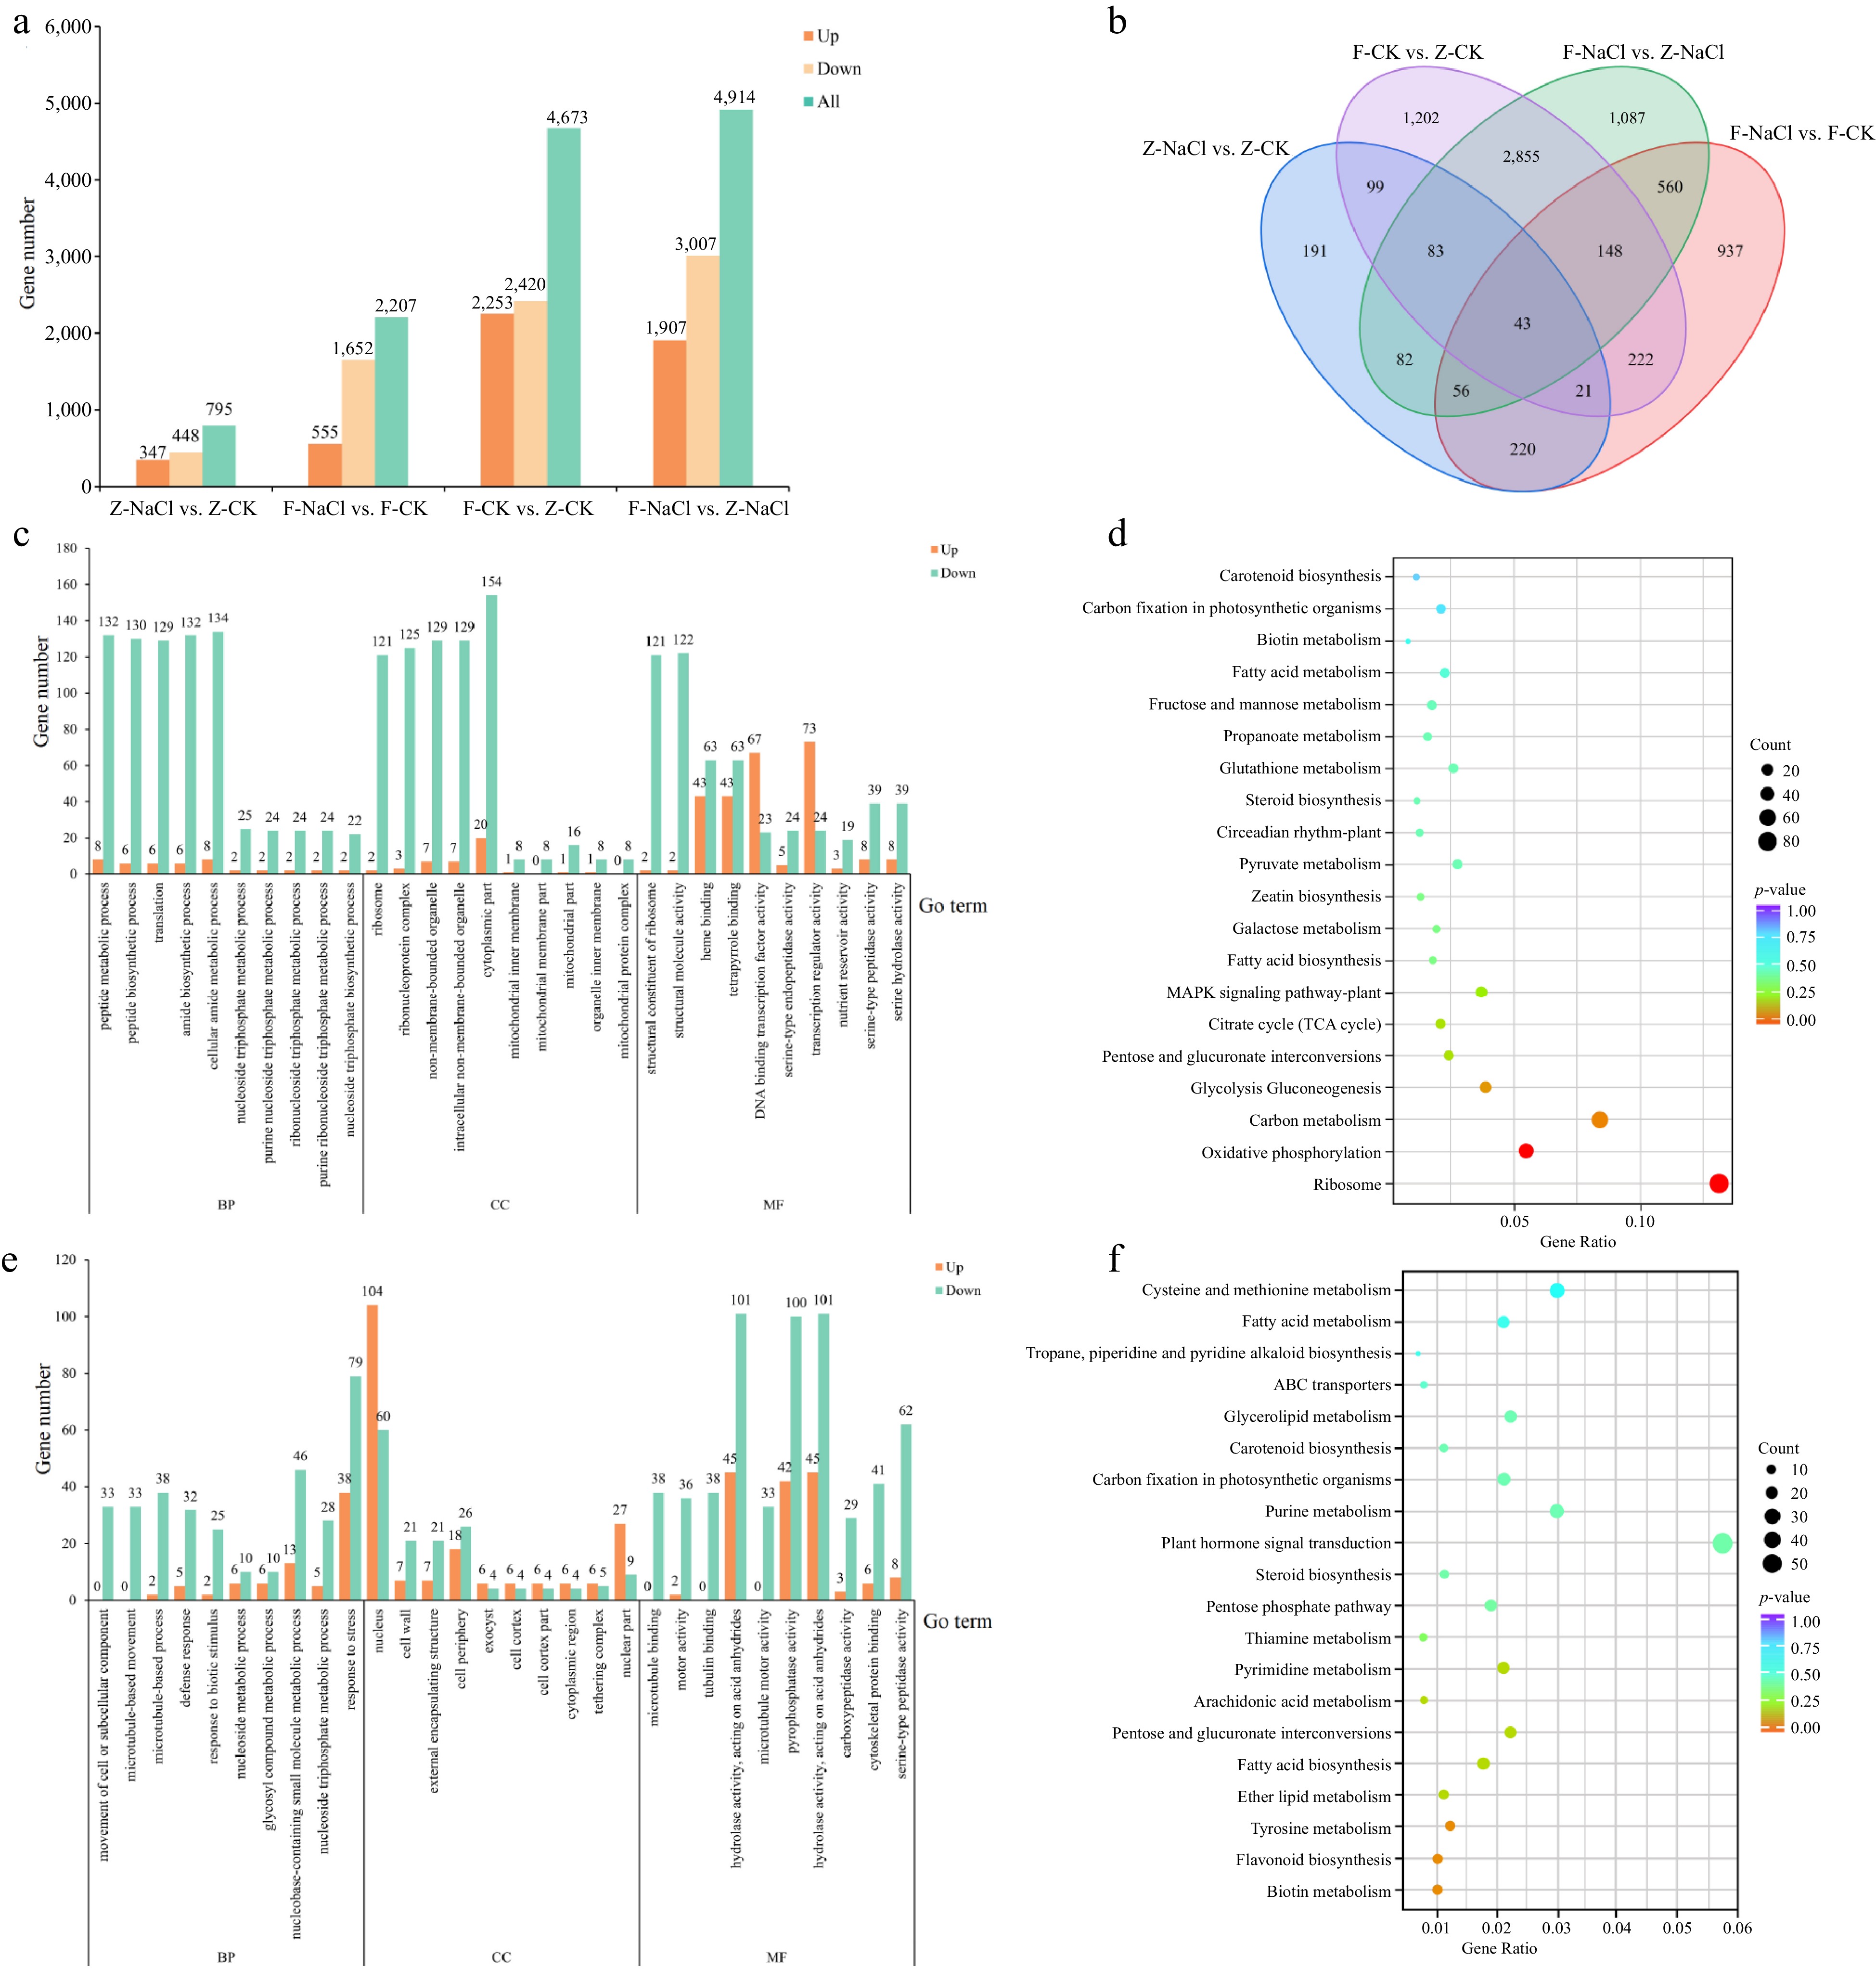
Figure 2.
DEG analysis of in the four comparison groups. (a) Total number of DEGs in Groups Z-NaCl vs Z-CK, F-NaCl vs F-CK, F-CK vs Z-CK, and F-NaCl vs Z-NaCl. (b) Venn diagram of DEGs in Z-NaCl vs Z-CK, F-NaCl vs F-CK, F-CK vs Z-CK, and F-NaCl vs Z-NaCl. (c) GO enrichment analysis of Z-NaCl vs Z-CK, and (d) F-NaCl vs F-CK. (e) KEGG enrichment analysis of Z-NaCl vs Z-CK and (f) F-NaCl vs F-CK.
-
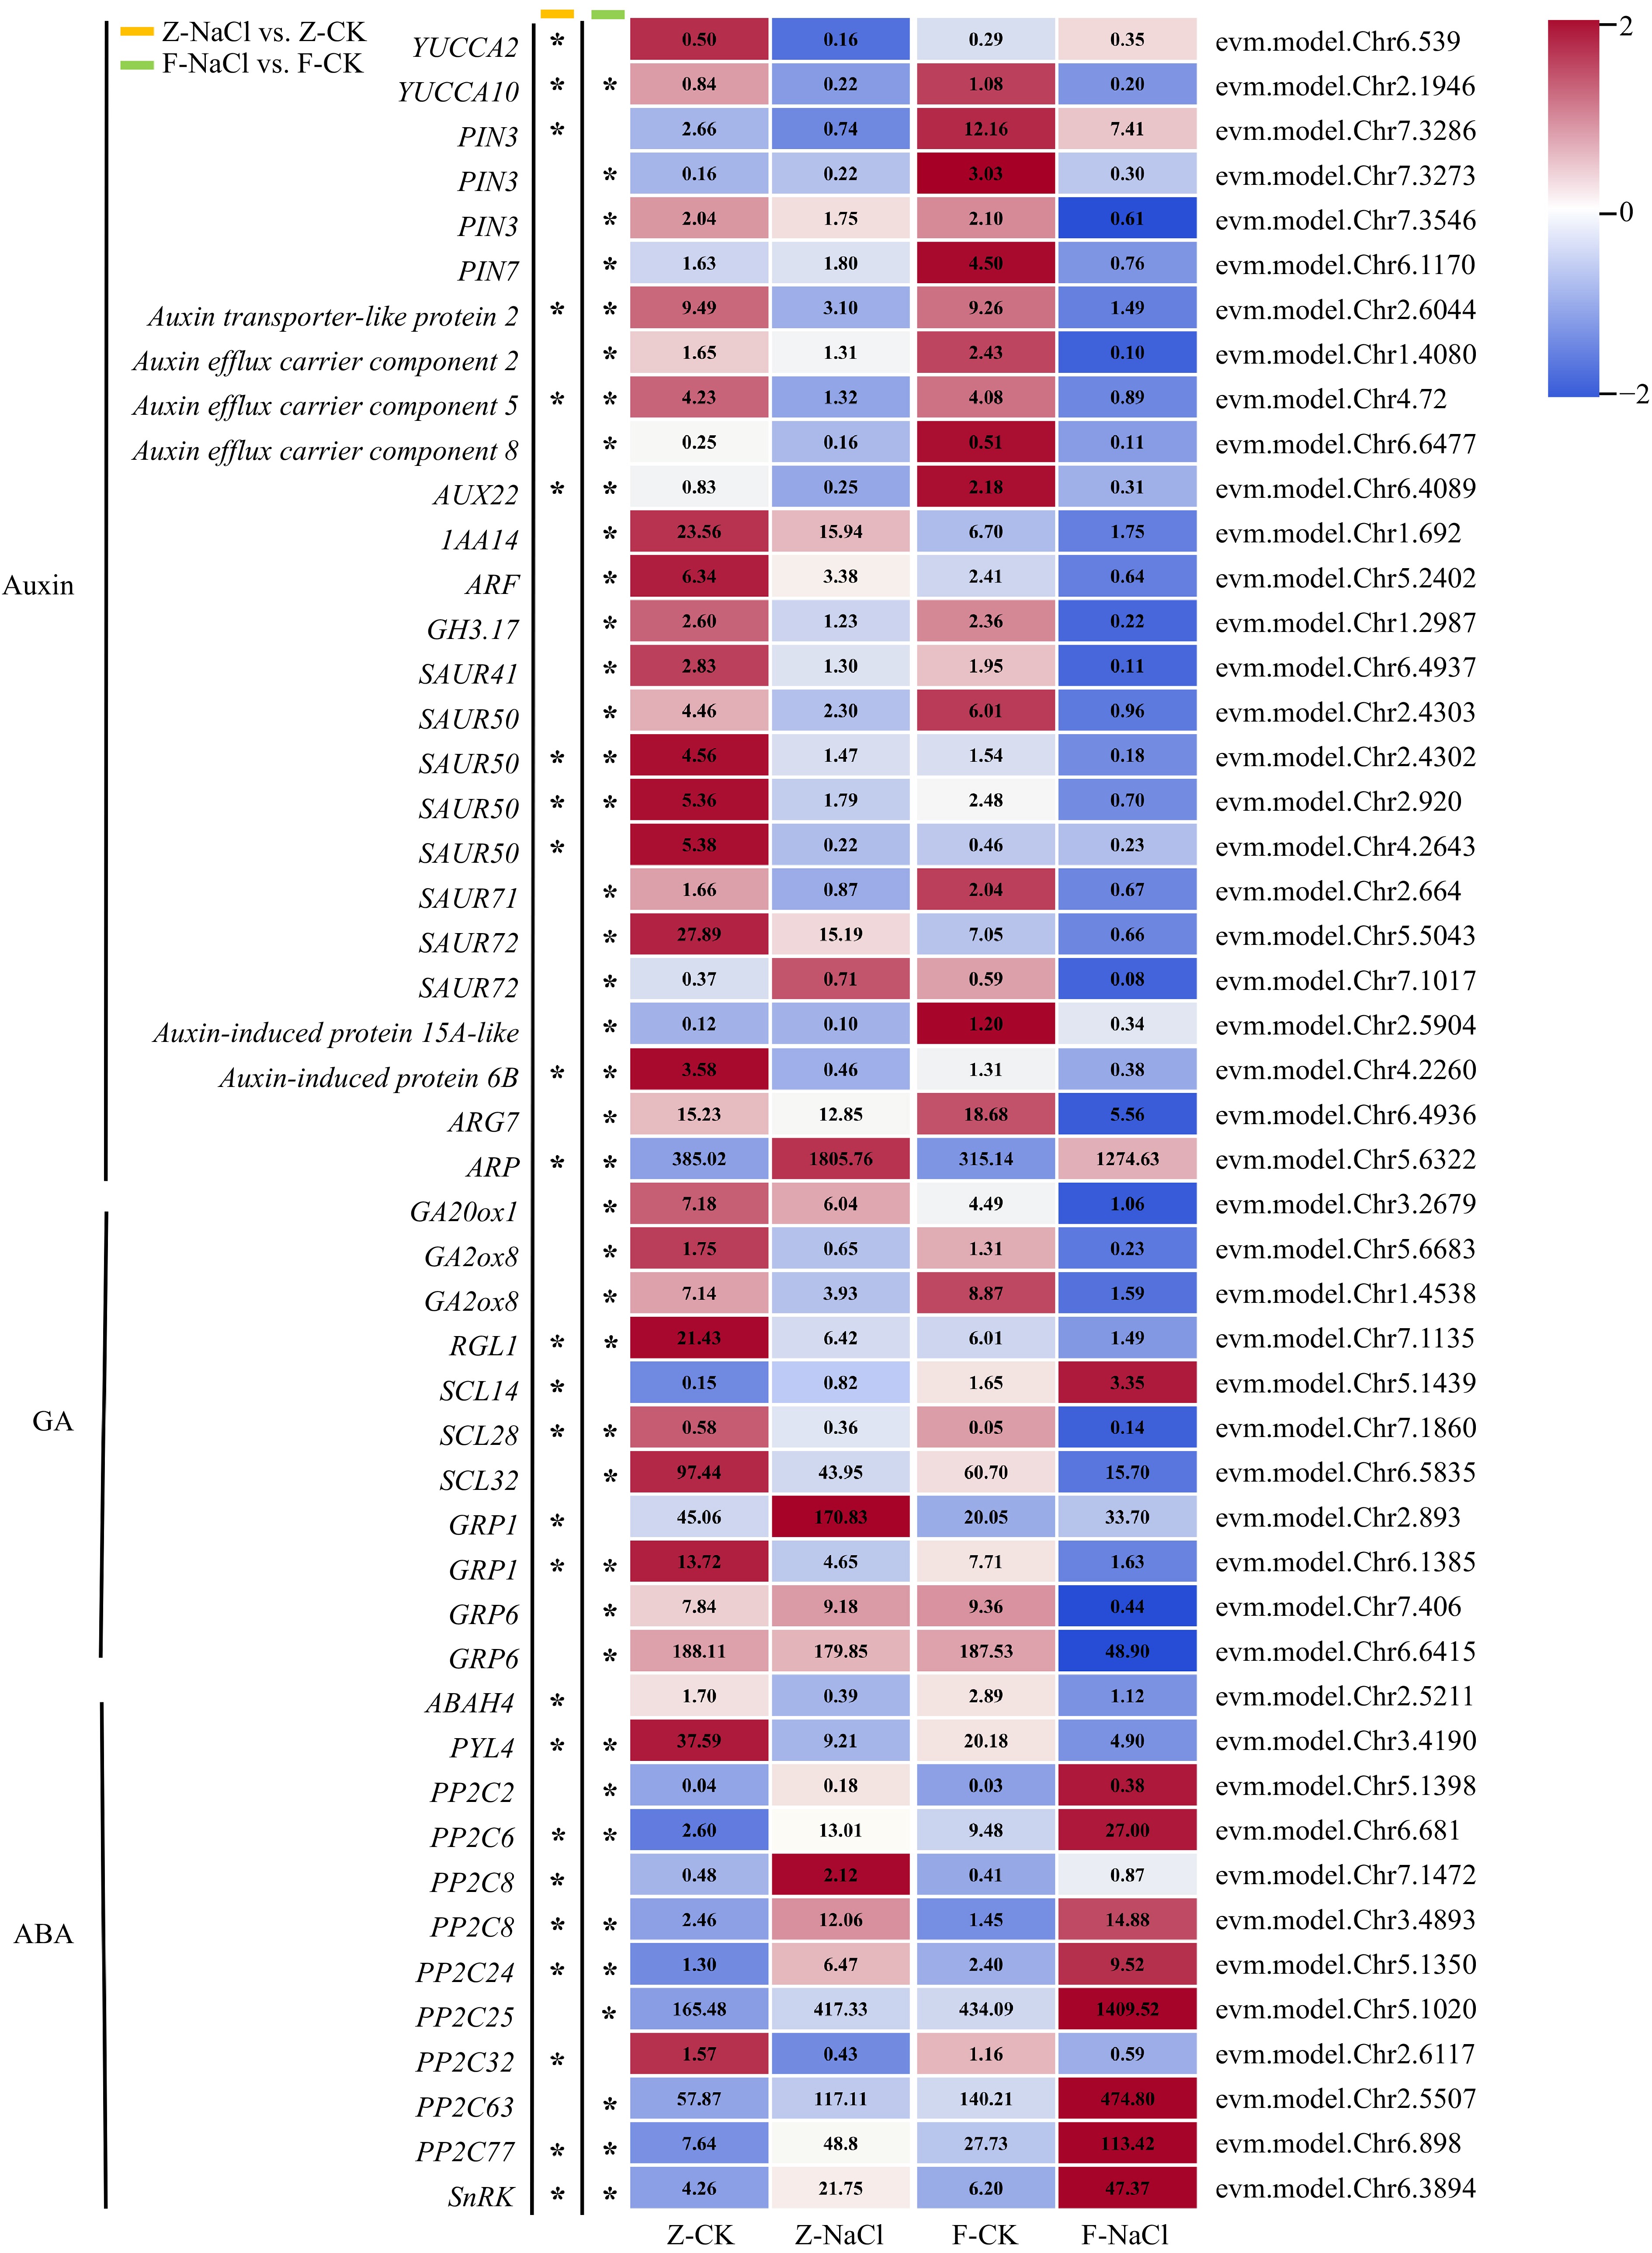
Figure 3.
Heatmap of DEGs associated with phytohormones (* log2| fold changes | ≥ 2, p-value < 0.05). ABAH: abscisic acid 8'-hydroxylase; ARF: Auxin response factor; ARG: Auxin-related gene; ARP: auxin-repressed protein; AUX: AUXIN; GA20ox: Gibberellin 20-oxidase; GA2ox: Gibberellin 2-oxidase; GH3: Gretchen Hagen 3; GRP: Gibberellin-regulated protein; IAA: Indole-3-acetic acid; PIN: PIN-formed; PP2C: Protein phosphatase 2C; PYL: Pyrabactin resistance 1-like; RGL1: RGA-like 1; SAUR: Small auxin-up RNA; SCL: Scarcrow-like; SnRK: SNF1-related protein kinase regulatory subunit gamma-like; YUC: YUCCA.
-
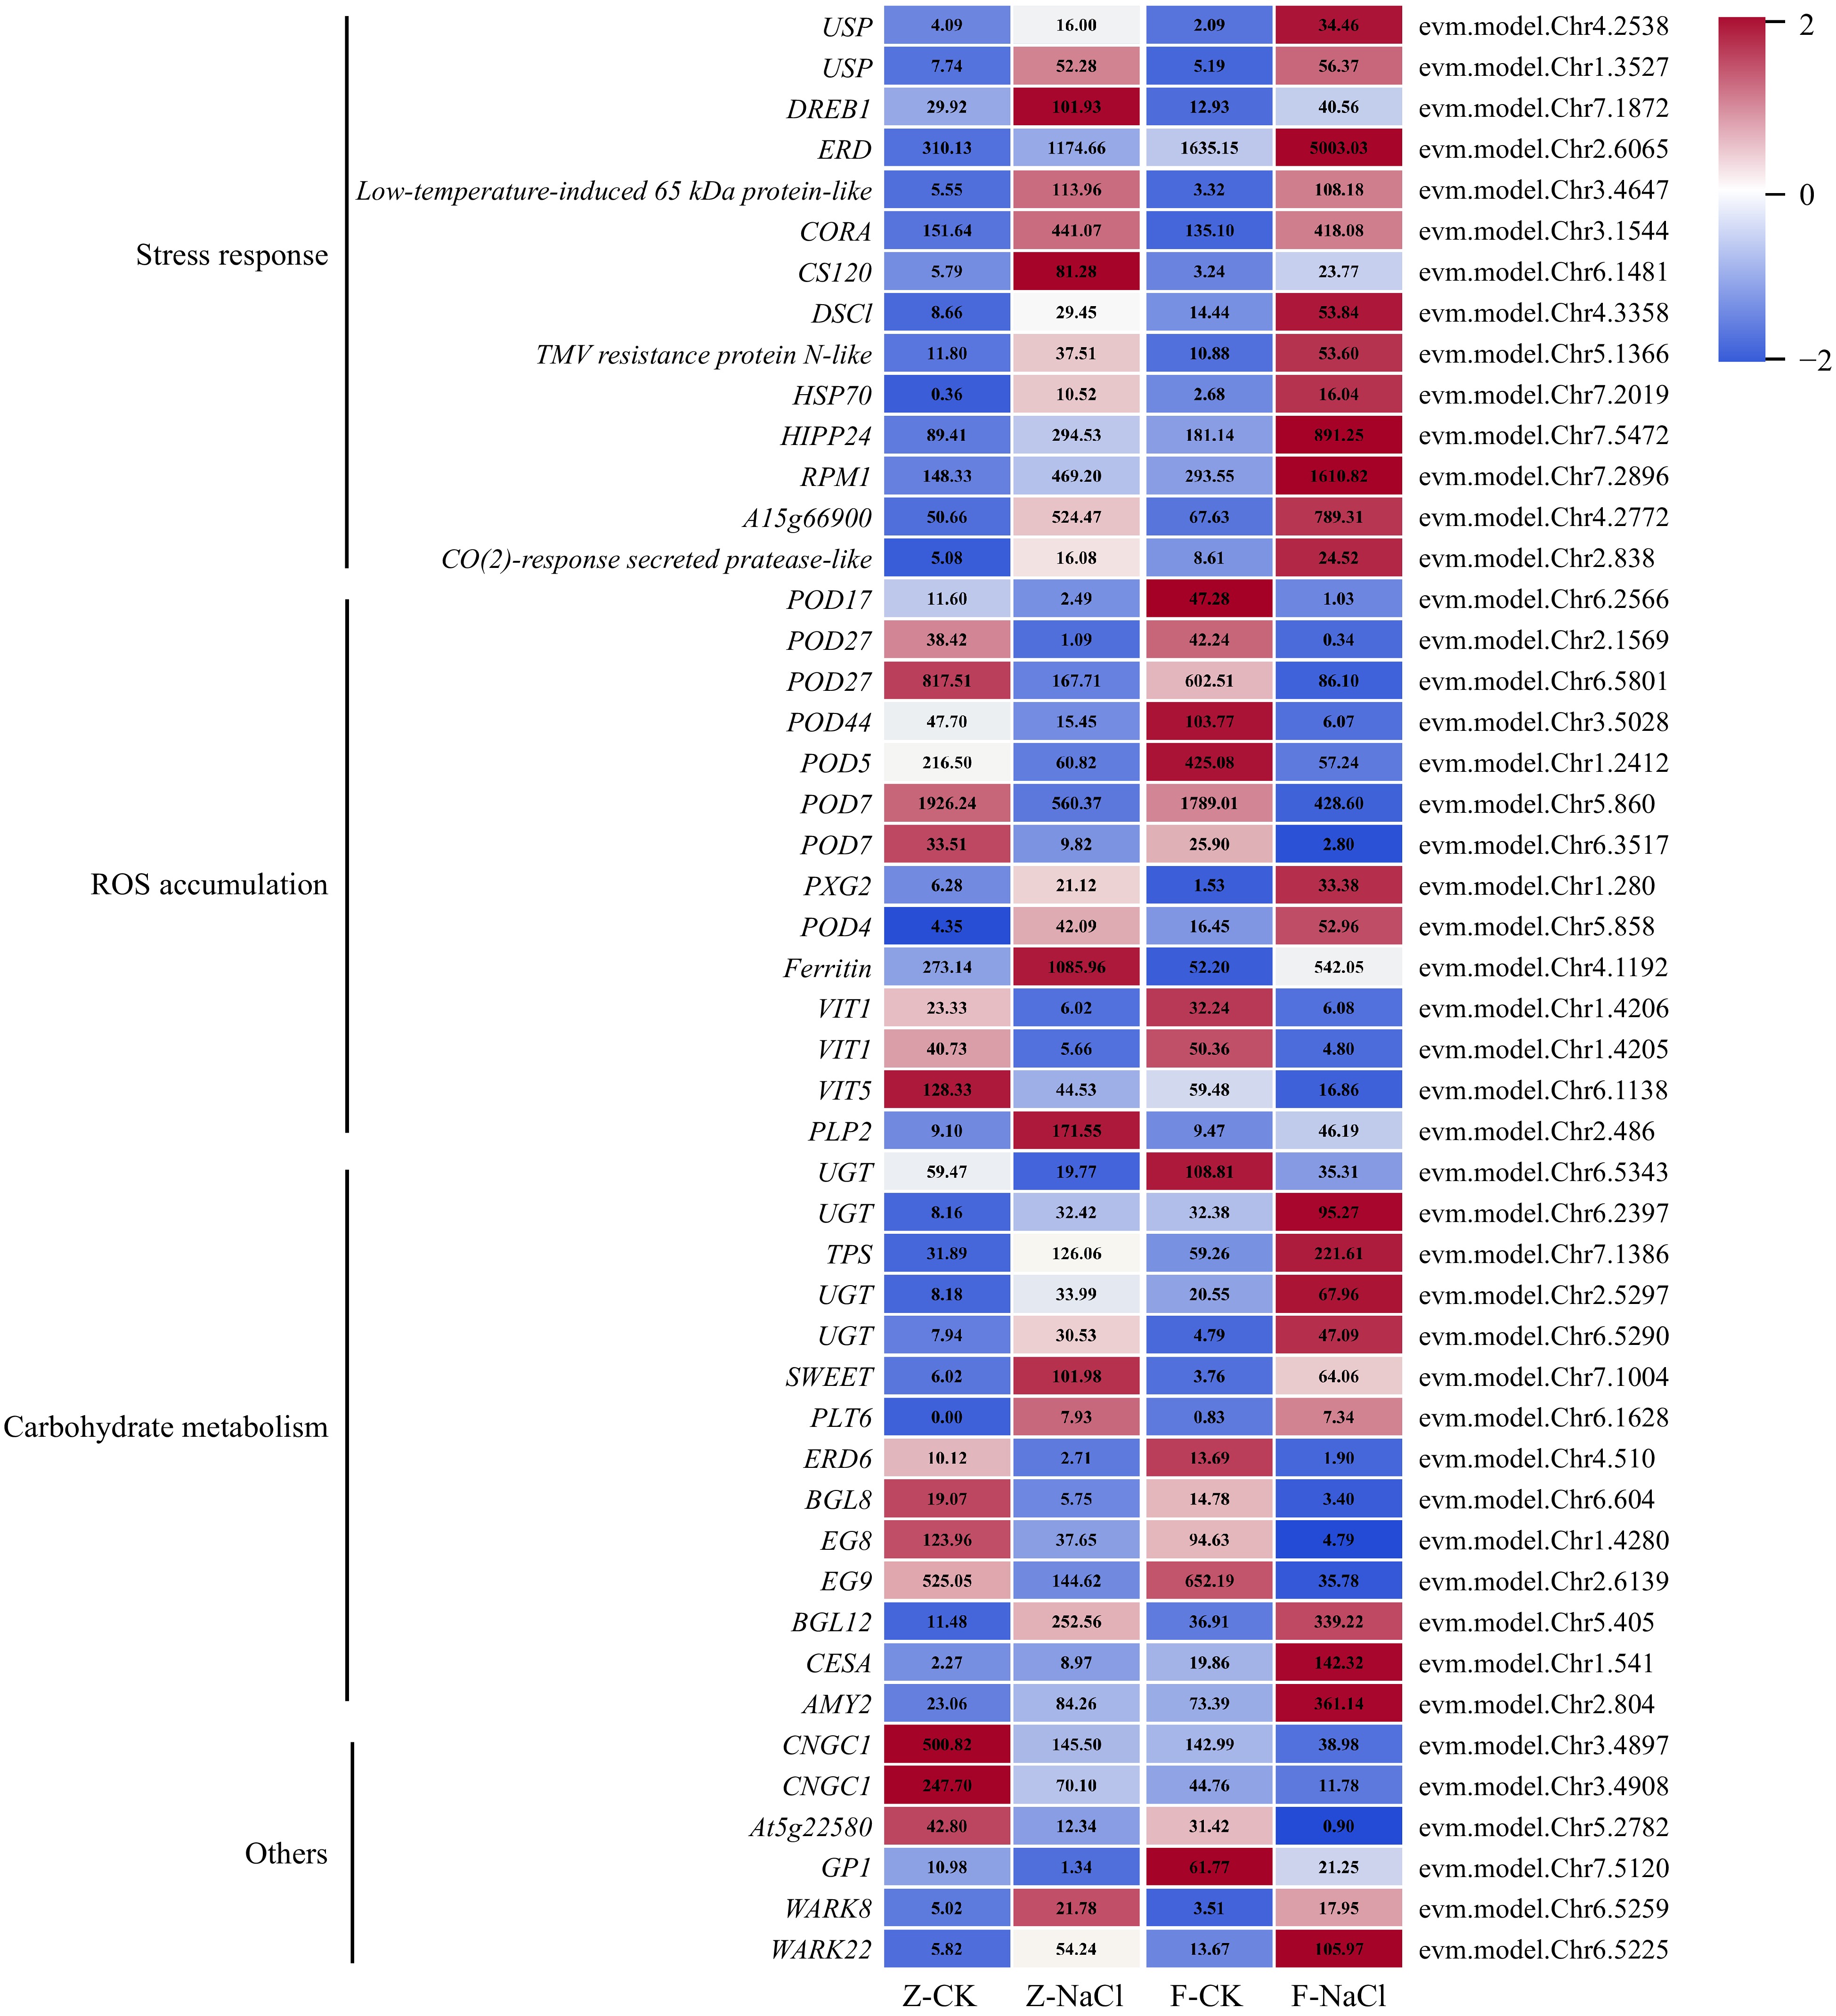
Figure 4.
Expression profile of DEGs associated with salt stress. AMY: Alpha-amylase; BGL: Beta-glucosidase; CESA: Cellulose synthase-like protein; CNGC: Cyclic nucleotide-gated ion channel 1-like; CS: Cold-shock protein; CORA: Cold-regulated protein; DREB: Dehydration-responsive element-binding protein; DSC: Disease resistance-like protein; EG: Endoglucanase; ERD: Early response to dehydration 6-like; ERD: Early-responsive to dehydration; GP1: Vegetative cell wall protein gp1-like; HIPP: Heavy metal-associated isoprenylated plant protein; HSP: Heat shock protein; PLP: Patatin-like protein; PLT: Polyol transporter; POD: Peroxidase; PXG: Peroxygenase; RPM: Resistance to pseudomonas maculicola; SWEET: Sugars will eventually be exported transporter; TPS: Trehalose-6-phosphate synthase; UGT: UDP-glucosyltransferase family protein; USP: universal stress protein; VIT: Vacuolar iron transporter 1-like; WARK: Wall-associated receptor kinase-like.
-
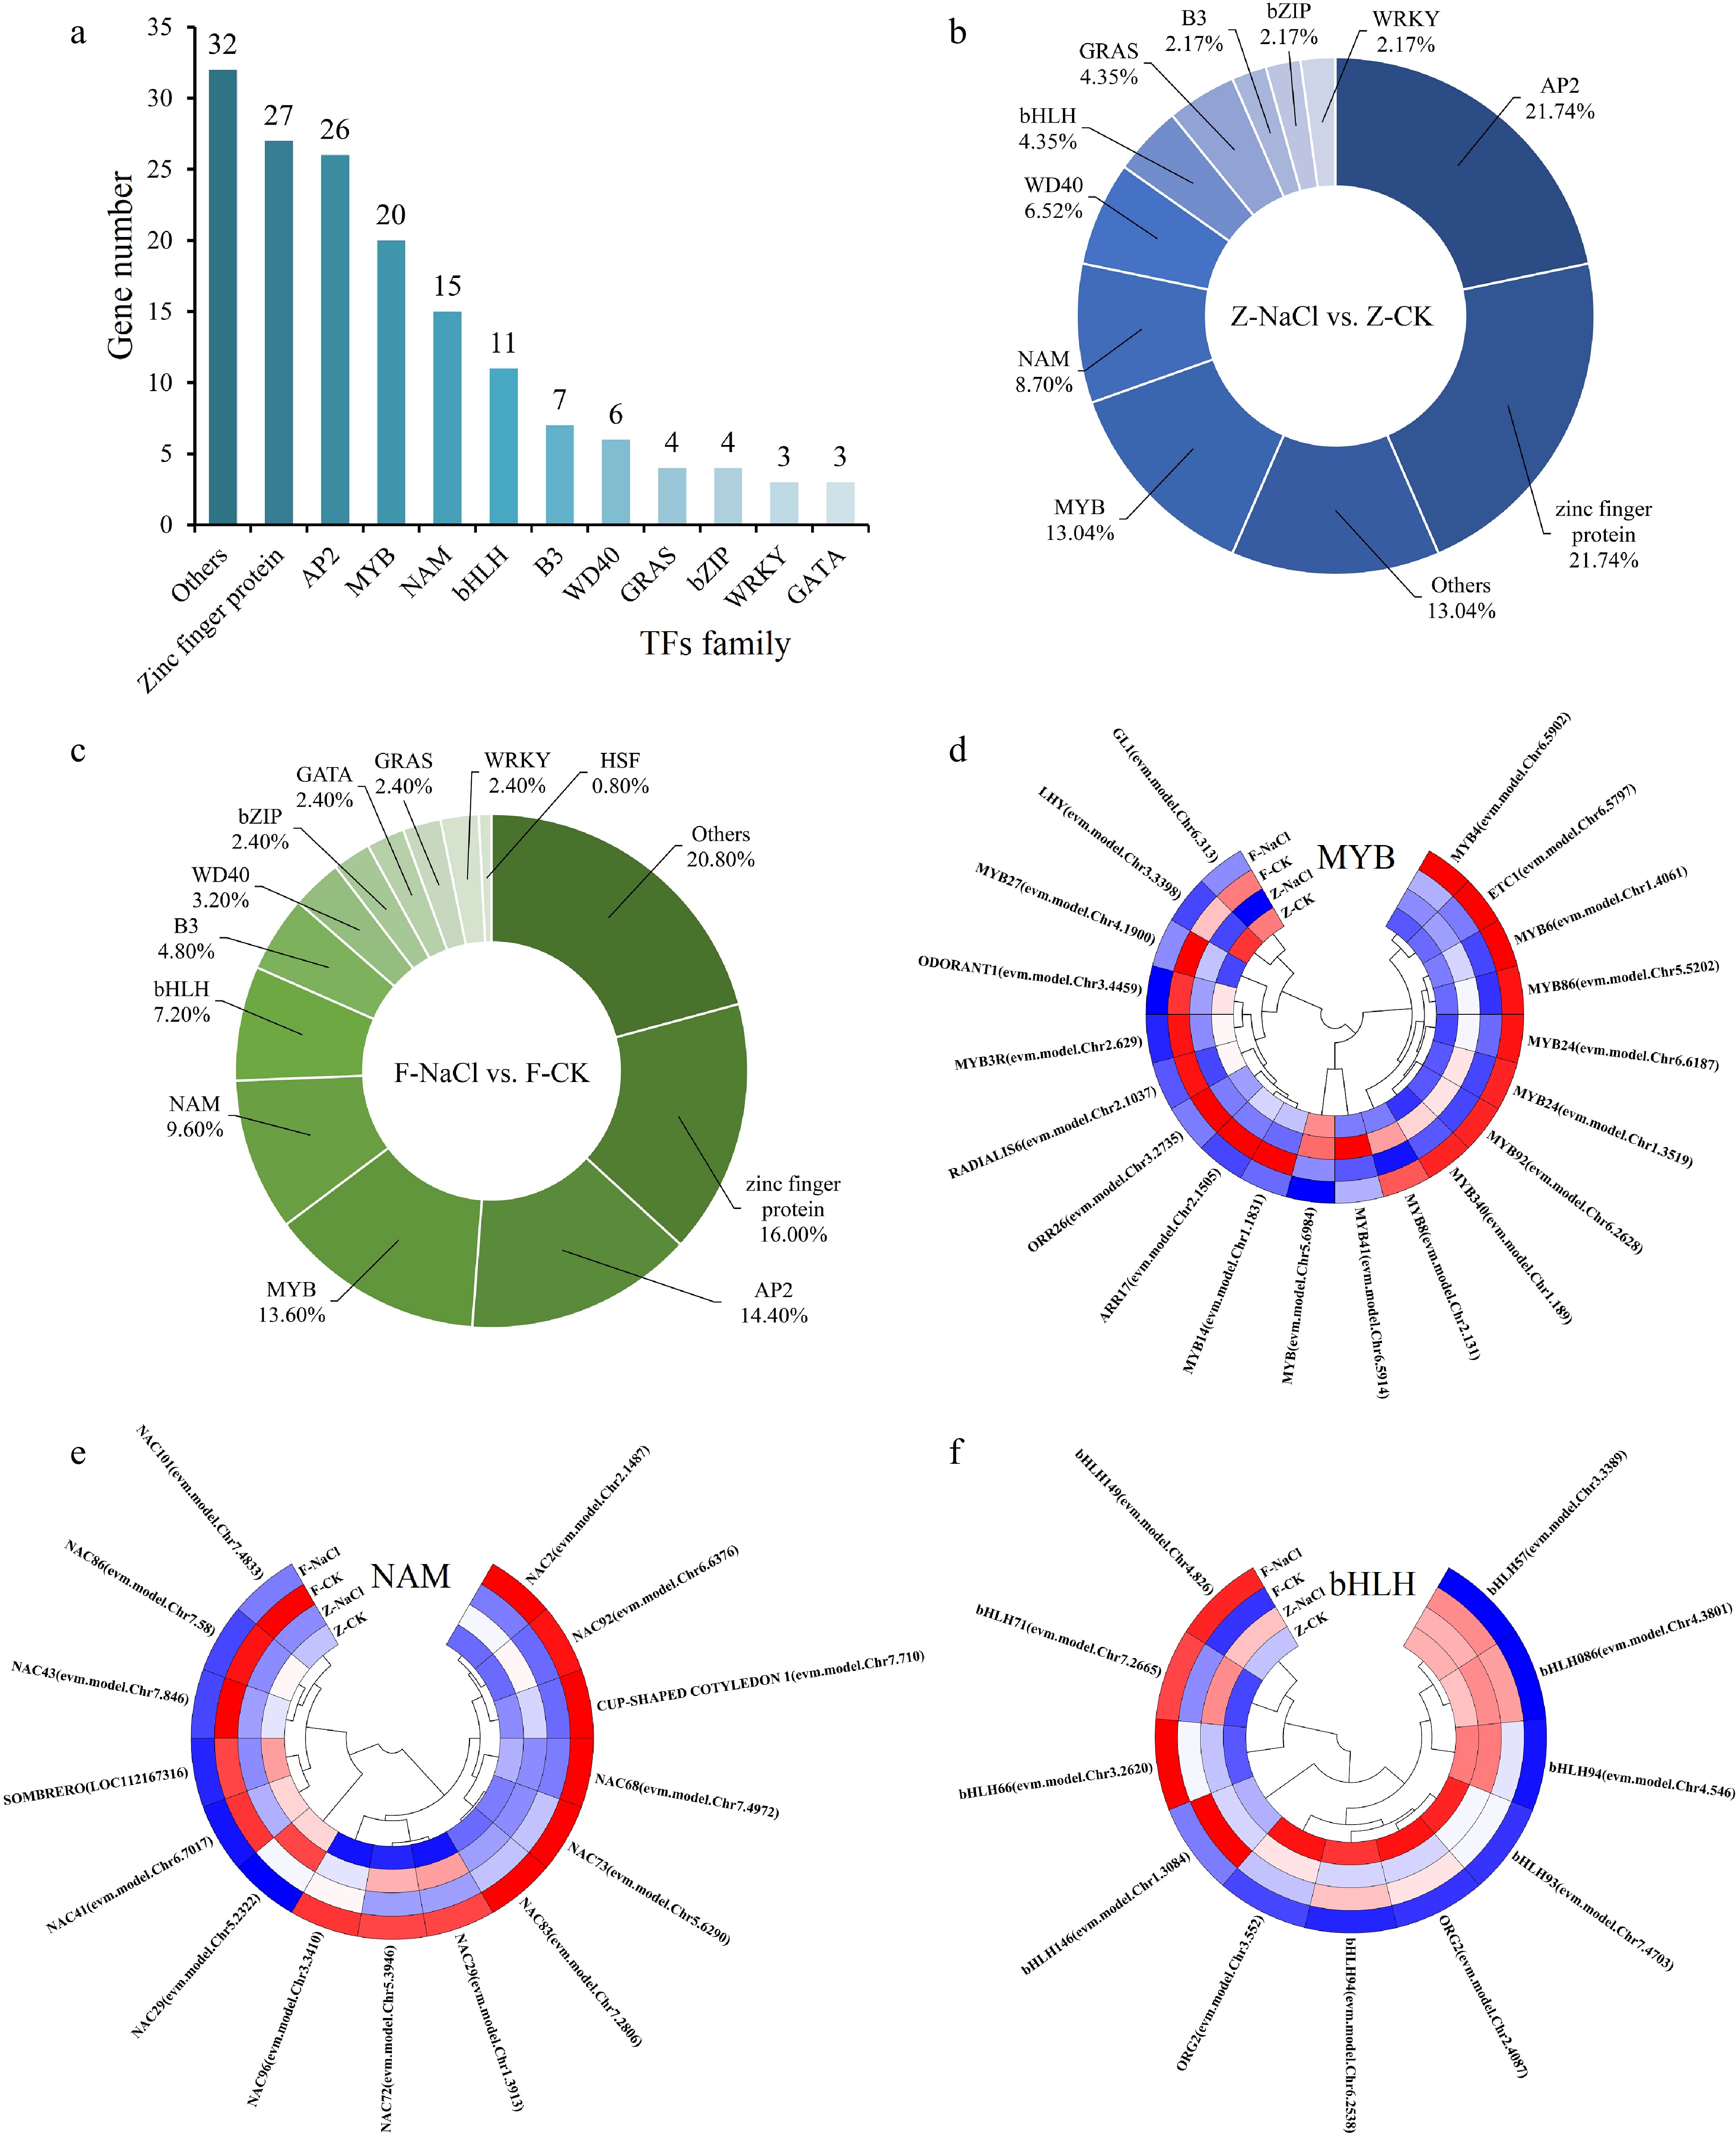
Figure 5.
Transcription factor statistical analysis. (a) Statistics on the number of TFs. (b)−(c) The percentage of TFs in Z-NaCl vs Z-CK, F-NaCl vs F-CK. (d)−(f) Clustering heatmaps of TFs in MYB, NAM, and bHLH.
-
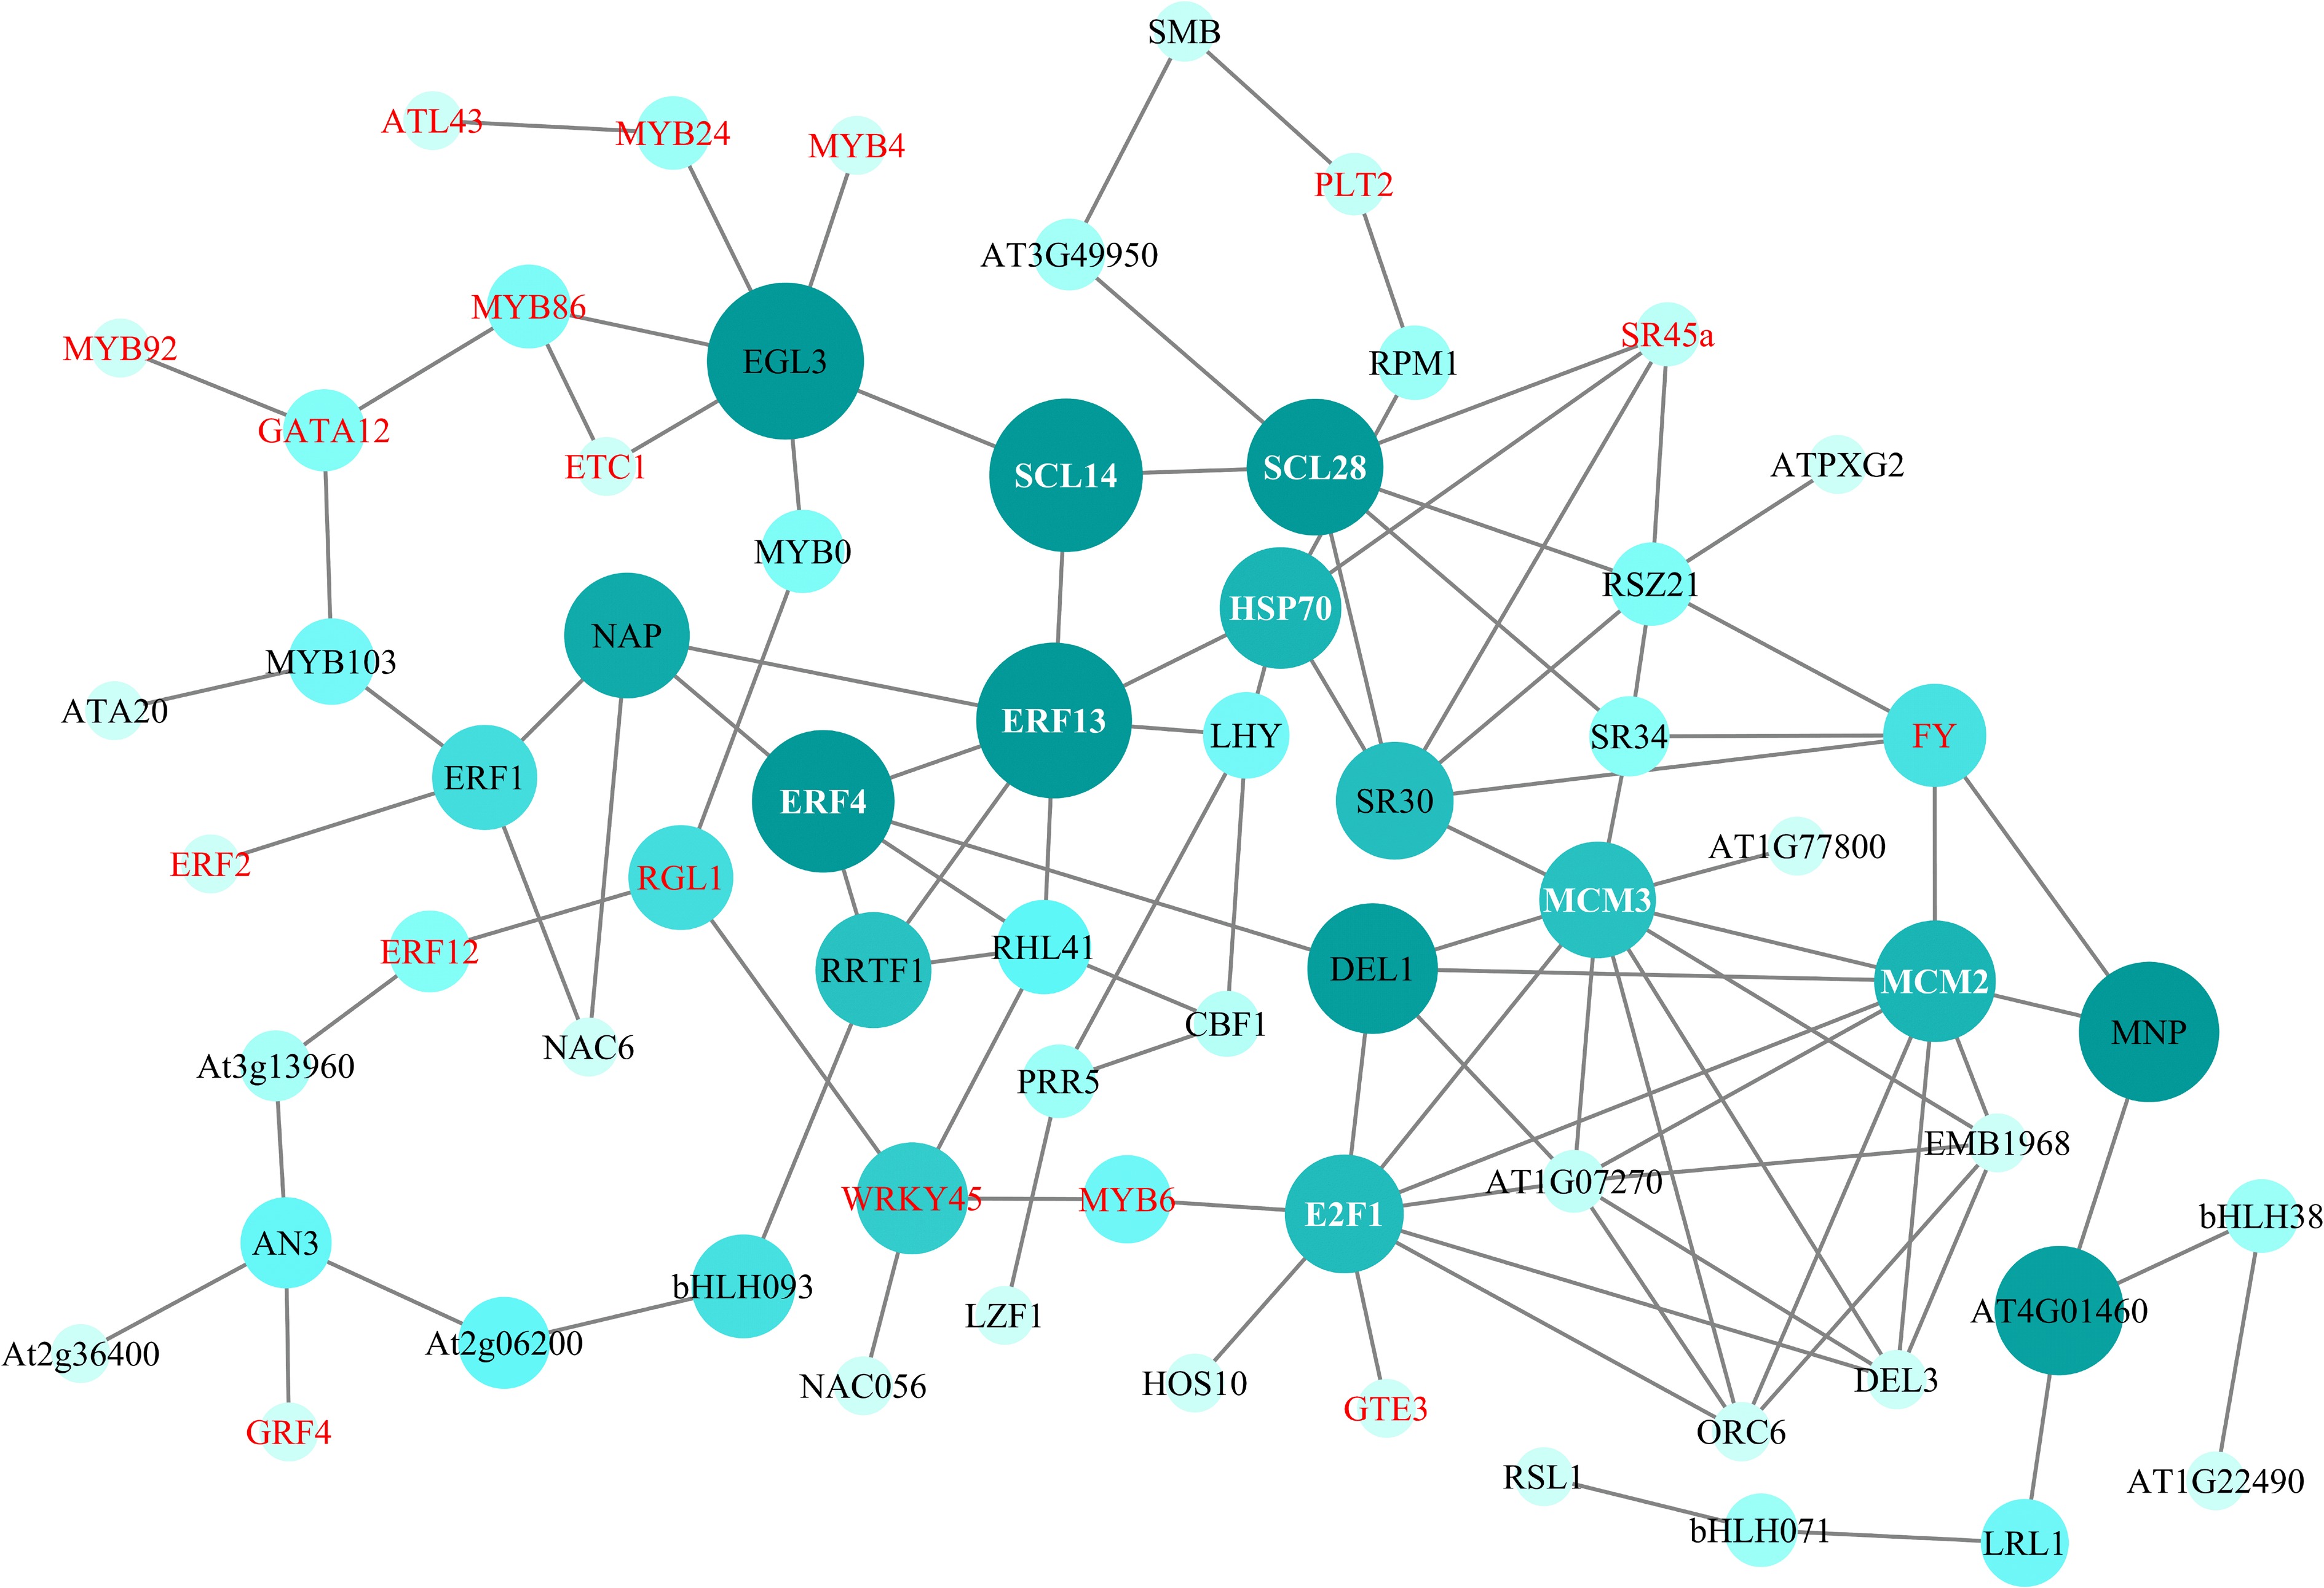
Figure 6.
PPI network of DEGs. Genes in red and white font are DEGs in the transcriptome data of R. rugosa.
-
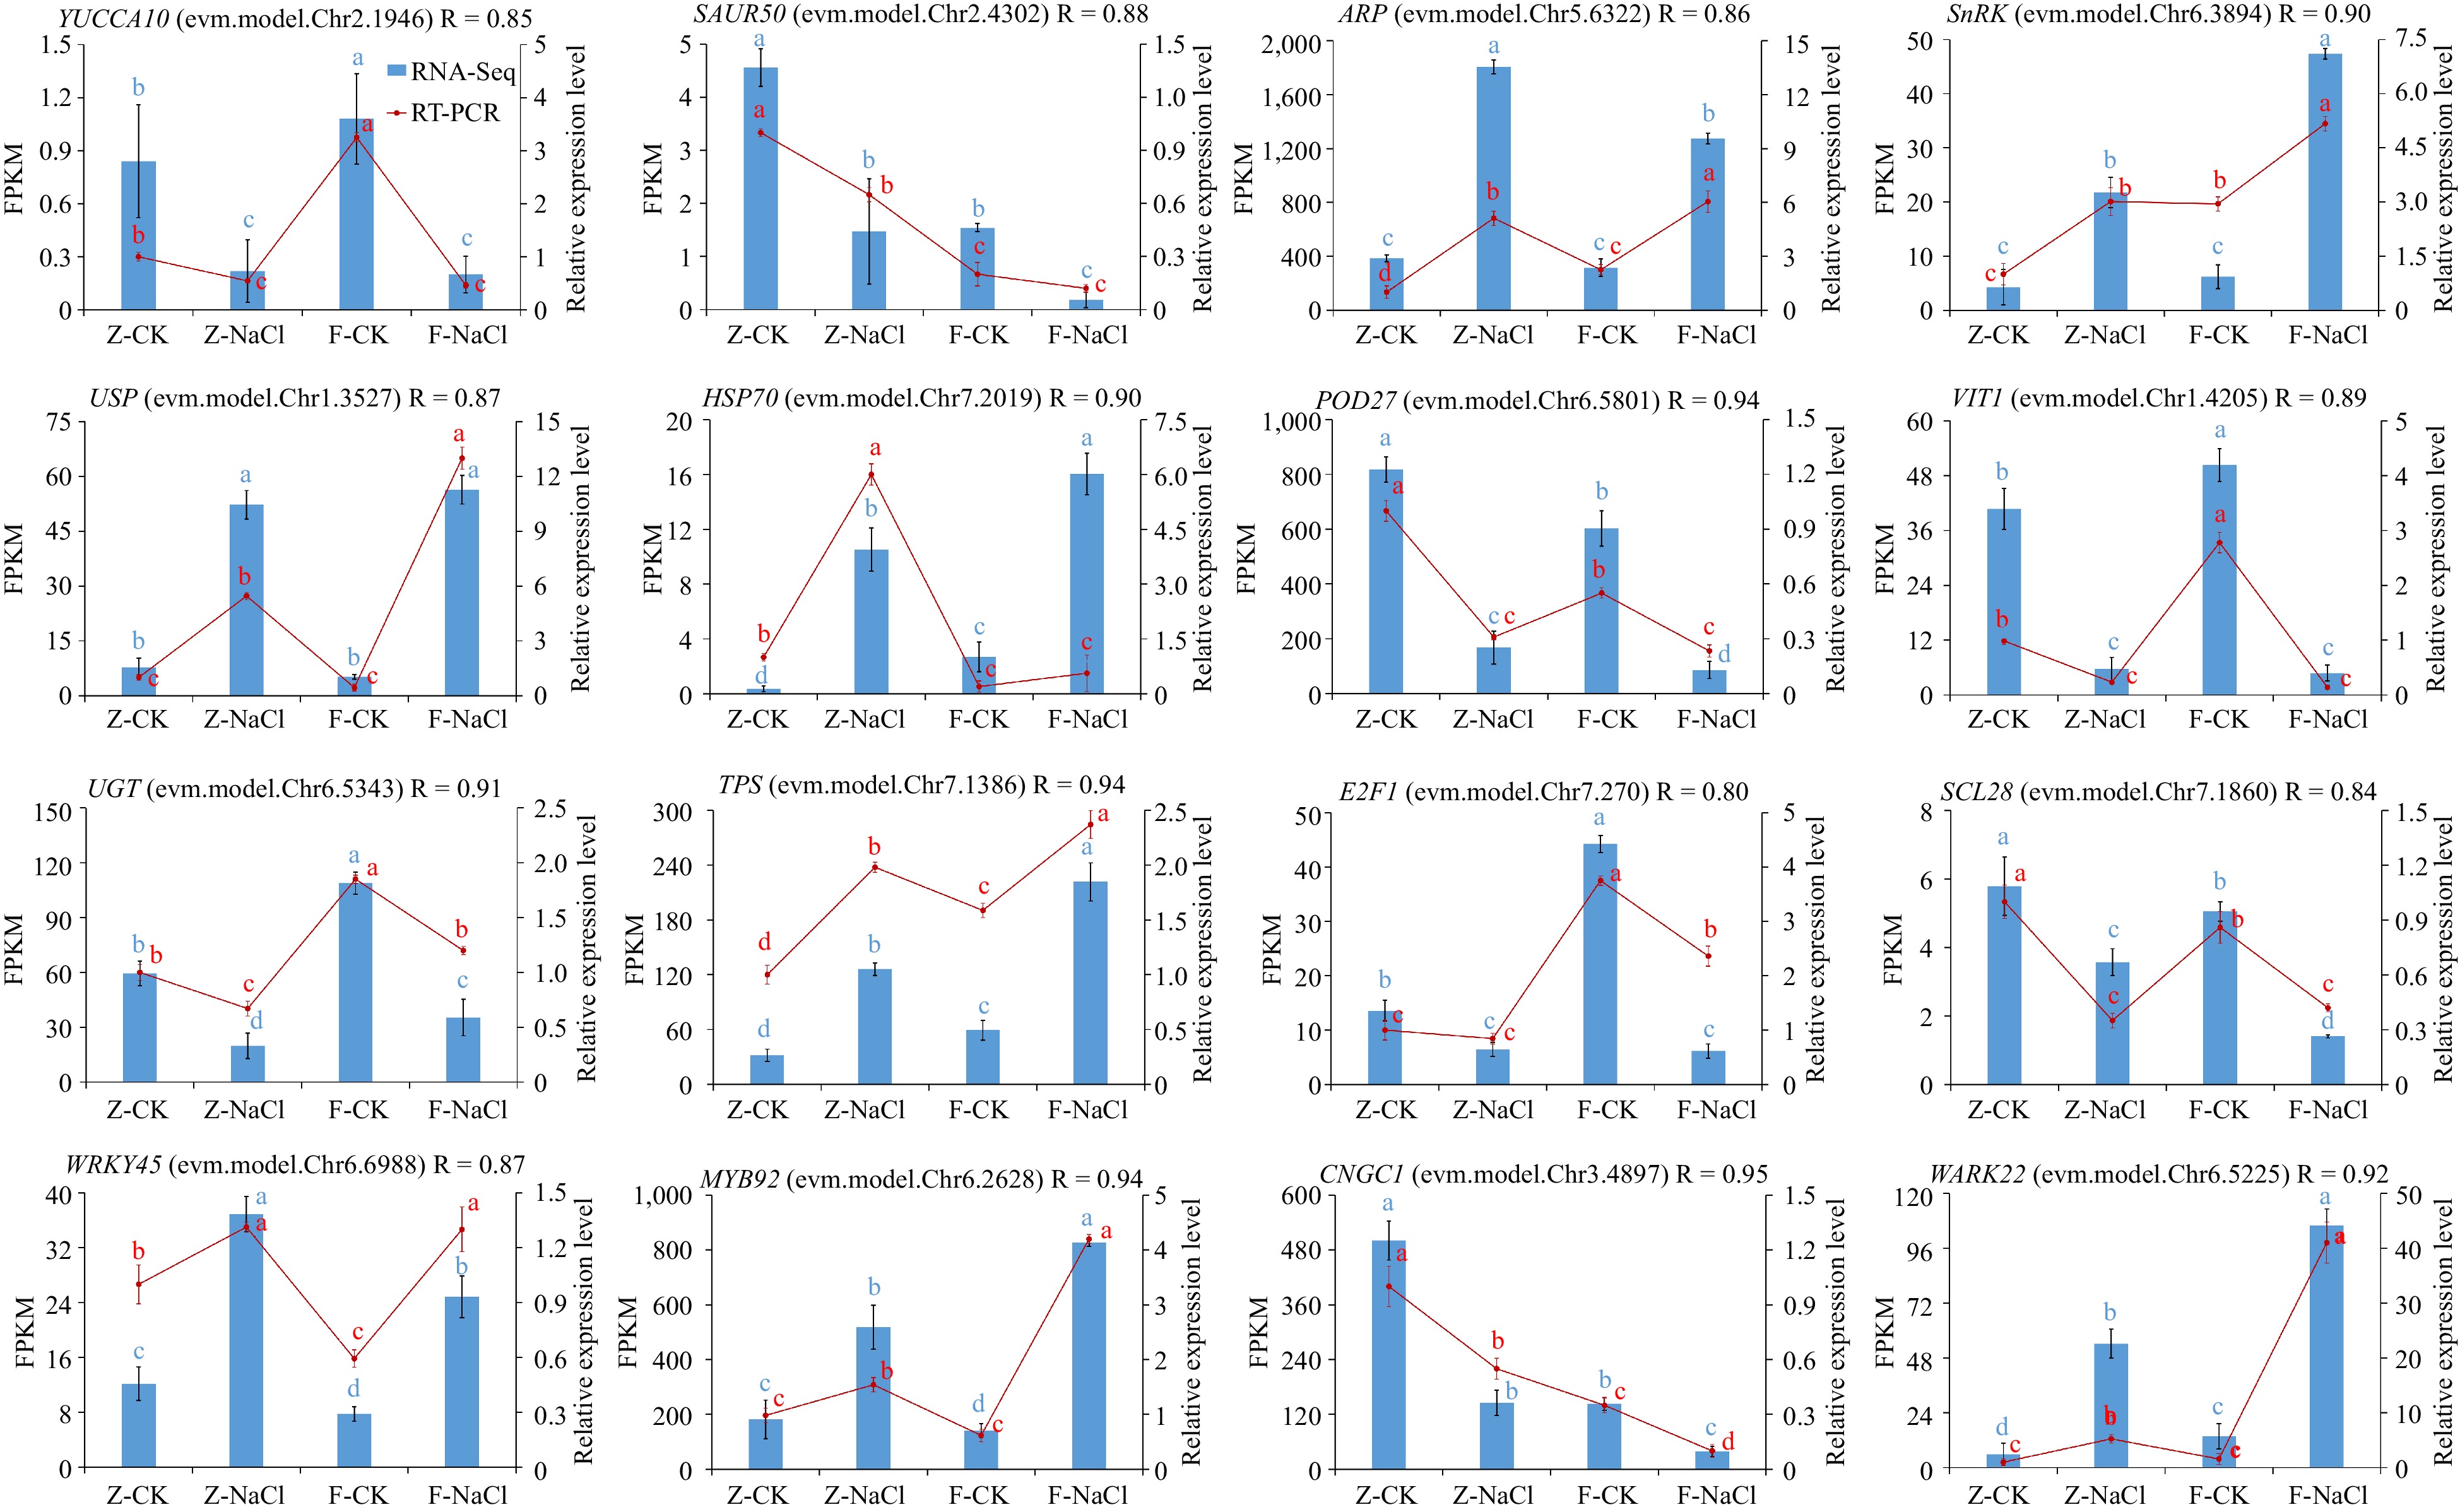
Figure 7.
Quantitative RT-PCR validation of 16 DEGs. Relative expression levels from quantitative RT-PCR and FPKM from the transcriptome of genes are shown on the left and right, respectively. The red line represents the FPKM value in the RNA-seq result. The blue bar represents qRT-PCR results. The different small letter for each expression level indicated significant difference between germplasms at α = 0.05.
Figures
(7)
Tables
(0)