-
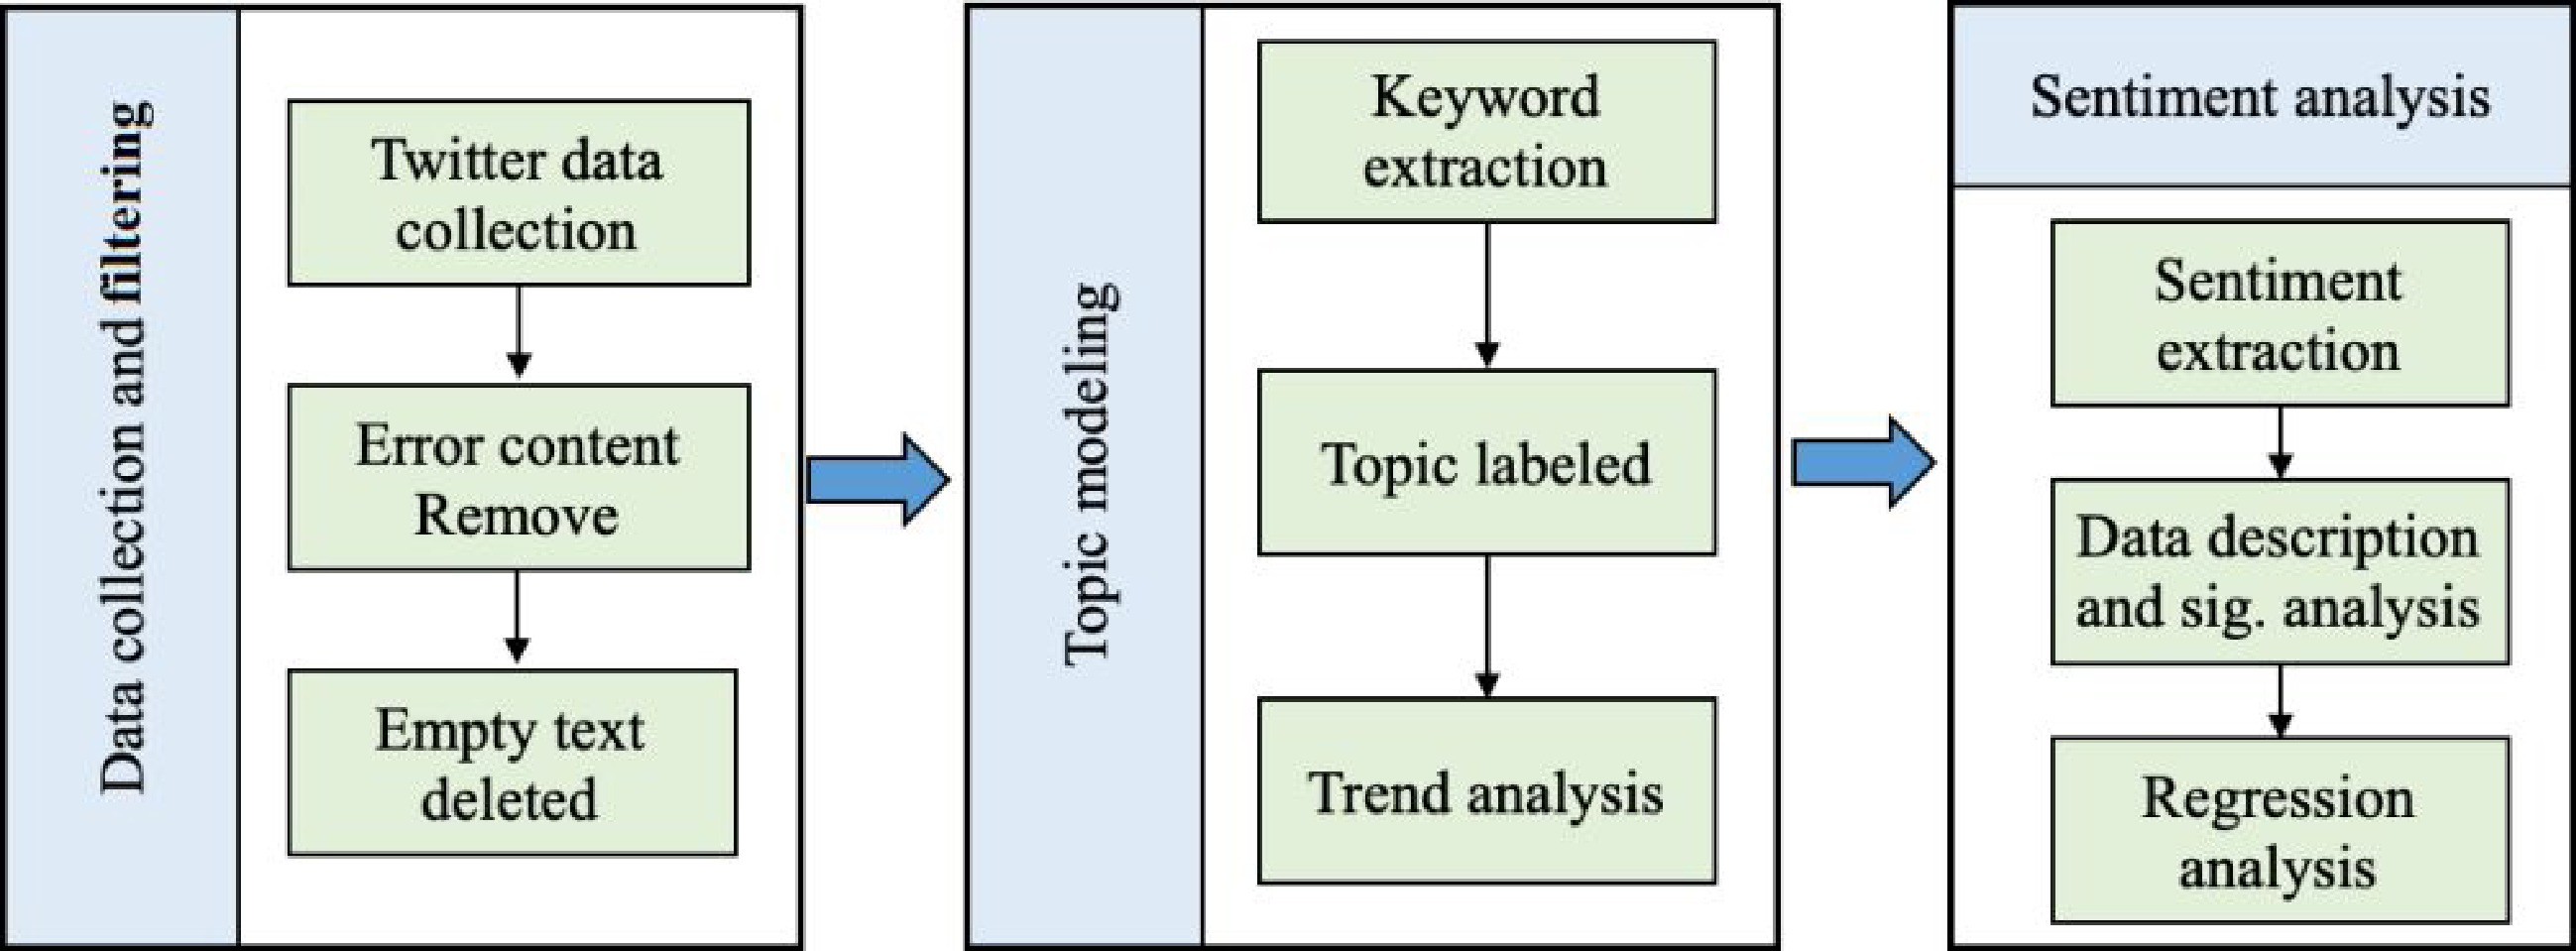
Figure 1.
Flowchart of the methodology framework.
-
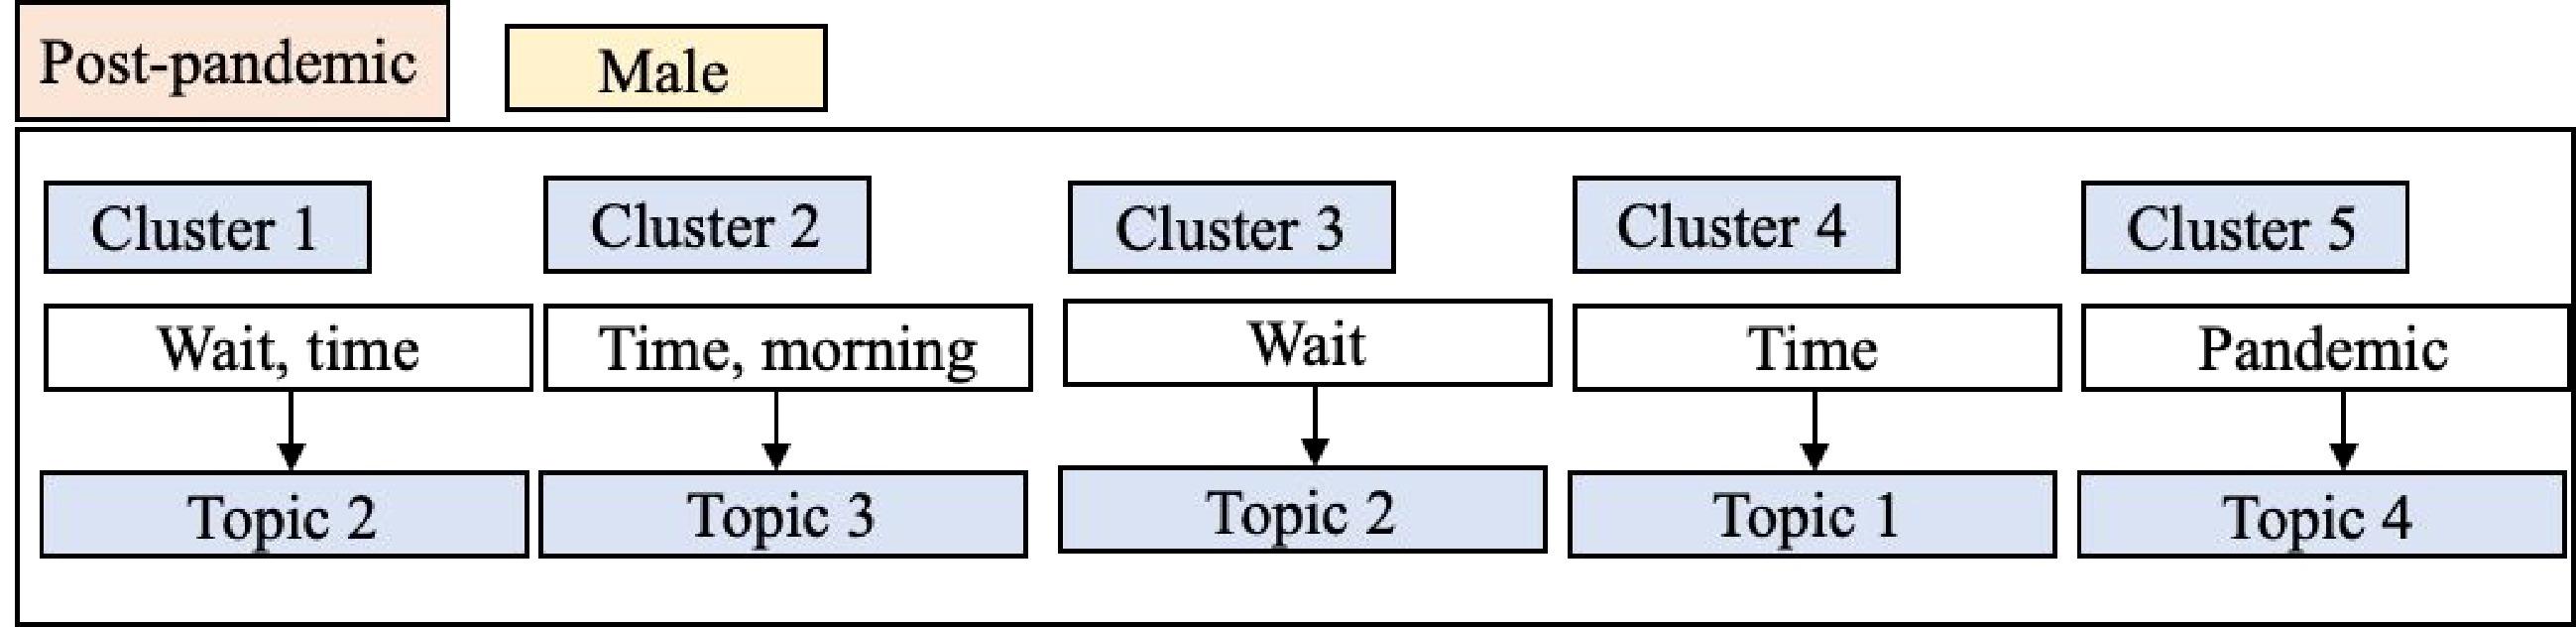
Figure 2.
Example of topic labeling.
-
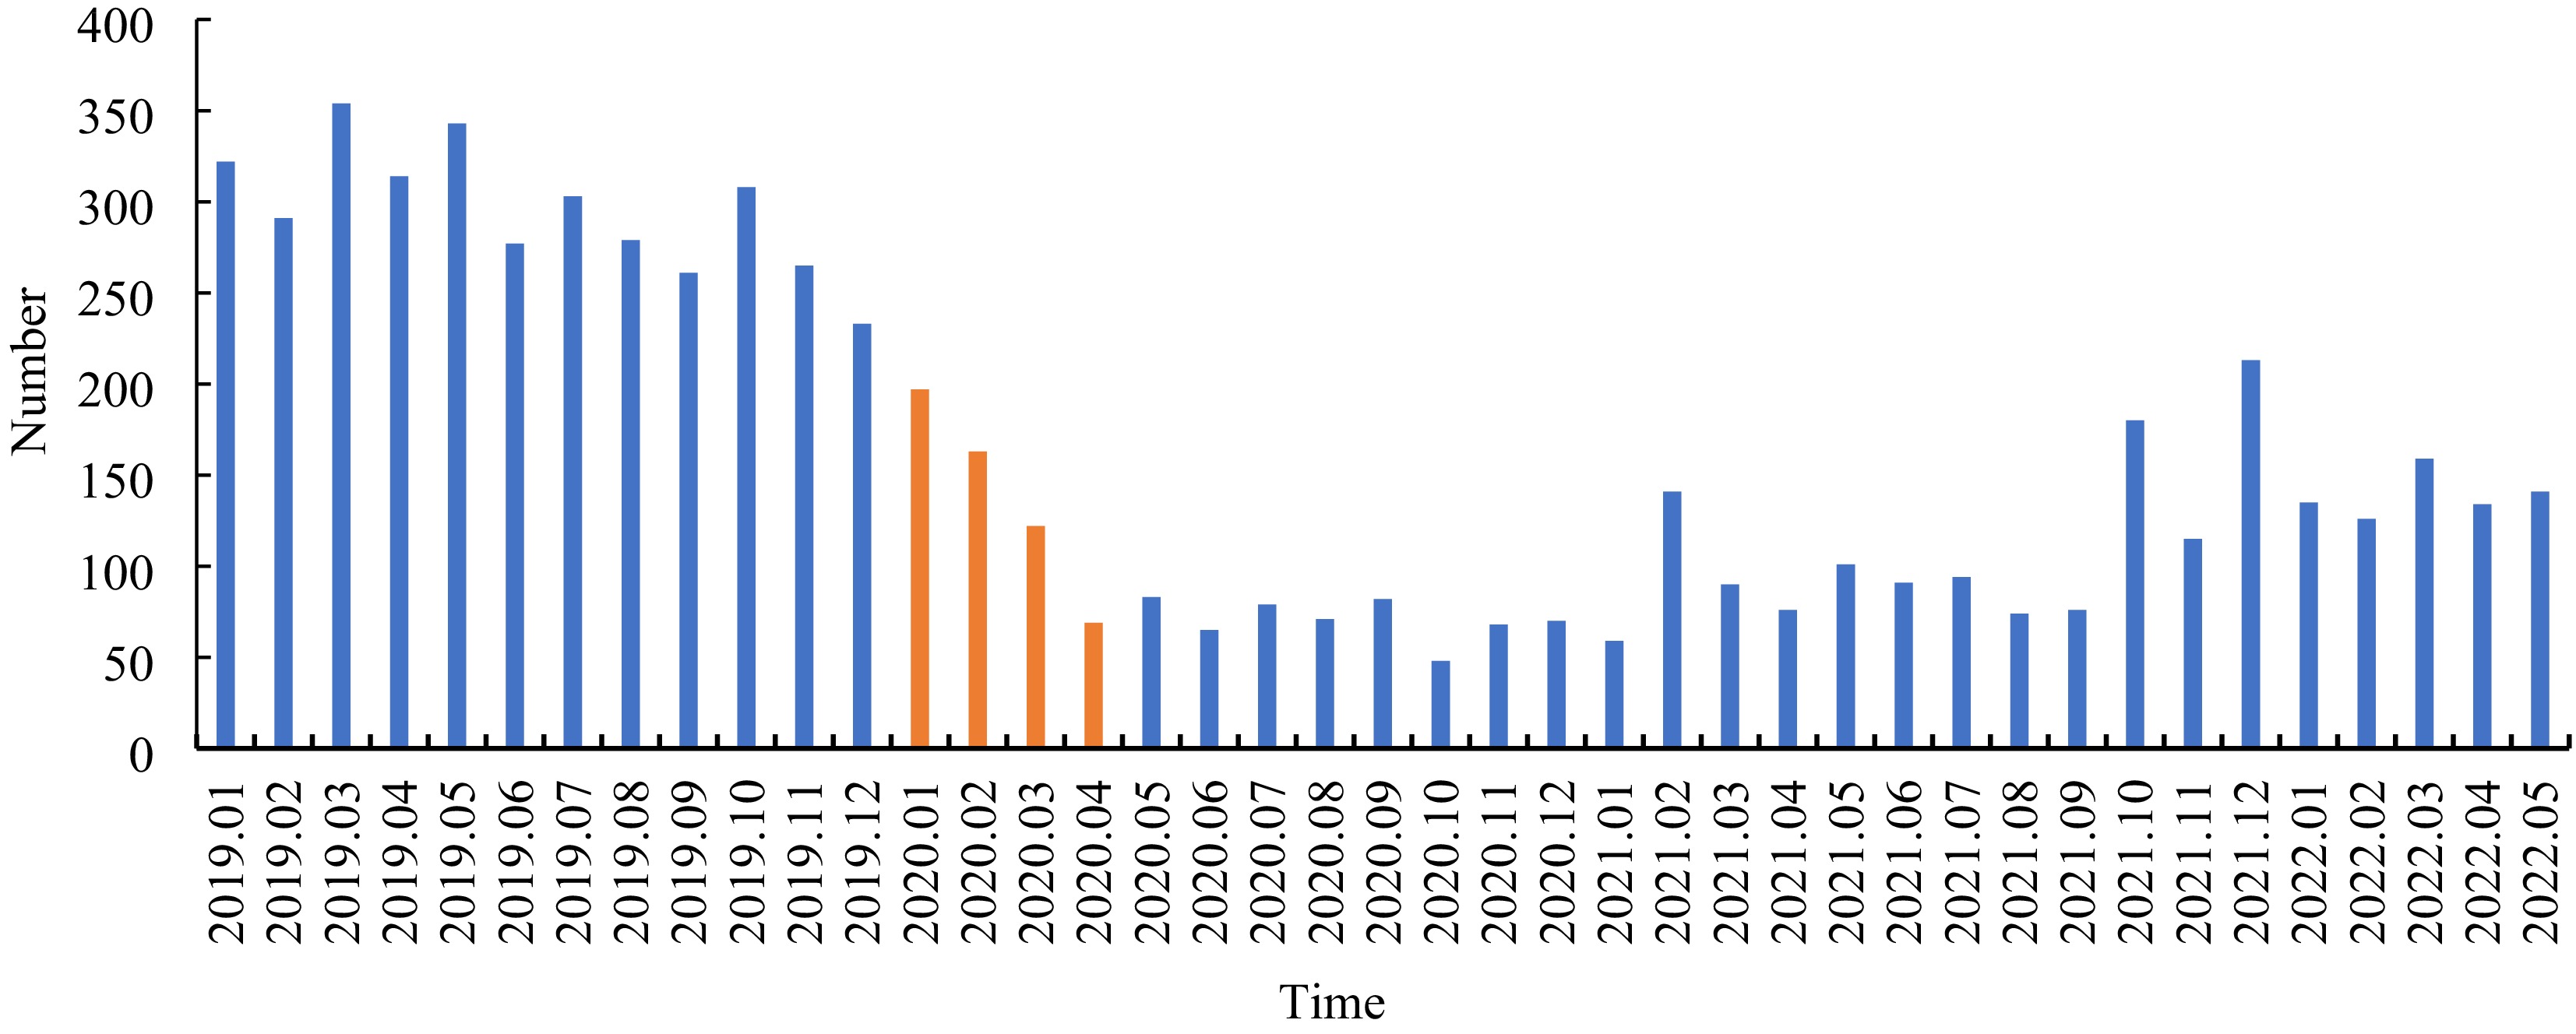
Figure 3.
The tweet frequency each month.
-
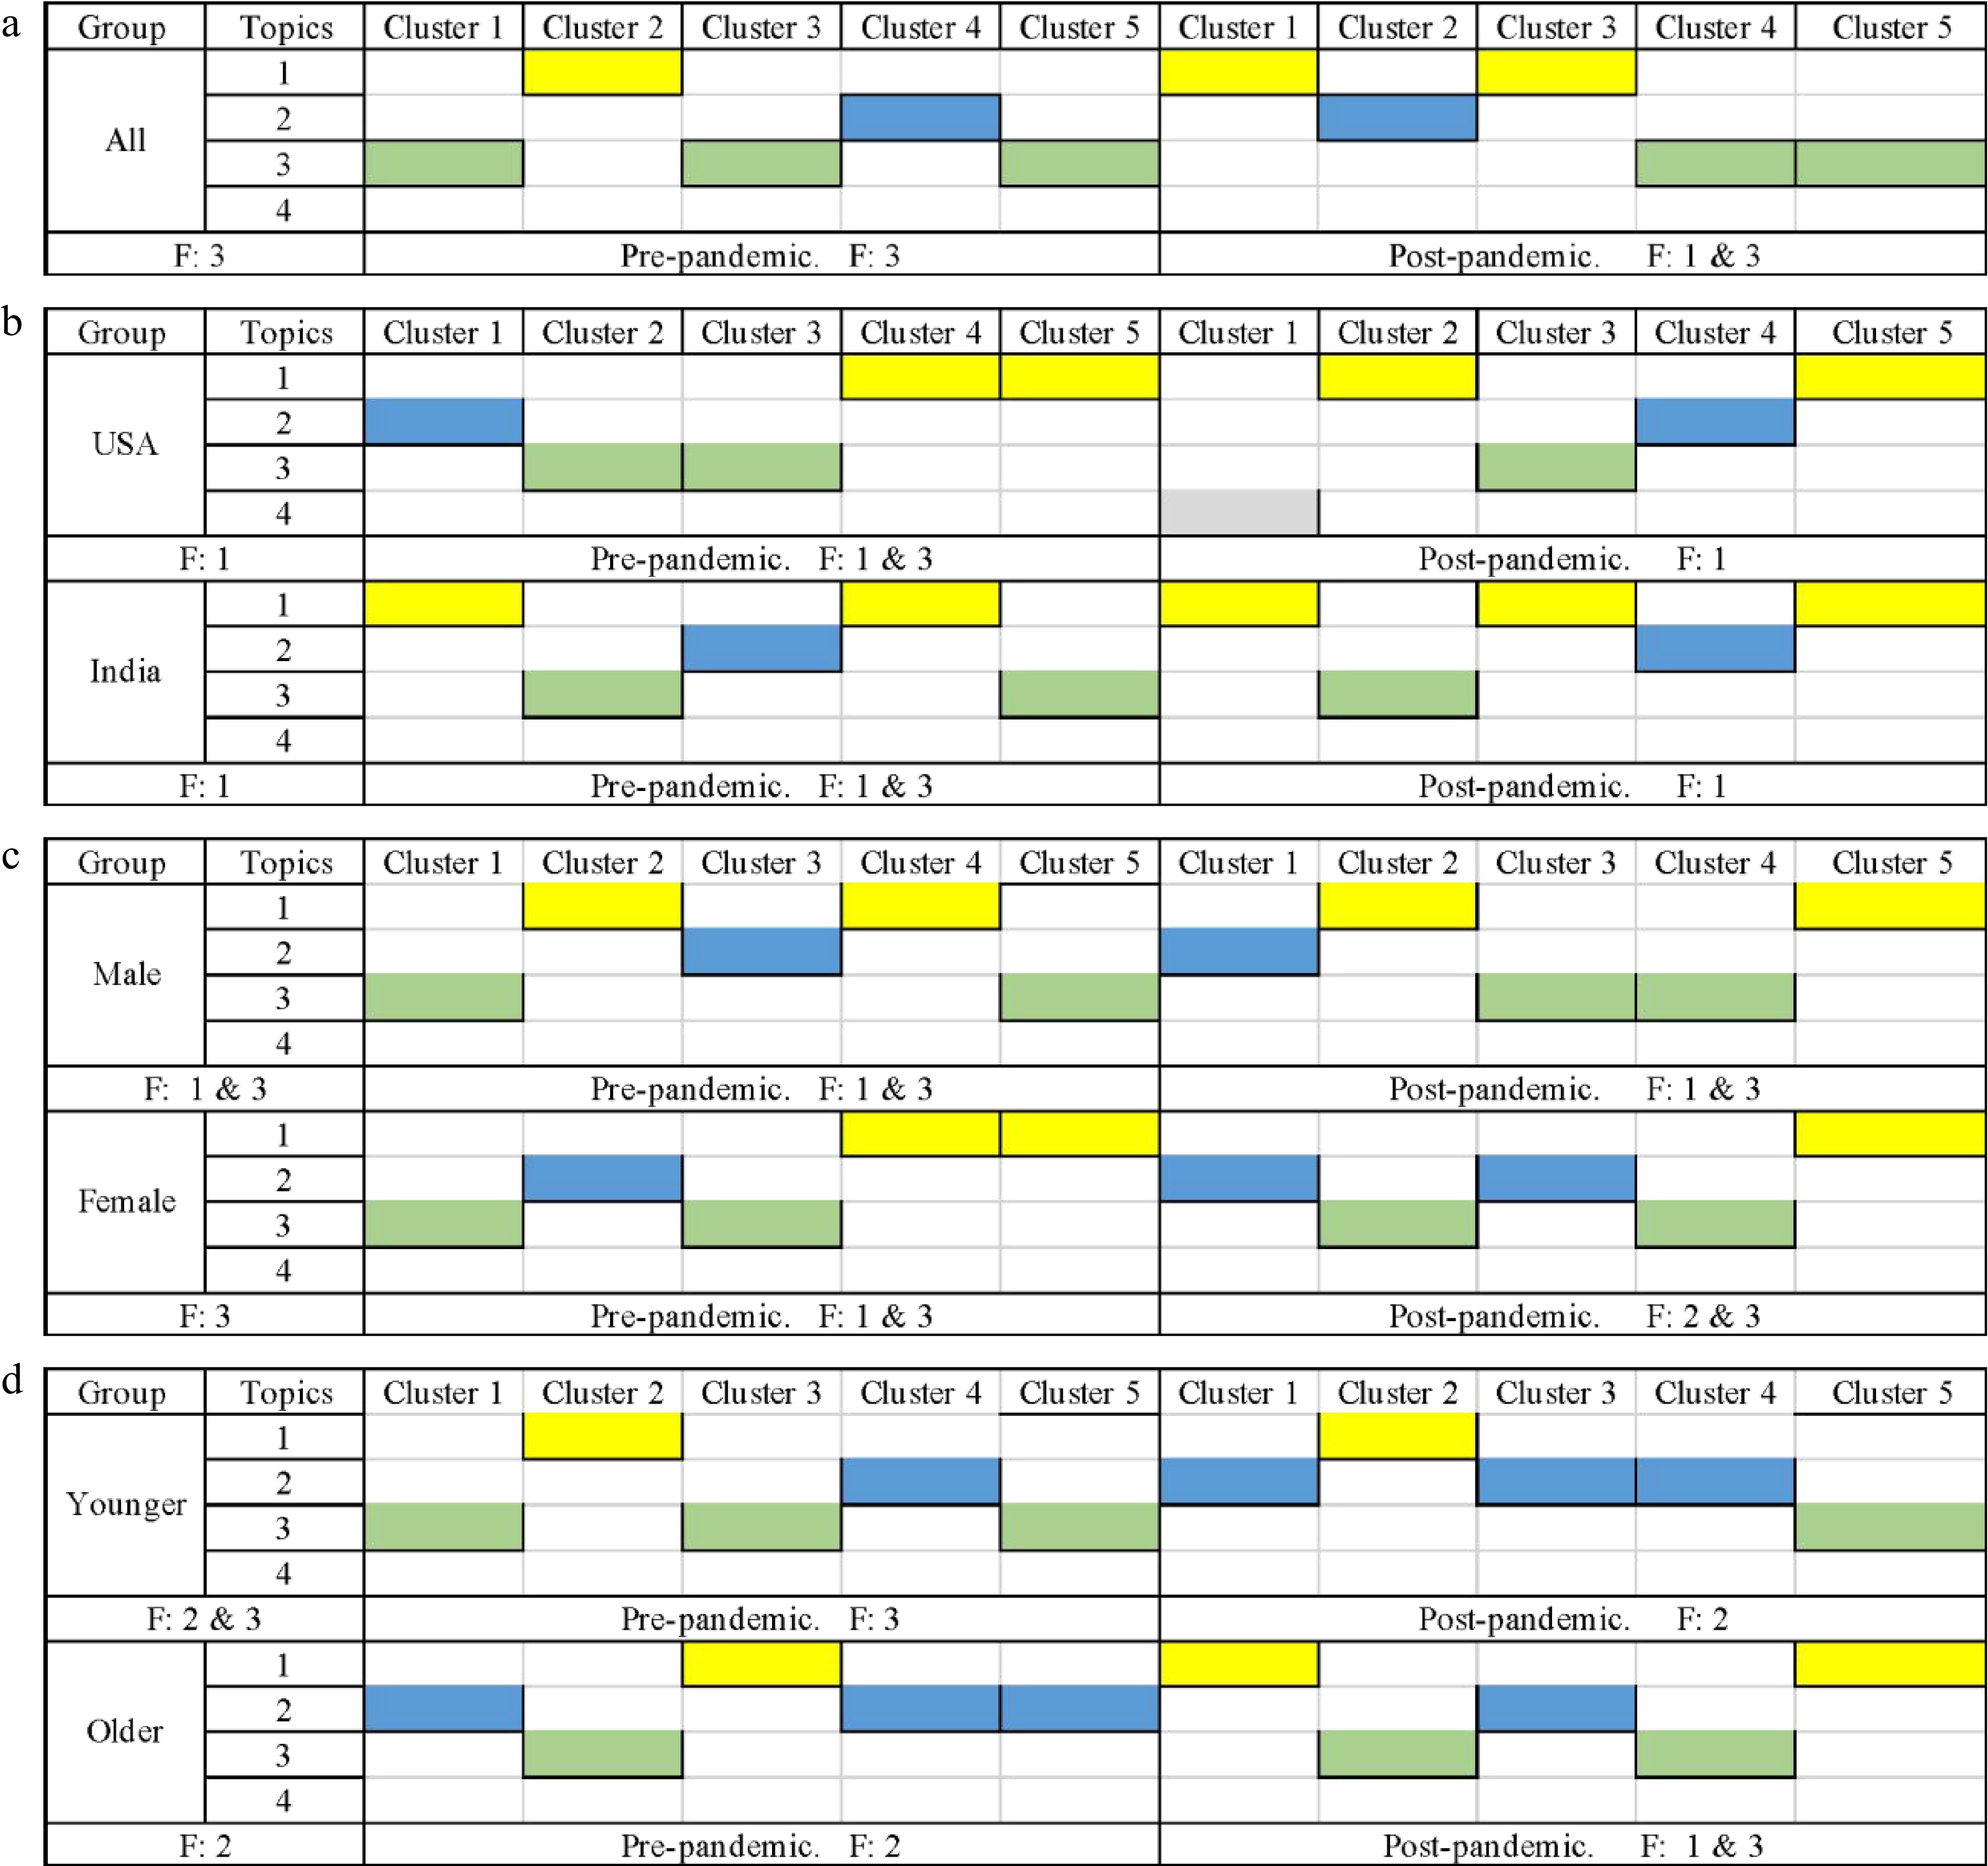
Figure 4.
The graph of ridesharing trip time topic modeling. (a) The trend graph of topics based on all tweet data. (b) The trend graph of topics in the country group. (c) The trend graph of topics in gender groups. (d) The trend graph of topics in the age group.
-
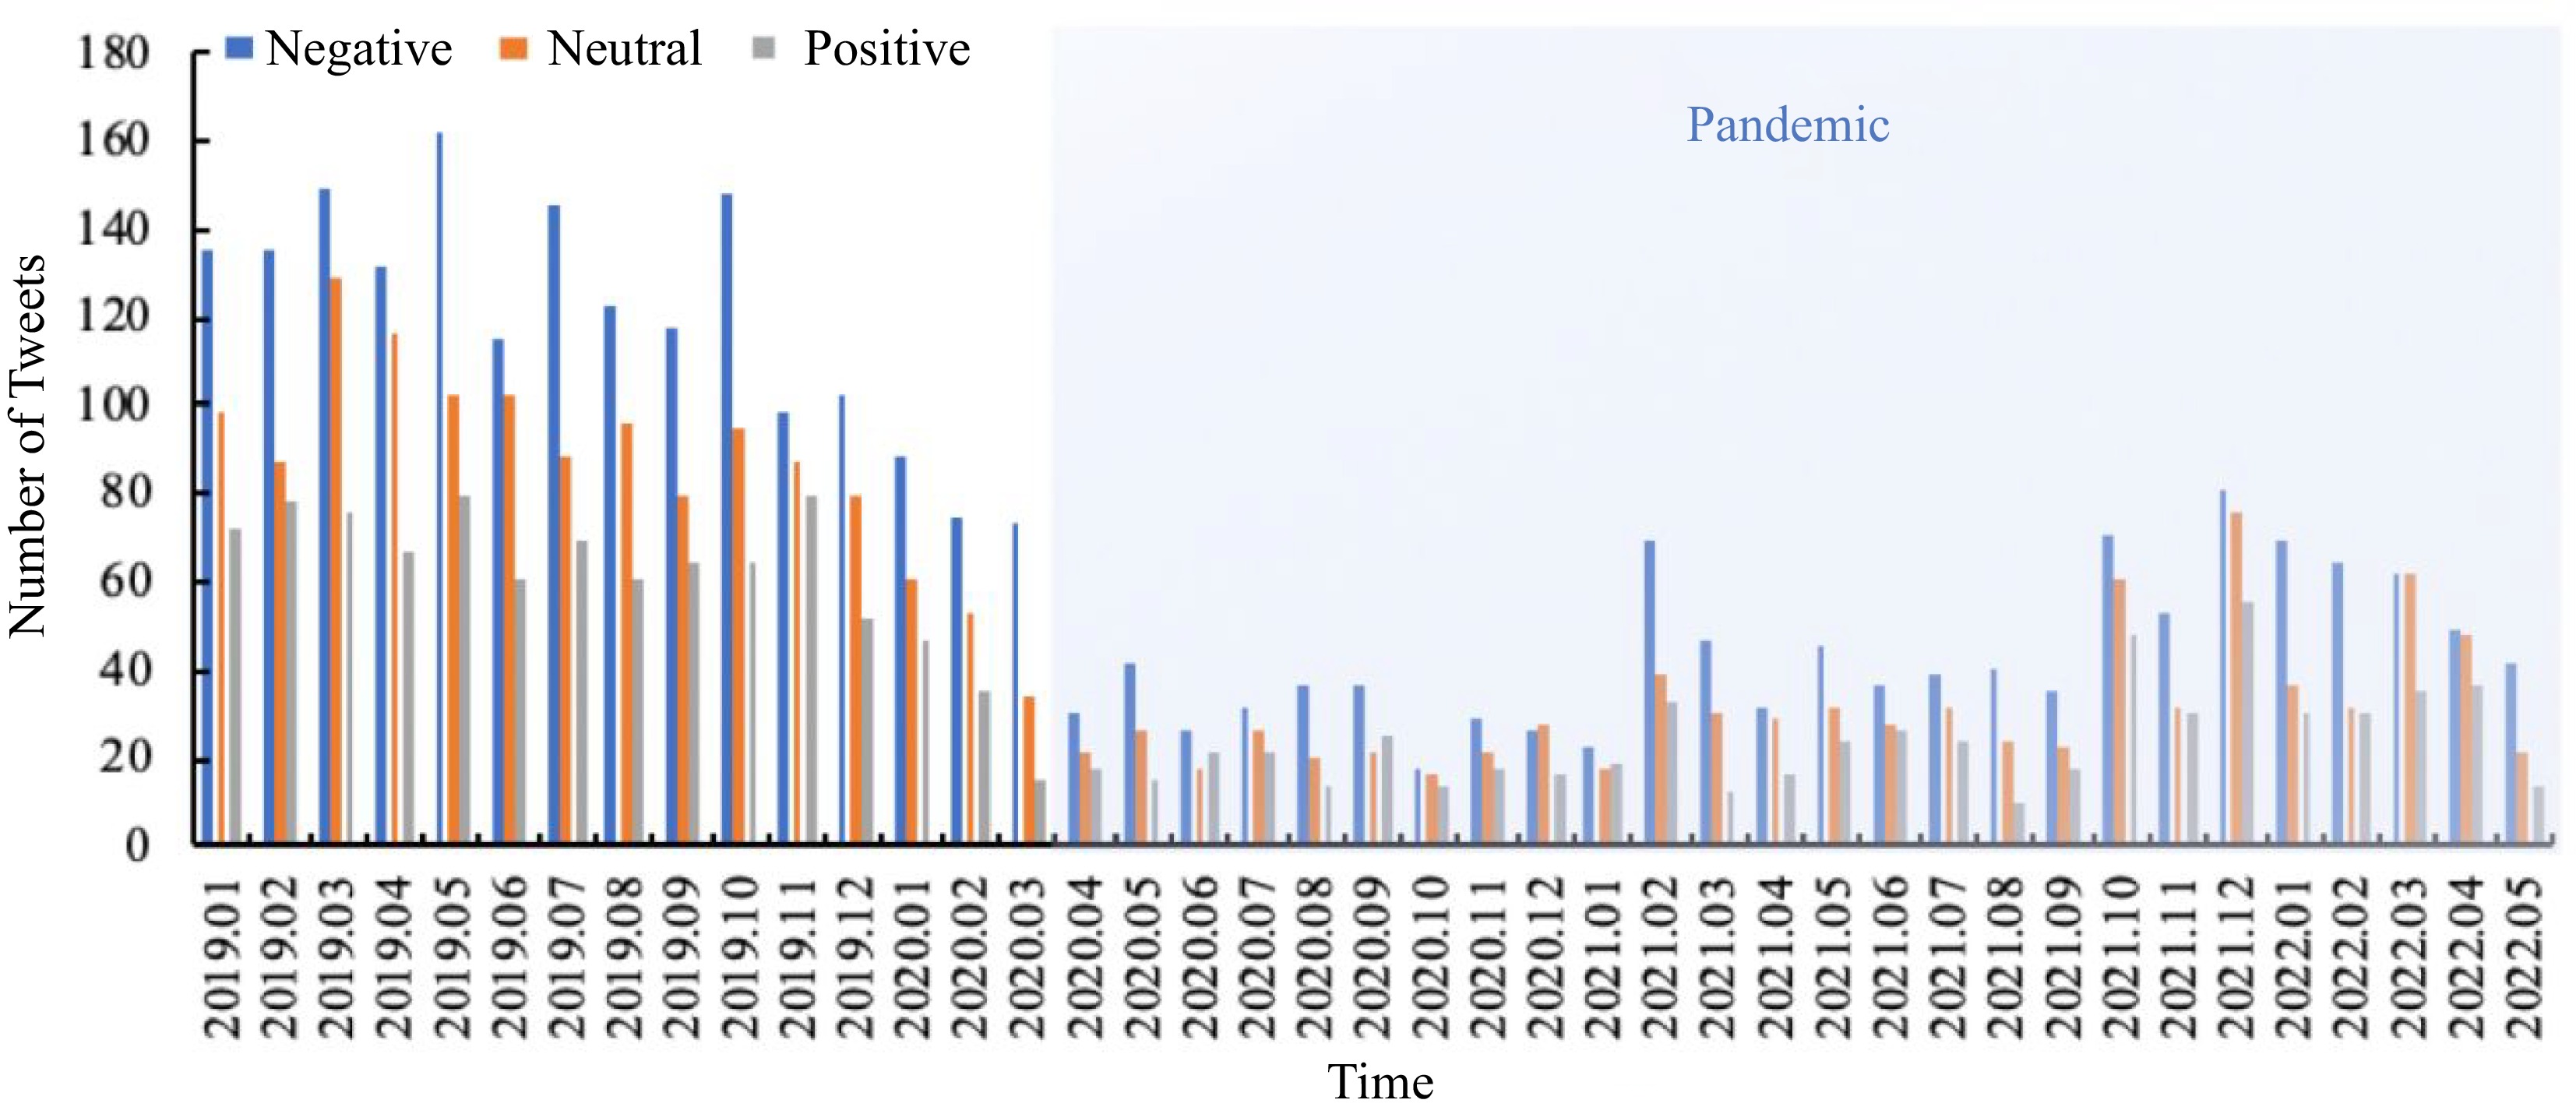
Figure 5.
Volume of ridesharing sentiments associated with time series.
-
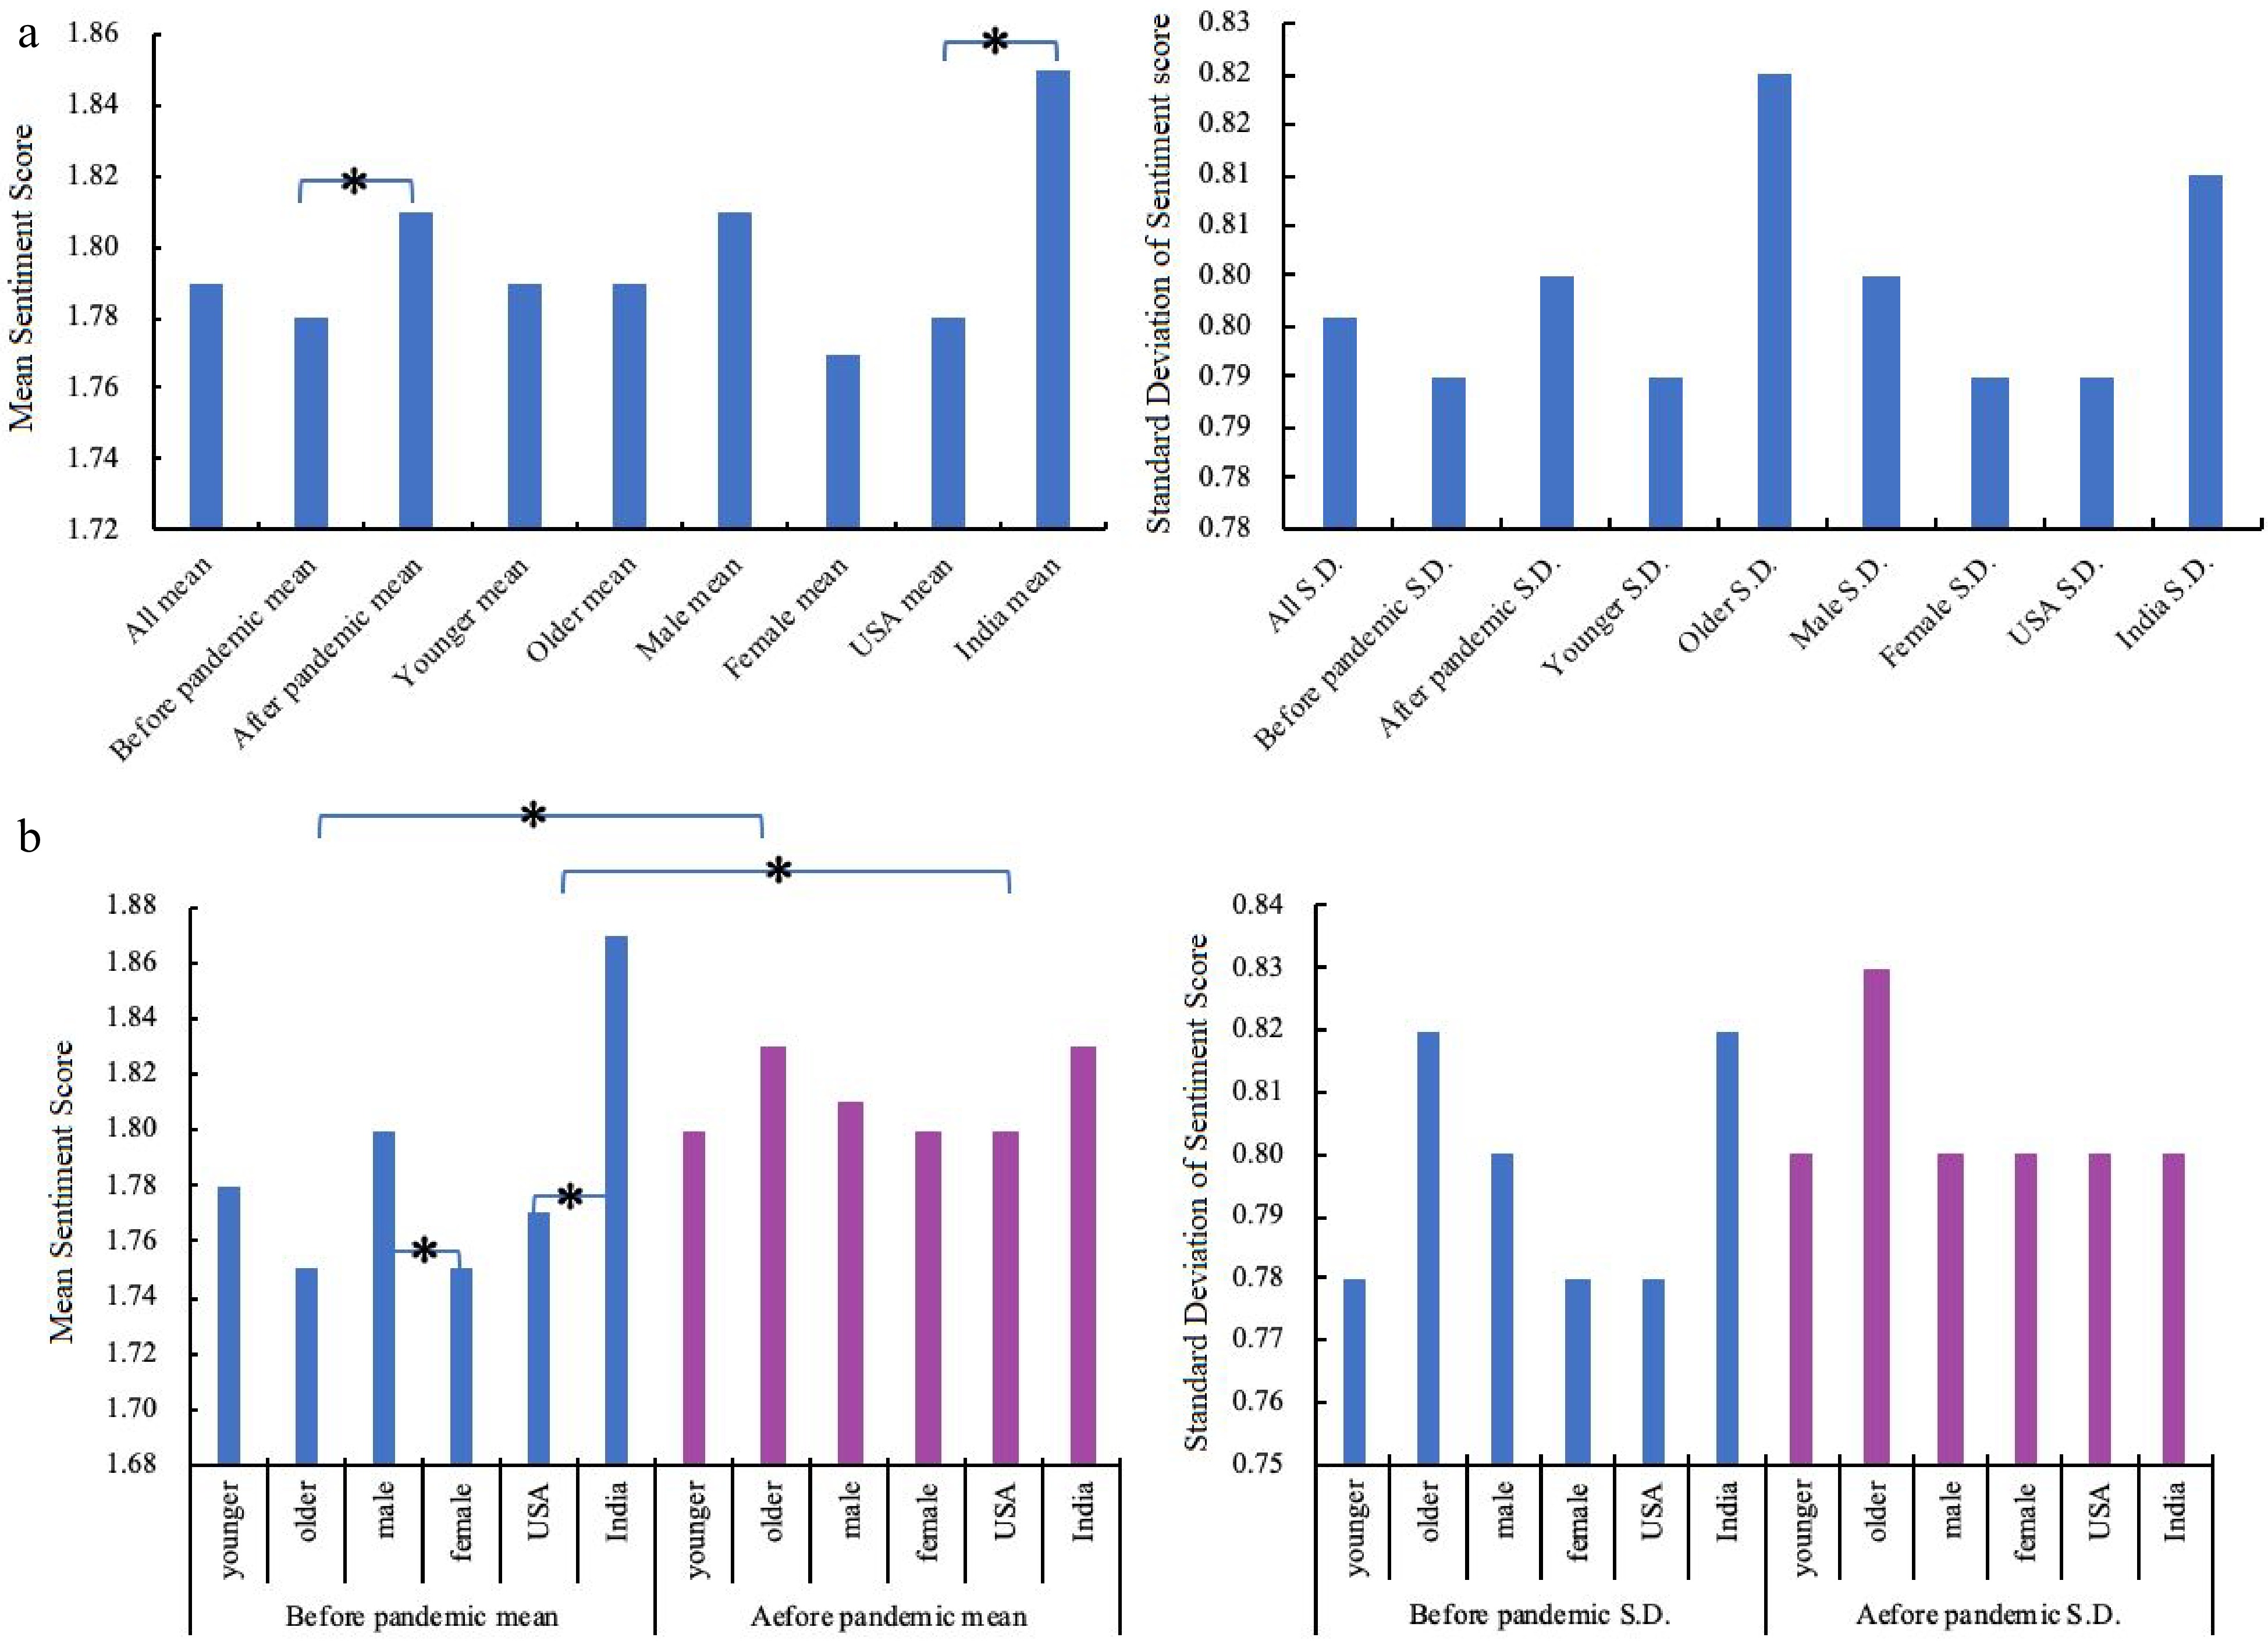
Figure 6.
Description and significant analysis of sentiment in each group. (a) The difference of sentiment among groups. (b) The difference of sentiment within and between groups pre- and amid-pandemic.
-
Data type Description Users' characteristics Gender, age, user name, user ID, followers. Timestamp The timestamp of each tweet publishes. Location The county and location of the user. Tweet The content of the tweet, the situation of the tweet (rewrite or not). Sample of the tweet before and after the filter Before filter: @Uber### I like 
After filter: I like and miss uberpool, these prices are cheaper.Table 1.
Description of the Twitter data.
-
Item Label Content Description Ridesharing trip time 1 Wait time Wait time for the car 2 Time cost The time cost from entering the car to ending the trip 3 Trip happen time Trip time of day 4 Pandemic Topic related to pandemic Table 2.
Description of labeled topics and their contents.
-
Step Items B Stad. E. Wald Freedom Sig. Exp(B) 95% CI 1 Intercept −0.48 0.15 10.19 1.00 0.00 Pandemic 0.22 0.11 3.67 1.00 0.03 1.01 0.89 1.13 Gender 0.04 0.06 0.55 1.00 0.89 1.04 0.93 1.18 Age −0.77 0.09 0.75 1.00 0.79 0.92 0.77 1.10 Country 0.33 0.12 4.45 1.00 0.02 1.12 1.01 1.23 2 Intercept −0.49 0.16 9.65 1.00 0.02 − − − Pandemic 0.12 0.13 4.66 1.00 0.03 1.05 1.01 1.15 Gender 0.01 0.12 0.01 1.00 0.97 1.00 0.79 1.27 Age 0.09 0.67 2.12 1.00 0.12 1.11 0.96 1.26 Country −0.18 0.09 3.48 1.00 0.02 1.01 0.99 1.22 Table 3.
Result of the ridesharing regression based on the multi-logit model.
Figures
(6)
Tables
(3)