


-
Research on ridesharing trip time significantly impacts users' decisions in choosing between rideshare services and rental cars. Insights into user preferences regarding trip duration guide ridesharing companies in refining service efficiency. This research informs competitive strategies, highlighting factors that drive users to opt for immediate and reliable rental car alternatives. Additionally, it contributes to urban mobility planning and discussions on sustainable transportation solutions, shaping the evolving landscape of modern transportation[1]. Contemporary research on ridesharing trip time commonly employs data analysis and survey methodologies. For instance, Zhang et al.[2] utilized a data analysis approach, determining that ridesharing trip times are notably influenced by traffic conditions and demand fluctuations. However, limitations include potential biases in questionnaire responses and challenges in obtaining comprehensive longitudinal data. Existing methods also face difficulty in thoroughly exploring users' authentic attitudes toward car usage, particularly concerning public opinion analysis, resulting in an incomplete research framework.
This study delves into the impact of ride-sharing systems on various aspects of travel, including travel time, waiting time, and daily travel patterns, with a specific focus on distinct age and gender groups. The research context is particularly pertinent considering the escalating challenges posed by heightened urbanization and technological advancements, which have led to increased traffic congestion, prolonged travel times, and environmental concerns. In response to these challenges, researchers have proposed the development of an integrated and adaptable transportation system that harmonizes public transportation with digital technology. The emergence of ride-sharing platforms, exemplified by Uber in the USA, underscores the global demand for technologically driven travel solutions. While Lyft also operates in the US market, it is crucial to note that Uber currently commands a significant share of the market[3]. However, it is imperative to acknowledge that the adoption of ride-sharing systems, particularly when supplanting traditional taxis and public transit, can potentially exacerbate issues such as heightened traffic congestion, increased Vehicle Kilometers Traveled (VKT), and a potential rise in traffic accidents[4].
Over time, it has become evident that the implementation of the ride-sharing system has not led to a substantial reduction in traffic congestion and has posed accessibility challenges for individuals with lower incomes[5]. Consequently, experts have turned their attention to alternative systems that can more effectively address issues related to traffic reduction, VKT reduction, and affordability for a broader spectrum of users. One such alternative proposed by experts is a platform-based sharing service that connects users with service providers, enabling the temporary sharing of goods and services. Ridesharing, in this context, is defined as the practice of multiple individuals sharing a car trip to reach a common destination[6]. Passengers have the flexibility to use the service for either the entirety of their journey or only a portion, as defined by Transport for London[7]. Various mobile applications are employed to manage and schedule ride-sharing services. Research has shown that ride-sharing services like Uber possess the potential to reduce individual car usage, shift the mode of transportation from single occupancy vehicles to shared rides, and promote off-peak travel, thus mitigating overall traffic congestion in urban areas[8,9].
A study conducted during the COVID-19 pandemic revealed a notable decrease in ride-sharing traffic, exceeding the overall reduction in total traffic volume. Furthermore, non-shared trips during the pandemic exhibited increased travel distances, even though travel durations did not necessarily extend due to decreased network congestion[10]. However, it is crucial to acknowledge that the ride-sharing industry faced significant disruptions due to pandemic-induced lockdowns imposed in numerous large cities[11]. Research conducted by some scholars has indicated that the number of Uber users and trips had been steadily increasing until 2019. However, the growth rate experienced a sharp decline following the onset of the COVID-19 pandemic. A similar decrease in the growth rate was also observed for the Lyft platform during the pandemic. Distinguishing between ridesharing trip time scales (before, during, and after the pandemic) when assessing car rentals is imperative for several reasons. Firstly, the pandemic has profoundly altered travel patterns, impacting the demand and availability of rideshare services. Analyzing distinct time scales allows researchers to discern how the pandemic influenced user preferences, the frequency of rideshare usage, and its subsequent effects on the car rental industry. Secondly, variations in ridesharing trip times across different phases provide insights into evolving consumer behaviors. Understanding how preferences shift during and after the pandemic empowers car rental companies to tailor their services to changing demands, ensuring relevance and competitiveness. Additionally, discerning between these time scales aids in evaluating the resilience and adaptability of the car rental industry to external shocks. This nuanced analysis assists policymakers, industry stakeholders, and researchers in developing strategies that account for the dynamic nature of consumer behavior, contributing to a more comprehensive and forward-looking understanding of the market. In essence, differentiating between ridesharing trip time scales allows for a more nuanced understanding of the complex interplay between the pandemic, ridesharing, and car rentals, guiding informed decision-making and strategic planning in the evolving landscape of urban mobility.
Social media platforms, particularly Twitter, serve as abundant sources of real-time, user-generated content, reflecting personal experiences, opinions, and emotions. Through the analysis of Twitter data, researchers can extract spontaneous and unfiltered expressions, yielding valuable insights into user perceptions of ride-sharing travel times[12]. Twitter's broad user base transforms it into a virtual forum where individuals openly share experiences, challenges, and opinions related to ridesharing. Extracting user perspectives from Twitter data facilitates the capture of diverse opinions and sentiments, providing a comprehensive understanding of factors influencing user choices and satisfaction in the ride-sharing realm[13]. The textual nature of Twitter posts aligns seamlessly with text analysis methods, enabling researchers to uncover nuanced insights into travel times, service quality, pricing, and other aspects shaping users' perceptions of ridesharing[14]. Employing advanced techniques like graph-based text extraction allows researchers to overcome challenges such as data loss, enhancing the extraction of key features and boosting the reliability of research results. Consequently, this study aims to investigate ridesharing trip times based on Twitter data, extracting relevant text features and public opinions for a thorough analysis.
Research objective
-
To delve deeper into the influence of ridesharing trip time on car rentals, this study refined methodologies in both text analysis and public opinion analysis. In text analysis, a novel graph-based text extraction method for Twitter big data is introduced to address issues like missing data and inadequate extraction of key features encountered in the current analytical process. In public opinion analysis, the existing model undergoes optimization through deep learning algorithms, rectifying inaccuracies in public opinion assessments. The specifics are outlined below: Considering the context outlined above, this study seeks to investigate the perspectives of a substantial user community within the Twitter application concerning ridesharing. The research focuses on users located in the USA and India, representing a developed and developing country, respectively, marked by significant cultural distinctions that can provide valuable insights for the effective management of ride-sharing systems, particularly during crises such as pandemics. To achieve this, a dataset comprising 63,800 Twitter posts was meticulously collected utilizing Text Mining techniques, with the inclusion of demographic details such as age, gender, and country of origin, both before and during the pandemic periods. The principal objective is to conduct a comparative analysis between the two countries based on the compiled dataset. The data analysis will be conducted employing the Bidirectional Encoder Representations from Transformers model (BERT), the Valence Aware Dictionary and sEntiment Reasoner (VADER) for sentiment analysis, and Latent Dirichlet Allocation (LDA) for topic modeling.
-
This article primarily focuses on the examination of travel time within ride-sharing systems, such as Uber, and how the COVID-19 pandemic has impacted this aspect. Additionally, it explores user perspectives within broader platforms like Twitter, even though the existing literature on this topic is limited. The significance of this issue is underscored by an analysis of pre- and post-COVID-19 literature. Ridesharing holds the potential to mitigate traffic congestion, reduce Vehicle Miles Traveled (VMT), enhance air quality, stimulate economic growth, and optimize travel time for all road users. Notably, travel time within ridesharing is perceived as more valuable compared to train or bus travel in France[15]. Consequently, individuals with higher incomes tend to prioritize their travel time, rendering ride-sharing an appealing option over other modes of transportation[16]. The value of users' time and the uncertainty of travel time have been identified as pivotal factors significantly influencing the performance of ride-sharing systems[17]. Ensuring immediate and optimal compliance is one avenue for achieving success in ride-sharing services. Ride-sharing service providers must furnish users with information regarding arrival time, travel duration, and financial benefits, as a failure to do so can result in trip cancellations. Dissatisfaction with travel time duration has also been observed among ride-sharing drivers. Research conducted in China indicates that tourists assign a higher value to travel time and are willing to pay more to reduce travel duration, particularly older residents who exhibit a propensity to pay extra to minimize waiting times[18]. Another study in China estimated that ride-sharing users saved more than 1.7 billion hours of travel time between 2016 and 2018[19]. In Mumbai, India, travel comfort is prioritized over security and waiting time[20]. A survey conducted in the USA, involving 4,365 participants, revealed that a one-minute reduction in relative travel time per mile resulted in a 33% increase in ride-sharing usage[21]. Notably, the COVID-19 pandemic induced short-term alterations in departure time, transportation mode, destination, and route choices. In Canada, a substantial portion of travel plans was either canceled or rescheduled due to extended travel durations. In China, following the pandemic, there was an improvement in the number of trips, albeit covering shorter distances. Conversely, Greece witnessed an increase in travel time during the COVID-19 pandemic. In summary, the pandemic has prompted transient shifts in travel behavior across various regions, influencing choices related to departure time, transportation mode, destination, and route.
By analyzing the attitudes towards ridesharing in different countries, we can more fully understand the impact of ridesharing trip time on ridesharing. Analyzing ridesharing in both India and the USA offers a compelling comparative perspective due to the distinct socio-economic, cultural, and infrastructural differences between the two countries. The motivation lies in understanding how these contextual disparities influence the dynamics of ridesharing services and user behaviors. India, characterized by a diverse population and varied urban landscapes, presents unique challenges and opportunities for ridesharing. Factors such as dense traffic, diverse commuting patterns, and varying economic conditions significantly impact ridesharing utilization. On the other hand, the USA, with its diverse cities and extensive transportation infrastructure, showcases a different ridesharing landscape shaped by cultural, economic, and regulatory factors. Comparing ridesharing in these countries enables researchers to draw nuanced conclusions about the adaptability of ridesharing models in diverse environments. For instance, insights into user preferences, pricing sensitivities, and the impact of regulatory frameworks can be gleaned by examining the differences in adoption patterns and service utilization. Research comparing ridesharing in different countries includes studies like 'An Analysis of Ridesharing in India: The Case of Uber and Ola'[22] and 'The Competitive Effects of the Sharing Economy: How is Uber Changing Taxis?'[23]. Understanding these variations aids ridesharing service providers, policymakers, and urban planners in tailoring strategies to specific market conditions. Additionally, it contributes to a broader understanding of the global ridesharing landscape, fostering insights that can be beneficial for the sustainable development of urban transportation systems.
Research concerning the utilization of Twitter data for the examination of user perspectives on ridesharing has evolved into an active and dynamic field. Within this realm, researchers and data scientists have harnessed Twitter data to extract insights into public sentiments, opinions, and attitudes vis-à-vis ridesharing services, including but not limited to Uber and Lyft. The primary advancements in this domain encompass two distinct methodologies. Firstly, topic modeling techniques such as Latent Dirichlet Allocation (LDA) have been instrumental in the identification of key topics and discussions related to ridesharing within the Twitter sphere. This facilitates a nuanced comprehension of the predominant themes and concerns within user conversations[24]. LDA is a widely used and robust topic modeling technique that assumes a relationship between words and documents within a corpus represented as a bag-of-words. LDA has been applied in various domains, including healthcare[25], e-petitions[26], politics[24], and evaluating social media strategies with both long-length (e.g., abstracts) and short-length (e.g., tweets) datasets[27]. For example, Pournarakis et al.[28] employed LDA for topic modeling in transportation services, developing and implementing a Genetic Algorithm based on LDA to categorize tweets into different topics, outperforming the K-means clustering approach. Another relevant study utilized Twitter data to explore ride-sharing services, indicating that LDA topic modeling efficiently extracts prevalent topics from large datasets[29].
Secondly, sentiment analysis, a commonly employed technique, serves to gauge public sentiment towards ridesharing services on Twitter. This method leverages natural language processing (NLP) and machine learning algorithms to classify tweets into positive, negative, or neutral sentiment categories, thereby shedding light on users' emotional inclinations towards ridesharing platforms[18]. BERT has gained popularity. It aims to enhance computers' comprehension of sentiment in complex language by establishing context through surrounding text. Researchers proposed an auxiliary sentence transformation (T)ABSA, which converts the single sentence classification problem into a sentence pair classification task using BERT[15,25]. The results demonstrated that BERT-pair outperformed other models in aspect detection and sentiment analysis, using the SentiHood dataset. Traditional language models could only read text sequentially and lacked bidirectional capability[30]. BERT introduced the concept of Transformers, which enabled bidirectional reading. The BERT framework was pre-trained on Wikipedia text and can be fine-tuned using a dataset of questions and answers, overcoming limitations related to data volume and dataset transfer in supervised methods[9]. In this study, BERT was employed as a reference model, and logistic regression was used for sentiment retrieval and subsequent correlation analysis.
Nonetheless, it is imperative to acknowledge the limitations intrinsic to the use of Twitter data. These limitations encompass issues such as regional bias, limited representativeness, and the formidable challenge of distinguishing authentic user opinions from automated or bot-generated content. Among these constraints, regional bias and inadequacies in data mining loom as the principal impediments to contemporary user evaluation research. In pursuit of heightened research accuracy and representativeness, this paper embarks on an exploration of the perspectives held by a substantial user community within the Twitter application pertaining to ride-sharing, drawing upon data from the USA and India. This endeavor encompasses an in-depth analysis of data features utilizing both Latent Dirichlet Allocation (LDA) and BERT. The contributions of this paper can be encapsulated as follows:
1. A comprehensive analysis of data spanning diverse regions, thereby facilitating the elucidation of varying attitudes towards carpooling. This comparative approach serves to mitigate biases stemming from regional disparities.
2. This paper introduces a novel text analysis method based on graphs. The method enhances the robustness of text data by labeling data outside the normal distribution, thereby improving the accuracy of text feature extraction.
3. The implications of this research extend to the potential optimization of internal operational strategies for ridesharing companies. It also offers the prospect of tailoring distinct timing plans for passengers based on regional nuances, thereby bolstering the competitiveness of these firms.
-
The methodology employed in this study is depicted in Fig. 1. It consists of three main components: i) Data gathering and filtering. This initial stage involves collecting tweets related to ride-sharing trip time using keyword search functionality provided by the Twitter API. Subsequently, all tweets undergo a cleaning and filtering process, which includes error deletion and reduction of text noise through appropriate techniques; ii) Ride-sharing trip time-related topic modeling. This stage focuses on extracting keywords related to trip time based on word frequency and correlation analysis. The texts specifically related to trip time are then extracted using these identified keywords. To examine the impact of passenger characteristics and the COVID-19 pandemic on topic variations, a comparison is made between topics before and during the pandemic, considering different gender, age, and country groups; iii) Sentiment analysis of ride-sharing trip time. This component employs both VADER and BERT models to evaluate the sentiment of each Twitter text. Based on model performance, a more suitable model is selected for further analysis. This stage entails the comparison of sentiment variances both pre-pandemic and during the pandemic, while also conducting an analysis of sentiment fluctuations among demographic groups, including gender, age, and across different countries.
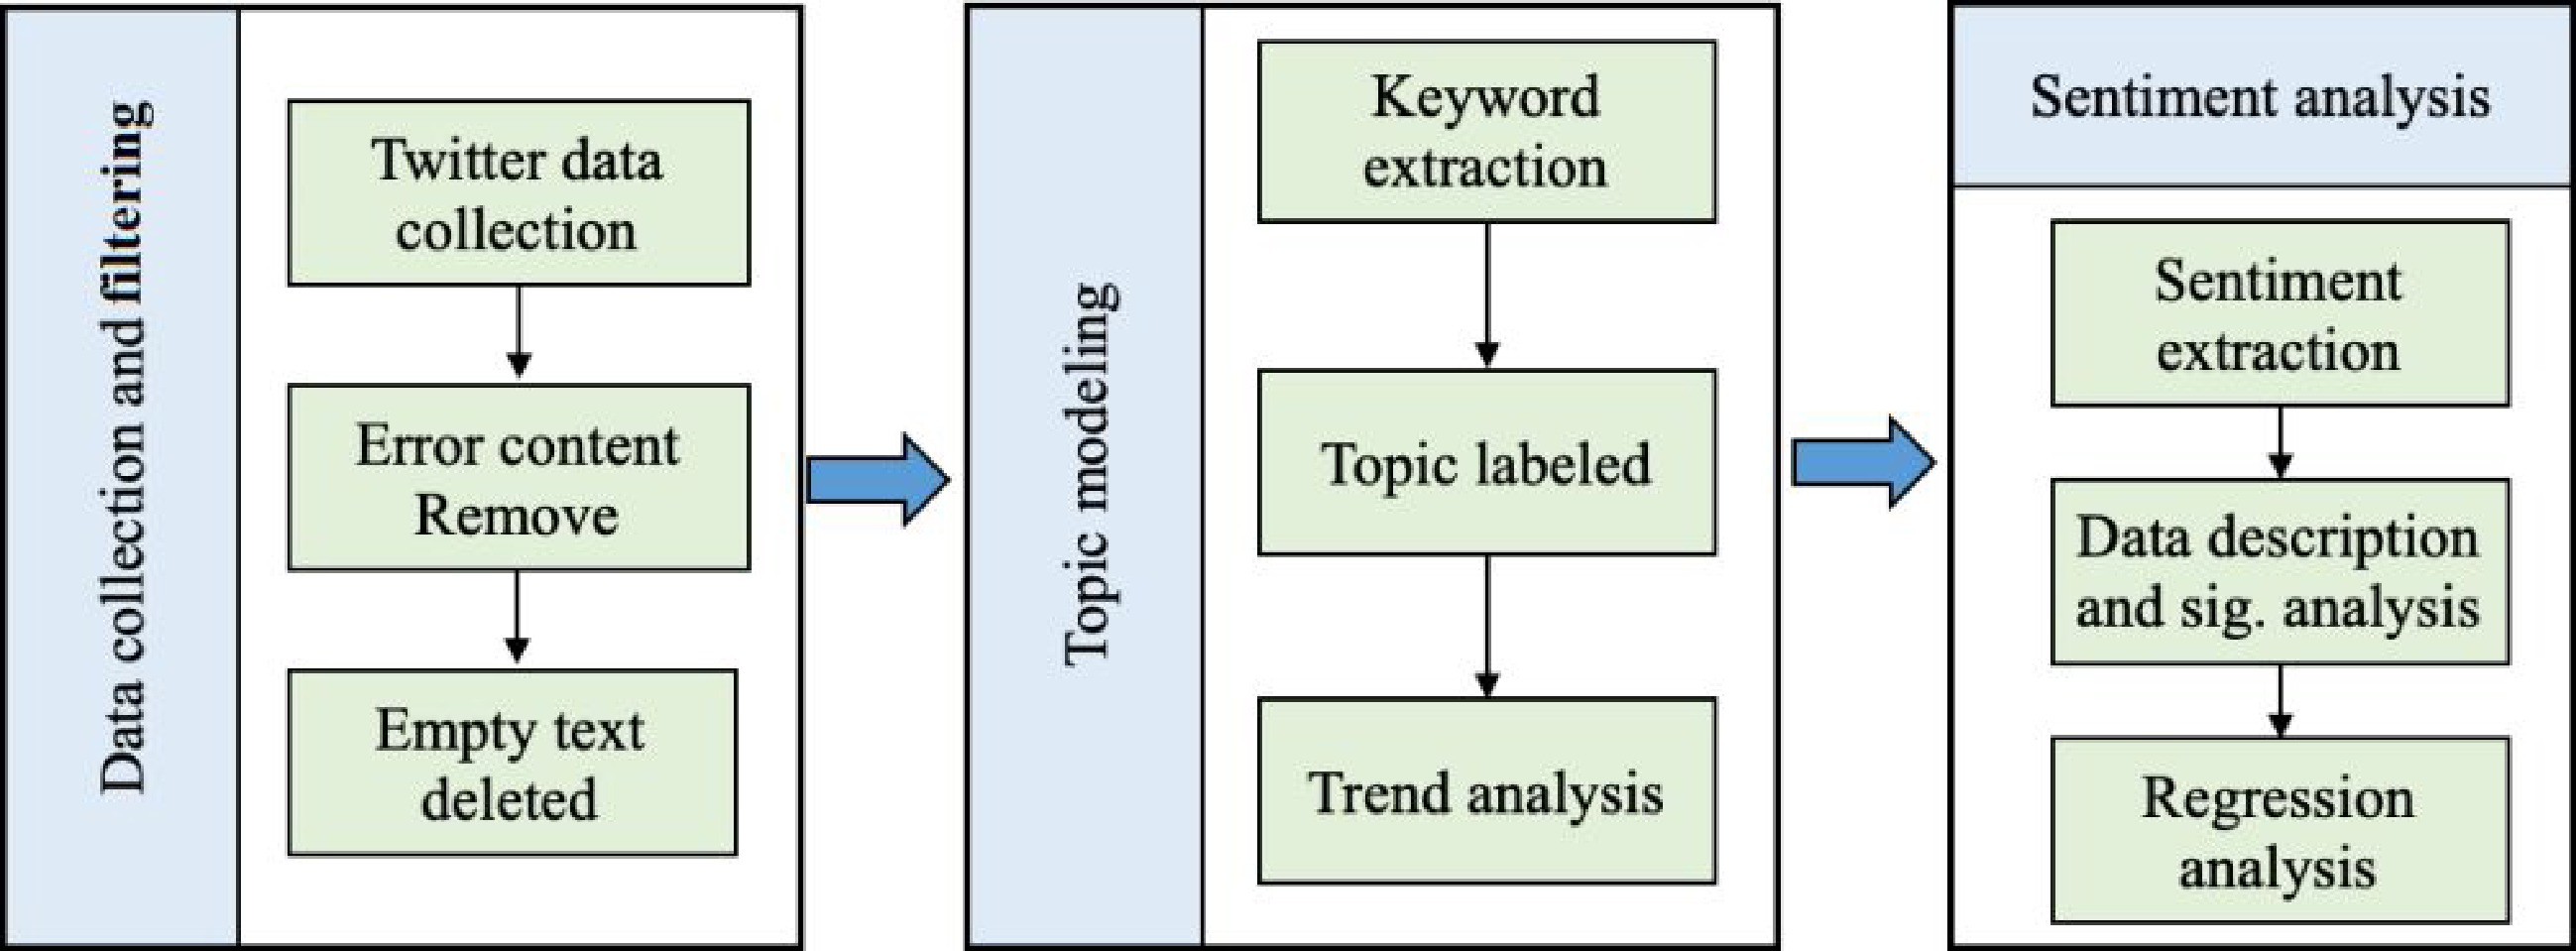
Figure 1.
Flowchart of the methodology framework.
Data collection and filtering
-
The data collection process involved utilizing an advanced Twitter scraping tool called Twitter Intelligence Tool. The keywords used for data acquisition included terms such as 'Uber Pool', 'Uber Black', 'Uber Comfort', 'Uber X', 'Lyft XL', 'Lyft Shared', 'Lyft Lux', 'Lyft Black', 'Ola KaaliPeeli', 'Lyft Line', 'BlaBlaCar Carpool', 'Sride', 'Ibibo Ryde', 'Meru Carpool', 'Ola Share', and 'Ola Carpool', along with their related variations. The data in the form of text were collected from January 1, 2019 to May 4, 2022. The selection criteria included location (USA and India) and language (English). Duplicated texts were eliminated, and spam texts were removed using a spam detection method. It is important to note that data quality issues, such as missing information, nonsensical characters, and noise, were present in the Twitter database. Nonsensical characters, including emojis, emoticons, URL paths, numbers, punctuation marks, symbols, English stop words, non-alphabetical words, and tokens with less than one character, were removed from the sentences. Furthermore, the dimensionality of the text was reduced using Part of Speech Tagging, transforming each sentence into nouns, verbs, adverbs, and adjectives. The words were also stemmed using the Snowball method. This study obtained Twitter data based on the Twitter API, which includes information such as user age, gender, user name, address, and published tweets. Detailed descriptions of the data are provided in Table 1.
Table 1. Description of the Twitter data.
Data type Description Users' characteristics Gender, age, user name, user ID, followers. Timestamp The timestamp of each tweet publishes. Location The county and location of the user. Tweet The content of the tweet, the situation of the tweet (rewrite or not). Sample of the tweet before and after the filter Before filter: @Uber### I like 
After filter: I like and miss uberpool, these prices are cheaper.Topic modeling of ridesharing service
Time-related tweet extraction
-
The primary focus of this study centers around ride-sharing trip time. Consequently, tweets pertinent to our research were retained for further analysis. To identify the relevant tweets, a flash-text model in Python was utilized to extract high-frequency words from the original dataset. A collection of 2,000 high-frequency words was obtained from the dataset. Subsequently, words associated with ride-sharing trip time, such as time cost, wait, tonight, and others, were selected from the 2,000 words. These selected words were then used to filter and extract ride-sharing trip time-related tweets. Following the data selection process, a total of 6,130 texts related to ride-sharing trip time, contributed by 5,593 distinct Twitter users, were retained for analysis.
In this study, it is noteworthy that the pandemic's impact on the public in both countries exhibits variations, and the availability of specific online data points is limited. Consequently, this article has adopted the official report indicating the commencement of pandemic-related measures in March 2020 as the definitive event threshold to assess the pandemic's influence on ridesharing. The data categorized as pre-pandemic consisted of 3,621 texts, whereas the amid-pandemic data encompassed 2,509 texts. With regards to gender comparison, 3,268 texts were attributed to males, while 2,862 texts were attributed to females. The mean age of the users was 29.12, with a standard deviation of 6.07. For the purpose of categorization, this study employed an age threshold of 35, dividing the users into younger and older categories. The number of tweets belonging to the younger category was 4,030, while the older category comprised 2,100 tweets. It should be noted that the countries under consideration in this study are the USA and India. Specifically, 5,330 texts originated from the USA, while 800 texts were associated with India.
This paper employs the Latent Dirichlet Allocation (LDA) model to extract keywords and clusters related to ride-sharing trip time. LDA is a dynamic statistical model that allows for the identification of unobserved groups or topics that explain the similarity among sets of observations in the data. In the context of this study, where the observations are words organized into documents, LDA assumes that each document is a mixture of a few distinct topics, and the appearance of each word is associated with one of these topics. Typically, LDA aims to capture the correlations between topics and documents (P(T|D)), as well as the relationships between words and topics (P(W|T)). This correlation can be represented by the following formula (1):
$ P\left(W|D\right)=P\left(W|T\right)\times P\left(T\right|D) $ (1) The probability of each word i given a topic k is denoted as P(Wi|Tk), while the probability of each topic k given a document j is represented as P(Tk|Dj). The determination of each topic's keywords is based on the descending order of P(Wi|Tk), and the probability P(Tk|Dj) is used to extract the weight of the topic in the documents.
To uncover the underlying structure of latent topics in the dataset using LDA, this study utilizes the Gensim library in Python. The library supports multi-threading, enabling efficient and rapid computation of the algorithm. The focus of this paper is to explore the differences in topics among different country, gender, and age groups before and during the pandemic. Consequently, the data is divided into seven groups: all tweets, USA user tweets, India user tweets, male user tweets, female user tweets, younger user tweets, and older user tweets. Subsequently, a total of 14 documents, encompassing these seven groups pre- and amid-pandemic from January 2019 to May 2022, are employed for topic modeling using the LDA model. This study assesses the quality and interpretability of Latent Dirichlet Allocation (LDA) model classification using widely employed metrics, specifically C_v and UMass[31]. These metrics serve to evaluate the descriptiveness of topics post-classification. Utilizing this indicator, the study determined the optimal number of categories (five clusters) based on optimal parameters. Ultimately, 35 clusters, each comprising 20 keywords, are extracted from the analysis.
Topic labeling based on keyword combinations
-
This study introduces a categorization method for distinct categories using a topic labeling approach to accomplish text feature extraction. The method comprises three sequential steps: cluster ordering, topic generation, and dataset labeling. In the first step, clusters are reordered based on their coherence scores. Coherence measures the semantic similarity between high-scoring words within a cluster, with higher scores indicating better cluster performance. Thus, the five clusters are sorted according to enhanced coherence scores. The main step, topic generation, begins by selecting the three most discussed topics from recent research, namely trip time cost, waiting time, and trip occurrence time. Initially, these topics serve as reference topics. Each keyword in the cluster is then assigned a score on a 10-point Likert scale (ranging from 1 to 10) based on its correlation with the three reference topics. A score of 10 implies a high probability of the keyword belonging to a specific topic. If a keyword scores 1 in all topics, a new topic is created based on its meaning. For example, if the word 'pandemic' does not belong to any existing topic, a new topic called 'pandemic' is formed. In the dataset labeling step, topics are generated and labeled as topic-1, topic-2, topic-3, and topic-4. Each cluster is then labeled as a topic based on the frequency of its corresponding keywords. As depicted in Fig. 2, let's consider cluster 1 in the male group during the amid-pandemic period. Each keyword within the cluster is assigned a topic label, and based on the frequency of keyword assignments, the cluster is labeled as topic 2. It should be noted that only meaningful keywords are retained for topic modeling, while irrelevant words (e.g., can, much) are removed. After labeling each cluster, the paper proceeds to compare the differences between pre- and amid-pandemic periods for each group, based on the variation in hot topics and topic trends.
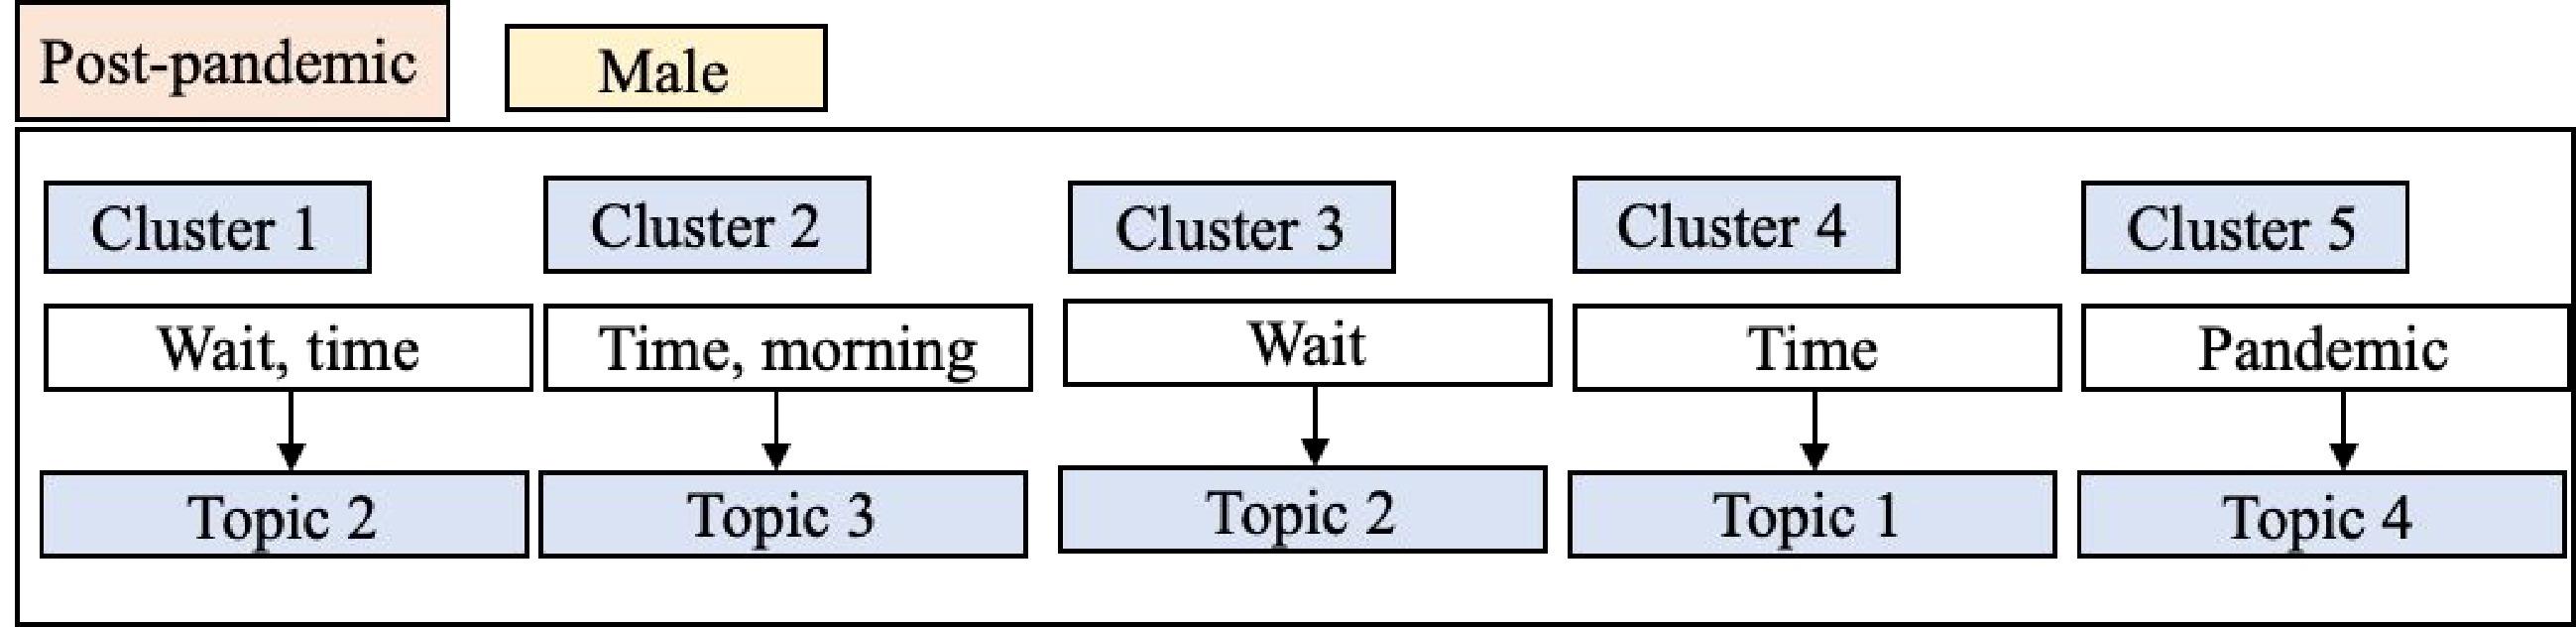
Figure 2.
Example of topic labeling.
Sentiment analysis
-
Sentiment analysis serves as a valuable tool for classifying the polarity of a given document, enabling the assignment of a score to indicate whether the expressed opinion within the document is positive, negative, or neutral. In this study, both the VADER and BERT models are utilized for sentiment extraction from each text. Subsequently, the paper proceeds to analyze the data description and significance in relation to the pre- and amid-pandemic periods. To interpret the correlation between passengers' characteristics, countries, sentiment, and the pre- and amid-pandemic periods, logistic regression is employed. The regression model is constructed based on these variables, enabling an understanding of their influence on sentiment. Therefore, the following sections introduce the VADER and BERT models, as well as logistic regression, which are all relevant to the objectives of this paper.
VADER model
-
VADER is a sentiment analysis tool that utilizes a lexicon and rule-based approach specifically designed for capturing sentiments expressed on social media platforms. The VADER method employs a sentiment lexicon, which comprises lexical features, such as words, classified as positive or negative based on their semantic orientation. However, VADER goes beyond providing mere Positivity and Negativity scores; it also offers insights into the intensity of sentiment. The VADER lexicon has proven to be particularly effective in analyzing sentiments in the context of social media[32]. The correlation coefficient between VADER scores (r = 0.881) and actual human raters' assessments (r = 0.888) demonstrates the tool's accuracy in matching the ground truth sentiment intensity, as determined by a group mean collected from 20 human raters. In this study, the VADER model is implemented using the Vader module within Python. Lexical features with non-zero mean ratings and a standard deviation below 2.5, based on the evaluations of ten independent raters, are retained. Sentiment intensity is measured on a scale ranging from –4 to +4. For example, the term 'okay' has a positive valence of 0.9, 'good' is rated at 1.9, and 'great' at 3.1. Conversely, 'horrible' is assigned a valence of –2.5, the frowning emoticon ':( ' receives –2.2, and both 'sucks' and 'sux' are rated at –1.5. Further details and the availability of VADER for download can be found in Qi & Shabrina[33].
BERT model
-
The sentiment model utilizing BERT analysis achieves a higher accuracy rate of 92% when utilizing the cased version of BERT. The model consists of one or more input sequences, with the addition of special tokens 'CLS' and 'SEP' to mark the beginning and separation of segments, respectively. Word embeddings are employed to represent each token, which are then concatenated with position embeddings and segment embeddings. Each model comprises two sublayers: a multi-head attention mechanism with A heads and a hidden size of H, and a fully connected layer with position-wise feed-forward. The output of each sublayer is added to the normalized sum of the sublayer input and outputs. Two vectors, S and E, both with dimensions of (1 × 768), are defined and learned during the fine-tuning process. A dot product is then computed between these vectors and the output vectors of the second sentence from BERT, resulting in scores. SoftMax is applied to these scores to obtain probabilities. During training, the objective is to maximize the log-likelihood of the correct start and end positions.
In this study, the BERT base model is utilized with specific configuration values: L = 12 for the number of transformer layers, A = 12 for the number of self-attention heads, and H = 768 for the hidden size. Typically, BERT accepts input sequences with a maximum length of 512 tokens. However, given the shorter length of tweets, the maximum sequence length is reduced to 128 tokens for this paper. The model's parameter settings are as follows: learning rate: 0.0001, batch size: 8, epochs: 10, and max sequence length: 128. The parameters outlined above have been meticulously controlled and can serve as valuable points of reference for future research endeavors.
Multi-logit regression
-
Consequently, the sentiment results from the BERT model were utilized for subsequent analysis. Finally, correlation analysis is performed using a multi-logit regression model to examine the relationship between each variable and sentiment.
The Multinomial Logistic Regression, commonly referred to as Multi-logit regression, is a statistical method used when the dependent variable has more than two discrete and unordered categories. It is an extension of binary logistic regression, allowing for the analysis of situations with multiple outcome levels. The method estimates the relationship between predictor variables and the log-odds of an observation belonging to a specific category vs the reference category. The logistic function is applied to the linear combination of predictors, converting the log-odds into probabilities. The model parameters are typically estimated using maximum likelihood estimation. By providing insights into the factors influencing different outcome categories simultaneously, multinomial logistic regression is a valuable tool in various fields, enabling researchers to understand and interpret complex relationships within categorical data.
The multinomial logistic regression model involves estimating multiple sets of coefficients, each corresponding to one outcome category, relative to a reference category. The model is expressed as follows:
${\rm{ln}}(P(Y_{i}=K)/P(Y_{i}=k))=\beta_{0k}+\beta_{1k}X_{1i}+\beta_{2k}X_{2i}+…+\beta_{pk}X_{pi } $ (2) Where: P(Yi = k) is the probability of observation i belonging to category k, P(Yi = K) is the probability of observation i belonging to the reference category K, β0k is the intercept for category k, β1k, β2k, …, βpk are the coefficients associated with predictor variables X1i, X2i, …, Xpi for category k.
-
Tweets pertaining to ridesharing trip time were collected from the original dataset, and subsequently, a ridesharing trip time dataset was constructed. The frequency of tweets for each month is presented in Fig. 3. The findings reveal a significant decrease in the number of tweets during the period of January to April 2020. This decline is highly likely attributed to a reduction in the number of ridesharing users amidst the pandemic. However, starting from February 2021, there is an increase in the number of tweets, indicating a stable wave-like trend. This suggests that initially, people were sharing their concerns and opinions on alternative transportation platforms or other topics during the pandemic. Subsequently, they returned to discussing ridesharing trip time as a topic of interest.
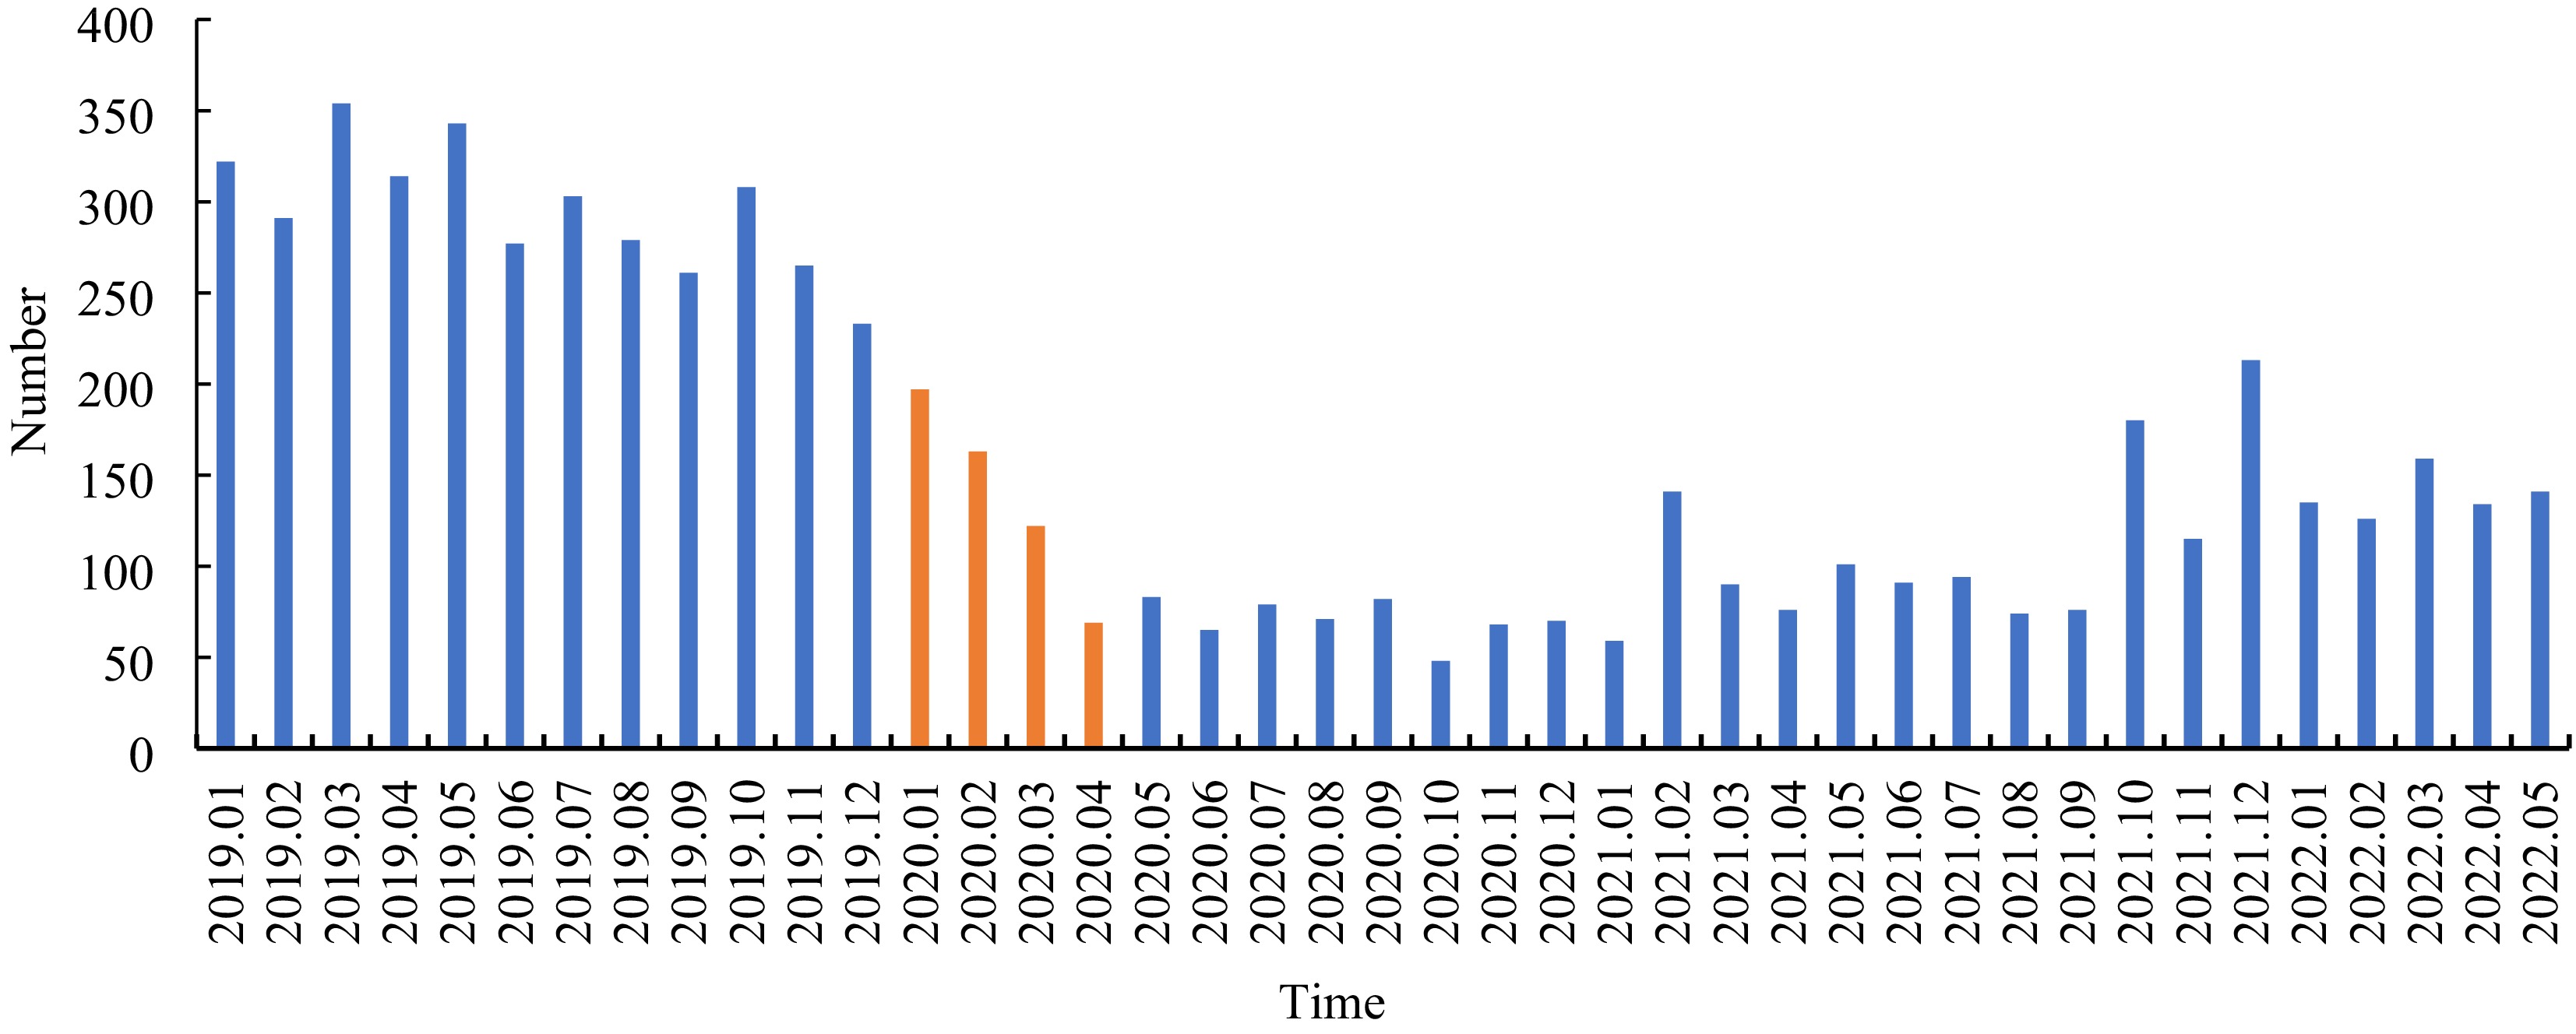
Figure 3.
The tweet frequency each month.
Topic modeling and development trend analysis
-
As outlined in the methodology section, the extraction of the most prominent topics in each group during the pre- and amid-pandemic periods was carried out using the LDA. The clusters for the seven groups (all, USA, India, male, female, younger, older) were extracted, followed by sorting them based on the coherence score. Subsequently, the topics were labeled utilizing the proposed method, resulting in the identification of four distinct topics. For a comprehensive understanding of each topic and its content, please refer to Table 2.
Table 2. Description of labeled topics and their contents.
Item Label Content Description Ridesharing trip time 1 Wait time Wait time for the car 2 Time cost The time cost from entering the car to ending the trip 3 Trip happen time Trip time of day 4 Pandemic Topic related to pandemic The distribution of topics across five clusters is depicted in Fig. 4. The left side of the graph displays the group labels and ridesharing trip time labels, while the center of the graph illustrates the topic distribution, with each topic assigned a specific color. The frequency of each topic in all periods, including pre-pandemic and amid-pandemic, is represented by the 'F' value in the graph. The results reveal that the topic of trip happen time (3) is the most prominent across all periods, and its distribution shows variation between the pre-pandemic and amid-pandemic periods. Additionally, the topic of 'wait time' (1) garners increased attention amid the pandemic, suggesting that passengers are more concerned about the timing of their trips, particularly in the morning and other times. Moreover, the wait time may have increased due to the pandemic, leading to heightened passenger concern during this period.
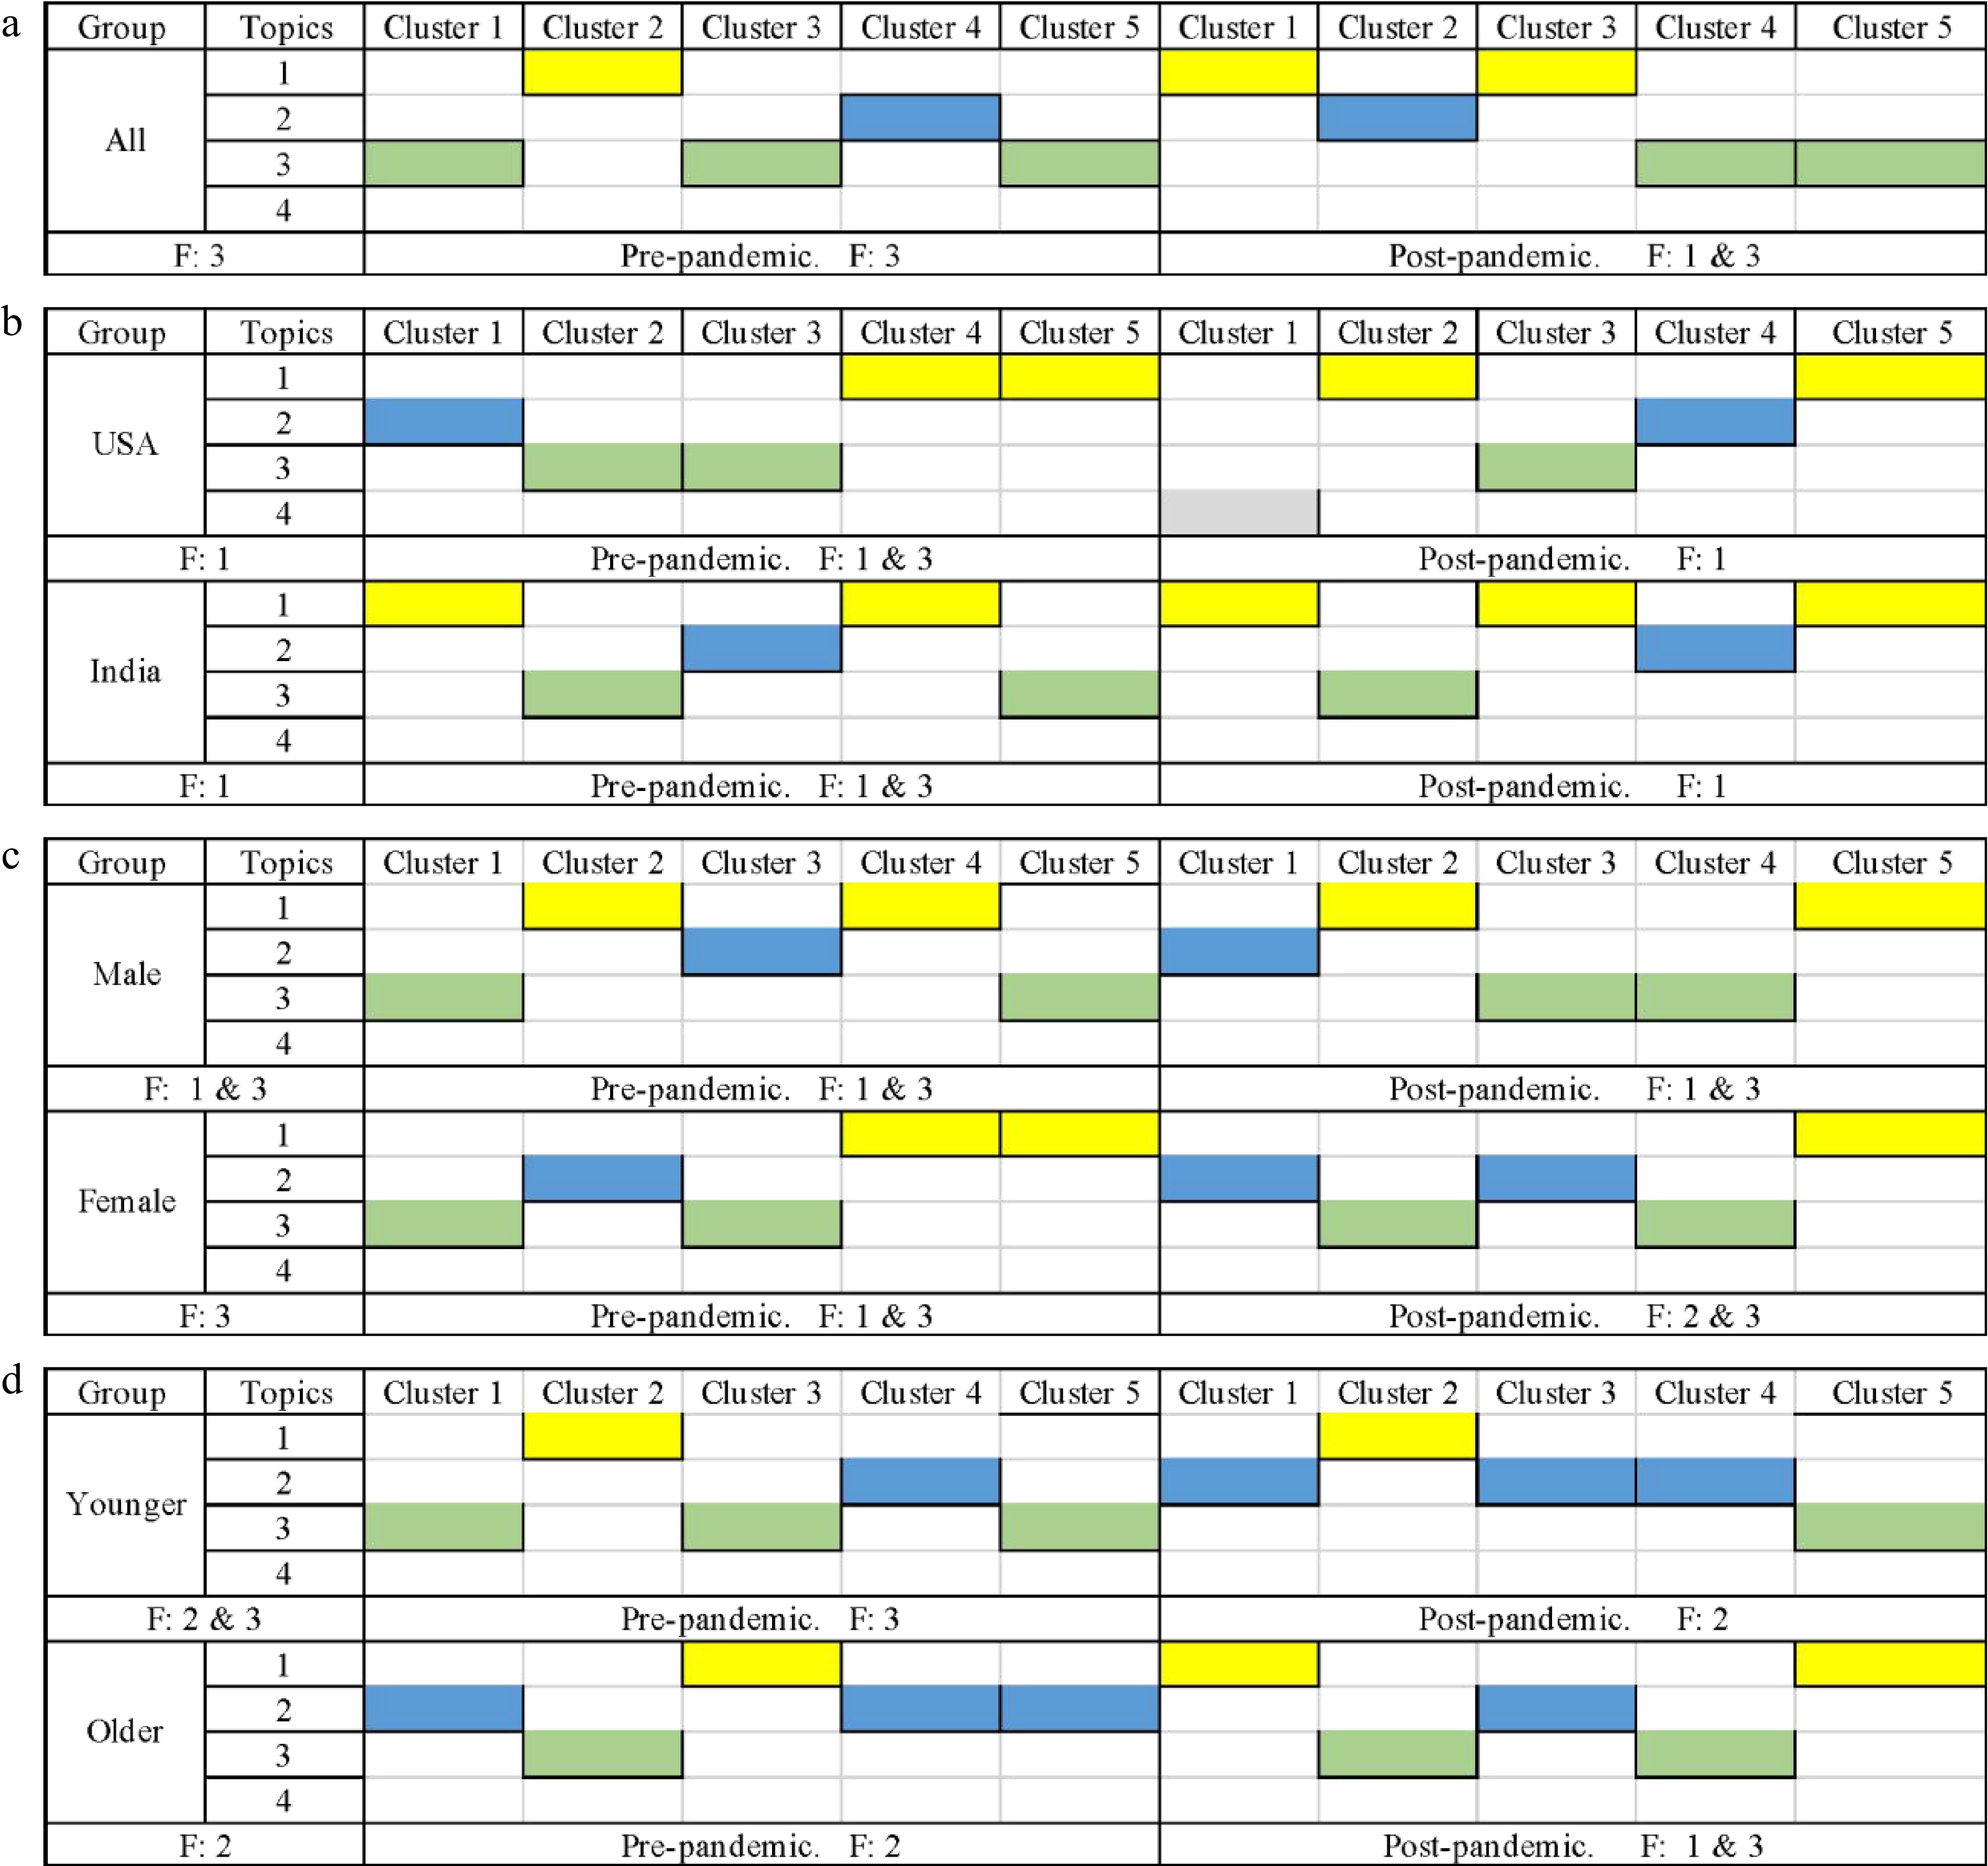
Figure 4.
The graph of ridesharing trip time topic modeling. (a) The trend graph of topics based on all tweet data. (b) The trend graph of topics in the country group. (c) The trend graph of topics in gender groups. (d) The trend graph of topics in the age group.
Regarding the country groups, both users from the USA and India demonstrate a focus on topic '1'. However, users in the USA exhibit a higher level of concern about the pandemic compared to their counterparts in India. In both groups, there is a greater emphasis on topics '1' and '3' during the pre-pandemic period, but the concern about topic '3' decreases amid the pandemic. This suggests that customers prioritize the service of the driver, specifically the pickup time, during the pandemic.
Within the gender groups, both males and females pay attention to topic '3', with males showing a higher level of interest in topic '1' compared to females. The most discussed topics among males are '1 & 3' during both pre-pandemic and amid-pandemic periods. In contrast, females demonstrate a shift in their most discussed topics from '1 & 3' during the pre-pandemic period to '2 & 3' amid the pandemic. This indicates that females are more concerned about the time cost of their trips during the pandemic.
In the age groups, both younger and older individuals display a significant interest in topic '2', but the younger group exhibits a greater concern for topic '3'. When comparing the pre-pandemic and amid-pandemic periods, both groups exhibit noticeable differences. Among the younger group, topic '2' receives more attention amid the pandemic compared to topic '3', suggesting that younger individuals are more focused on the time cost of their trips during this period. Conversely, topic '2' is not as popular among the older group during the pandemic, indicating that older individuals pay less attention to time cost amid the ongoing health crisis.
Sentiment analysis of ridesharing services
Sensitive and significant analysis
-
The sentiment analysis of tweets was conducted using the VADER and BERT models. The implementation of these models was performed on an Intel (R) Xeon (R) Silver 4110 CPU @ 2.10 GHz with 64 GB RAM, and an IDE disk running the Centos 7.6 operating system. The algorithm was developed using the Anaconda 2021.03 open-source software in Python. To fine-tune the models, NVIDIA V100 GPUs were utilized. The BERT model achieved a higher accuracy of 87% in approximating the ground truth compared to the VADER model, which had an accuracy of 61%. To validate the model's applicability further, the sentiment of 400 tweets was manually checked. The results demonstrated that the BERT model maintained a high accuracy of 72.3% and exhibited a lower Mean Absolute Error (0.15) compared to VADER (accuracy = 52%, Mean Absolute Error = 0.32). These findings indicate that the BERT model performs well in addressing the sentiment analysis challenges posed by Twitter data. Consequently, the sentiment results from the BERT model were utilized for subsequent analysis. Finally, correlation analysis is performed using a multi-logit regression model to examine the relationship between each variable and sentiment.
Figure 5 presents the sentiment analysis results obtained from the BERT model over the time series. The analysis reveals a higher frequency of negative tweets compared to positive ones. This finding suggests that users tend to use the customer service platform (@ridesharing time) to express complaints and problems with a negative sentiment more frequently than using positive expressions. Moreover, the percentage of users with a positive attitude initially increases at the onset of the pandemic and subsequently decreases amid the pandemic. This observation may be attributed to ridesharing companies implementing discount policies for customers in response to the pandemic, which contributed to the heightened positive sentiment among customers.
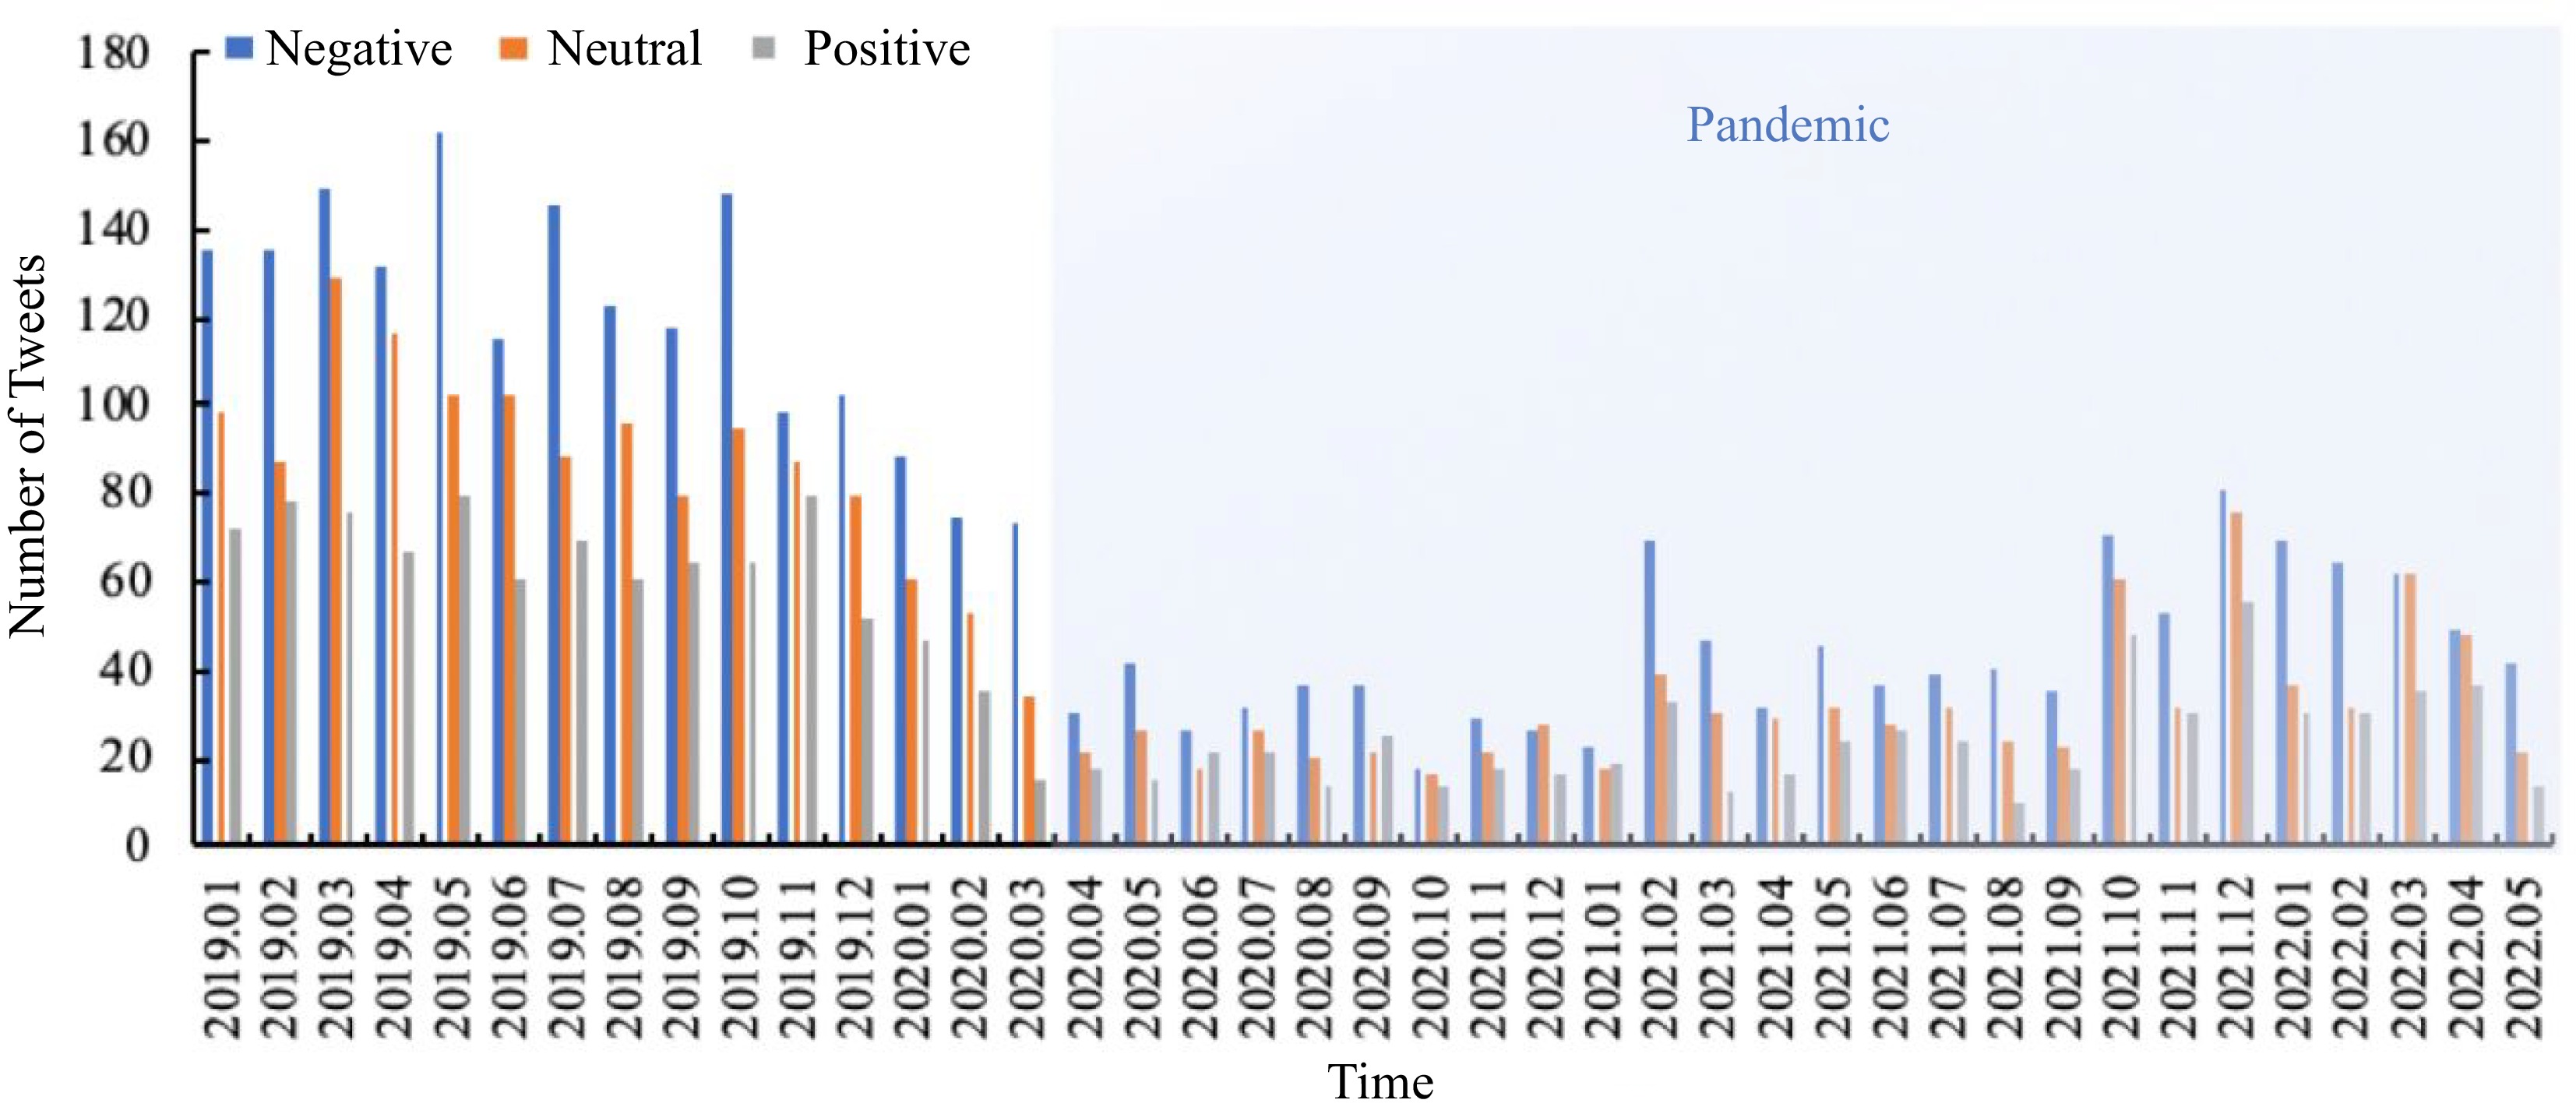
Figure 5.
Volume of ridesharing sentiments associated with time series.
To conduct a detailed analysis of sentiment performance, a numerical value is assigned to each sentiment category, with '1' representing negative, '2' representing neutral, and '3' representing positive sentiment. The mean and standard deviation (S.D.) of sentiment scores are then compared among different groups to explore sentiment differences based on the pandemic, gender, and age.
Figure 6a depicts the significant differences in sentiment across various pandemic periods and countries. Upon comparing the mean sentiment scores for each group, it is evident that customers exhibit a more positive attitude amid the pandemic. Moreover, male customers and those from India display a more positive sentiment towards ridesharing trip time. However, based on the standard deviation analysis, customers tend to maintain a more stable sentiment pre-pandemic. Similarly, females, younger individuals, and American customers demonstrate a more stable sentiment towards ridesharing.
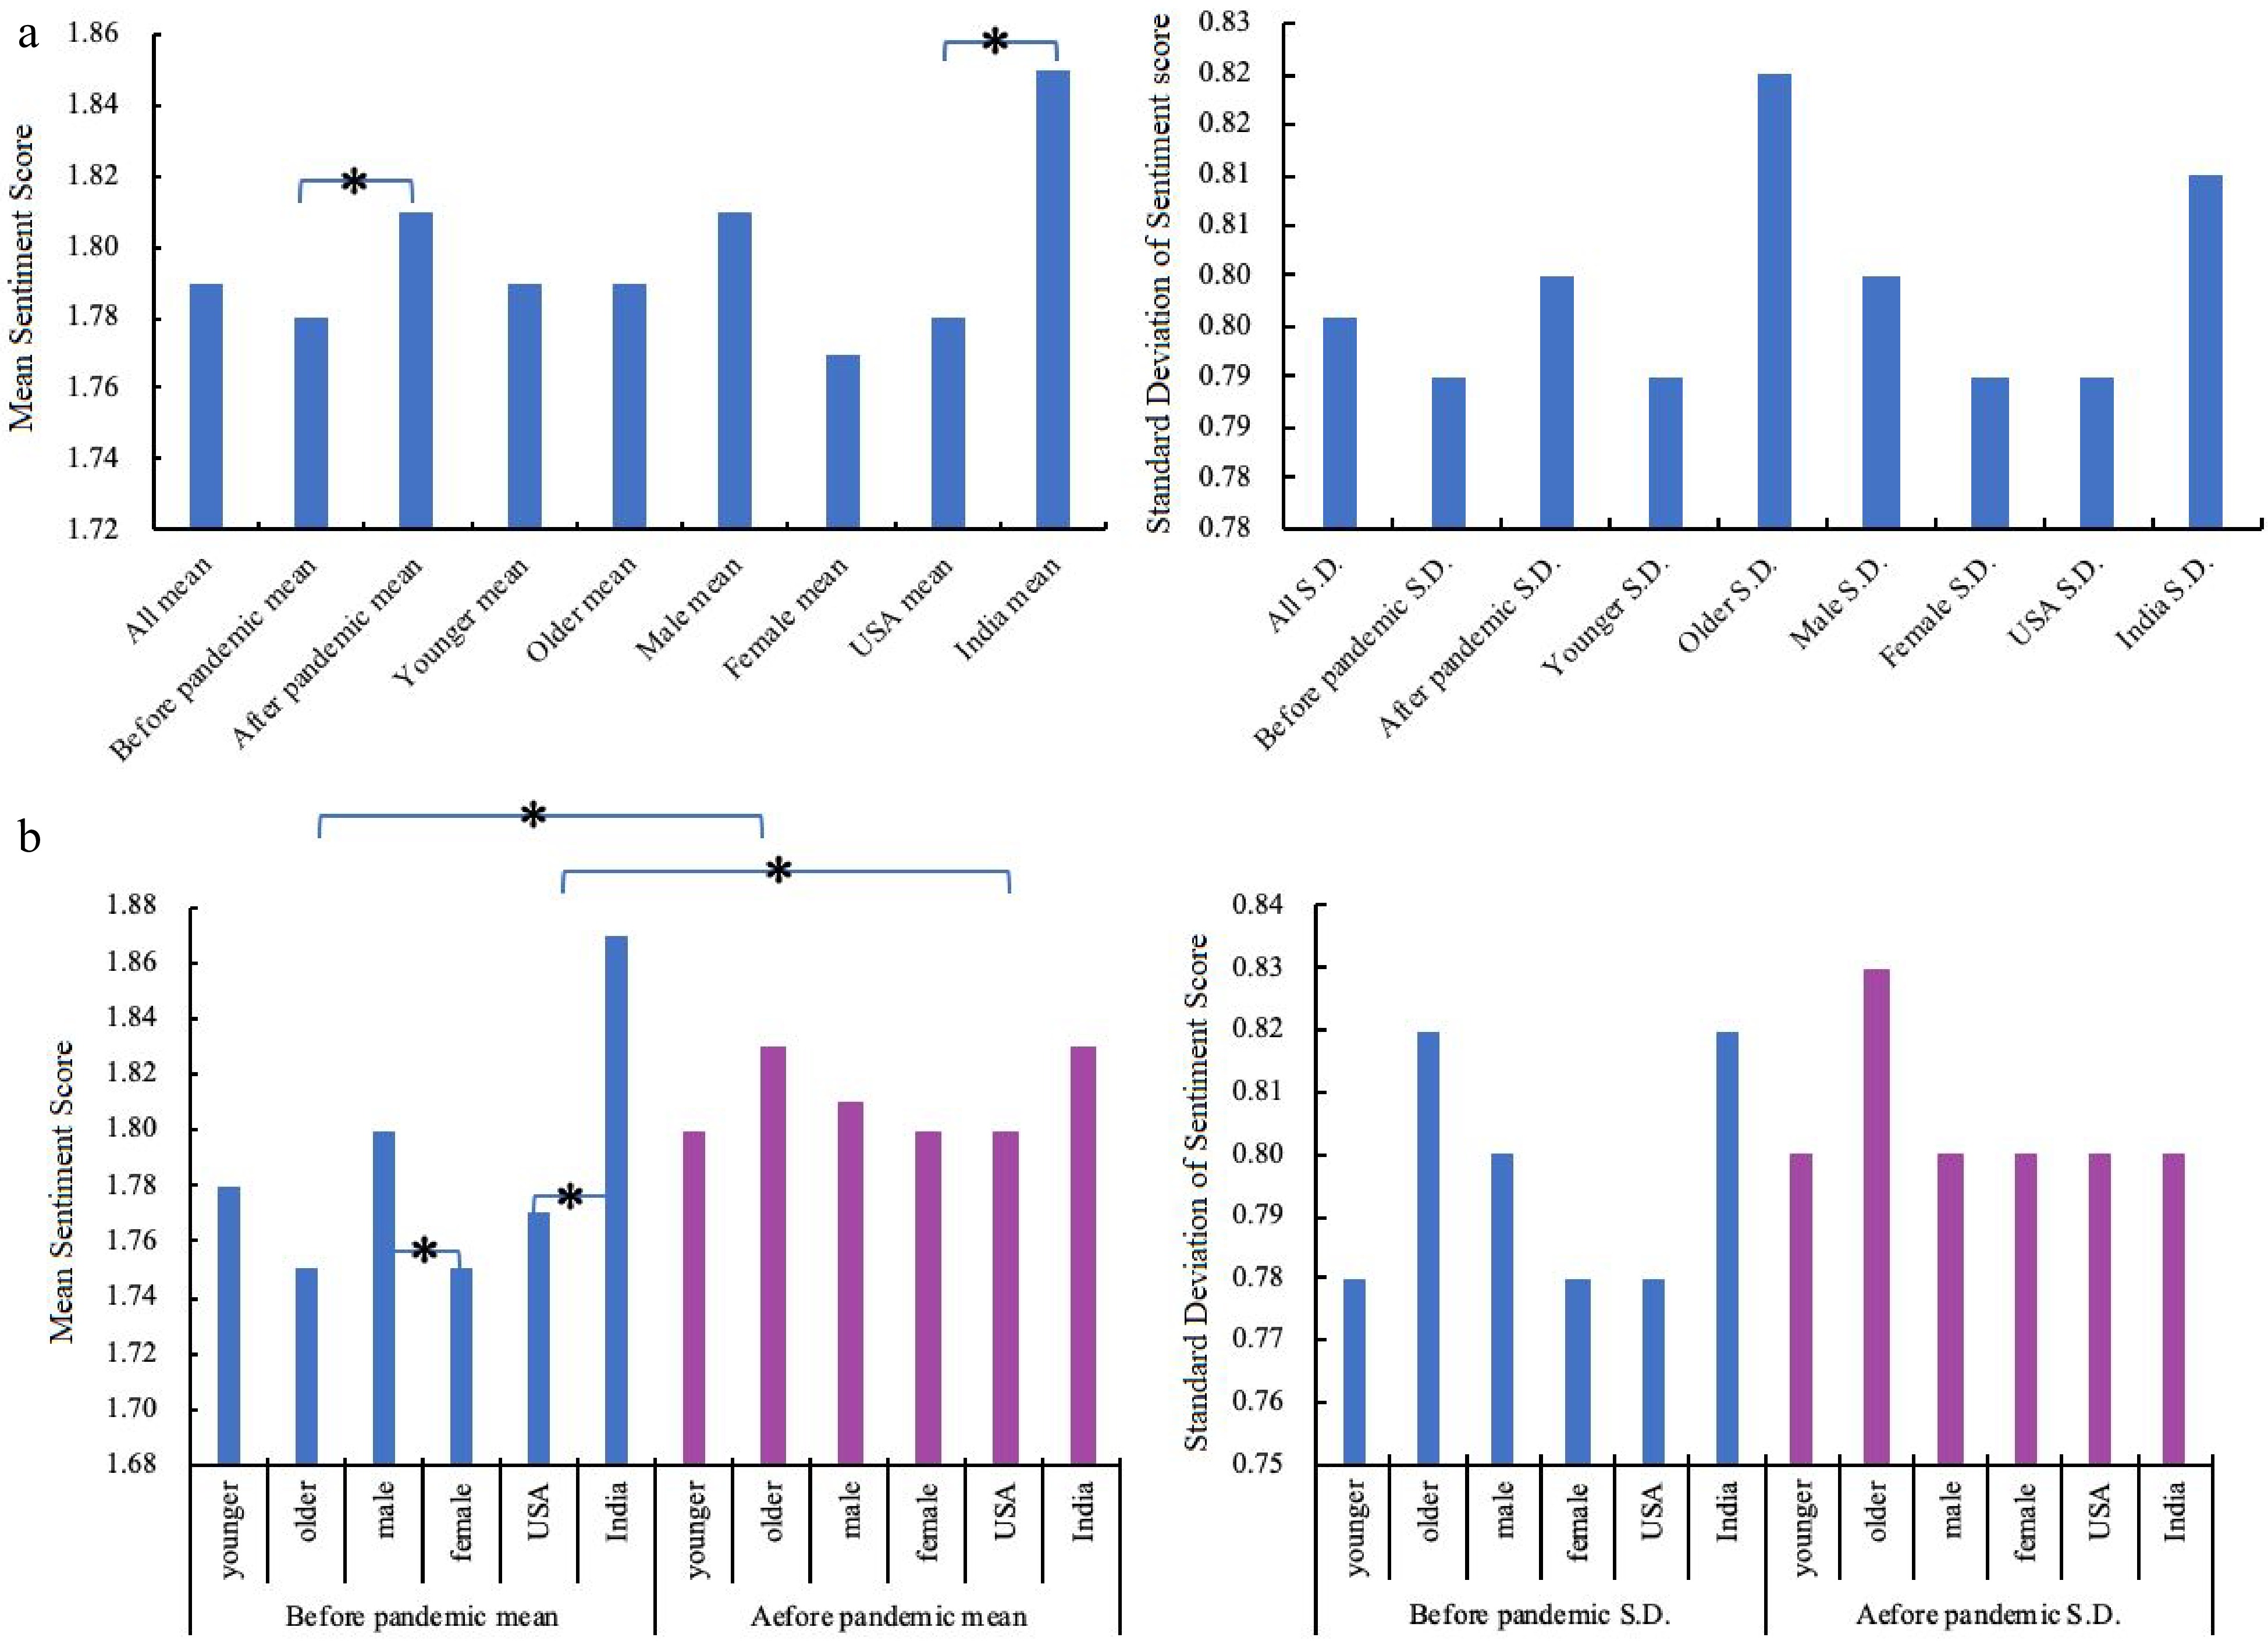
Figure 6.
Description and significant analysis of sentiment in each group. (a) The difference of sentiment among groups. (b) The difference of sentiment within and between groups pre- and amid-pandemic.
Furthermore, the analysis delves into the differences in sentiment between each group before and amid the pandemic, as shown in Fig. 6b. The results indicate significant differences in sentiment between gender and country groups pre-pandemic. However, no significant differences are observed within each group amid the pandemic. Additionally, female passengers and those from America consistently exhibit a more positive sentiment towards ridesharing across all periods. Older individuals tend to display a more positive attitude pre-pandemic, while the opposite holds true for younger individuals amid the pandemic. In terms of standard deviation, younger individuals, males, and American passengers maintain a more stable sentiment than others pre-pandemic. However, only younger individuals exhibit a stable trend amid the pandemic.
It is worth noting that an asterisk (*) indicates that the observed differences were statistically significant at a significance level of 5% (0.01 < p-value < 0.05).
Ridesharing trip time sentiment multi-logit regression model
-
This study examined the relationship between customer characteristics, country, pre-and amid-pandemic variables, and sentiment to develop a regression model that captures the association between these factors. The findings revealed a significant correlation between sentiment and country (0.028**), indicating that users from the USA and India exhibited different sentiment patterns. However, no significant correlation was observed between sentiment and the other variables.
To construct the regression model, a multi-logit regression approach was employed using the MATLAB built-in algorithm. The model's performance was evaluated based on four parameters: Log-Likelihood Ratio, X2, the goodness of fit test, and model significance. The results demonstrated that the model exhibited strong performance, as evidenced by its higher significance level (sig. = 0.03), lower error rates (Log-Likelihood Ratio = 177.24, X2 = 12.31), and high model fitness (goodness of fit test = 0.623).
Table 3 presents the results of the sentiment regression model, highlighting the main factors influencing sentiment. Amid the pandemic, sentiment was found to be more positive (OR = 1.05, P < 0.05), and passengers from the USA exhibited a more positive sentiment compared to those from India (OR = 1.01, P < 0.05). These findings underscore the impact of the pandemic and country on sentiment patterns among ridesharing users.
Table 3. Result of the ridesharing regression based on the multi-logit model.
Step Items B Stad. E. Wald Freedom Sig. Exp(B) 95% CI 1 Intercept −0.48 0.15 10.19 1.00 0.00 Pandemic 0.22 0.11 3.67 1.00 0.03 1.01 0.89 1.13 Gender 0.04 0.06 0.55 1.00 0.89 1.04 0.93 1.18 Age −0.77 0.09 0.75 1.00 0.79 0.92 0.77 1.10 Country 0.33 0.12 4.45 1.00 0.02 1.12 1.01 1.23 2 Intercept −0.49 0.16 9.65 1.00 0.02 − − − Pandemic 0.12 0.13 4.66 1.00 0.03 1.05 1.01 1.15 Gender 0.01 0.12 0.01 1.00 0.97 1.00 0.79 1.27 Age 0.09 0.67 2.12 1.00 0.12 1.11 0.96 1.26 Country −0.18 0.09 3.48 1.00 0.02 1.01 0.99 1.22 -
This paper introduces a comprehensive methodology for modeling ridesharing trip time-related topics through LDA and for sentiment analysis employing BERT and multi-logit models. From the initial dataset of tweets, four principal topics are extracted, encompassing wait time, time cost, trip timing, and the impact of the pandemic. The study investigates variations in the distribution of ridesharing trip time topics among gender, age, and country categories both before and after the onset of the pandemic. Furthermore, it employs the BERT model to extract sentiment from each tweet within each group, showcasing the model's robust performance in time series sentiment analysis.
The study undertakes an in-depth analysis of the significance and interrelationships between sentiment and multiple variables. It further devises a sentiment regression model using the multi-logit approach to pinpoint the primary factors exerting influence on sentiment. The key findings can be summarized as follows:
1) The analysis reveals a pronounced emphasis on the topic of trip timing across all demographic groups. Additionally, there is an elevated interest in the wait time topic during the pandemic period, implying that passengers are placing greater importance on trip timing, particularly during specific periods such as mornings. This heightened focus on wait time may be attributed to extended waiting periods stemming from pandemic-related factors, resulting in heightened passenger concerns.
2) Both the USA and India exhibit similar topic distributions before and during the pandemic. Notably, male users express more concern regarding wait time compared to their female counterparts. Before the pandemic, the predominant topics for males and females are wait time and trip timing, respectively. However, during the pandemic, females display increased concern about time cost. Among younger age groups, trip timing takes precedence before the pandemic, while time cost becomes a more prominent consideration afterward. In contrast, the older age group exhibits a notable interest in wait time before the pandemic, but this concern diminishes during the pandemic. Instead, they display heightened concern for time cost and trip timing amid the pandemic.
3) Significant disparities emerge in sentiment between the pre-pandemic and pandemic periods, as well as among different countries. Customers exhibit a more positive sentiment during the pandemic, with passengers in the USA displaying a particularly favorable attitude towards ridesharing trip time. Gender and country-based distinctions are also evident in sentiment, with females and American passengers demonstrating more positive sentiment before the pandemic. However, during the pandemic, no significant differences are observed within each group. Notably, significant variations in sentiment are detected among older passengers and American passengers when comparing pre-pandemic and pandemic sentiments. These groups exhibit an increase in positive sentiment amid the pandemic, underscoring the diverse impact of the pandemic on individuals.
4) The regression model identifies the pandemic and country of origin as the primary factors influencing sentiment. During the pandemic, sentiment tends to skew more positive, with passengers in the USA displaying a notably more positive sentiment compared to their counterparts in India.
This study contributes a method for ridesharing trip time topic modeling and sentiment analysis, considering topic occurrence, trend changes, and sentiment time series variables, which have been largely unexplored in previous research. The methodology employed in this study has undergone enhancements, particularly in the realms of text feature extraction and sentiment analysis. The incorporation of graph-based techniques has proven effective in mitigating issues such as theme extraction inaccuracies and the limitations in sentiment analysis stemming from inadequate feature extraction, as observed in previous methodologies. Nevertheless, it is essential to acknowledge that the current method has its limitations in analyzing various emotions comprehensively and in revealing the nuanced layers of user sentiments toward ride-hailing services. To address these limitations and achieve more in-depth insights, further refinement and optimization of the method framework will be imperative in future research endeavors.
In light of our research outcomes, this paper offers the following recommendations. During morning and peak hours, careful consideration should be given to the adjustment of waiting times. Implementing discounts or appointment-based systems can mitigate user discontentment arising from prolonged waiting periods. Tailored strategies should be devised for users of varying genders. For instance, since men tend to be more concerned about waiting times, providing emotional support, such as discount coupons, can enhance their satisfaction. Acknowledge regional disparities in waiting times. Introducing distinct online ridesharing services tailored to specific regions can be a strategic approach to address varying user needs and preferences.
The contributions of this paper are as follows. First, this paper conducts a thorough examination of data from diverse geographic regions, enabling us to discern the varied attitudes of individuals in these regions toward carpooling through comparative analysis. This approach effectively mitigates bias issues stemming from regional disparities. Then, introducing a novel method for text feature extraction, this paper successfully eliminates the impact of aberrant data on result analysis, thereby enhancing the accuracy of user sentiment assessment. Finally, the insights and findings presented in this paper hold practical value for carpooling companies. They can be employed to inform adjustments in internal operational strategies and the formulation of distinct timing plans tailored to passengers in different regions, ultimately augmenting the competitiveness of these companies.
One notable limitation of this study pertains to the scope of research subjects, specifically focusing solely on users from the USA and India. Consequently, the dataset remains relatively limited in its volume. Additionally, the study primarily delved into a subset of user emotions. Integrating sentiment analysis with topic modeling and incorporating a more extensive emotional analysis could significantly enhance the granularity of sentiment examination. Future research endeavors could benefit from exploring additional variables, including but not limited to sadness, happiness, and excitement, to further enrich the landscape of sentiment analysis.
In future research, we plan to expand our dataset by extracting additional variables from Twitter texts, aiming to augment the depth and value of our text analysis. This includes gathering insights and suggestions regarding pricing and service quality. We will provide further details and descriptions pertaining to these enhancements in our forthcoming research endeavors.
-
The authors confirm contributions paper as follows: study conception and design: Xu W, Sobhani A; data collection: Xu W, Khabushani AM; analysis and interpretation of results: Xu W, Fu T, Shokoohyar S; draft manuscript preparation: Xu W, Vazirinasab A, Sobhani A, Raouf B. All authors reviewed the results and approved the final version of the manuscript.
-
The datasets generated during and/or analyzed during the current study are available from the corresponding author on reasonable request.
This research was supported by the Chinese National Natural Science Foundation (52172348) and the Postdoctoral Research Foundation of China (Certificate Number: 2024M754071).
-
The authors declare that they have no conflict of interest. Ting Fu is the Editorial Board member of Journal Digital Transportation and Safety who was blinded from reviewing or making decisions on the manuscript. The article was subject to the journal’s standard procedures, with peer-review handled independently of this Editorial Board member and his research groups.
- Copyright: © 2023 by the author(s). Published by Maximum Academic Press, Fayetteville, GA. This article is an open access article distributed under Creative Commons Attribution License (CC BY 4.0), visit https://creativecommons.org/licenses/by/4.0/.
-
About this article
Cite this article
Xu W, Sobhani A, Fu T, Khabooshani AM, Vazirinasab A, et al. 2023. An analysis of ridesharing trip time using advanced text mining techniques. Digital Transportation and Safety 2(4):308−319 doi: 10.48130/DTS-2023-0026 

An analysis of ridesharing trip time using advanced text mining techniques
- Received: 17 July 2023
- Accepted: 17 December 2023
- Published online: 28 December 2023
Abstract: The time cost of ridesharing rental represents a crucial factor influencing users' decisions to rent a car. Researchers have explored this aspect through text analysis and questionnaires. However, the current research faces limitations in terms of data quantity and analysis methods, preventing the extraction of key information. Therefore, there is a need to further optimize the level of public opinion analysis. This study aimed to investigate user perspectives concerning travel time in ridesharing, both pre and post-pandemic, within the Twitter application. Our analysis focused on a dataset from users residing in the USA and India, with considerations for demographic variables such as age and gender. To accomplish our research objectives, we employed Latent Dirichlet Allocation for topic modeling and BERT for sentiment analysis. Our findings revealed significant influences of the pandemic and the user's country of origin on sentiment. Notably, there was a discernible increase in positive sentiment among users from both countries following the pandemic, particularly among older individuals. These findings bear relevance to the ridesharing industry, offering insights that can aid in establishing benchmarks for improving travel time. Such improvements are instrumental in enabling ridesharing companies to effectively compete with other public transportation alternatives.
-
Key words:
- Ridesharing /
- Trip time /
- Topic modeling /
- Sentiment analysis /
- Twitter data