


-
The Highway Capacity Manual (HCM) defines the capacity of a freeway as the maximum sustainable hourly flow rate under prevailing conditions during which drivers are expected to traverse from one point to another[1,2]. The HCM specifies 2,400 passenger cars per hour per lane (pcphpl) as an ideal capacity for a basic freeway section under base conditions. These base conditions include, but are not limited to, free-flow speed (FFS) of 75 mph, presence of passenger cars only, a driver population composed of regular users who are familiar with the facility, 12-ft lane width, and adequate lateral clearances[1,2] When capacity is determined at conditions different from base (ideal) conditions, adjustments are needed to estimate the corresponding capacity accurately. The adjustment factor for human-driven heavy vehicles (HDHV) is among many factors used to adjust the road capacity at a condition other than ideal (i.e., passenger cars only). The HCM provides a formula to determine the HDHV adjustment factor (fHV) as the function of the human-driven passenger car equivalent factor (ET). The passenger equivalent factor(s) (ET) were developed for HDHV only, and they represent the number of passenger cars that would occupy the same amount of roadway space as one HDHV[1,2]. They depend on the percentage of HDHVs in the traffic stream, the configuration of the HDHV mix, and the road terrain type (general or specific grades)[1,2].
The HCM methodology has been challenged in recent years due to the increased prevalence of automated vehicle technology. The need to incorporate automated passenger cars (APCs) is no longer a question of 'if' but rather 'when' and 'how' they will operate in the current traffic conditions[3]. For that matter, a new type of passenger car equivalent factors is expected to exist due to automated vehicles (EAV). It is a number that represents the amount of HDPC that will occupy equivalent roadway space as an APC.
Precisely for this research, the addition of APCs on a basic section of a freeway is studied. The presence of APCs in freeway traffic streams calls for research on how APCs will impact freeway capacity. The study first investigated significant differences between HDPCs and APCs. The assumption that governs this study is that APCs perform significantly differently from human-driven passenger cars (HDPCs); therefore, the expected values of ET are statistically different from 1 (an equivalency for an HDPC). If they are different, it is evidence that the performance of an APC in terms of space headway is significantly different from that of an HDPC. The statistical tests provide insight into the necessity of developing new equivalents for APCs because they exhibit operational characteristics different from those of HDPCs.
In addition, a study on how APCs will influence the current ET values and how the new EAV values will be used to estimate freeway capacity is paramount. Thus, this study investigated the impacts of HDHVs and APCs on vehicle adjustment factors at different AV market penetration rates (MPRs) and the percentage of HDHVs in the traffic stream. The influence of HDHVs and APCs on ET and EAV values was investigated to achieve the objectives.
Further, adjustment factors (fHV and fAV) due to the proportions of HDHVs and APCs were determined and recorded from the simulation. The current HCM formula to calculate the adjustment factors (fHV) due to HDHVs was adopted and used to calculate the adjustment factors (fAV) due to the presence of APCs at different MPRs. The two factors were multiplied to obtain an overall effect of the two adjustment factors (fHV and fAV), and an equivalent adjustment factor (fHCM) was calculated. A similar approach is used in HCM 2016, whereby adjustment factors are multiplied by the ideal capacity to obtain the roadway capacity at prevailing conditions. In addition, modifications to the current HCM formula were identified. The new formula was proposed to estimate adjustment factors (fproposed) due to HDHVs and APCs. The proposed formula is a function of both the fHV and fAV.
Lastly, the study compared the overall adjustment factors observed from simulation (fobserved) to the adjustment factors obtained from two approaches: the HCM approach (fHCM) and the proposed approach (fproposed). A recommendation on which of the two methods resulted in adjustment factors similar to adjustment factors observed directly from the simulation was made and documented in this manuscript. This research will provide insight into how the fAV and fHV values can be incorporated into the proposed formula to estimate adjustment factors due to HDHVs and APCs at different percentages of HDHVs and APCs in the traffic stream.
-
Human-driven heavy vehicles (HDHV) exhibit performance characteristics different from human-driven passenger cars (HDPC) because of their size and weight. These characteristics, such as roadway sign blockage (such as warning signs), aerodynamic, splash and spray, underride hazards, and off-tracking, might influence passenger car drivers to keep longer distances (headways) when following HDHV[4,5]. In turn, traffic parameters such as speed and headway are affected - ultimately causing a reduction in roadway capacity compared to ideal conditions for passenger cars only. The HCM estimates an ideal flow rate of 2,400 passenger cars per hour per lane (pcphpl) for a basic freeway with FFS 75 mph, 12-ft lane width, at least 6-ft shoulder, driver population consisting of users who are familiar with the facility, and median buffers[1,2]. Adjustments to the freeway capacity at ideal road conditions are necessary when estimating the capacity of a basic freeway section under prevailing conditions[1]. The adjusted road capacity is the product of the freeway capacity at ideal conditions and adjustment factors corresponding to non-ideal road conditions. HDHVs in the traffic stream deviate from the ideal conditions, hence calling for adjusting the freeway capacity[1,2].
A body of literature explains the impacts of HDHV on freeway capacity. However, in recent years, automated vehicle (AV) technology has become an interesting topic for researchers, and several studies have investigated the impacts of automated passenger cars (APCs) on capacity. Studies show that positive or negative effects on freeway capacity should be expected depending on the APCs' market penetration rates (MPRs) in the traffic stream[6−8]. APCs' positive impacts, such as safety, capacity, and smooth driving, are expected at higher MPRs of APCs[9−11]. Also, introducing APCs in the traffic stream will decrease the differences between vehicle velocities and ease stop-and-go traffic[12]. On the other hand, at lower penetration rates of APCs, longer headways might be experienced when the APC follows a human-driven vehicle. Thus, there is an expected loss in vehicle throughput on the roadway[12].
In a study conducted by Stanek to estimate the effect of APCs on freeway capacity, an APC adjustment factor was developed by simulation[13]. Only a fleet of HDPCs was used to isolate the impact of APCs on freeway capacity from the effect of other vehicle types, such as HDHVs. The average freeway capacity for the stream of HDPCs was only obtained from the simulation. In addition, by replacing a percentage of HDPCs with APCs, the average capacity of the mixed traffic of HDPCs and APCs for MPR was obtained between 10% and 100% at multiples of 10%. Further, capacity adjustment factors due to APCs at each MPR were calculated as the ratio between the capacity at the MPR and the HDPCs-only traffic stream capacity. Results showed increased capacity at APCs' MPR above or equal to 20%. Specifically, the study revealed an increase in the capacity by 5% from 2,344 pcphpl to 2,466 pcphpl when the MPR increased from 0% APCs to 20% APCs. In addition, the capacity increased from 2344 pcphpl to 3,186 pcphpl (35.9%) when the MPR rose from 0% APCs to 100% APCs[13].
Another study by ElSahly & Abdelfatah investigated the impacts of APC on freeway capacity. Their study investigated the improvement of other freeway performances at a constant demand-to-capacity ratio. Two demand-to-capacity ratios of 0.6 and 0.8 were used in the investigation, and improvements in travel time, average speed, and delay experienced by the HDPCs and the APCs were studied and compared. Results revealed that at different MPRs, there was an observed improvement in average travel speed, travel time, and delay. Specifically, at a constant demand-to-capacity ratio, a reduction in travel time was observed with increased MPRs for both the HDPCs and the APCs. Results showed that at constant 60 and 80% MPR, the APCs; travel time decreased by 3.6%, while that of HDPC decreased by 3.4%. Thus, a higher decrease in travel time was experienced among APCs than in HDPCs because of APCs' better performance than HDPCs[14].
Human-driven vehicles are predicted to co-exist with APCs for decades[15]. The question that motivates this research is: What will be the appropriate equivalents and adjustment factors at different APC MPRs and percentages of HDHVs? The literature review above states that APCs significantly impact traffic streams at different penetration rates. However, limited literature has investigated the impacts of these APCs on vehicle adjustment factors[13,16]. The literature summarized above concentrated on adding APCs in human-driven passenger cars as the only type of traffic. It means that an equal percentage of APCs replace a portion of human-driven passenger cars, and their impacts were investigated. There is no literature on the effects of adding APCs in existing mixed traffic of human-driven vehicles consisting of both HDPCs and HDHVs. Considering that APCs will be added to a conventional traffic stream consisting of HDPCs and HDHVs, analysis involving a similar type of traditional vehicle traffic stream analysis is vital. Investigating the impacts of adding automated vehicles in a traffic mix with different percentages of HDHVs is essential.
-
The presence of HDHVs in the traffic stream violates the base conditions for the ideal freeway capacity; hence, adjustments to the maximum flow rate under base conditions are needed[1,2]. HCM provides maximum service flow rates (MSFs) for freeways at different levels of service (LOS). Any adjustments to a freeway's maximum service flow rate result in a service flow rate (SF) for that freeway under the prevailing conditions. HCM defines service flow rate as the maximum flow rate under prevailing conditions while a particular level of service is maintained during the 15-min analysis period[1]. An MSF at LOS E is equivalent to the capacity of a freeway at the corresponding base conditions. In the presence of HDHV in the traffic mix, the relationship between the SF, MSF, and heavy vehicle adjustment factors is given by:
$ {S F}_{i}={MS F}_{i}\times N\times{f}_{HV} $ (1) SFi is the service flow rate (pc/h) at LOSi, MSFi is the maximum flow rate (pcphpl) at LOSi, N is the freeway number of through lanes, and fHV is the heavy vehicle adjustment factor. This study simulated traffic flow to its MSF at LOS E. An MSF at LOS E is equivalent to the base capacity (CB) at the corresponding base conditions. HCM adjusts base capacity (CB) to a capacity under prevailing conditions (Cf) by multiplying the base capacity with corresponding adjustment factors. For example, a freeway with N number of through lanes and the proportion of HDHVs in the traffic stream is calculated in Eqn (2):
$ {C}_{f}={C}_{B}\times N\times PH F\times {f}_{HV} $ (2) $ {f}_{HV}=\dfrac{1}{\left[1+{P}_{T}\left({E}_{T}-1\right)\right]} $ (3) Whereby Cf is the freeway capacity (pc/h) under prevailing conditions, CB is the freeway base capacity under ideal conditions (pcphpl), PHF is the Peak-hour factor (the ratio of the peak 15-min flow rate to the average hourly flow rate), PT is the percentage of the heavy vehicle in the traffic mix, and ET is the passenger car equivalent factor for the heavy vehicle at their respective percentages and conditions. Other variables are as previously defined.
The HDHV adjustment factor is inversely proportional to ET values. Under stable conditions, an increase in ET values will decrease fHV. ET value represents an equivalent number of HDPCs occupying the same space or using the same roadway capacity as one HDHV[1,2]. Studies show that ET values are affected by several factors, including the percentage of heavy vehicles, facility type, facility grade, HDHV configuration (HDHV mix), speed, and density of the prevailing traffic stream[1,2]. HCM provides an ET value of 2 for level terrain and 3 for rolling terrain at any HDHVs[1,2]. For the same facility type (i.e., basic freeway section) and if all other factors are kept constant, Eqn (2) was reduced to Eqn (4):
$ \dfrac{{C}_{f}}{{C}_{B}}=K\times{f}_{HV} $ (4) Whereby K is the constant term for other variables as previously defined. In the presence of APCs, the HCM formula (Eqn 3) was adopted, and the expected adjustment factors due to APCs (fAV) were calculated from the formula in Eqn (5):
$ {f}_{AV}=\dfrac{1}{\left[1+{P}_{AV}\left({E}_{AV}-1\right)\right]} $ (5) FAV is the adjustment factor due to APCs, PAV is the percentage of APCs in the traffic stream, and EAV is the HDPC equivalent factor for an automated passenger car at their respective percentages and conditions. Other variables are as previously defined:
$ \dfrac{{C}_{f}}{{C}_{B}}=K\times{f}_{eq} $ (6) For which feq is an equivalent adjustment factor due to HDHVs and APCs. Two different approaches were investigated to determine the value for feq. The first approach was the HCM approach, in which the corresponding adjustment factors fHV and fAV for HDHV and AV were multiplied, and the fHCM was obtained:
$ {f}_{HCM}=\dfrac{1}{[1+{P}_{T}\left({E}_{T}-1\right)]}\times\dfrac{1}{\left[1+{P}_{AV}\left({E}_{AV}-1\right)\right]}={f}_{HV}\times{f}_{AV} $ (7) The second approach is the formula proposed by this research. APCs are expected to interact with the HDHVs and the HDPCs already in the mix; thus, it is vital to determine an equivalent adjustment factor that considers the interactions of all the vehicles in the traffic stream (APCs, HDPCs, and HDHVs). Thus, this research proposed a formula to calculate an equivalent adjustment factor due to HDHVs and APCs. The proposed formula to calculate the equivalent adjustment factor (fproposed) is given:
$ {f}_{proposed}=\dfrac{1}{\left[1+{P}_{T}\left({E}_{T}-1\right)+{P}_{AV}\left({E}_{AV}-1\right)\right]} $ (8) Traffic simulation
-
The study used microsimulation to model traffic flow on a basic freeway section. VISSIM 11 was used to model the traffic flow. Baseflow consisting of only passenger cars was simulated, followed by a traffic mix of HDPCs, HDHVs, and APCs at different proportions. A level terrain basic freeway section of 1.5 miles with three lanes of 12 feet each was used in the simulation. Data were collected from 20 simulation runs of 20 different seed numbers to ensure unique data was generated each time. A total of 1 h and 30 min were used, with the first 15 min used to stabilize the simulation process and the last 15 min used for data unloading. Data collected in 1 h of simulation time was used for analysis.
Simulating the traffic flow of human-driven passenger cars and human-driven heavy vehicles only
-
Traffic modeling in VISSIM involves the modification of parameters in the Wiedemann car-following model, speed distribution curves, vehicle types, and vehicle class models. The parameters are modified to generate a traffic stream similar to what would have been observed in the field. A traffic stream of HDPCs and HDHVs was simulated and analyzed. Model calibration was done to the simulation results to yield a capacity of 2,400 passenger cars per hour per lane, the capacity provided by the HCM 2016 for freeways with a free-flow speed of 70 mph. HCM 2016 includes ET values for traffic mix with a maximum value of up to 25% of heavy vehicles[1]. This study used 30% of HDHVs as the cut-off point. A total of six main scenarios involving conventional traffic streams of different percentages of HDHV were simulated. Table 1 is the description of each of the main scenarios performed.
Table 1. Main simulation scenario for the human-driven traffic flow.
Scenario # Description 1 Passenger's cars only (100% HDPCs + 0% HDHVs) 2 5% mixed traffic (95% HDPCs + 5% HDHVs) 3 10% mixed traffic (90% HDPCs + 10% HDHVs) 4 15% mixed traffic (85% HDPCs + 15% HDHVs) 5 20% mixed traffic (80% HDPCs + 20% HDHVs) 6 30% mixed traffic (70% HDPCs + 30% HDHVs) Simulation of traffic stream that includes APCs
-
APCs are associated with minor variations compared to human-driven vehicles. It is also assumed that there is a linear relationship between headway and speed when an automated car follows a manually driven car or another automated car. This results in a deterministic relationship between headways and speeds of APCs. Thus, it is wise to assume that APCs maintain the desired speed (without a distribution), smaller standstill distances, smaller headways, and accelerate or decelerate equally (without distribution)[14]. In this study, these behaviors are reflected by modifications to the default driving behavior parameter to reflect a shorter standstill distance (CC0) and shorter safety distance (lower headway CC1 and following variation CC2). Also, APCs are expected to be more sensitive to the acceleration and deceleration of the leading vehicle; hence, modification of the negative-following threshold (CC4) and positive-following threshold (CC5) to smaller values is necessary[17]. The CC6 is set to zero to reflect the ability of an automated vehicle to follow the desired speed without oscillation. APCs are further expected to be more aggressive to acceleration; thus, higher CC7 and CC8 are expected[14]. Table 2 describes driving behavior parameters and modifications made to each parameter. The same approach was also made by reseachers[11,14,17−19]. Table 2 lists parameters modified from default values to model the APCs in microsimulation. This study simulated a mix of APCs and human-driven vehicles by replacing a percentage of HDPCs with APCs while keeping the HDHV ratio constant in the six scenarios presented previously. The proportions of APCs were changed at the interval of 10%.
Table 2. Driving behavior parameters for APCs modeling.
Parameters designation Description Default APCs CCO Standstill distance (ft) 4.92 3.98 CC1 Following variation (s) 0.9 0.6 CC2 Following variation (m) 13.12 0 CC3 Threshold for entering following (s) −8 −6 CC4 Negative following threshold (s) −0.35 −0.1 CC5 Positive following threshold (s) 0.35 0.1 CC6 Speed dependency of oscillation (rad/s) 11.4 0 CC7 Oscillation acceleration (ft/s2) 0.82 0.33 CC8 Standstill acceleration (ft/s2) 11.48 13.12 CC9 Acceleration at 50 mph (ft/s2) 4.92 6.56 Determining PCE for automated passenger vehicles
-
HDHV exhibits some performance-related characteristics that may contribute to capacity reduction due to how drivers of other vehicles behave around them. In studying the impacts of heavy vehicles on the performance of the traffic stream with a mixture of HDHV and HDPCs, a methodology by Huber was adopted[20]. The method compares the performance of the traffic stream with HDPCs to that of a traffic stream comprising a certain percentage of HDHVs[20]. The performance difference between the two traffic streams is expressed by the ET values, as shown in Eqn 8.
$ {\mathrm{E}}_{T}=\dfrac{1}{{\mathrm{P}}_{\mathrm{T}}}\times\left(\dfrac{{\mathrm{q}}_{\mathrm{B}}}{{\mathrm{q}}_{\mathrm{M}}}-1\right)+1 $ (9) Where, qB is the traffic flow for the primary stream (HDPCs only); qM is the traffic flow for the traffic stream with HDPCs and HDHVs; PT is the proportion of HDHVs in the traffic stream
Different researchers have adopted and modified the Huber methodology. The use of one type of heavy vehicle was later challenged by Sumner et al.[21], who modified the Huber[20] to accommodate the traffic stream with more than one type of HDHV, as shown in Eqn 9.
$ {\mathrm{E}}_{s}=\dfrac{1}{\Delta {\mathrm{P}}_{s}}\times\left(\dfrac{{\mathrm{q}}_{\mathrm{B}}}{{\mathrm{q}}_{\mathrm{S}}}-\dfrac{{\mathrm{q}}_{\mathrm{B}}}{{\mathrm{q}}_{\mathrm{M}}}\right)+1 $ (10) Where, ES is the passenger car equivalent of a subject vehicle. qS is the resulting flow rate after adding the subject vehicle to the traffic mix. ∆Ps is the proportion of subject vehicles in the mixture.
The reality is that APCs will be added to a traffic stream with HDPCs and HDHVs. Thus, the original methodology by Huber and the modified one by Sumner were adopted for this study. Huber's method was used to calculate ET values at different proportions of HDHVs in the traffic stream without APCs[20]. The modified Huber approach by Sumner was used to calculate EAV values at different MPRs in the traffic stream with varying percentages of HDHV. This is to say, when calculating PCEs of APCs at different MPRs for a traffic stream with 10% HDHV, the HDPCs (90%) were replaced by an equivalent number of APCs. For instance, when determining the EAV value at 20% MPRs in the traffic stream with 10% HDHV, the resulting traffic composition will be 70% HDPCs, 10% HDHVs, and 20% APCs. This was then translated and substituted into the Sumner formula as follows: qB is the base flow for HDPCs only (100%); qM is the mixed flow for 90% HDPCs and 10% HDHV; qS is the flow in the presence of 20% APCs (i.e., 70% HDPCs, 10%, and 20% APCs); ΔP is the proportion of APCs in the traffic stream (i.e., 0.2).
$ {\mathrm{E}}_{AV}=\dfrac{1}{\Delta {\mathrm{P}}_{s}}\times\left(\dfrac{{\mathrm{q}}_{\mathrm{B}}}{{\mathrm{q}}_{\mathrm{S}}}-\dfrac{{\mathrm{q}}_{\mathrm{B}}}{{\mathrm{q}}_{\mathrm{M}}}\right)+1=\dfrac{1}{0.2}\times\left(\dfrac{7112}{6537}-\dfrac{7112}{6200}\right)+1=0.704 $ -
This section documents the analysis and results from the simulation of traffic flow and vehicle equivalencies for both HDHVs and APCs. It further demonstrates the comparison between the two procedures used to determine the equivalent adjustment factor: the HCM methodology and the proposed methodology by this research.
Traffic simulation
-
As pointed out earlier, each of the six scenarios of human-driven vehicles was simulated, and results were recorded. In addition, simulations of the corresponding traffic mix with human-driven vehicles and APCs were done in each scenario. The mixed traffic of HDPCs, HDHVs, and APCs was obtained by replacing HDPCs with the same percentage of APCs. Earlier in this manuscript, it was pointed out that HCM (2016) provides PCE values for heavy vehicles up to a maximum of 25%. Any traffic stream with a percentage of heavy vehicles above 25% is assumed to have the same impact as 25%. Therefore, this study analyzed traffic stream with a percentage of heavy vehicles up to 30%. Since the maximum percentage of HDHV used was 30%, MPR up to 30% was used, and corresponding traffic flows were simulated ( i.e., 0, 10, 20, 30, 40, 50, 60, and 70). Therefore, 48 traffic streams were simulated (six scenarios with eight types of traffic streams each). For each traffic stream i, 20 simulation runs were generated by changing different seed numbers in the VISSIM. For each scenario, volumes were simulated until the scenario reached its capacity.
Speed-flow diagrams
-
Speed-flow diagrams calibrate the model for human-driven vehicles and APCs in the traffic streams. Figure 1 represents a speed flow diagram for the traffic stream with only HDPCs and the traffic stream with APCs.
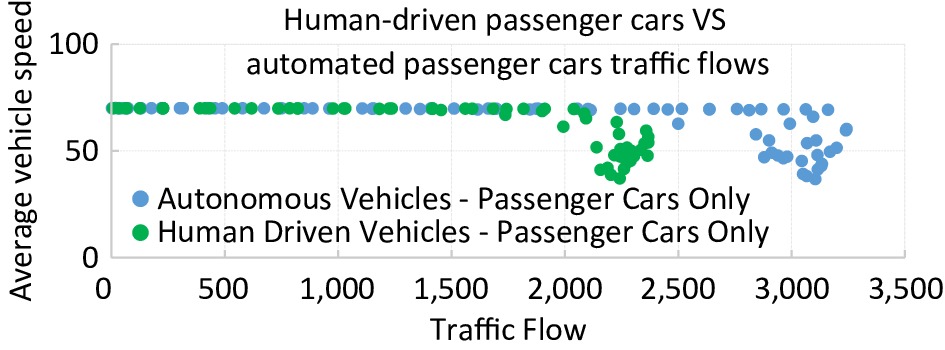
Figure 1.
Comparison of speed-flow diagram between human-driven passenger cars and APCs.
Results showed that the model yielded a capacity of 2,368 HDPCs for a freeway way with 70 mph. This capacity is slightly less (1.33%) than the capacity provided in HCM (2,400 pcphpl) for a basic freeway section at level terrain with a free-flow speed of 70 mph[1]. A capacity of 3,240 APCs, equivalent to an increase of 35% in capacity, was generated for the traffic flow of APCs only. Previous research documented similar results[22,23]. For example, a study by Tientrakool et al. showed that about a 43% increase in capacity was observed due to the presence of APCs[23].
Impacts of APCs on passenger car equivalent factors
-
The impacts of APCs on different performance factors have been studied using fundamental traffic flow diagrams. Starting with the traffic stream of 100% HDPCs, whose equivalency is 1, APCs replaced a portion of HDPCs. Simulation data were analyzed at each penetration rate, and EAV values were calculated. For example, to determine the EAV at 20% MPR, the Eqn (8) becomes:
$ {\mathrm{E}}_{AV}=\dfrac{1}{{\mathrm{P}}_{AV}}\times\left(\dfrac{{\mathrm{q}}_{\mathrm{B}}}{{\mathrm{q}}_{\mathrm{M}}}-1\right)+1=\dfrac{1}{0.2}\times\left(\dfrac{7112}{7438}-1\right)+1=0.781 $ Figure 2 represents EAV values at different penetration rates. Results show that EAV values changed from 1 in the absence of APCs and sharply reduced to 0.792 at a 10% MPR of APCs. However, the PCE values seem to be approximately constant past the penetration rate of 10%. The sharp decrease might be due to an increase in the APCs, which perform better than the HDPCs, thus lower EAV values. The observed constant EAV values at MPRs of 10% and above might signify a lower overall impact when APCs are added into a traffic stream with 10% APCs. Lower EAV values indicate that an automated passenger car performs better than an HDPC.
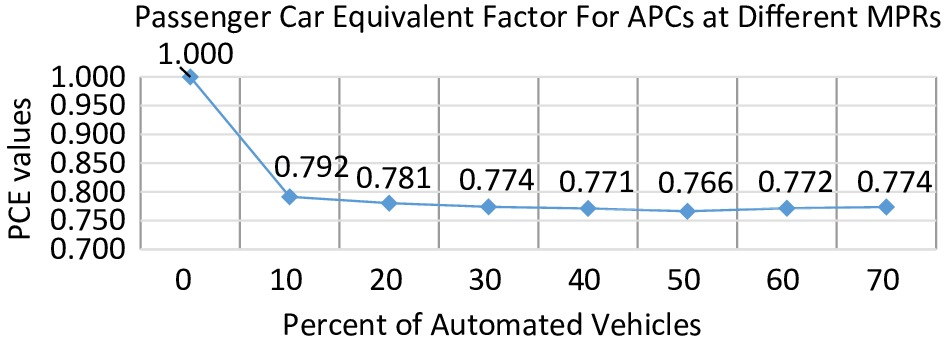
Figure 2.
Passenger car equivalent (EAV) at the various percent of APC penetration rates.
A t-test was used to investigate any significant difference among the EAV observed at different MPRs. This test specifically compared mean EAV. It intended to test whether EAV values significantly differ from 1, the vehicle equivalent for an HDPC. Table 3 is the summary of the results from the t-test. Results show that EAV values were statistically different from 1. Since EAV is the number of HDPCs replaced by 1 APC, thus APCs occupy a statistically lesser amount of freeway space than HDPCs despite their possible similarities in shape and size. That is to say, APCs and human-driven passenger cars perform significantly differently. That is to say, they keep following distances significantly shorter than HDPCs.
Table 3. Comparison of EAV for APCs at different MPRs.
Percent
of APCsDifference
in PCEt p > |t| 95% Conf. Interval 10 vs 0 −0.208 −22.230 <0.001* −0.237 −0.180 20 vs 0 −0.220 −23.420 <0.001* −0.248 −0.191 30 vs 0 −0.226 −24.090 <0.001* −0.255 −0.197 40 vs 0 −0.228 −24.320 <0.001* −0.257 −0.199 50 vs 0 −0.234 −24.920 <0.001* −0.263 −0.205 60 vs 0 −0.228 −24.360 <0.001* −0.257 −0.200 70 vs 0 −0.226 −24.120 <0.001* −0.255 −0.197 20 vs 10 −0.011 −1.180 0.935 −0.040 0.018 30 vs 10 −0.017 −1.860 0.580 −0.046 0.011 40 vs 10 −0.020 −2.080 0.430 −0.048 0.009 50 vs 10 −0.025 −2.690 0.133 −0.054 0.004 60 vs 10 −0.020 −2.130 0.402 −0.049 0.009 70 vs 10 −0.018 −1.890 0.557 −0.047 0.011 30 vs 20 −0.006 −0.680 0.998 −0.035 0.022 40 vs 20 −0.008 −0.900 0.986 −0.037 0.020 50 vs 20 −0.014 −1.510 0.802 −0.043 0.015 60 vs 20 −0.009 −0.940 0.981 −0.038 0.020 70 vs 20 −0.007 −0.710 0.997 −0.035 0.022 40 vs 30 −0.002 −0.220 1.000 −0.031 0.027 50 vs 30 −0.008 −0.830 0.991 −0.037 0.021 60 vs 30 −0.003 −0.270 1.000 −0.031 0.026 70 vs 30 0.000 −0.030 1.000 −0.029 0.029 50 vs 40 −0.006 −0.610 0.999 −0.035 0.023 60 vs 40 0.000 −0.040 1.000 −0.029 0.028 70 vs 40 0.002 0.190 1.000 −0.027 0.031 60 vs 50 0.005 0.570 0.999 −0.024 0.034 70 vs 50 0.007 0.800 0.993 −0.021 0.036 70 vs 60 0.002 0.230 1.000 −0.027 0.031 The standard error remained constant (Std. Err = 0.009) for each experiment. Further results revealed no significant difference between EAV values at any chosen pair of MPRs. As more APCs were added to a traffic stream, more HDPCs were replaced; thus, the interaction between HDPCs and APCs decreased. The decrease in the interaction between the two types of vehicles results from more APCs in the traffic mix than HDPCs; therefore, the equivalencies are statistically similar.
Impacts of APCs on vehicle adjustment factors
-
This section presents the simulation analysis and results on the impacts of APCs on vehicle adjustment factors. The HCM provides different adjustment factors to adjust the ideal freeway capacity to field conditions' capacity. Currently, HCM provides vehicle adjustment factors for HDHVs only. However, as proven by other researchers and results from the 'impacts of APCs on vehicle equivalent values' presented in the previous section, APCs are expected to change the traffic flow dynamics; hence, new equivalent factors due to APCs (EAV) were developed. This study used EAV obtained in the previous step to calculate the resulting adjustment factors due to APCs (fAV) at different MPRs. A methodology was adopted to calculate the heavy vehicle adjustment factor (fHV) provided by HCM (Eqn 3). For example, given the EAV at 20% MPR as 0.781, the fAV value at that MPR was given by:
$ {f}_{AV}=\dfrac{1}{\left[1+0.2\left(0.781-1\right)\right]}=1.046 $ Figure 3 is a graph of fAV values at different MPRs showing a positive association between fAV values and APC percentages. That is to say, the higher the MPR, the higher the fAV values observed. Results also show an improvement in capacity as the percentage of APCs increases in the traffic stream. Specifically, there was an increase of 10.1% in the observed capacity from 2,368 pcphpl at 0% MPR to 2,607 pcphpl at 40% MPR. The simulated results are consistent with previous studies[13,16,22]. For example, Stanek showed a significant improvement in roadway capacity by 5% from 2,344 pcphpl to 2,466 pcphpl when the MPR for APCs increased from 0% APC to 20%, respectively[13].
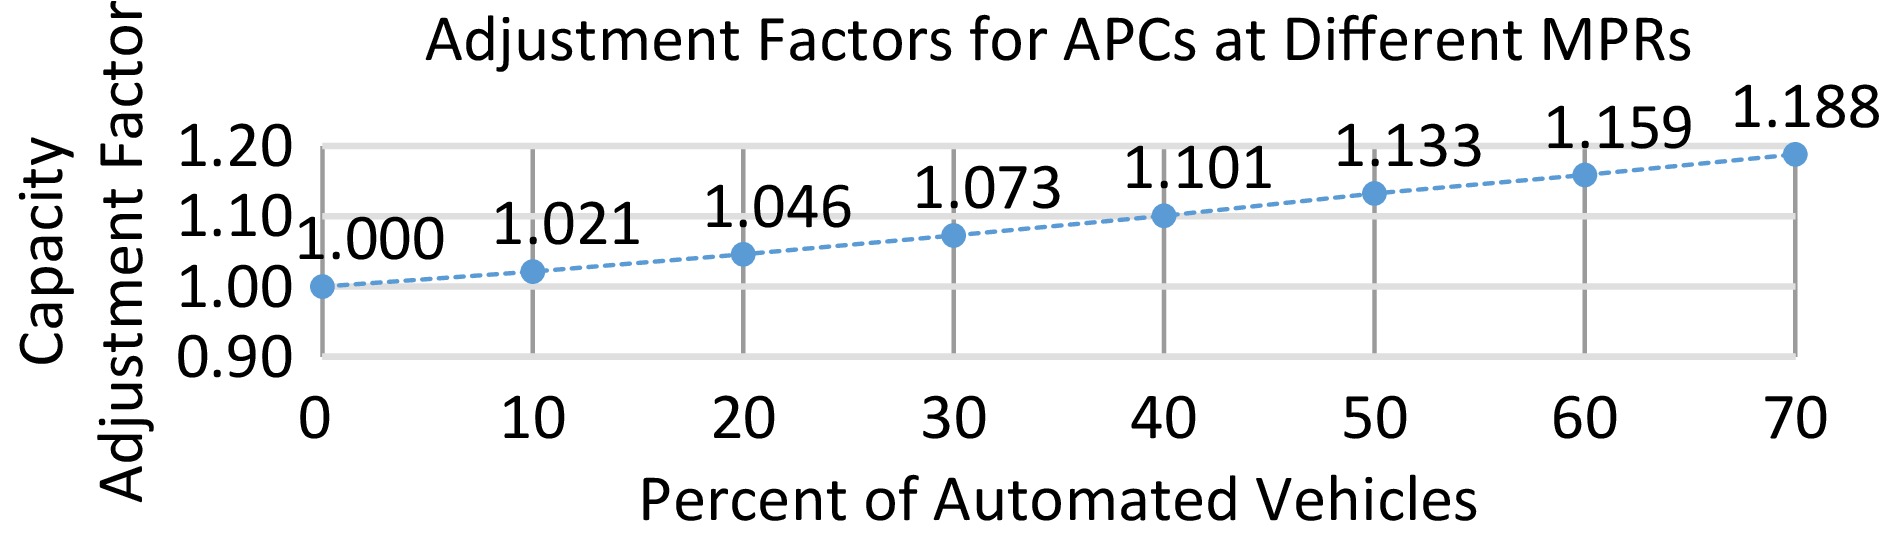
Figure 3.
Calculated adjustment (fAV) factors at various percentages of APCs.
A statistical analysis of the results presented in Table 4 shows that fAV values were significantly different at different values for MPRs. That is to say, adding APCs in the traffic stream with HDPC only impacts substantially capacity. These results also support other observations and researchers' expectations that APCs will perform significantly better than HDPCs[22,24,25]. They further suggest the importance of considering fAV as another adjustment factor to be added to the current list of adjustment factors.
Table 4. Difference in adjustment factors for APCs at different MPRs.
Percent of APCs Difference p > |t| [95% Conf. Interval] 10 vs 0 0.02 0.00 0.02 0.03 20 vs 0 0.05 0.00 0.04 0.06 30 vs 0 0.08 0.00 0.07 0.09 40 vs 0 0.12 0.00 0.11 0.12 50 vs 0 0.15 0.00 0.14 0.16 60 vs 0 0.19 0.00 0.18 0.19 70 vs 0 0.23 0.00 0.22 0.24 20 vs 10 0.03 0.00 0.02 0.03 30 vs 10 0.06 0.00 0.05 0.06 40 vs 10 0.09 0.00 0.09 0.10 50 vs 10 0.13 0.00 0.12 0.13 60 vs 10 0.16 0.00 0.16 0.17 70 vs 10 0.21 0.00 0.20 0.21 30 vs 20 0.03 0.00 0.02 0.04 40 vs 20 0.07 0.00 0.06 0.07 50 vs 20 0.10 0.00 0.09 0.11 60 vs 20 0.14 0.00 0.13 0.14 70 vs 20 0.18 0.00 0.17 0.19 40 vs 30 0.04 0.00 0.03 0.04 50 vs 30 0.07 0.00 0.06 0.08 60 vs 30 0.11 0.00 0.10 0.11 70 vs 30 0.15 0.00 0.14 0.16 50 vs 40 0.03 0.00 0.03 0.04 60 vs 40 0.07 0.00 0.07 0.08 70 vs 40 0.11 0.00 0.11 0.12 60 vs 50 0.04 0.00 0.03 0.04 70 vs 50 0.08 0.00 0.07 0.09 70 vs 60 0.04 0.00 0.04 0.05 Impacts of human-driven HDHV and APCs on vehicle adjustment factors
-
This section discusses the impact of both HDHV and APCs on vehicle adjustment factors. Most of the previous studies that investigated the impacts of APCs focused on the impacts of APCs in a traffic stream with HDPCs without considering the presence of HDHVs[13,14,16]. Although doing so might simplify calculations and simulation time, not incorporating HDHV in the traffic stream might render such analyses unrealistic and produce incorrect results.
APCs will operate in a traffic stream with HDPCs and HDHVs. Thus, studying the impacts of APCs without considering the existence of HDHV might be misleading. In addition, the interaction that APCs will have with HDPCs and HDHVs is vital. This study investigated the impacts of APCs on vehicle adjustment factors by considering traffic streams with different percentages of HDHV. Six traffic streams were considered (scenario 1 to scenario 6) and simulated. Each simulation run's capacity was analyzed to determine the observed adjustment factor (fobserved). By modifying Eqn (4), the fobserved in each simulation run was determined by Eqn (10), and average results were obtained:
$ {C}_{f}={C}_{B}\times{f}_{observed} $ (11) in which
$ {f}_{observed} $ Figure 4 shows experimental adjustment factors due to APCs and HDHVs in the traffic stream. Results show that an increase in the percentage of APCs in the traffic stream increased capacity. However, results further revealed that in the presence of different percentages of HDHVs, the observed improvement in capacity was reduced to a value lower than what was observed in a traffic stream with 0% HDHVs. Adjustment factors simulated at 0% HDHV were used to study the impact of APCs and HDHVs. For example, at 30% MPR, an increase in the percent of HDHVs from 0 to 5 led to a decrease in the observed adjustment factor from 1.073 to 0.987. This implies that a traffic stream with 5% HDHV and 30% APCs is expected to be 8% lower in capacity than a traffic stream with 0% HDHV and 30% APCs. In other words, the same results can be interpreted that in the absence of HDHVs, a traffic stream with 30% APCs improved the freeway capacity by 7.3% (2,541 pcphpl) from the base capacity (2,368 pcphpl). On the other hand, a traffic stream with 5% HDHVs and 30% APCs decreased the freeway capacity by 1.3% (2.337 pcphpl) from the same base capacity of 2,368 pcphpl. These results suggest the importance of considering the presence of both HDHVs and APCs when studying the impacts of APCs on traffic operations.
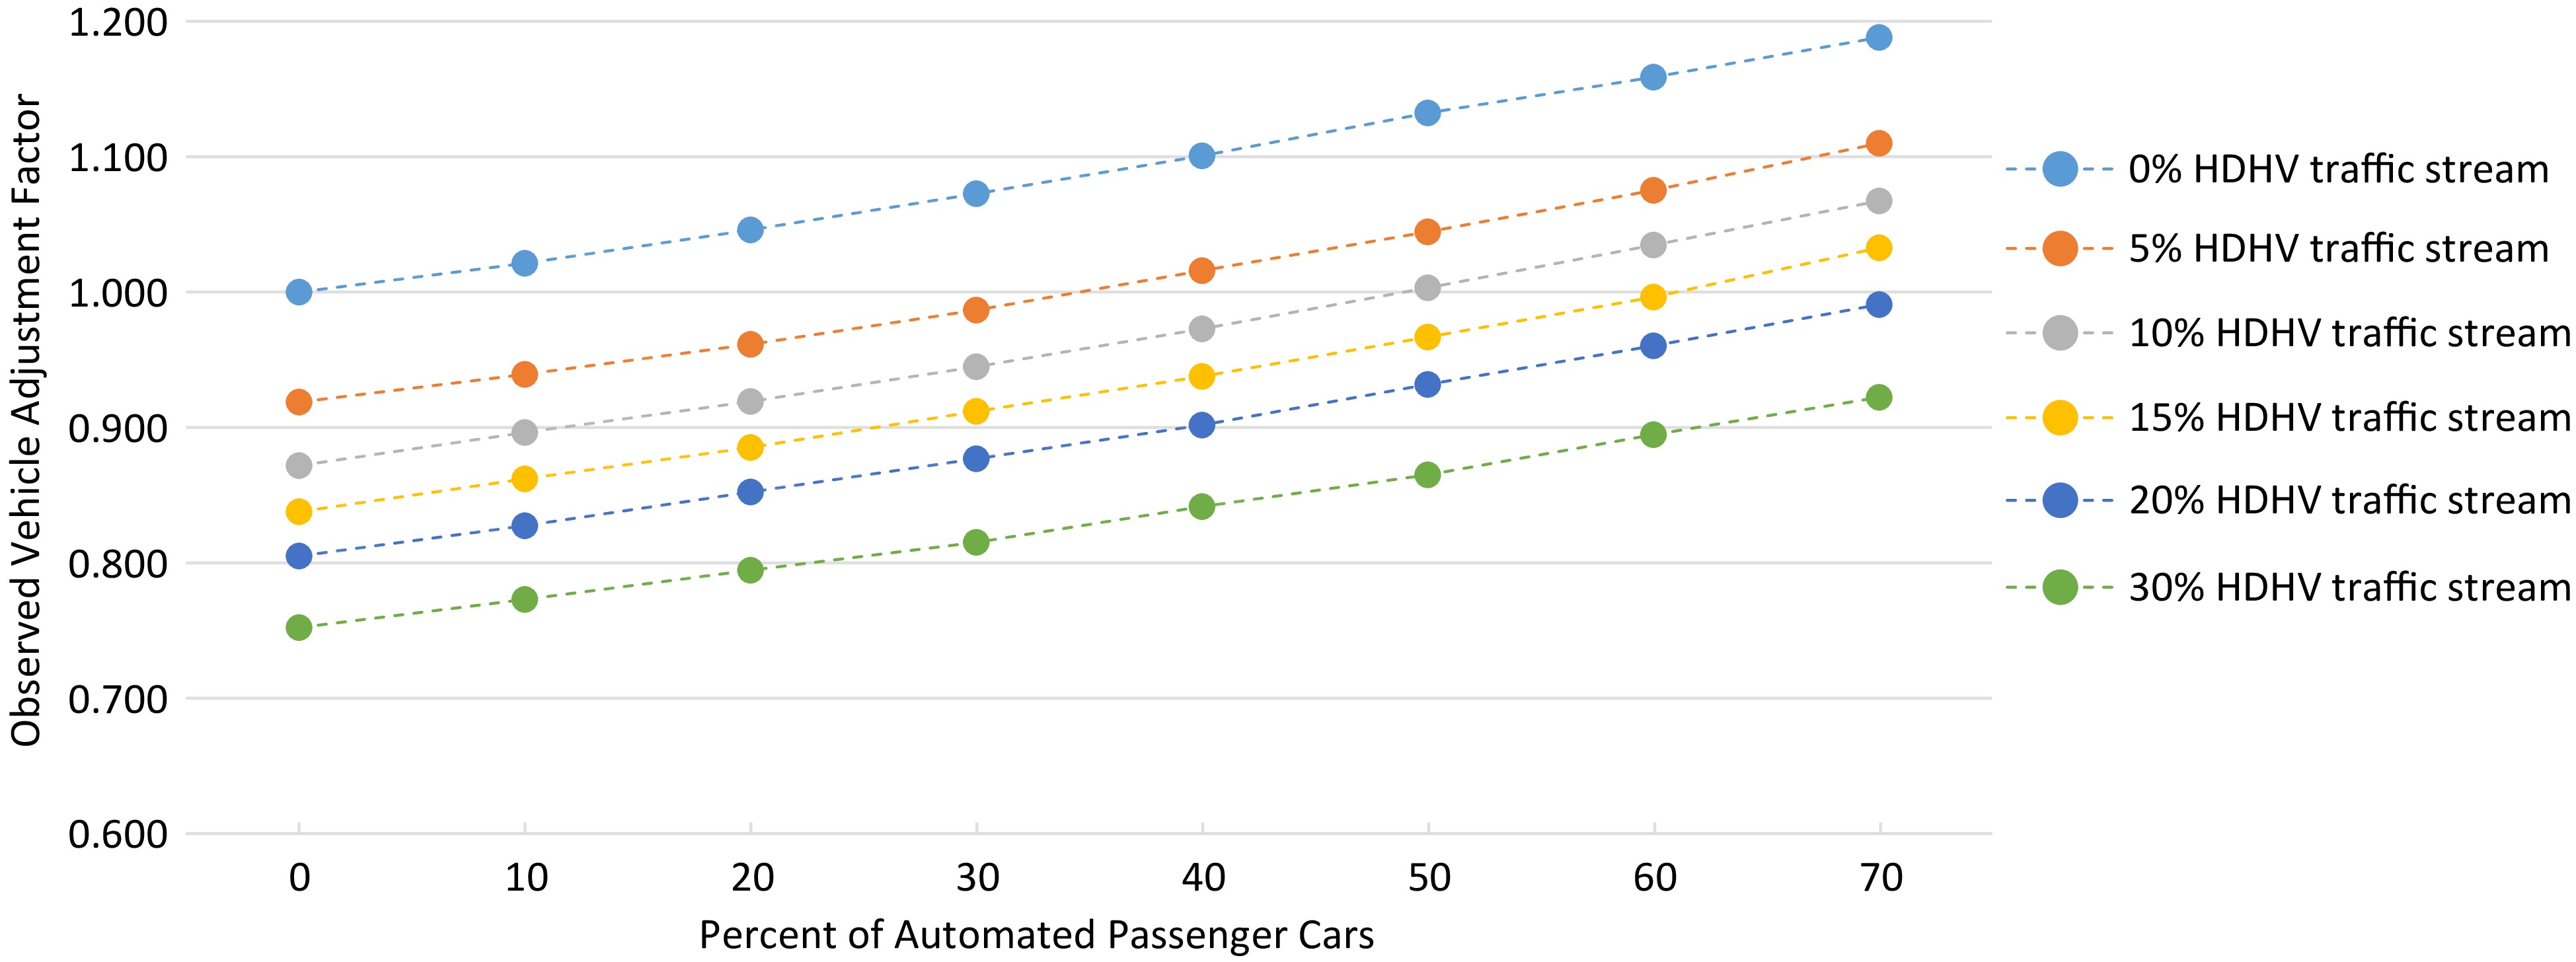
Figure 4.
Impacts of the percentage of HDHV and APCs on fobserved.
The t-test results show that the presence of HDHV and APCs significantly impacts observed heavy vehicle adjustment factors. A traffic stream with HDPCs and APCs only behaves significantly differently from a traffic stream of HDPCs, HDHVs, and APCs. For example, a traffic stream with 0% HDHVs and 30% APCs resulted in a significantly higher fobserved than a traffic stream with 5% HDHV and 30% APCs. Such results show that at the same MPRs of APCs, traffic streams with different HDHVs are significantly different. It is essential to consider the presence of both HDHVs and APCs when investigating the impacts of APCs on freeway operation. Table 5 summarizes significant differences in the observed vehicle adjustment factors for selected traffic streams: traffic stream with 0% APCs and 70% APCs at different proportions of HDHVs.
Table 5. Significant differences in fobserved at different percentages of APCs and HDHVs.
Percent
of APCsTruck
percentagesDifference
in CAFStd.
Err.p > |t| [95% Conf. Interval] 0 5 vs 0 −0.08 0.00 0.00* −0.09 −0.07 10 vs 0 −0.13 0.00 0.00* −0.14 −0.12 15 vs 0 −0.16 0.00 0.00* −0.17 −0.15 20 vs 0 −0.19 0.00 0.00* −0.20 −0.19 30 vs 0 −0.25 0.00 0.00* −0.26 −0.24 10 vs 5 −0.05 0.00 0.00* −0.06 −0.04 15 vs 5 −0.08 0.00 0.00* −0.09 −0.07 20 vs 5 −0.11 0.00 0.00* −0.12 −0.10 30 vs 5 −0.17 0.00 0.00* −0.17 −0.16 15 vs 10 −0.03 0.00 0.00* −0.04 −0.03 20 vs 10 −0.07 0.00 0.00* −0.07 −0.06 30 vs 10 −0.12 0.00 0.00* −0.13 −0.11 20 vs 15 −0.03 0.00 0.00* −0.04 −0.02 30 vs 15 −0.09 0.00 0.00* −0.09 −0.08 30 vs 20 −0.05 0.00 0.00* −0.06 −0.05 70 5 vs 0 −0.08 0.01 0.00* −0.09 −0.06 10 vs 0 −0.12 0.01 0.00* −0.14 −0.11 15 vs 0 −0.16 0.01 0.00* −0.17 −0.14 20 vs 0 −0.20 0.01 0.00* −0.21 −0.18 30 vs 0 −0.27 0.01 0.00* −0.28 −0.25 10 vs 5 −0.05 0.01 0.00* −0.06 −0.03 15 vs 5 −0.08 0.01 0.00* −0.09 −0.06 20 vs 5 −0.12 0.01 0.00* −0.14 −0.10 30 vs 5 −0.19 0.01 0.00* −0.20 −0.17 15 vs 10 −0.03 0.01 0.00* −0.05 −0.02 20 vs 10 −0.08 0.01 0.00* −0.09 −0.06 30 vs 10 −0.14 0.01 0.00* −0.16 −0.13 20 vs 15 −0.04 0.01 0.00* −0.06 −0.03 30 vs 15 −0.11 0.01 0.00* −0.13 −0.10 30 vs 20 −0.07 0.01 0.00* −0.08 −0.05 Applicability of the current HCM approach to estimate equivalent vehicle adjustment factors
-
This study investigated a suitable methodology that accurately estimated an equivalent vehicle adjustment factor due to HDHVs and APCs from the two adjustment factors fHV and fAV determined. From two formulas, one from the HCM approach (multiplication of adjustment factors) and another proposed by this study, equivalent adjustment factors fHCM and fproposed, respectively, were calculated. The two formulas are presented in this manuscript's Eqn 6 and 7.
$ {f}_{HCM}=\dfrac{1}{[1+{P}_{T}\left({E}_{T}-1\right)]}\times\dfrac{1}{\left[1+{P}_{AV}\left({E}_{AV}-1\right)\right]}={f}_{HV}\times{f}_{AV} $ $ {f}_{proposed}=\dfrac{1}{\left[1+{P}_{T}\left({E}_{T}-1\right)+{P}_{AV}\left({E}_{AV}-1\right)\right]} $ The two equivalent adjustment factors (fHCM and fproposed) were compared against adjustment factors observed (fobserved) from simulations of different traffic streams. Figure 5 compares equivalent adjustment factors observed from simulation (fobserved) against those calculated from the two approaches (fHCM and fproposed). The graphs show that the three factors (fHCM, fproposed, and fobserved) are the same at any MPR of APCs in the absence of HDHVs in the traffic stream (0 percent of HDHVs). However, as the percent of HDHVs and APCs increased, a deviation of fHCM values was observed. At any percentage of HDHV in the traffic stream, the fHCM values deviated slightly at lower MPRs of APCs; however, the deviation increased as the percent of APCs increased. Such observation suggests that if the observed differences are significant, the equivalent adjustment factors calculated from the HCM (fHCM) approach don't accurately show the impact of HDHVs and APCs on vehicle adjustment factors.
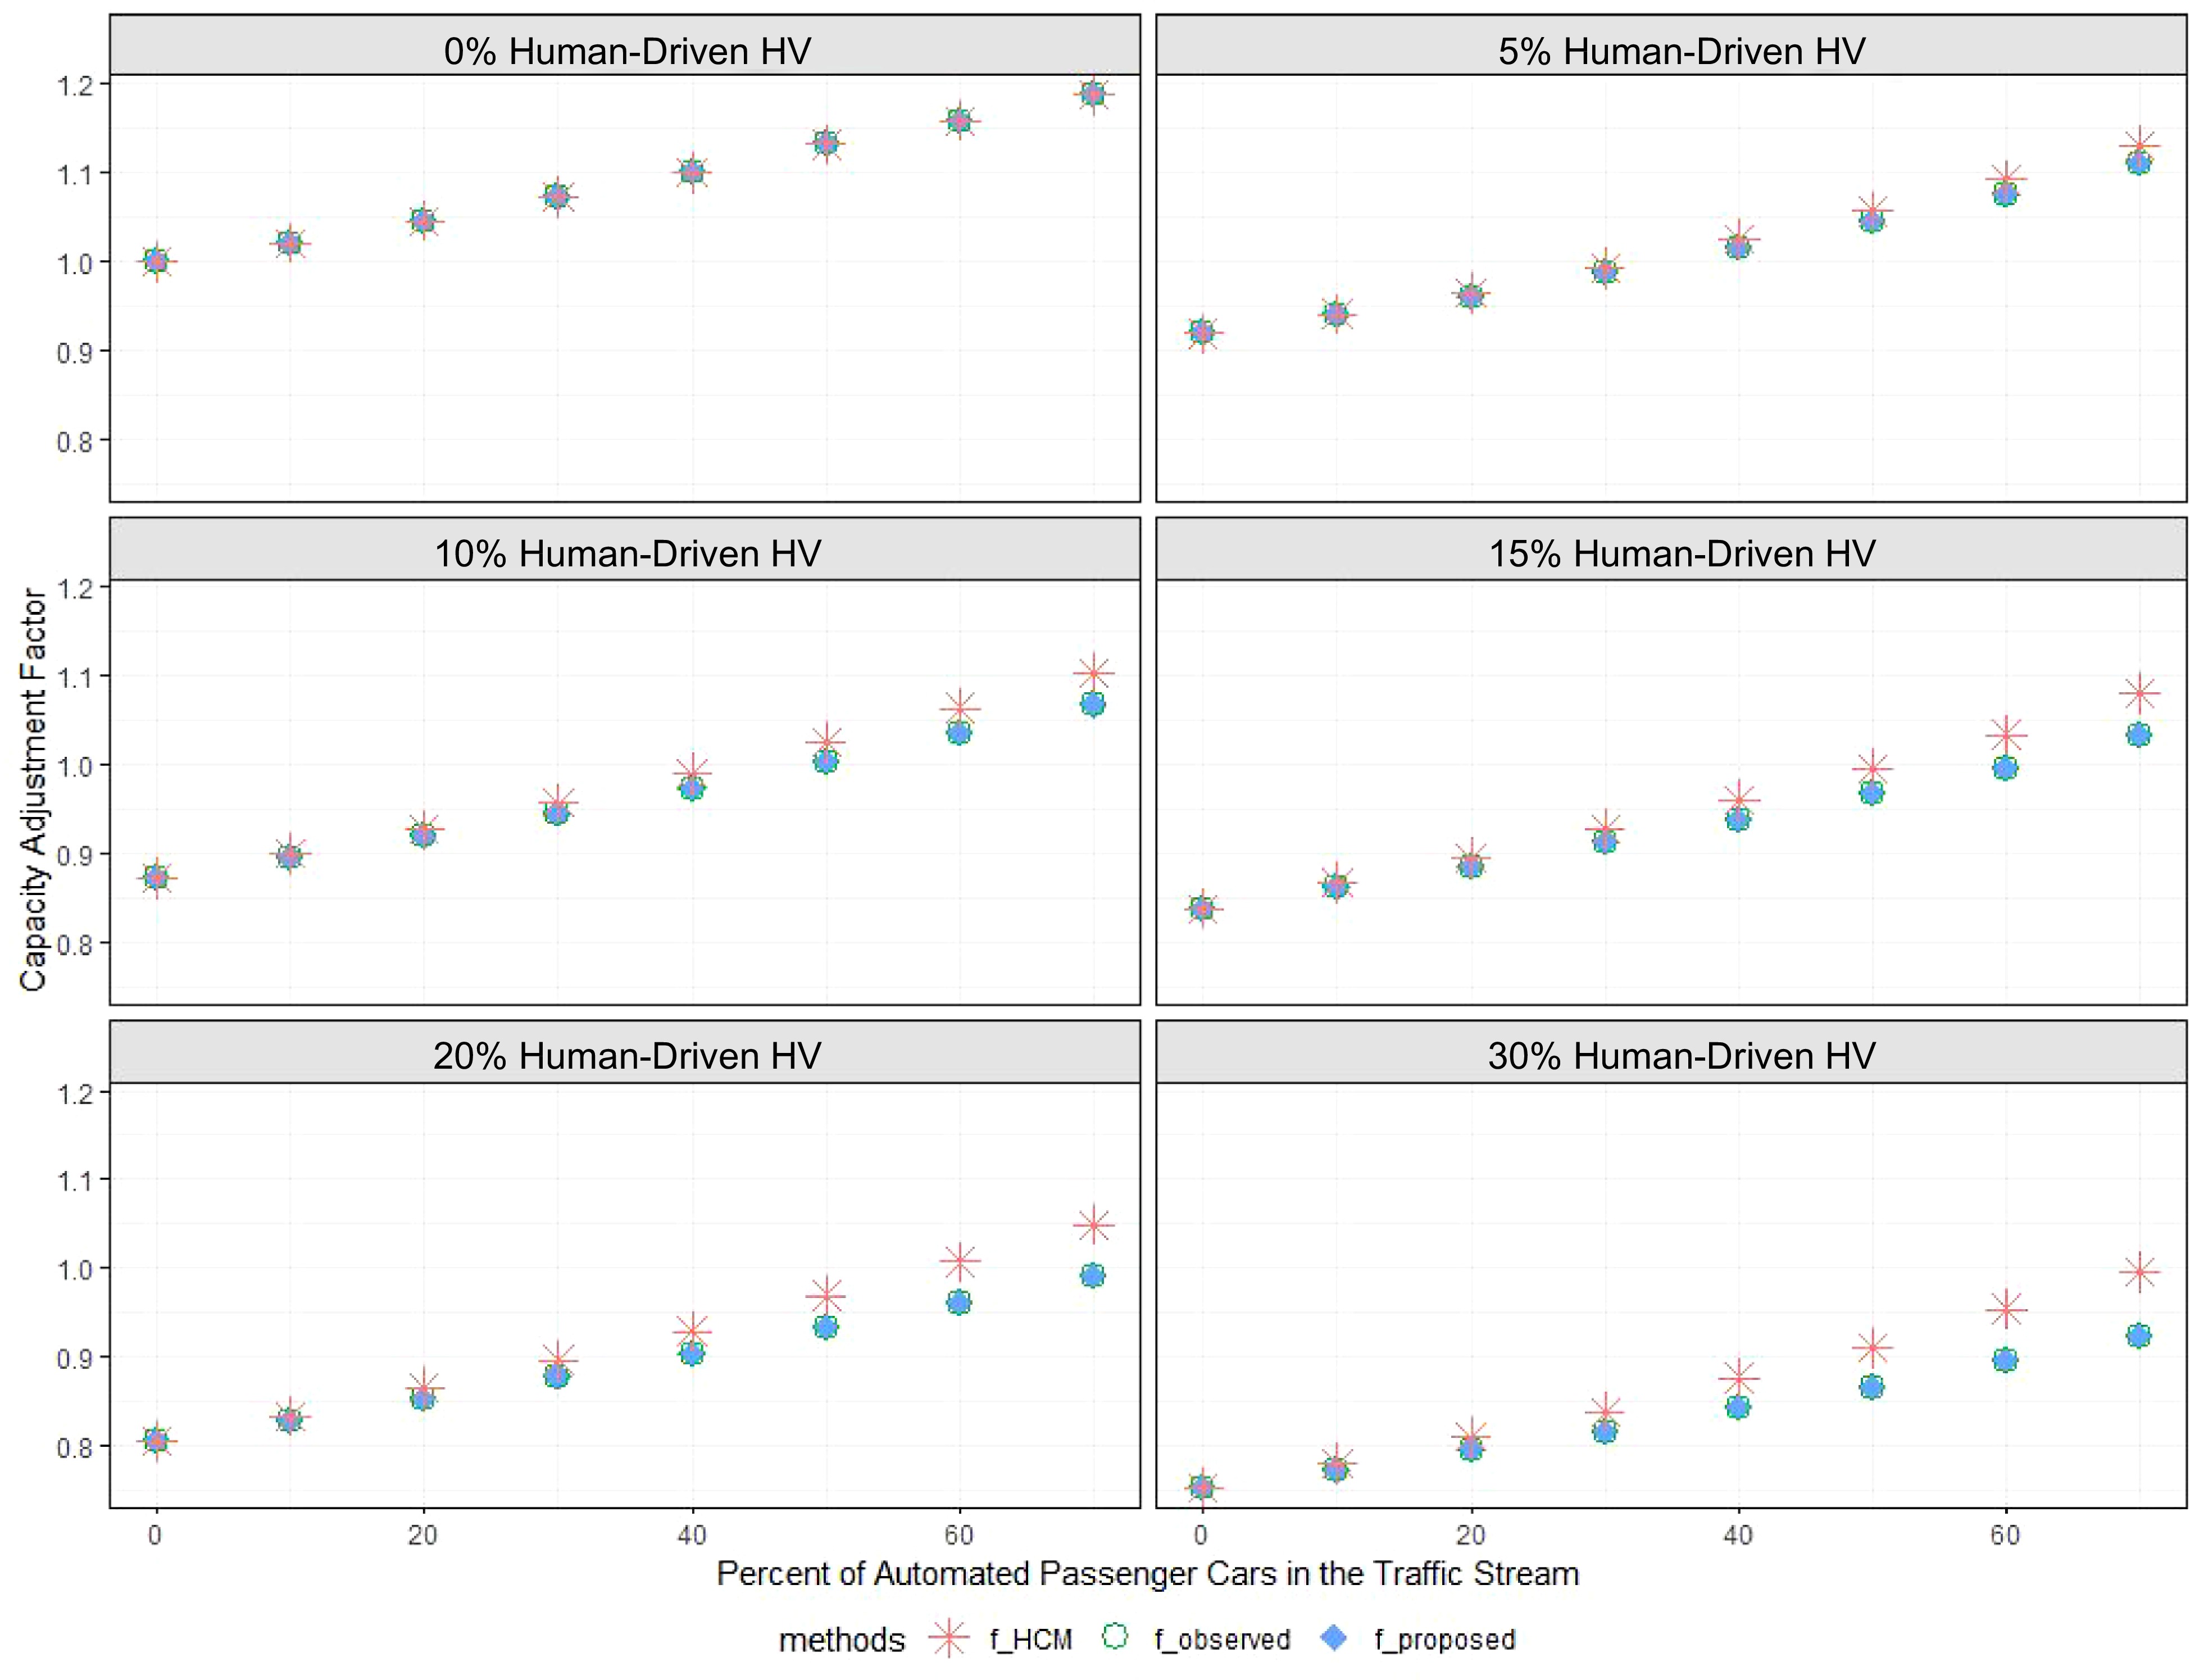
Figure 5.
Equivalent adjustment factors from the three approaches.
Table 6 summarizes the t-statistics test to check any significant differences in the observed (fobserved) adjustment factors and those calculated by the HCM formula (fHCM). It was revealed that the two factors were significantly different as the proportion of HDHV and APCs increased. For example, at 5% HDHV, the two factors (fobserved and fHCM) were statistically the same at an MPR of less than 30%. The two factors (fobserved and fHCM) were statistically different at an MPR of 30%. However, for a traffic stream with at least 10% of HDHV, there was a significant difference between the two factors (fobserved and fHCM) when the proportion of APCs in the traffic stream reached at least 10%. These results suggest two things: 1) there is a need to consider the presence of HDHVs in the traffic stream when studying the impacts of APCs on adjustment factors. 2) There is a need to revise the current HCM formula to accommodate both two types of adjustment factors (fHV and fAV). The revised formula should quantitatively estimate equivalent vehicle adjustment factors statistically similar to those directly observed from the simulation at any percentage of HDHV and APCs.
Table 6. Differences in adjustment factors between the observed (fobserved) and calculated (fHCM).
HDHV percentage Percent
of APCsObserved
adjustment
factor
(fobserved)Calculated
adjustment
factor
(fHCM)Std.
Err.p > |t| [95% Conf. Interval] 5 0 0.919 0.919 0.00 1.00 −0.005 0.005 10 0.940 0.941 0.49 0.63 −0.003 0.005 20 0.962 0.965 1.40 0.17* −0.001 0.007 30 0.987 0.993 2.73 0.01* 0.002 0.010 40 1.015 1.026 4.02 0.00* 0.005 0.016 50 1.045 1.058 4.13 0.00* 0.006 0.019 60 1.076 1.093 6.55 0.00* 0.012 0.023 70 1.111 1.131 4.88 0.00* 0.011 0.028 10 0 0.871 0.871 0.00 1.00 −0.005 0.005 10 0.898 0.901 0.95 0.35 −0.003 0.008 20 0.920 0.926 2.26 0.03* 0.001 0.011 30 0.944 0.956 5.58 0.00* 0.008 0.016 40 0.974 0.990 5.74 0.00* 0.010 0.022 50 1.004 1.026 6.09 0.00* 0.015 0.029 60 1.035 1.064 7.57 0.00* 0.021 0.037 70 1.066 1.104 8.31 0.00* 0.028 0.047 15 0 0.838 0.838 0.00 1.00 −0.006 0.006 10 0.862 0.868 2.60 0.01* 0.001 0.011 20 0.885 0.894 3.41 0.00* 0.003 0.014 30 0.912 0.928 6.08 0.00* 0.011 0.021 40 0.938 0.960 7.63 0.00* 0.016 0.027 50 0.967 0.998 10.32 0.00* 0.025 0.037 60 0.996 1.036 11.14 0.00* 0.032 0.047 70 1.033 1.081 9.77 0.00* 0.038 0.059 20 0 0.806 0.806 0.00 1.00 −0.007 0.007 10 0.828 0.833 2.03 0.05* 0.000 0.011 20 0.853 0.865 5.95 0.00* 0.008 0.017 30 0.876 0.896 6.04 0.00* 0.013 0.027 40 0.902 0.929 7.27 0.00* 0.020 0.035 50 0.932 0.969 9.36 0.00* 0.029 0.044 60 0.960 1.009 10.53 0.00* 0.039 0.058 70 0.991 1.050 8.09 0.00* 0.044 0.073 30 0 0.752 0.752 0.00 1.00 −0.007 0.007 10 0.773 0.781 2.51 0.02* 0.002 0.014 20 0.795 0.809 4.17 0.00* 0.007 0.021 30 0.816 0.839 5.72 0.00* 0.015 0.031 40 0.843 0.875 8.27 0.00* 0.025 0.040 50 0.866 0.910 9.48 0.00* 0.035 0.053 60 0.894 0.955 8.30 0.00* 0.046 0.075 70 0.922 0.996 9.16 0.00* 0.058 0.090 On the other hand, adjustment factors due to HDHV and APCs calculated using the formula proposed in this study (fproposed) were compared to adjustment factors observed from simulation results (fobserved). Table 7 summarizes the results from the t-statistics that tested any significant difference between the two adjustment factors (fobserved and fproposed). It was revealed that there was no significant difference between observed adjustment factors (fobserved) and the adjustment factors calculated from the proposed formula (fproposed). The proposed formula considered the interaction among all the vehicles analyzed in the traffic stream. Because the computed adjustment factors were significantly similar to simulated adjustment factors (from simulation), these results justify considering the interactions between APCs and other vehicle types already present in the traffic stream.
Table 7. Differences in adjustment factors between the observed (fobserved) and calculated (fproposed).
Truck
percentagePercent
of APCsObserved
adjustment
factor
(fobserved)Calculated
adjustment
factor
(fproposed)Std.
Err.p > |t| [95% Conf. Interval] 5 0 0.919 0.919 0.00 1.00 −0.005 0.005 10 0.940 0.940 0.00 1.00 −0.004 0.004 20 0.962 0.962 0.00 1.00 −0.004 0.004 30 0.987 0.987 0.00 1.00 −0.005 0.005 40 1.015 1.015 0.00 1.00 −0.005 0.005 50 1.045 1.045 0.00 1.00 −0.006 0.006 60 1.076 1.076 0.00 1.00 −0.006 0.006 70 1.111 1.111 0.00 1.00 −0.008 0.008 10 0 0.871 0.871 0.00 1.00 −0.005 0.005 10 0.898 0.898 0.00 1.00 −0.006 0.006 20 0.920 0.920 0.00 1.00 −0.005 0.005 30 0.944 0.944 0.00 1.00 −0.004 0.004 40 0.974 0.974 0.00 1.00 −0.006 0.006 50 1.004 1.004 0.00 1.00 −0.007 0.007 60 1.035 1.035 0.00 1.00 −0.008 0.008 70 1.066 1.066 0.00 1.00 −0.009 0.009 15 0 0.838 0.838 0.00 1.00 −0.006 0.006 10 0.862 0.862 0.00 1.00 −0.005 0.005 20 0.885 0.885 0.00 1.00 −0.005 0.005 30 0.912 0.912 0.00 1.00 −0.005 0.005 40 0.938 0.938 0.00 1.00 −0.006 0.006 50 0.967 0.967 0.00 1.00 −0.006 0.006 60 0.996 0.996 0.00 1.00 −0.008 0.008 70 1.033 1.033 0.00 1.00 −0.010 0.010 20 0 0.806 0.806 0.00 1.00 −0.007 0.007 10 0.828 0.828 0.00 1.00 −0.006 0.006 20 0.853 0.853 0.00 1.00 −0.005 0.005 30 0.876 0.876 0.00 1.00 −0.006 0.006 40 0.902 0.902 0.00 1.00 −0.007 0.007 50 0.932 0.932 0.00 1.00 −0.008 0.008 60 0.960 0.960 0.00 1.00 −0.010 0.010 70 0.991 0.991 0.01 1.00 −0.014 0.014 30 0 0.752 0.752 0.00 1.00 −0.007 0.007 10 0.773 0.773 0.00 1.00 −0.006 0.006 20 0.795 0.795 0.00 1.00 −0.007 0.007 30 0.816 0.816 0.00 1.00 −0.008 0.008 40 0.843 0.843 0.00 1.00 −0.008 0.008 50 0.866 0.866 0.00 1.00 −0.009 0.009 60 0.894 0.894 0.01 1.00 −0.013 0.013 70 0.922 0.922 0.01 1.00 −0.015 0.015 -
The impacts of automated vehicles on different performance factors for the basic freeway sections have been studied and well documented. These performance factors include capacity, travel time, fuel consumption, congestion, etc. This study extended the knowledge by studying the impacts of APCs on vehicle equivalents at different MPRs. APCs replaced an equivalent percentage of HDPCs at an increment of 10%. It concentrated on the effects of both HDHV and APCs on the freeway capacity. Analysis of this research revealed the following:
1. When comparing HDPCs to APCs, the APCs significantly improve freeway capacity.
2. The presence of APCs in the traffic stream with HDPCs only significantly impacted the passenger car equivalents values due to APCs (EAV). There was a significant difference in EAV when the proportion of APCs was at least 10%.
3. The presence of HDHV significantly impacts the analysis of the impact of APCs. The impact of APCs in a traffic stream with 0% HDHVs is different from the impact of APCs in a traffic stream with the presence of HDHVs.
Each of these observations supports one overall conclusion: the current methodology used by the HCM needs to be revised to accommodate the impacts of both the HDHVs and APCs on the operations of the traffic stream and accurately estimate the equivalent vehicle adjustment factors.
With the rapid development in the intelligent transportation system, this research provides a basis for future research in connected/APCs. The impacts of both the HDHV and APCs should be studied in detail. Results from this study emphasize the need for a detailed analysis of the change in vehicle equivalencies at different penetration rates and percentages of HDHV. Furthermore, the study informs future researchers on the necessity to revise the current HCM approach in adjusting the base capacity due to the impacts of both HDHV and APCs.
This research provides a fundamental understanding of the impacts of HDHV and APCs, filling a critical need as intelligent transportation systems evolve. Results from this study will provide a basis for whether a detailed analysis of the change in vehicle equivalencies at different penetration rates and percentages of HDHV is essential. Furthermore, the study will inform future researchers of the necessity to revise the current HCM approach to adjust the base capacity due to the impacts of both HDHV and APCs.
Future work should address the impact of V2V communication on HDHVs and APCs in the traffic mix. Significant research still needs to address the connectivity of APCs because the maximum effect is expected[16]. With these results, one can predict that even though the actual values might change (show more improvement due to the connectivity of vehicles), the trend of how the traffic stream is expected to behave will not be different.
-
The authors confirm their contribution to the paper as follows: study conception and design: Lyimo SM; data collection: Lyimo SM, Kwigizile V; analysis and interpretation of results: Lyimo SM, Kwigizile V, Oh JS, Asher ZD; draft manuscript preparation: Lyimo SM, Kwigizile V, Oh JS, Asher ZD. All authors reviewed the results and approved the final version of the manuscript.
-
The datasets generated during and/or analyzed during the current study are available from the corresponding author on reasonable request.
-
The authors declare that they have no conflict of interest. Editor note: Valerian Kwigizile is the Editorial Board member of Journal Digital Transportation and Safety. He was blinded from reviewing or making decisions on the manuscript. The article was subject to the journal’s standard procedures, with peer-review handled independently of this Editorial Board member and his research groups.
- Copyright: © 2023 by the author(s). Published by Maximum Academic Press, Fayetteville, GA. This article is an open access article distributed under Creative Commons Attribution License (CC BY 4.0), visit https://creativecommons.org/licenses/by/4.0/.
-
About this article
Cite this article
Lyimo SM, Kwigizile V, Oh JS, Asher ZD. 2023. Impacts of automated passenger cars on the capacity of a freeway basic section: applicability in the determination of vehicle adjustment factors in mixed traffic. Digital Transportation and Safety 2(4):298−307 doi: 10.48130/DTS-2023-0025 

Impacts of automated passenger cars on the capacity of a freeway basic section: applicability in the determination of vehicle adjustment factors in mixed traffic
- Received: 21 June 2023
- Accepted: 15 December 2023
- Published online: 28 December 2023
Abstract: The highway capacity manual (HCM) provides a formula to calculate the heavy vehicle adjustment factor (fHV) as a function of passenger car equivalent factors for the heavy vehicle (ET). However, a significant drawback is that the methodology was established solely based on human-driven passenger cars (HDPC) and human-driven heavy vehicles (HDHV). Due to automated passenger cars (APCs), a new adjustment factor (fAV) might be expected. This study simulated traffic flows at different percentages of HDHVs and APCs to investigate the impacts of HDHVs and APCs on freeway capacity by analyzing their influence on fHV and fAV values. The simulation determined observed adjustment factors at different percentages of HDHVs and APCs (fobserved). The HCM formula was used to calculate (fHCM). Modifications to the HCM formula are proposed, and vehicle adjustment factors due to HDHVs and APCs were calculated (fproposed). Results showed that, in the presence of APCs, while fobserved and fHCM were statistically significantly different, fobserved and fproposed were statistically equal. Hence, this study recommends using the proposed formula when determining vehicle adjustment factors (fproposed) due to HDHVs and APCs in the traffic stream.