


-
A highway tunnel is classified as an extra-long tunnel when its length surpasses 3 km[1]. Analysis of comprehensive tunnel traffic accident statistics reveals a clear correlation between the likelihood of traffic accidents and tunnel length. Long and extra-long tunnels experience significantly more accidents, both in terms of frequency and severity, compared to short and medium tunnels. Additionally, the longer the midsection of an extra-long tunnel, the greater the likelihood of traffic accidents[2]. When traffic accidents show the characteristics of agglomeration in some places or sections of the road (especially a specific type of accident), it means that there is a certain connection between these accidents and the road[3]. Primary factors contributing to traffic accidents in tunnel sections involve drivers experiencing visual illusions caused by the 'black and white hole' effect at tunnel entrances and exits[4], as well as a lack of stimulation in the midsection of the tunnel resulting in driving fatigue[5]. Sagberg [6] investigated the development of driving fatigue in distinct roadway setups and differing driving circumstances. The findings revealed that small sensory stimuli from the traffic environment, low traffic volume, and a single linear roadway segment contributed to driver fatigue. Fatigue experienced by drivers can be categorized into long-term and short-term fatigue[7]. Within extra-long tunnels, the enclosed environment, limited illumination in the middle section, absence of scenery, and a consistent color palette cause drivers to concentrate primarily on the road ahead, leading to short-term fatigue and restlessness over a brief period. With the widespread construction of extra-long highway tunnels in China, the rising frequency of traffic accidents attributed to driving fatigue induced by the monotonous tunnel environment underscores the pressing need to enhance traffic safety within these tunnels.
In an effort to combat short-term fatigue in extra-long tunnels and improve overall traffic safety, engineers from both domestic and international backgrounds have suggested widening a specific segment of the tunnel's cross-section. This segment incorporates various techniques, including painted natural landscapes, colored patterns, and colored LED strips. Unfortunately, existing regulations and engineering cases lack precise theoretical foundations and unified design methods for crucial parameters, including the location, length, and cross-sectional design of this technology. Domestic regulations[1,8] have only proposed measures to mitigate short-term fatigue through adjustments in the longitudinal and transverse profile design of extra-long tunnels and the inclusion of traffic-related facilities like reflective rings and contour marks. Unfortunately, these measures have limited effectiveness in addressing concerns related to the monotonous driving environment within extra-long tunnels. Consequently, there is a need to independently design particular sections within the middle segment of extra-long tunnels, segmenting them to minimize the impact of short-term fatigue on driving safety. Therefore, this paper establishes the concept of a 'fatigue arousal zone' and conducts research on its essential parameters using data obtained from natural driving fatigue experiments. This study introduces innovative perspectives for the application of fatigue arousal technology in extra-long tunnels.
Review of fatigue arousal
-
Presently, there is a body of theoretical research, both domestic and international, focusing on fatigue arousal technology in extra-long tunnels. Shimojo et al.[9] conducted simulated driving experiments in the Hokkaido Nopporo Bay extra-long tunnel, suggesting that installing large distance signs every 5 to 10 km could reduce driving fatigue by providing additional traffic information. Pierre et al.[10] conducted experiments by altering road environmental elements in various road environments to increase stimulation for drivers, suggesting that monotonous driving environments and excessively long driving times are prone to causing driving fatigue, which can be mitigated by enhancing stimulus intensity through increased landscape scale, color, shape, and other factors. Jayakumar et al.[11] conducted research on driving fatigue in long tunnels based on electroencephalogram (EEG) data collection, suggesting that colorful tunnels can alleviate monotony, provide visual stimulation to drivers, and prevent fatigue while driving in tunnels. Ye et al.[12], Patten & Mardh[13], and Chen et al.[14] have conducted comprehensive investigations on tunnel landscapes. The primary finding is that incorporating artificial landscapes within tunnels can effectively alleviate driving fatigue in monotonous environments and improve drivers' perception of speed and distance. Building on the hypnotic effects within tunnels, Xu et al.[15] and Qin et al.[16] proposed a method for installing colored light strips in the middle section of tunnels. Research results indicated that when drivers pass through colored light strips, they tend to pay minimal attention to the patterns on the walls on both sides, and the fatigue-relief effect of the light strips has some limitations. Song et al.[17], Du et al.[18], and Luo et al.[19] advocated the installation of unique patterns within tunnels, including inverted triangles, heart rate patterns, and rhythmic linear patterns. These patterns not only enhance drivers' perception of space and speed but also help alleviate driving fatigue. In the realm of practical engineering cases, Kvaale & Lotsberg[20] suggested the installation of an artificial landscape strip inside the Laerdal Tunnel in Norway. To achieve this, wash wall lights were employed to establish a predominantly blue driving environment. Likewise, the Qinling Zhongnanshan Highway Tunnel in China adopts a similar strategy with a dominant blue color scheme enhanced by purple lighting and cloud patterns, creating a simulated blue sky and white cloud effect.
Nevertheless, Kvaale & Lotsberg labeled the landscape strip in the Laerdal Tunnel as the 'special light belt'[20], while the Qinling Zhongnanshan Highway Tunnel in China pioneered the use of a 'special light belt', which they referred to as the 'tunnel landscape belt'[21]. However, the terms 'special light belt' and 'tunnel landscape belt' are quite broad and may not be easily comprehensible to passengers and drivers, potentially leading to confusion. In contrast, the term 'fatigue arousal zone' directly conveys the area's purpose and function. Furthermore, Professor Du[5,22] of Wuhan University of Technology and Dr. Gao[23] of Beijing University of Technology have frequently referenced this term, but they have not yet supplied a precise definition or comprehensive explanation. Hence, there is a need to define the fatigue arousal zone in a standardized manner, conduct research on its essential parameters, and offer a precise theoretical foundation along with a consistent setup method.
Research gap and problems
-
The majority of existing studies depend on indoor simulated driving experiments. Although these indoor tests closely replicate actual driving environments, differences in the psychological and physiological conditions of the participants compared to real driving situations can lead to disparities between test results and natural driving experiences. Additionally, a limited number of studies have employed natural driving experiments, primarily concentrating on long straight sections of open desert or grassland highways. There has been minimal investigation into driving fatigue within extra-long tunnel segments. Furthermore, the majority of existing research has concentrated on long-term fatigue resulting from time accumulation or monotonous fatigue experienced on extended straight road sections, such as monotonous grassland or desert landscapes. There is a noticeable deficiency in research on short-term fatigue within the confined spaces of tunnels. Additionally, both domestically and internationally, research on arousal techniques for extra-long tunnels has not established a precise theoretical basis or a systematic design framework. Particularly lacking are criteria for the positioning, length, and design of anti-fatigue facilities or technologies within extra-long tunnels, along with a shortage of objective quantitative data to support these aspects.
Consequently, conducting comprehensive research on the absence of key parameter design methods for fatigue arousal technology in extra-long tunnels is both essential and worthwhile. In this study, natural driving fatigue experiments were carried out in extra-long tunnels. Data collected included eye-tracking data, vehicle operational data, tunnel illumination data, and more. The study quantified the influence of the extra-long tunnel environment on driving fatigue. This research supplies valuable insights and strategies for guiding future investigations into fatigue arousal zones.
-
The Chongqing G69 Yinbai Expressway section extending from Wangjia Service Area to Kaizhou Interchange in Wanzhou, China, spans 120.5 km and is a dual-carriageway four-lane highway. The experimental section comprises a total of 17 tunnels, constituting 36.6% of the entire length, while the Kaizhou section exhibits a notably high tunnel proportion, reaching 55.2%. Referring to the research findings of Hu[24], tunnels with a spacing of 250 m or less are defined as adjacent tunnels, while tunnels with spacing between 250 m and 1000 m are considered consecutive tunnels. Together, adjacent and consecutive tunnels form what is termed a 'tunnel group'. From the perspective of drivers' experiences, a section composed of tunnel groups can be considered as an extra-long tunnel[25]. A segment of open road is chosen as a comparative test section. Table 1 displays the details of the extra-long tunnels and tunnel groups within the experimental section.
Table 1. Information of experimental tunnels.
Condition Tunnel name Distance to upstream tunnel exit (m) Length (m) Road type 1 Wadianzi tunnel-Tiefengshan expressway − 13,800 Open road 2 Dashu tunnel group Dashu tunnel − 5,825 Tunnel group Kuzhuba tunnel 320 Wangjia tunnel 220 Longquan tunnel 70 3 Longjing tunnel group Longjing tunnel − 13,448 Tunnel group Daping tunnel 80 Guangchengshan tunnel 270 Yousha tunnel 322 Xiaoling tunnel 112 Dongqiao tunnel 380 Yanghegou tunnel 116 4 Wadianzi tunnel − 3,356 Extra-long tunnel 5 Tiefengshan tunnel − 11,362 Extra-long tunnel 6 Nanshan tunnel − 4,828 Extra-long tunnel Experimental equipment
-
The experimental vehicle of choice was the seven-seater Honda MPV car. Drivers' eye-tracking data was collected using the Tobbi Pro Glasses 2-type eye tracker, operating at a 50 Hz sampling frequency and a resolution of 1,280 × 960. Speedbox GPS non-contact vehicle speed sensors were employed to measure various parameters, including speed, acceleration, distance, and position of the moving vehicle, with a sampling frequency of 200 Hz. The TES-1339R illuminance meter was utilized to gather illuminance data within the tunnel, boasting a measurement range of 0.01~999,900 Lux and an accuracy of 0.01 Lux. Additional equipment encompassed a dash-cam, batteries, and more. The experimental setup is depicted in Fig. 1.
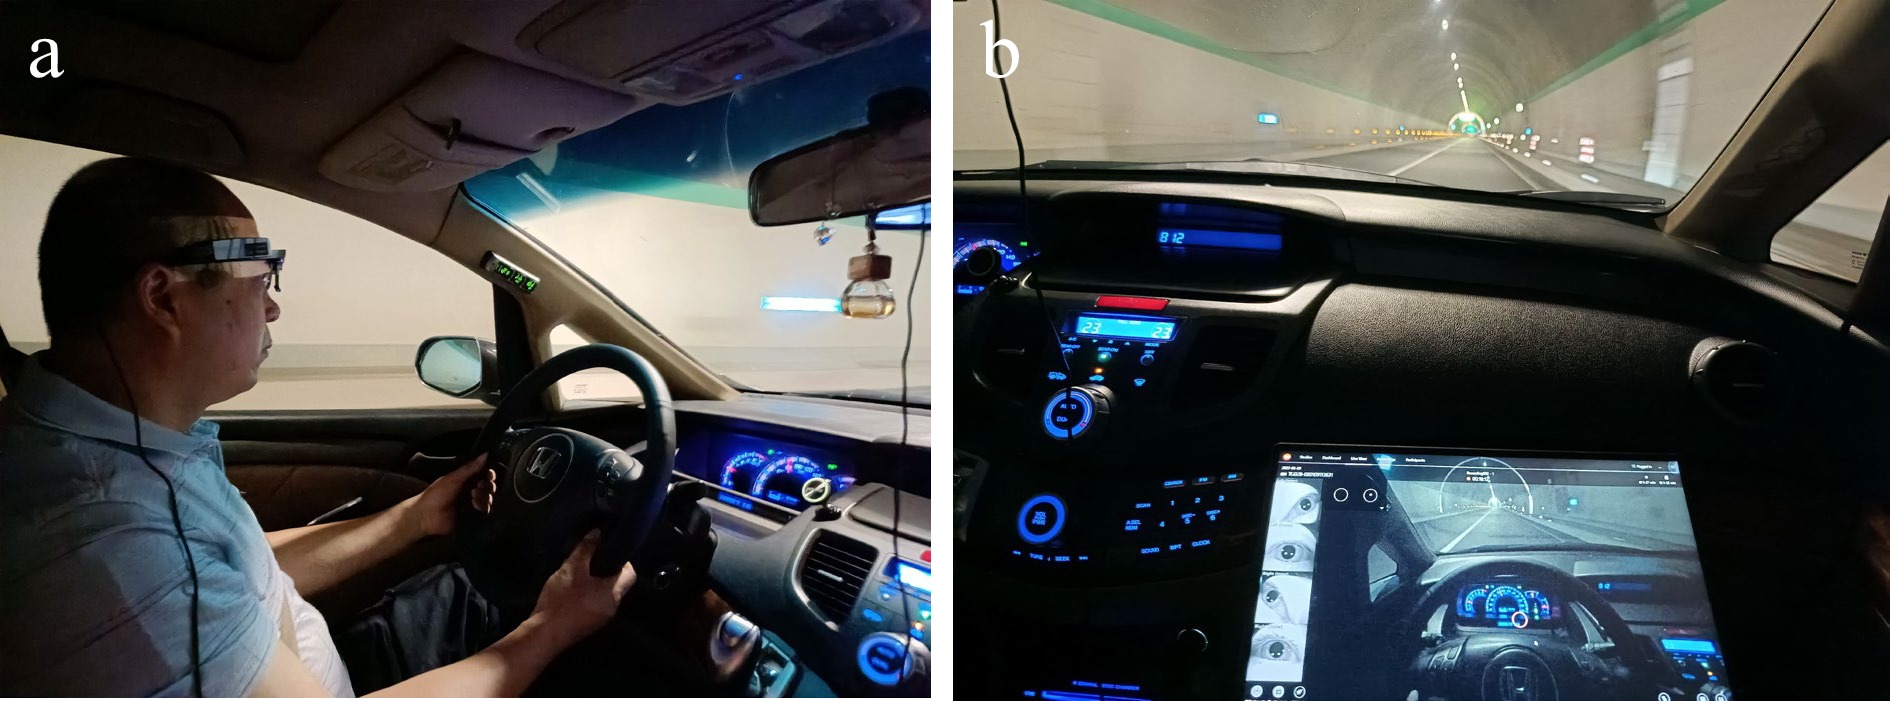
Figure 1.
Device used during the experiment.
Experimental participant
-
For the safety of real vehicle experiments, the approach of 'fewer participants, multiple repetitions', recommended by Liang et al.[26], was utilized for subject selection. Each driver was required to undergo a minimum of two tests on the experimental route. A total of 17 drivers participated in this experiment. To ensure the precision of eye-tracking data collection, all experimental drivers needed to have unaided visual acuity of 5.0 or higher and no visual impairments, including glare sensitivity or night blindness. Ten eligible participants, aged between 24 and 42, and possessing a minimum of 2 years of driving experience, were chosen. The minimum sample size for the experiment is calculated to be 14 using the formula for minimum samples. The experimental sample size in this paper meets the requirements.
Experimental design
-
Owing to constraints imposed by the experimental conditions, it is not feasible to investigate driving fatigue levels across the entire 24-hr day. Monk et al.[27] indicates that between 1−3 am, 5−6 am, 7−8 am, 11 am−1 pm, 1−3 pm, and 6−7 pm, drivers are more susceptible to entering a state of fatigue. Drawing from the research conducted by Yajima et al.[28] and Lai & Craig[29] regarding the influence of human circadian rhythms on driving fatigue, two specific time intervals —namely, noon (10:00−12:00) and afternoon (13:00−15:00)— were selected for investigation. These time slots correspond to periods when drivers are more prone to experiencing fatigue due to their circadian rhythms. Furthermore, these times typically exhibit reduced traffic volumes, thereby minimizing the impact of traffic flow on fatigue during driving experiments.
Throughout the experiment, research assistants conducted subjective fatigue assessments on the participants at 10-min intervals using the Karolinska Sleepiness Scale (KSS), which complemented objective measurements. The KSS comprises a total of nine levels. According to the subjective fatigue level scale, these nine levels are categorized into three states: 1 ≤ KSS ≤ 3 for the awake state, 4 ≤ KSS ≤ 6 for the semi-fatigue state (a transitional phase before entering fatigue, still within an awake state), and 7 ≤ KSS ≤ 9 for the fatigue state (indicating formal entry into a fatigued state)[30].
-
As a result of driving fatigue, drivers experience decreased cognitive performance internally and impaired driving performance externally. Consequently, this study opts for eye movement indicators associated with cognitive performance and vehicle operating characteristics linked to driving performance as experimental parameters for conducting natural driving fatigue tests on the extra-long tunnel road section.
By combining the statistical findings from the KSS subjective scale with various eye-tracking indicators[31], including blink frequency, average blink duration, variable coefficient of pupil diameter, perclos, and average fixation duration, as well as vehicle operational state indicators[32] like speed and acceleration, a significance test of difference and correlation analysis was performed to assess their relevance to different states of fatigue. The objective was to evaluate the efficacy of these indicators in detecting driving fatigue and select fatigue sensitivity indicators.
Significance test of difference
-
Normality tests were performed on the eye-tracking data and vehicle operational data of the 10 participants in various states, including their awake state, semi-fatigue state, and fatigue state: The sample data for the variable coefficient of pupil diameter exhibited an overall normal distribution; However, the sample data for average fixation duration did not adhere to a normal distribution; Sample data for blink frequency, average blink duration, perclos P80, speed, and acceleration displayed a normal distribution in certain states but not in others. This study concludes that these indicators do not exhibit an overall normal distribution. Hence, during the significance test of difference, paired T-tests were employed for indicators conforming to a normal distribution, while paired non-parametric Wilcoxon signed-rank tests were utilized for indicators deviating from a normal distribution, as detailed in Table 2.
Table 2. Significance test of difference.
Test indicator Pairing method Normal distribution Test method T/Z Significance level Blink frequency Awake & Semi-fatigue state Disobey Wilcoxon test −5.062 0.000* Awake & Fatigue state Disobey Wilcoxon test −0.939 0.000* Semi-fatigue & Fatigue state Disobey Wilcoxon test −9.302 0.000* Average blink duration Awake & Semi-fatigue state Disobey Wilcoxon test −5.534 0.000* Awake & Fatigue state Disobey Wilcoxon test −4.511 0.000* Semi-fatigue & Fatigue state Disobey Wilcoxon test −2.233 0.026 Perclos P80 Awake & Semi-fatigue state Disobey Wilcoxon test −7.646 0.000* Awake & Fatigue state Disobey Wilcoxon test −25.607 0.000* Semi-fatigue & Fatigue state Obey T-test −11.782 0.000* Average fixation duration Awake & Semi-fatigue state Disobey Wilcoxon test −1.689 0.091 Awake & Fatigue state Disobey Wilcoxon test −1.689 0.253 Semi-fatigue & Fatigue state Disobey Wilcoxon test −2.183 0.029 Variable coefficient of pupil diameter Awake & Semi-fatigue state Obey T-test 0.675 0.000* Awake & Fatigue state Obey T-test −2.926 0.000* Semi-fatigue & Fatigue state Obey T-test −3.579 0.001* Speed Awake & Semi-fatigue state Disobey Wilcoxon test 31.174 0.043 Awake & Fatigue state Disobey Wilcoxon test −38.082 0.000* Semi-fatigue & Fatigue state Disobey Wilcoxon test −26.023 0.000* Acceleration Awake & Semi-fatigue state Obey T-test −2.023 0.000* Awake & Fatigue state Disobey Wilcoxon test −15.611 0.000* Semi-fatigue & Fatigue state Disobey Wilcoxon test −19.166 0.000* * indicates a significance level less than 0.05, indicating a significant difference between the two groups. As per Table 2, blink frequency, perclos, variable coefficient of pupil diameter, and acceleration demonstrate noteworthy differences before and after fatigue; Nevertheless, no significant difference in average blink duration is observed between the semi-fatigue and fatigue states; Average fixation duration does not reveal significant differences before and after fatigue; Speed does not display significant differences between the awake and semi-fatigue states.
Correlation analysis
-
By conducting significance tests for differences, it becomes evident that certain indicator data do not exhibit significant variations before and after fatigue. Consequently, not all indicators can effectively portray the progression of fatigue. Therefore, it becomes imperative to identify the indicators with a stronger correlation to the fatigue evolution process through correlation analysis. Correlation analysis employed the Pearson correlation coefficient, and the calculated results are displayed in the heatmap presented in Fig. 2.
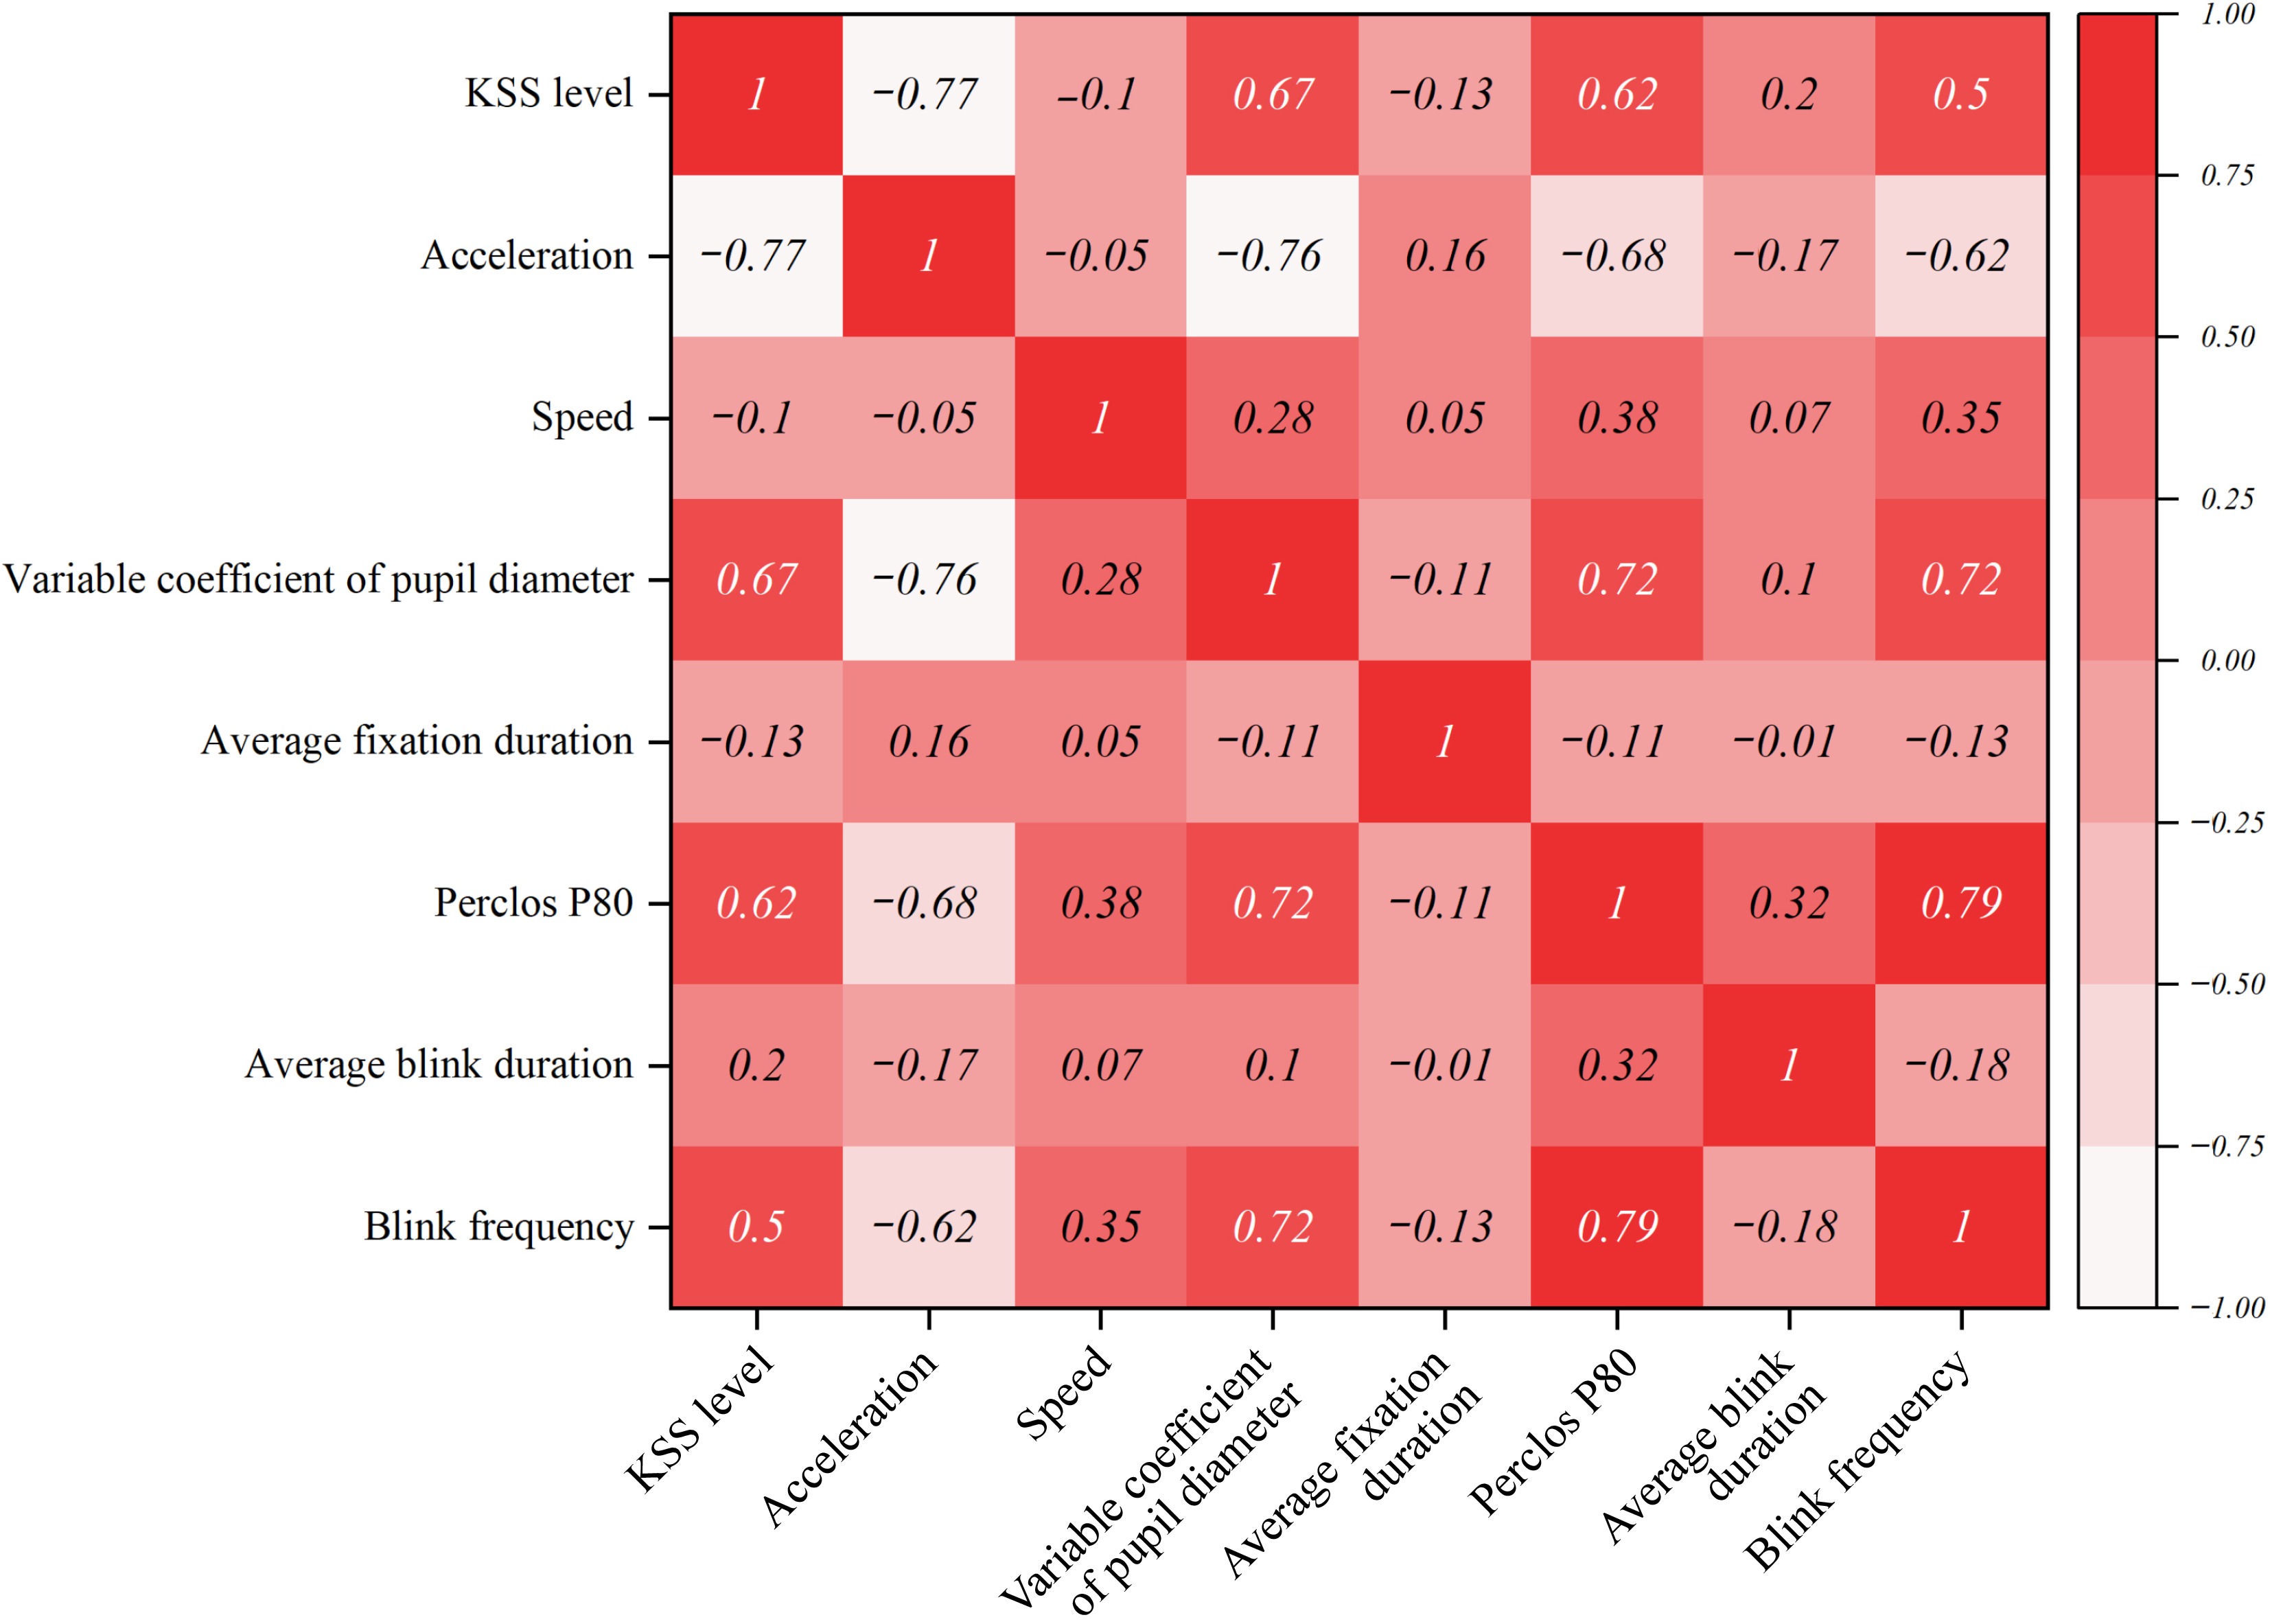
Figure 2.
Correlation heatmap.
The correlation between the indicators increases as the area becomes redder, while an increase in negative correlation results in the area becoming whiter, as depicted in the graph. Figure 2 reveals that among all the indicators, only the perclos P80, variable coefficient of pupil diameter, and acceleration exhibit substantial correlations with KSS, with correlation coefficients of 0.62, 0.67, and −0.77, respectively. Which indicates a positive correlation between the KSS grade and the perclos P80 as well as the variable coefficient of pupil diameter. In addition, a negative correlation is observed between the KSS grade and the acceleration. The remaining indicators demonstrate relatively weak correlations. Specifically, the perclos P80 exhibits correlation coefficients of 0.72 and −0.68 with the variable coefficient of pupil diameter and acceleration, respectively. In turn, the variable coefficient of pupil diameter and acceleration display a correlation coefficient of −0.76, indicating a robust correlation among these three indicators.
The fatigue testing performance of each indicator is summarized in Table 3. Table 3 illustrates that the perclos P80, variable coefficient of pupil diameter, and acceleration display notable distinctions and robust correlations. Consequently, taking a comprehensive perspective on these factors, this study employs the perclos P80, variable coefficient of pupil diameter, and acceleration as sensitive indicators for assessing driving fatigue in extra-long tunnels.
Table 3. Summary of the analysis of each test indicator.
Test indicator Significance test
of differenceCorrelation analysis Blink frequency Significant Moderately relevant Average blink duration Insignificant Irrelevant Perclos P80 Significant More relevant Average fixation duration Insignificant Irrelevant Variable coefficient of pupil diameter Significant More relevant Speed Insignificant Irrelevant Acceleration Significant More relevant Ordered multi-class Logistic model
Model construction
-
In order to identify precise intervention points for the design of key parameters within the fatigue arousal zone of extra-long tunnels, this study takes into account the ordered nature of fatigue states (awake, semi-fatigue, fatigue), which corresponds well with the characteristics of an ordered multi-class Logistic model[33]. In this model, the dependent variable is a three-category variable, represented as follows: y = 1 for awake, y = 2 for semi-fatigue, and y = 3 for fatigue. The independent variables are categorized into explanatory and influencing variables, with the explanatory variables consisting of the fatigue sensitivity indicators identified in the preceding section.
As is known, the causation of traffic accidents is a complicated and instant procedure, which may involve the interactions of human beings (drivers, motorcyclists, cyclists and pedestrians), vehicles (motorized and non-motorized), roadways (classification, geometric design and roadside facilities), and environmental factors (lighting or weather, or facilities)[34]. Thus, in the analysis of factors affecting driving fatigue within extra-long tunnels, this study comprehensively examines four aspects: the driver, the vehicle, the road, and the environment. Building on the findings of Qin et al.[35], factors pertaining to the driver and vehicle encompass elements such as the driver's sleep, physical condition, the impact of alcohol and drugs, in-cabin environment, vibration, noise, and more. These factors were meticulously controlled during the experimental process in this study. As a result, this research primarily delves into the factors affecting driving fatigue from the standpoint of the road and traffic environment. In accordance with studies by Qin et al.[35] and Ye et al.[36], factors like tunnel length, alignment, road surface conditions, lighting (brightness) conditions, ventilation, traffic conditions, and traffic facilities have the potential to impact the level of fatigue within tunnels. To construct a relationship model between the traffic environment and driving fatigue, comprehensive data on tunnel length, alignment, illuminance, and traffic facility deployment were meticulously recorded during the experimental phase. As a result, this study opts for factors including cumulative driving time, working condition driving time, tunnel length, and tunnel illuminance. The specific selection and encoding of variables are detailed in Table 4.
Table 4. Variable selection and encoding.
Variable type Variable name Variable assignment Unit Encoding Explanatory variable Perclos P80 x1 % Covariate Variable coefficient of pupil diameter x2 − Covariate Acceleration x3 m/s2 Covariate Influencing variable Cumulative driving time x4 s Covariate Working condition driving time x5 s Covariate Tunnel length x6 m Covariate Tunnel illuminance x7 Lux Covariate Horizontal curve CCR x8 °/m Covariate Is it a parking harbor x9 − 0 = No,
1 = YesIs it an open road x10 − 0 = No,
1 = YesThe covariate is a continuous variable. The model's effectiveness has been confirmed through goodness-of-fit and parallel line tests. Further analysis of the model parameters can be conducted. Based on variable selection, we establish an ordered multi-class Logistic model. In this study, the dependent variable has three levels of fatigue, with corresponding probabilities π1, π2, and π3. The model is constructed by splitting it into two binary logistic regressions, namely (1 vs 2 + 3) and (1 + 2 vs 3). The model construction is as follows:
$\begin{split} Logit \;({P}_{y\le 1})=\;&{ln}\left(\dfrac{{\text π }_{1}}{1-{\text π }_{1}}\right)={ln}\left(\dfrac{{\text π }_{1}}{{\text π }_{2}+{\text π }_{3}}\right)\\=&-{a}_{1}+{\beta }_{1}{x}_{1}+{\beta }_{2}{x}_{2}+\cdots +{\beta }_{10}{x}_{10} \end{split}$ (1) $\begin{split} Logit \;({P}_{y\le 2})=\;&{ln}\left(\dfrac{{\text π }_{1}}{1-{\text π }_{1}-{\text π }_{2}}\right)={ln}\left(\dfrac{{\text π }_{1}+{\text π }_{2}}{{\text π }_{3}}\right)\\=&-{a}_{2}+{\beta }_{1}{x}_{1}+{\beta }_{2}{x}_{2}+\cdots +{\beta }_{10}{x}_{10} \end{split}$ (2) In formula (1) and (2), y is the fatigue level with values i (i = 1, 2, 3), x is the variable, P is the probability of a specific fatigue level occurring, aj is the model intercept, and βj is the model regression coefficient.
Model results
-
The objective behind constructing this model is to assess the extent of influence exerted by the independent variables on the dependent variable. When interpreting the model outcomes, it is crucial to focus on the impact weights of specific independent variables. Model parameters were analyzed using SPSS 22.0 software, and it was determined that acceleration in the explanatory variables did not exhibit a significant correlation with tunnel illuminance, horizontal curve CCR, or the presence of a parking harbor in the influencing variables. Variables lacking significant correlations were eliminated, leading to model improvement. The outcomes of the enhanced model are presented in Table 5.
Table 5. Ordered multi-class Logistic regression results.
Variable Estimated value Standard error Wald Degree of freedom Significance Exp (β) Threshold [Fatigue level = 1] 1.270 0.642 3.917 1 0.048 − [Fatigue level = 2] 6.568 0.859 58.502 1 0.000 − Location Perclos P80 12.136 5.183 10.930 1 0.000 186 465.218 Variable coefficient of pupil diameter 0.373 0.048 60.723 1 0.001 1.075 Cumulative driving time 2.634 3.855 15.135 1 0.000 13.929 Working condition driving time 0.264 1.913 13.260 1 0.000 1.302 Tunnel length 0.395 0.036 28.014 1 0.000 1.484 [Is it an open road = 0] −0.293 0.566 0.116 1 0.000 0.746 [Is it an open road = 1] 0a − − 0 − − a: This parameter is set to zero because it is redundant. Table 5 reveals that among the explanatory variables, the regression coefficient of perclos P80 is 12.136, with an Exp (β) of 186,465.218. This suggests that perclos P80 is the primary triggering factor within the explanatory variables, signifying a positive correlation between perclos P80 and fatigue level. In simpler terms, as perclos P80 increases, the driver's fatigue level likewise increases. The regression coefficient for the variable coefficient of pupil diameter is 0.373, signifying a positive correlation between the variable coefficient of pupil diameter and fatigue level. Exp (β) = 1.075 implies that, when other influencing factors remain constant, for every one-unit rise in the variable coefficient of pupil diameter, the fatigue level increases by a factor of 1.075. Among the influencing variables, cumulative driving time stands out as the most significant factor contributing to heightened fatigue levels among drivers in the extra-long tunnel section. Its regression coefficient is 2.634, signifying that as cumulative driving time increases, the driver's fatigue level also increases. Tunnel length also exerts a notable influence on fatigue levels, as indicated by a regression coefficient of 0.395. This implies that longer tunnel lengths lead to extended middle sections, where drivers spend more time, potentially intensifying their fatigue levels.
Construction of driving fatigue grading standard and quantitative metric
-
The ordered multi-class Logistic model computes probabilities based on the alterations and distribution characteristics of sample parameters. Within this model, significant parameters denote a heightened likelihood of event initiation. It can also be comprehended that as the parameter values of triggering factors increase, the probability of the event's occurrence escalates. In the context of this study, the foremost triggering factor among the explanatory variables within the ordered multi-class Logistic model is the driver's perclos P80. Hence, perclos P80 is selected as an indicator for assessing driving fatigue in extra-long tunnels and for constructing a dimensionless quantified metric.
Driving fatigue discrimination standard
-
Perclos P80's numerical representation relies on the probabilities of drivers encountering it in three fatigue states. Different probability distributions and associated values of perclos P80 are employed as the foundation for grading driving fatigue. The results of the normality test for the chosen fatigue sensitivity indicators reveal that perclos P80 in the awake state does not conform to a normal distribution. A scrutiny of the histogram of perclos P80 (Fig. 3) reveals that its distribution aligns with a positively skewed pattern. The skewness coefficient measures 3.58, and the kurtosis coefficient amounts to 25.62, as verified by the Kolmogorov-Smirnov (K-S) test.
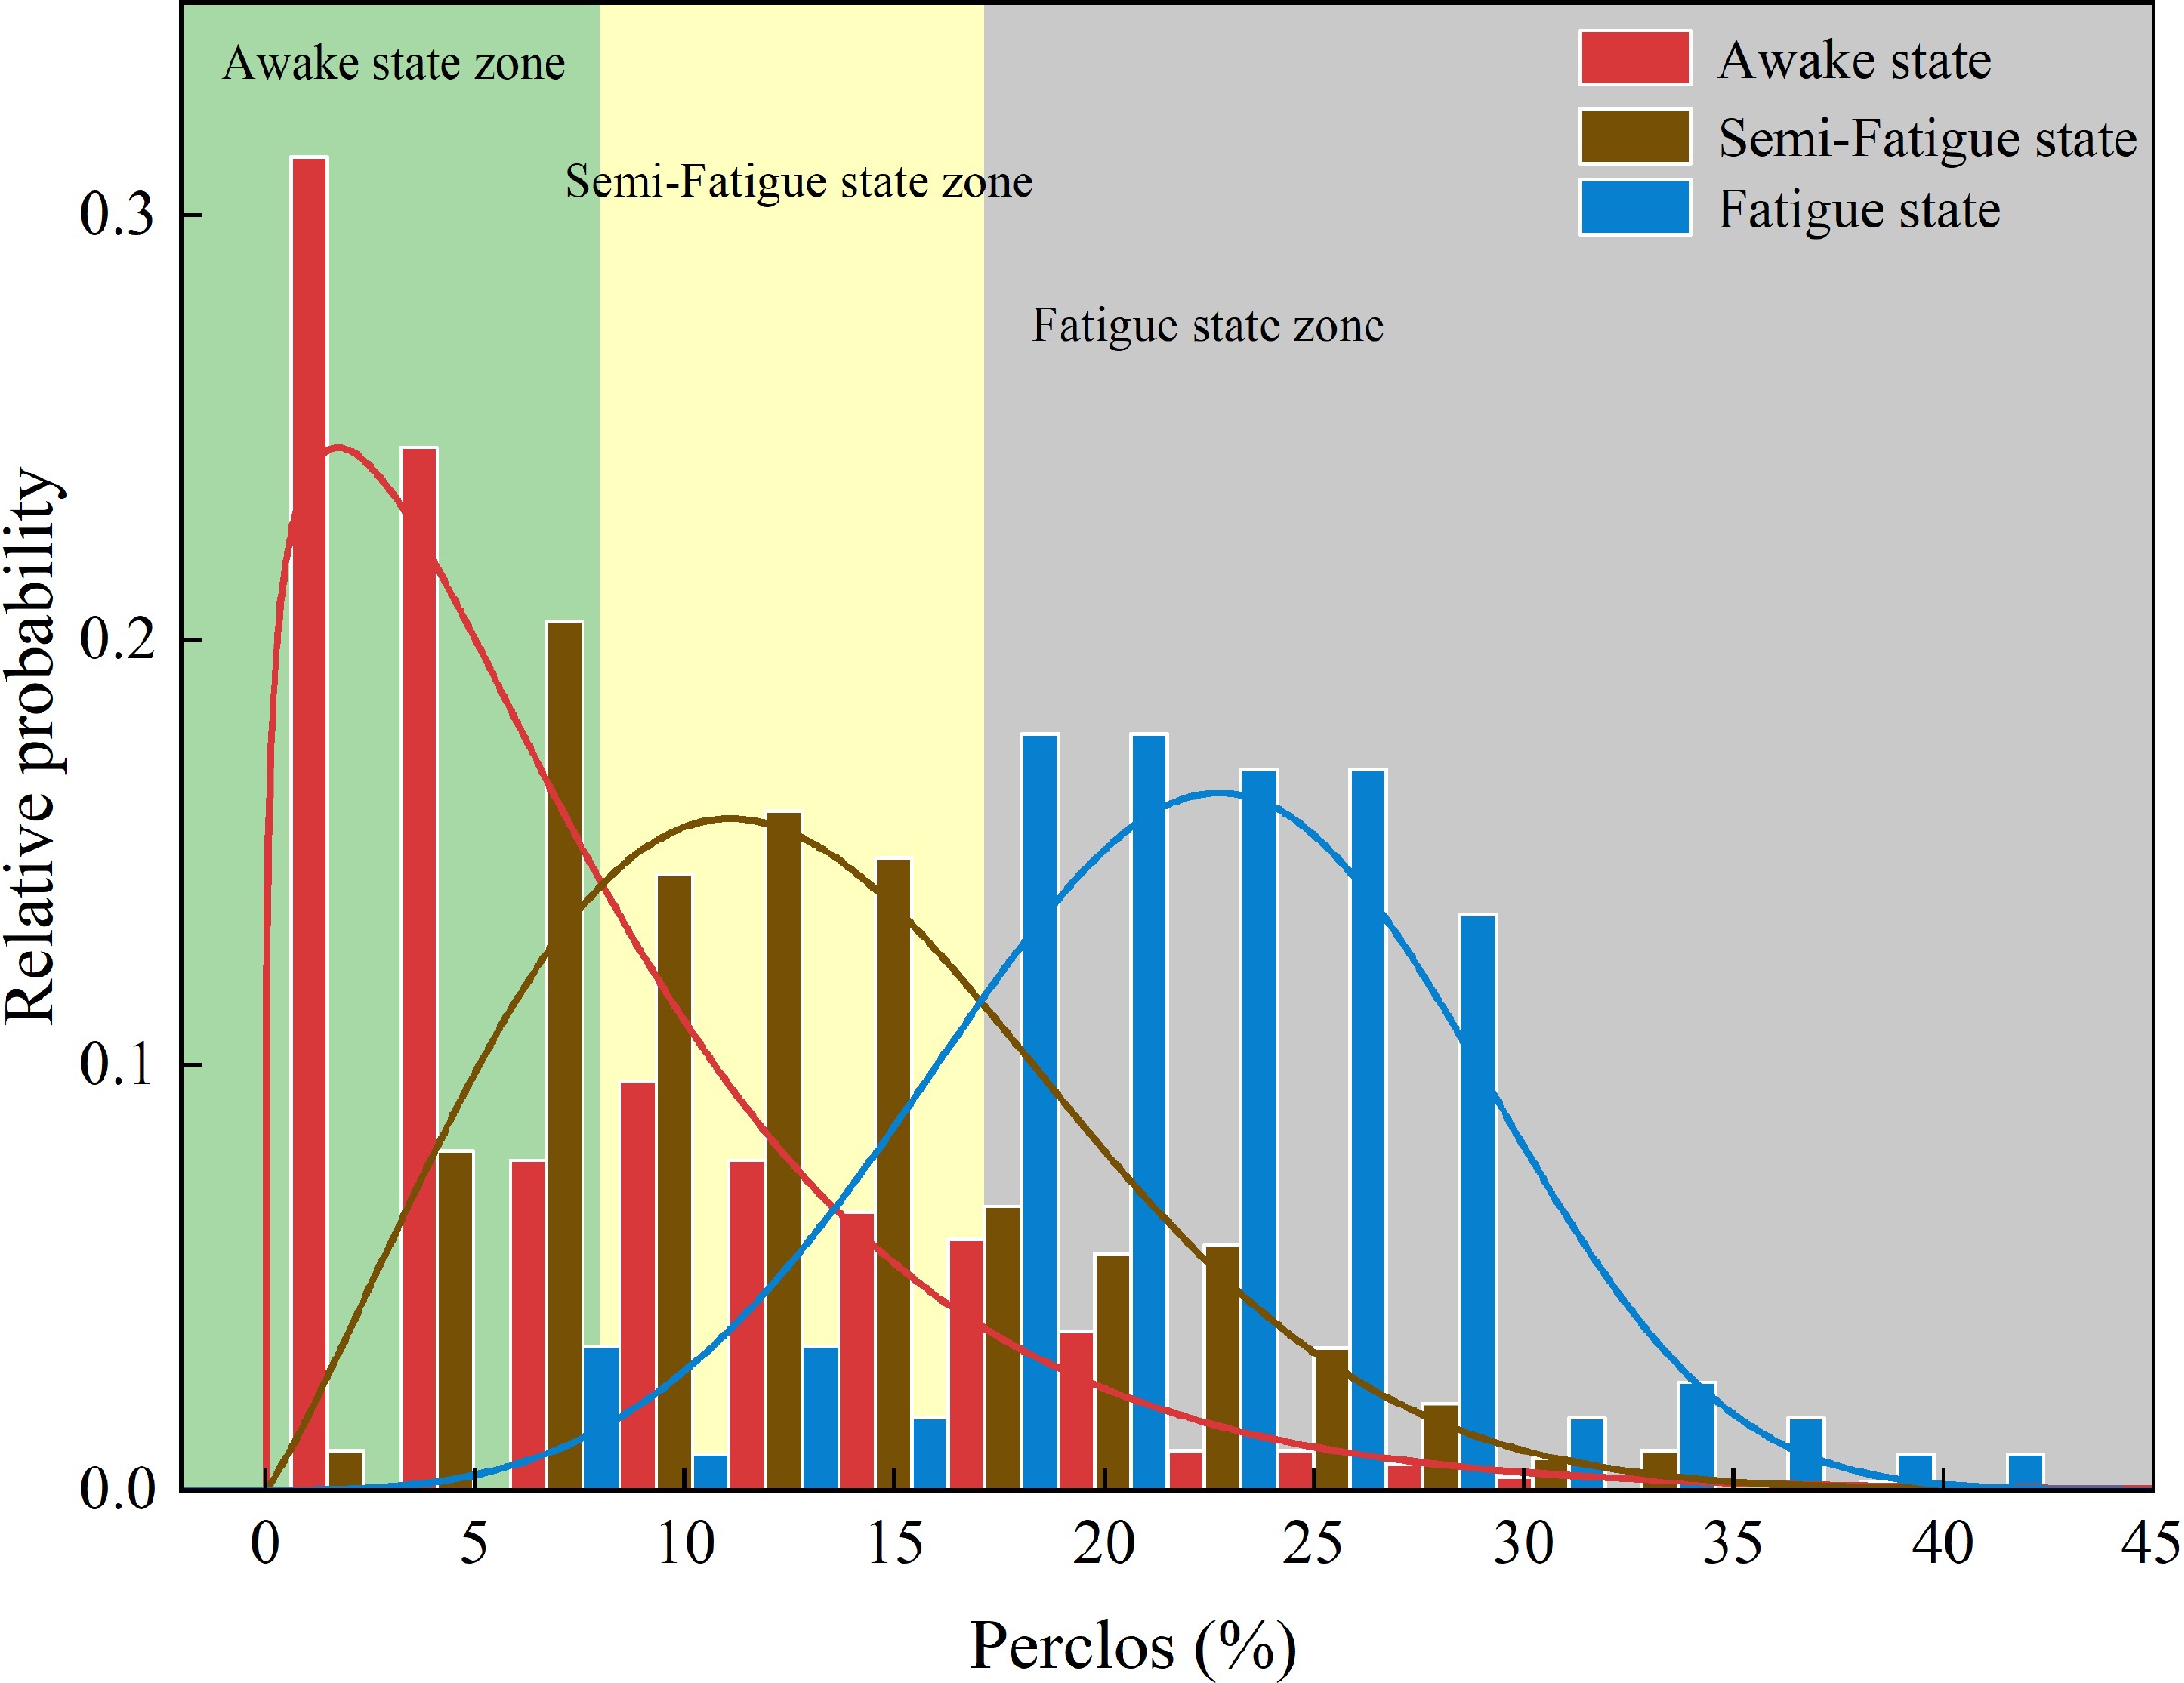
Figure 3.
Probability distribution histogram plot of driver fatigue states.
According to Fig. 3 and in coordination with findings from the KSS subjective scale, the thresholds for semi-fatigue classification are determined by the perclos P80 values at the points where probabilities intersect between the awake and semi-fatigue states. Similarly, the thresholds for fatigue classification are established using the perclos P80 values at the junctures where probabilities intersect between semi-fatigue and fatigue states. More specifically, these thresholds are identified at the demarcations between the green area and the yellow area in Fig. 3, as well as the boundaries separating the yellow area from the gray area. This approach results in the fatigue classification standard for driving in the extra-long tunnel, as detailed in Table 6.
Table 6. Driving fatigue discrimination standard.
State Awake Semi-Fatigue Fatigue Perclos P80 (%) (0, 8) [8, 17.5] (17.5, ∞) Construction of quantitative metric for driving fatigue
-
Taking inspiration from statistical data standardization methods, the mode of perclos P80 before drivers enter the tunnel is adopted as the initial value. Subsequently, at any point during the tunnel drive, the perclos P80 value is subtracted from the initial value and divided by the initial value. This computation results in the determination of the Fatigue Driving Degree (FDD) for drivers at any moment within the extra-long tunnel. FDD is a dimensionless metric, and the quantification model is as follows:
$ F D{D}_{ij}=\dfrac{({P}_{ij}-{P}_{i})}{{P}_{i}} $ (3) In formula (3), FDDij is the fatigue driving degree of driver i at driving time j within the tunnel, Pij is the perclos P80 of driver i at driving time j within the tunnel, and Pi is the initial perclos P80 value for the driver before entering the tunnel, which is represented by the mode.
Using formula (3), compute the FDD for the 10 participants across the five distinct working conditions (Conditions 2−6, as detailed in Table 1). Subsequently, conduct a significance test to assess differences in FDD among the participants in each condition. The results reveal that there are no notable differences in FDD among the 10 participants across each condition. This indicates that FDD can efficiently mitigate the impact of individual differences and initial fatigue. Lastly, Fig. 4 presents the variations in FDD over time for the 10 participants under varying conditions.
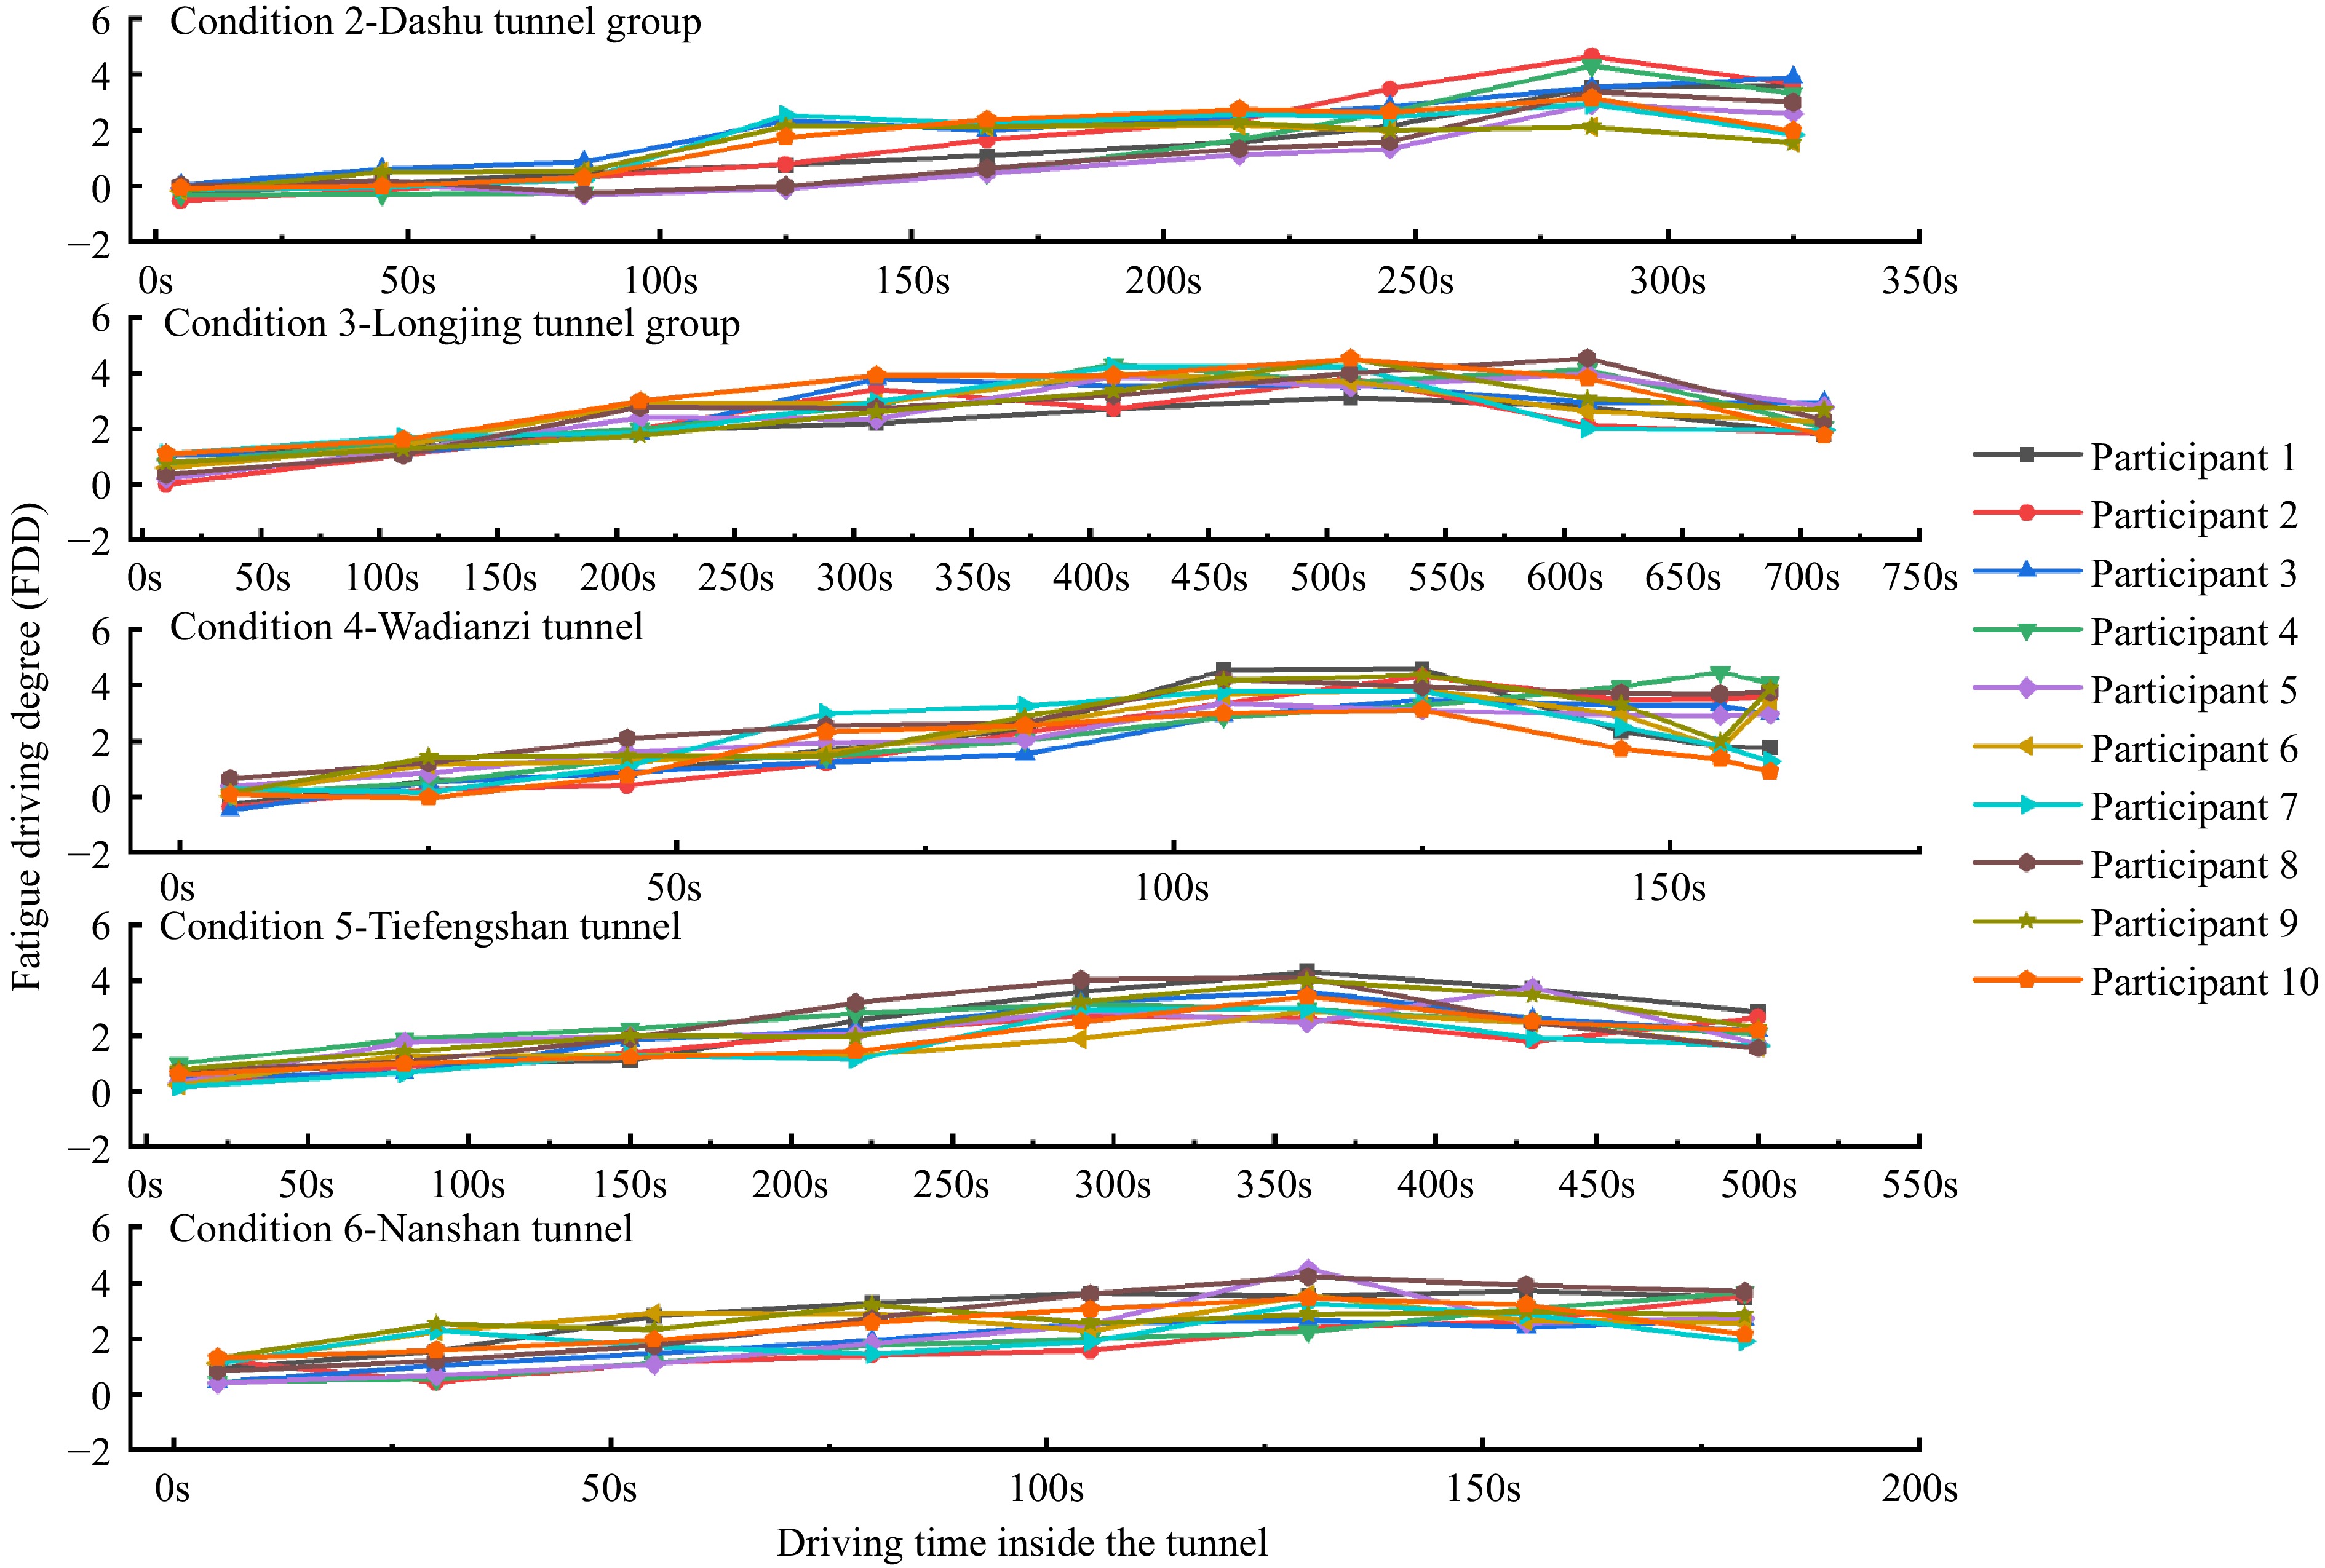
Figure 4.
Variation in FDD over time under different working conditions for each participant.
Upon examining the FDD change curves in Fig. 4, it is evident that the FDD trends exhibit similarities irrespective of the various lengths of the extra-long tunnel. While driving through extra-long tunnels, the FDD generally displays an ascending pattern, reaching a specific level before undergoing a gradual decline, which can be attributed to the driver's resistance response to the onset of fatigue while driving. Nevertheless, relying solely on the FDD change curves remains inadequate for ascertaining the fluctuations in drivers' fatigue levels during extra-long tunnel driving. Hence, there is a need to define the Threshold of Driving Fatigue (TDF) for each fatigue state. A box plot was generated to illustrate the distribution of FDD among the 10 participants, delineating upper and lower quartiles at 15% and 85%, as depicted in Fig. 5.
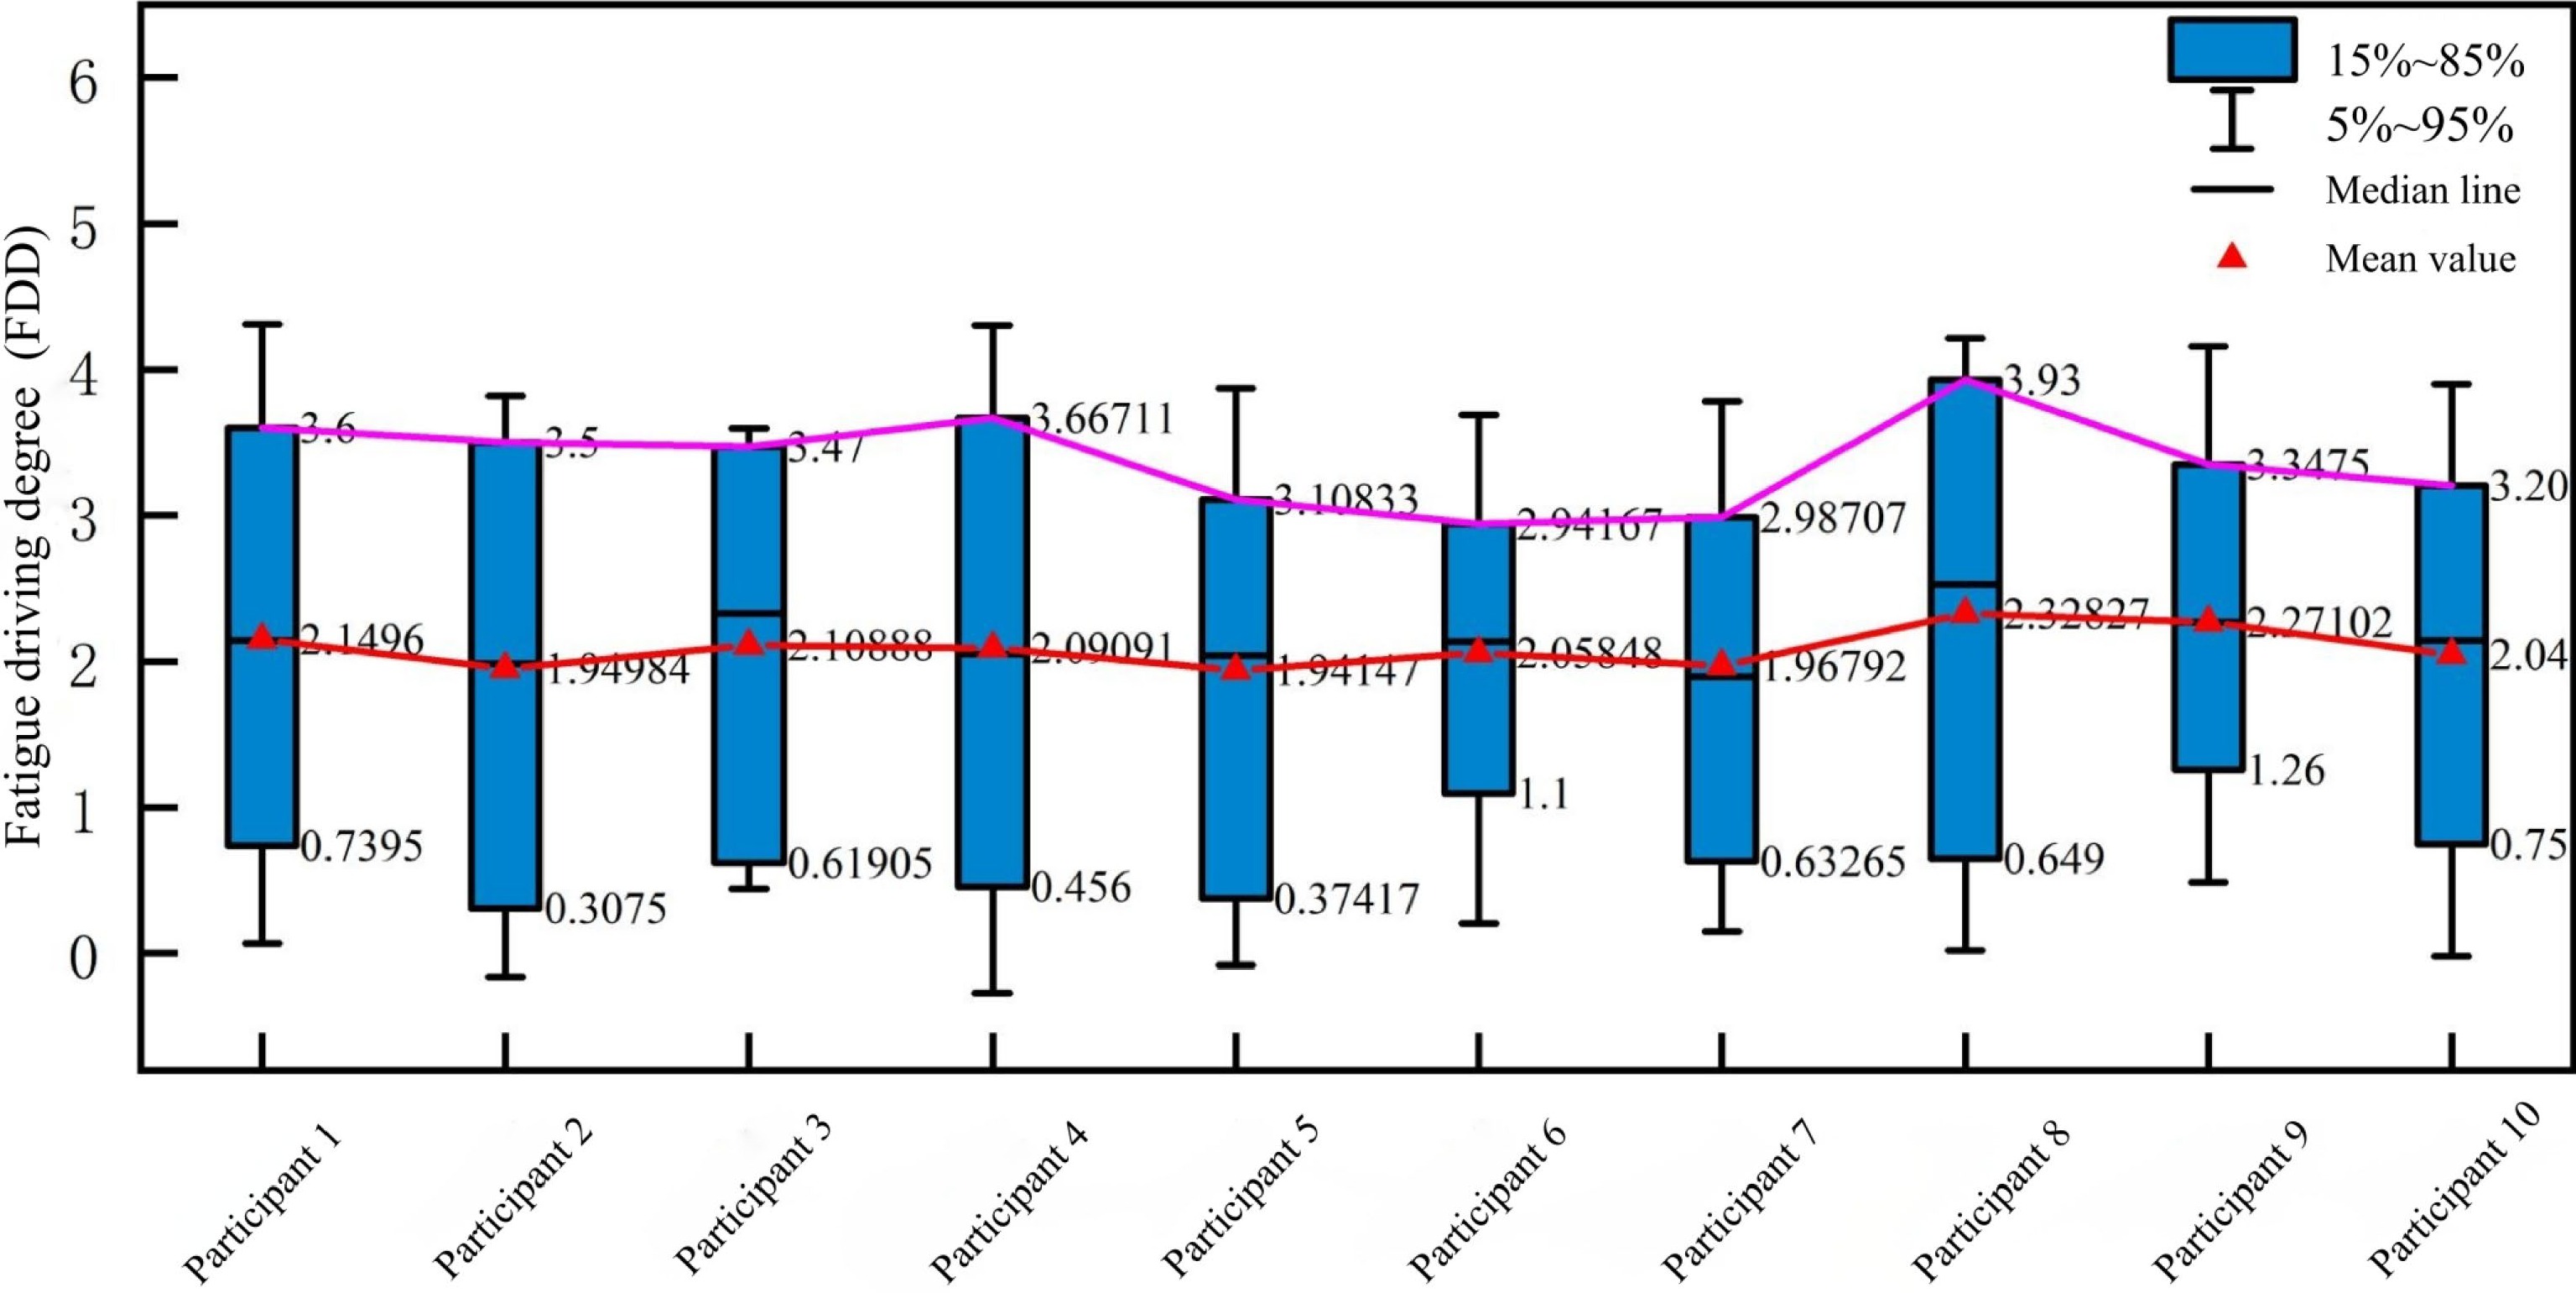
Figure 5.
Distribution plot of FDD in extra-long tunnel.
In the domain of traffic engineering, it is a common practice, guided by statistical principles, to establish the threshold value of a variable as the numeric value that fulfills the requirements of 85% or more of the driver sample data[37]. When the threshold value for driving fatigue can meet over 85% of driver safety, it indicates that the threshold is universally applicable. Figure 5 guides the determination of the Threshold of Driving Fatigue (TDF) for the extra-long tunnel, which is calculated to be 3.37. By adopting 50% as the threshold for the semi-fatigue state, the TDF is established at 2.01. This signifies that when a driver has spent some time driving in the tunnel and their perclos P80 has risen to 2.01 times the pre-tunnel value, the driver is classified as being in a semi-fatigue state. Upon reaching a 3.37-fold increase, it is determined that the driver has entered a state of fatigue. In this paper, the threshold signifying the onset of fatigue, denoting a semi-fatigue state, is denoted as TDF1, while the threshold for the transition into a fatigue state is labeled as TDF2.
-
To standardize terminology, this paper defines the fatigue arousal zone within extra-long tunnels employing a purpose-oriented approach and fatigue arousal theory: 'The fatigue arousal zone' in extra-long tunnels denotes a specific middle section within the tunnel, distinguished by a specific length. Within this zone, an array of sensory stimuli, encompassing visual, auditory, and tactile cues, is employed to expedite the driver's return to an optimal arousal level. The objective of the fatigue arousal zone is to mitigate short-term fatigue challenges encountered by drivers in extra-long tunnels.
Drawing from the definition of the fatigue arousal zone and in alignment with the driver fatigue generation model based on arousal levels[38], this paper condenses the operational principles of the fatigue arousal zone in extra-long tunnels, as depicted in Fig. 6.
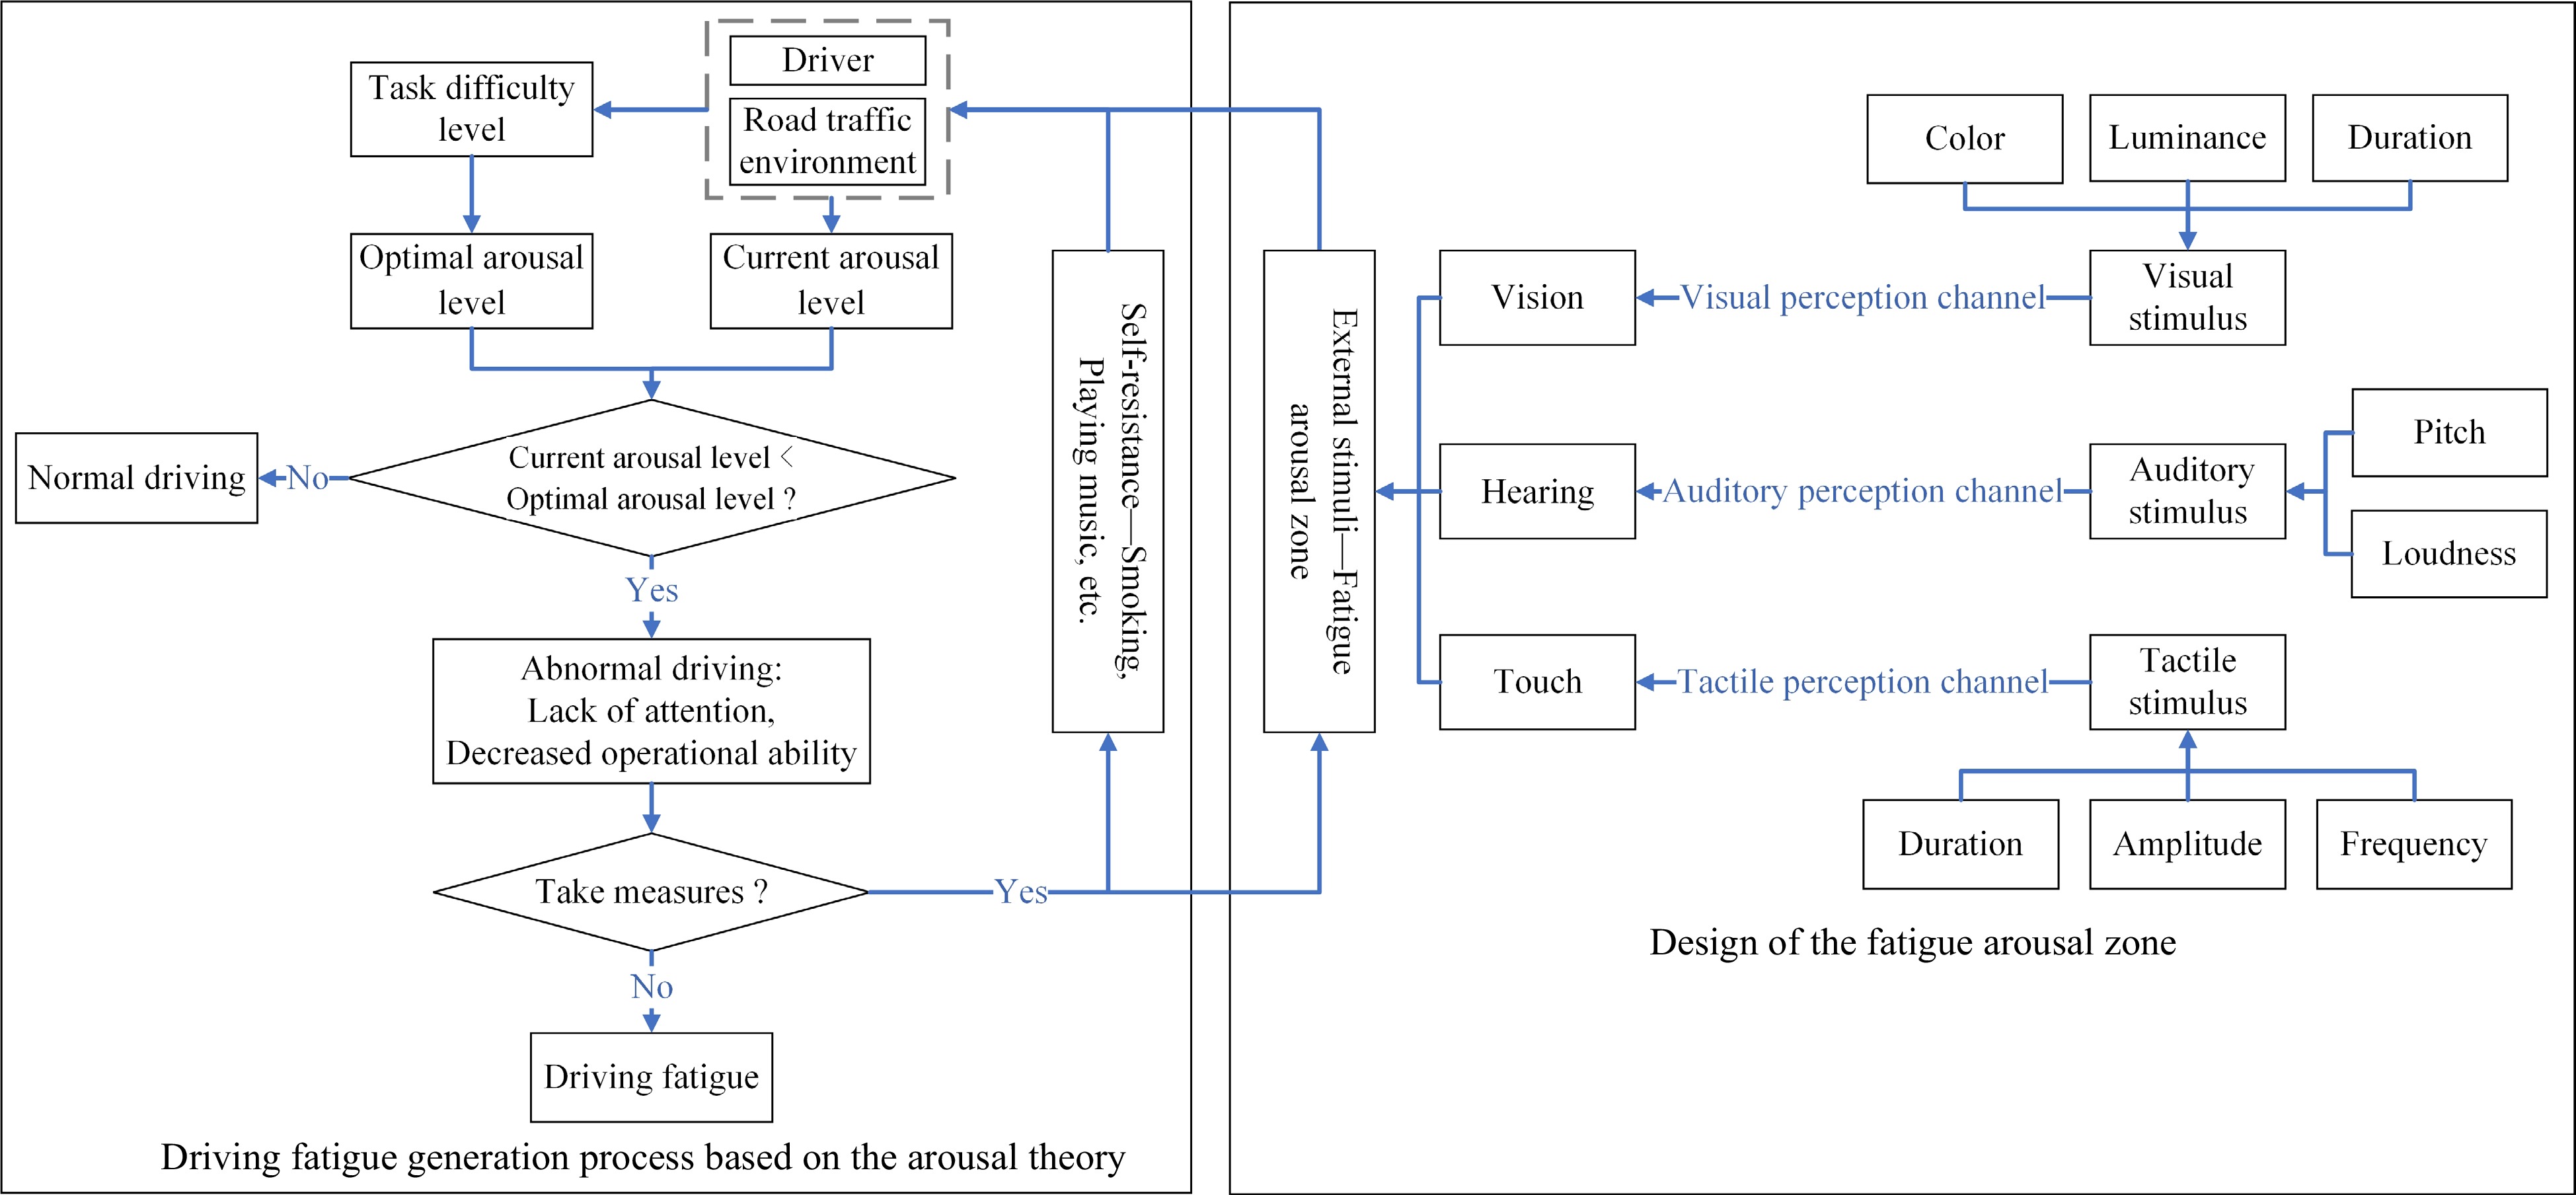
Figure 6.
Mechanism of the fatigue arousal zone.
Location setup of the fatigue arousal zone
-
Upon the driver's FDD reaching the threshold, it becomes imperative to promptly initiate fatigue arousal measures to restore the driver's current arousal level within the optimal range. Consequently, the location where the driver's FDD reaches the threshold should be regarded as the initial point for establishing the fatigue arousal zone. Utilizing TDF1 = 2.01 to signify the semi-fatigue state and TDF2 = 3.37 to denote the fatigue state within the extra-long tunnel, the average FDD values of the 10 participants in the five working conditions from Fig. 4 serve as the characteristic FDD values for all participants. The variations in average FDD are depicted in Fig. 7.
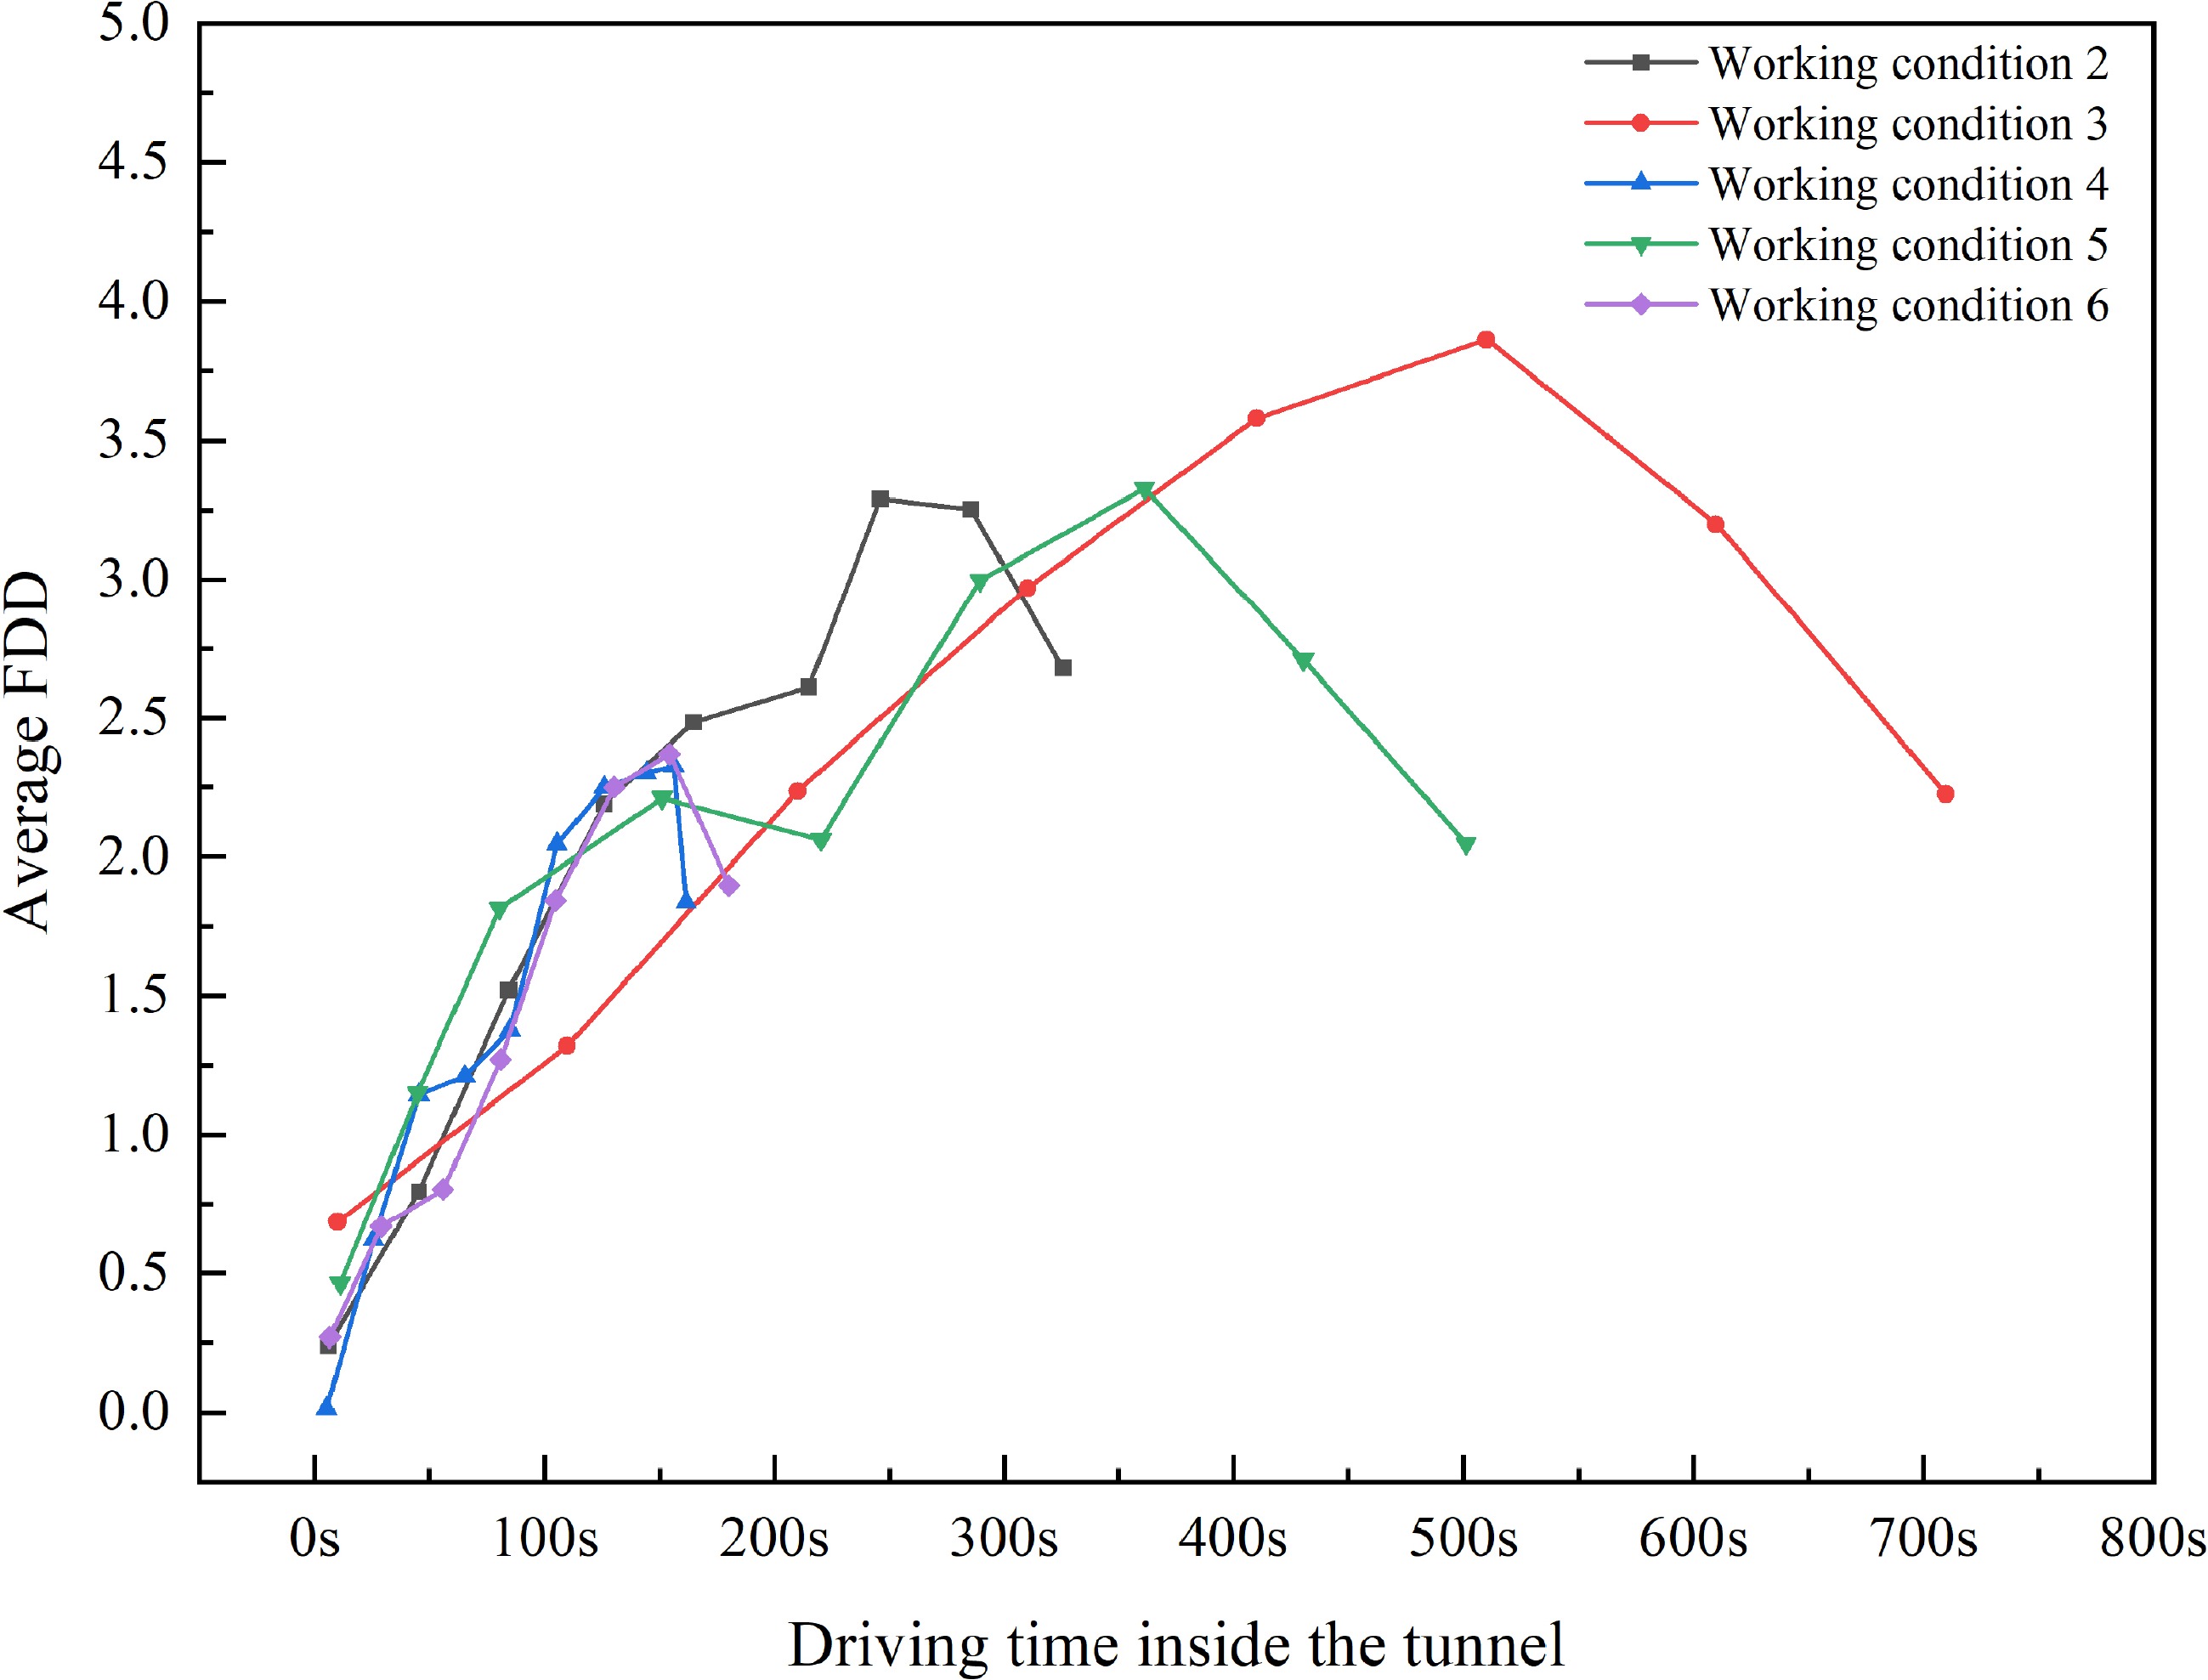
Figure 7.
Variation in average FDD over time under different working conditions.
The change characteristics of the average FDD of the 10 drivers in Fig. 7 closely align with those of each of the 10 drivers' FDD in Fig. 4. The fluctuation patterns of average FDD in the five working conditions are comparable. As driving distance increases within the tunnel, the driver's fatigue level initially rises before decreasing. This is due to the driver's resistance response to the onset of fatigue while driving. In each working condition, there exists a positive correlation between FDD's maximum value and the length of the tunnel. For instance, the tunnel lengths in working conditions 2−6 ascend in values of 3,356, 4,828, 5,825, 11,362, and 13,448 m. The corresponding maximum values of FDD indicate a positive correlation with mileage traveled in the tunnel, with values of 2.26, 2.28, 3.25, 3.25, and 3.72 respectively. This is consistent with the conclusion drawn from the ordered multi-class Logistic model in this paper, which shows that the degree of driving fatigue is significantly affected by the length of the tunnel.
Guided by the distribution patterns in Fig. 7, in the realm of statistics, when the distribution function is unknown, the normal distribution is frequently regarded as the most probable form of distribution. Consequently, Gaussian functions were employed for the non-linear curve fitting of the data. Subsequently, additional formulas were developed to articulate the functional relationship between a driver's FDD and time within an extra-long tunnel, presented from formula (4) to formula (8). The adjusted goodness-of-fit (R2) values following fitting are 0.934, 0.865, 0.899, 0.894, and 0.981, signifying a strong alignment with the non-linear curves.
$ F D{D}_{2}=3.0238+\left(\dfrac{-820.46}{212.39\times \sqrt{\dfrac{\text π }{2}}}\right)\times {e}^{-2\Big(\frac{t+41.4793}{212.39}{\Big)}^{2}} $ (4) $ F D{D}_{3}=-27.3+\left(\dfrac{75776.92}{1956.94\times \sqrt{\dfrac{\text π }{2}}}\right)\times {e}^{-2\Big(\frac{t-436.97}{1956.94}{\Big)}^{2}} $ (5) $ F D{D}_{4}=2.3037+\left(\dfrac{-814.79}{181.12\times \sqrt{\dfrac{\text π }{2}}}\right)\times {e}^{-2\Big(\frac{t+82.82}{181.12}{\Big)}^{2}} $ (6) $ F D{D}_{5}=2.689+\left(\dfrac{-65530.13}{516.57\times \sqrt{\dfrac{\text π }{2}}}\right)\times {e}^{-2\Big(\frac{t+703.41}{516.57}{\Big)}^{2}} $ (7) $ F D{D}_{6}=0.3211+\left(\dfrac{267.29}{105.52\times \sqrt{\dfrac{\text π }{2}}}\right)\times {e}^{-2\Big(\frac{t-144.46}{105.52}{\Big)}^{2}} $ (8) In the formula, FDDi is the FDD in extra-long tunnel under condition i, t is the duration of driving inside the tunnel.
Using TDF1 = FDD = 2.01 in formulas (4) to (8), we compute t2 = 116.886, t3 = 119.932, t4 = 119.807, t5 = 113.718, and t6 = 112.840. Rounding the times for each condition, we establish that the time frame in which the driver's FDD surpasses the threshold spans from 110 to 120 s. Employing a speed of 80 km/h for computations, we ascertain that the driver initiates entry into a semi-fatigue state after covering a distance of roughly 2,444.44 to 2,666.67 m into the tunnel. Rounding to the nearest hundred meters, this translates to the commencement of experiencing fatigue at approximately 2,500 to 2,700 m into the tunnel. In this experiment, it was only in condition 3 that the driver's FDD reached TDF2. Thus, we calculate the time for condition 3 when the driver enters a fatigued state using TDF2 = 3.37. This computation results in t = 318.455 s, rounded to 320 s. Employing a speed of 80 km/h for computations, we establish that the driver enters a fatigued state after covering a distance of approximately 320 × 80 ÷ 3.6 = 7,111.11 m, rounded to 7,100 m, within the tunnel. In conclusion, drivers start to feel fatigued after driving approximately 2,500−2,700 m into the extra-long tunnel and enter a fatigued state after driving 7,100 m. Therefore, it is worth considering setting up the fatigue arousal zone at these distances.
Length setup of the fatigue arousal zone
-
The interval length of the fatigue arousal zone is determined by the driving speed of the driver within the zone, denoted as vi, and the time it takes to pass through the fatigue arousal zone, denoted as ti, as shown in formula (9):
$ {D}_{i}={v}_{i}\times {t}_{i} $ (9) In formula (9), Di is the interval length of the fatigue arousal zone.
To ensure the efficacy of the fatigue arousal zone, there exists a minimum length requirement for the fatigue arousal zone interval. With a fixed interval length for the fatigue arousal zone, higher vehicle speed values will lead to a reduced time required to traverse the zone. Consequently, to ascertain the minimum interval length, it is imperative to take into account the maximum driving speed within the tunnel, assumed to match the tunnel's speed limit of 80 km/h. Additionally, the minimum duration is linked to the driver's visual adaptation process. As drivers navigate through the fatigue arousal zone, their visual adaptation process mirrors that of the adjacent tunnel section's visual adaptation process[39]. Hence, the design of the fatigue arousal zone's length can draw from the visual adaptation process in the adjacent tunnel section. It can utilize the association between brightness alterations and human eye adaptability and comfort to compute the minimum longitudinal extent of the fatigue arousal zone.
Zhang et al.[40] investigated the correlation between visual adaptability and comfort in response to brightness variations. According to their research findings, when brightness increases and is associated with a comfort rating greater than 1, the visual adaptation time required to achieve human eye comfort is estimated to be less than 0.73 s through regression analysis. In contrast, a comfort rating of −2 signifies discomfort and implies an adaptation time exceeding 2.03 s. In scenarios involving decreasing brightness, the visual adaptation time necessary to attain human eye comfort is computed as 0.75 s. However, when the visual adaptation time surpasses 3.70 s, it signifies driver discomfort. When applying these research findings to the visual adaptation process experienced by drivers as they traverse the fatigue arousal zone, an increase in brightness represents the drivers' entry into the fatigue arousal zone, whereas a decrease in brightness signifies their exit from the fatigue arousal zone. To calculate the minimum length of the fatigue arousal zone, the visual adaptation times of 2.03 s for increasing brightness and 3.70 s for decreasing brightness are inserted into formula (9). The calculation yields Dmin = v (t1 + t2) = 22.22 × (2.03 + 3.70) = 127.32 m, which is rounded to 130 m. Consequently, the minimum length requirement for the fatigue arousal zone, denoted as D, is determined to be 130 m. It should be noted that when the length of the fatigue arousal zone is equal to or less than 130 m, rapid fluctuations in brightness may not align with the criteria for driver visual comfort.
Form setup of the fatigue arousal zone
-
Increasing visual information stimuli is the most effective and safest method for addressing short-term driver fatigue and enhancing current arousal level[5]. Within the extra-long tunnel's fatigue arousal zone, the method of reconstructing the driver's visual frame of reference can be employed to amplify visual information stimuli for the driver. This is primarily achieved through specialized design of visual reference objects within the fatigue arousal zone, including parameters such as color type and brightness.
Optimal color type
-
Given that drivers are highly sensitive to the color of visual reference objects, with color accounting for up to 80% of their attention. Moreover, various color temperatures elicit distinct visual sensations in drivers, resulting in different levels of visual stimulation among cold, warm, and neutral colors for drivers. Therefore, the choice of colors will directly impact the current arousal level of drivers. According to the research conducted by Ye et al.[36] on the color schemes of highway tunnel decorations nationwide, it's found that tunnels primarily use neutral colors, with a balanced proportion of cold colors represented by blue and warm colors represented by yellow. Research from Song et al.[17] indicates that cool colors such as blue and green used for decorating tunnel arches and sidewalls are less likely to make drivers accelerate, while neutral colors like gray and white are more likely to encourage acceleration. However, cool colors can give drivers a sensation of sidewalls expanding outward, creating a sense of openness in the tunnel space, which can help alleviate drivers' feelings of confinement. Compared to cool and neutral colors, warm colors provide drivers with relatively stronger visual stimulation. At lower speeds, drivers have better control over driving, and the influence of color temperature on drivers is not significant. However, as speed increases, the temperature perception of colors intensifies the driver's level of tension, making the choice of color tones particularly important.
Choosing cool color tones for decoration not only serves the purpose of awakening but also minimizes the level of tension for drivers. This can be directly applied to the design of color types for fatigue arousal zones within extra-long tunnels. Therefore, the optimal color type for fatigue arousal zones should be cool color tones.
Brightness requirement
-
Brightness is another crucial component of visual perception for drivers during the driving process, alongside color. It collectively determines the intensity of visual stimuli. The greater the brightness of a color, the stronger the visual stimulus perceived by drivers[15]. While ensuring that the fatigue arousal zone has a certain awakening effect, the interval brightness of the fatigue arousal zone should neither be too high nor too low, prioritizing a smooth transition for drivers during changes in brightness. According to the 'Guidelines for Design of Lighting of Highway Tunnels'[41], which is based on the CIE luminance adaptation curve, when designing brightness transitions between the entrance and middle sections of a tunnel, three transition sections are set, and the brightness in these sections decreases in a 3:1 ratio. Following this principle, when transitioning the brightness between the fatigue arousal zone and the regular environment, the brightness of the fatigue arousal zone should not exceed three times that of the regular environment. Due to variations in the reflectance coefficients of materials used in different parts of the tunnel, calculating the brightness values for each section of the tunnel requires the conversion between brightness, illuminance, and material reflectance coefficients. The relationship between brightness, illuminance, and material reflectance coefficients is described by formula (10):
$ L=R\times E $ (10) In formula (10), L is the brightness, R is the reflectance coefficient, and E is the illuminance.
Based on the measured illuminance values in the middle section of the actual extra-long tunnel and referring to the reflectance coefficients of commonly used retro-reflective materials in highway tunnels[42], the brightness values for different parts of the tunnel's middle section can be calculated. Subsequently, the maximum brightness values for various parts of the fatigue arousal zone can be derived, as shown in Table 7.
Table 7. Maximum brightness values for various parts of the fatigue arousal zone.
Tunnel section Middle section illuminance (lux) Selected material Reflectance coefficient Luminance
(cd/m2)The fatigue arousal
zone luminance (cd/m2)Road surface 64.89 Asphalt road surface 0.14 9.08 27.24 Cement road surface 0.31 20.11 60.33 Ceiling 36.26 Gray-black paint 0.41 14.87 44.61 Gray paint 0.63 22.84 68.52 Light gray paint 0.69 25.02 75.06 White paint 0.73 26.47 79.41 Side wall 45.50 Gray paint 0.63 28.67 86.01 Traffic induction design of the fatigue arousal zone
-
Inside the extra-long tunnel, if a driver enters the fatigue arousal zone without any prior warning, rapid changes in the external driving environment can lead to safety issues. Therefore, before a driver enters the fatigue arousal zone, relevant induction information should be provided. According to the 'Light-emitting Diode Changeable Message Signs of Motorway'[43], this article intends to set up variable message signs (VMS) in the area ahead of the fatigue arousal zone as dynamic traffic information facilities.
To ensure that drivers can effectively recognize the VMS, it is necessary to calculate the minimum recognition distance for drivers within the tunnel. The minimum recognition distance is related to the process of drivers recognizing signs within the tunnel, as shown in Fig. 8. The sign recognition distance L inside the tunnel is given by formula (11):
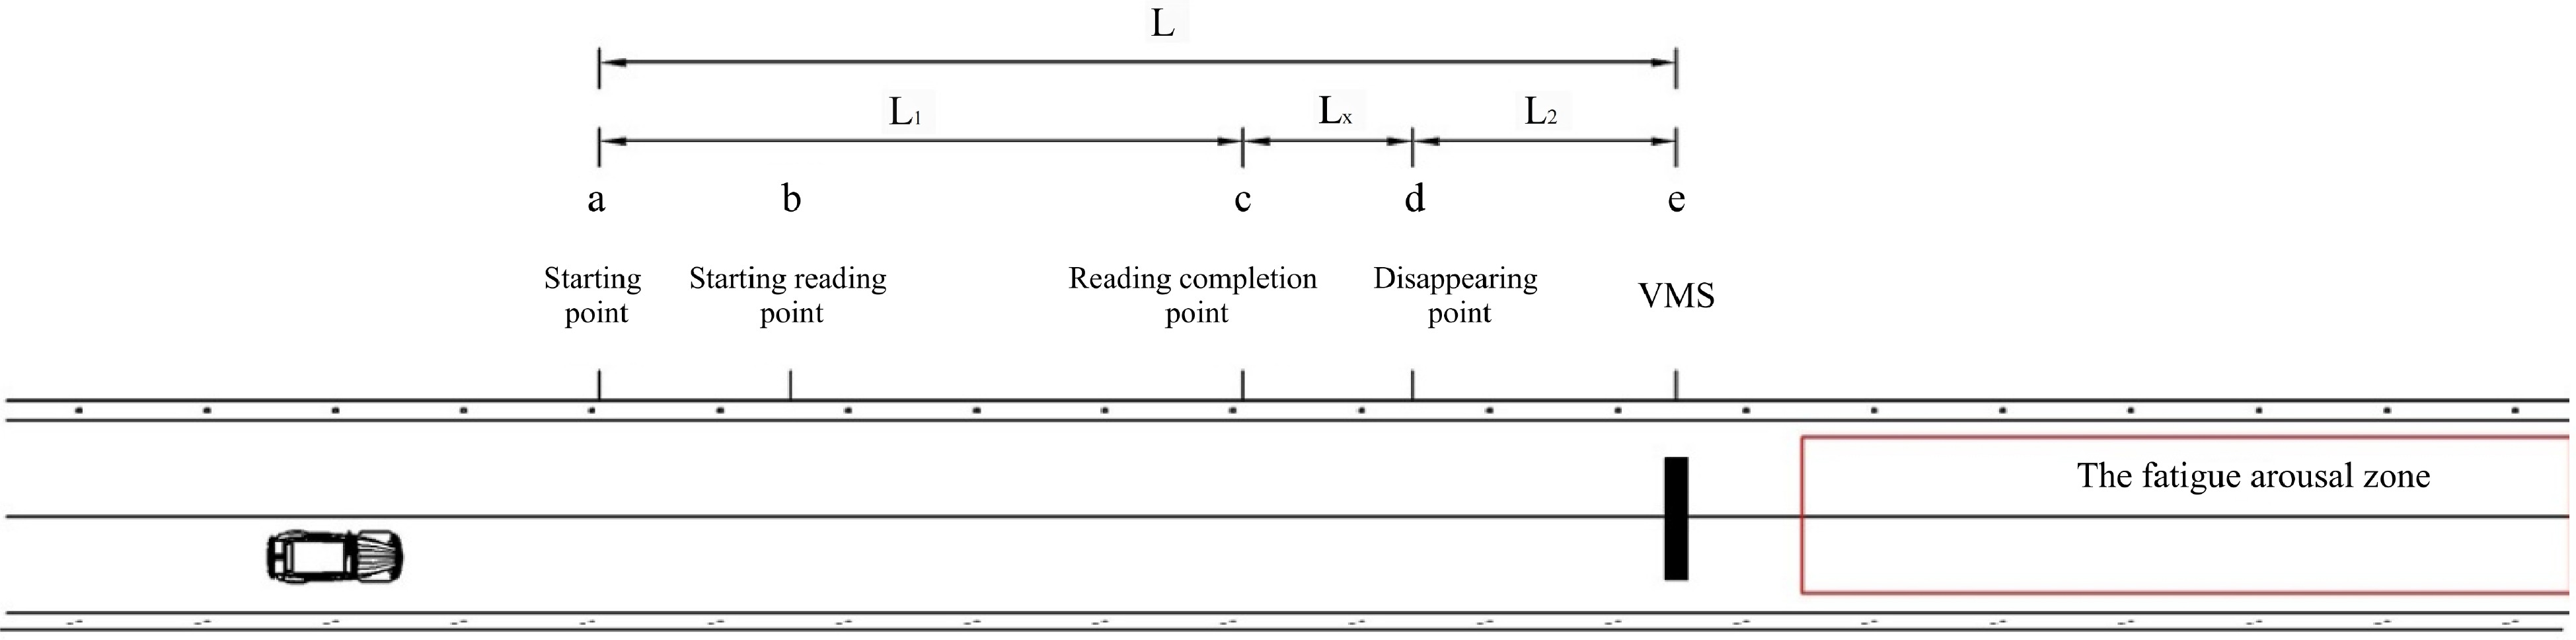
Figure 8.
Diagram of the sign recognition process.
$ L={L}_{1}+{L}_{2}+{L}_{x} $ (11) In formula (11), L1 is the sign recognition distance, L2 is the sign disappearance distance, and Lx is the distance from when the driver recognizes the sign to when the sign disappears.
The minimum value of Lx can be 0, and L1 and L2 need to be calculated separately. The recognition distance L1 of signs is related to the driver's reaction time and the vehicle's speed, as shown in formula (12):
$ {L}_{1}=\dfrac{V}{3.6}\times {t}_{1} $ (12) In formula (12), V is the vehicle's operating speed, and t1 is the sign recognition reaction time. According to the research results of Shang et al.[44], the average sign recognition time for drivers in tunnels is 4.0 s.
The disappearance distance L2 of signs is related to the height at which the signs are suspended and the angle between the driver's line of sight and the sign. According to the geometric relationship of the line-of-sight triangle, the formula for calculating the disappearance distance L2 is shown in formula (13):
$ {L}_{2}=\dfrac{d}{\mathrm{tan}\omega } $ (13) In formula (13), d is the vertical distance between the sign and the viewpoint, and ω is the angle between the sign and the driver's line of sight when the sign disappears.
When the vehicle is traveling at a speed of V = 80 km/h, according to formula (12), L1 = 88.89 m, rounded to 89 m. The driver's viewpoint height is 1.2 m, the height of the single-line text sign is 0.9 m, and the distance from the lower edge of the signboard to the ground is 5.0 m, resulting in d = 4.25 m. When the sign disappears within the driver's field of view, ω is approximately 7°. Substituting this into formula (13) yields L2 = 34.61 m, rounded to 35 m. The minimum recognition distance of the sign, L = L1 + L2 = 124 m, rounded to 130 m. Therefore, to ensure the recognition effectiveness of the fatigue arousal zone, it is necessary to maintain unobstructed driver visibility within a range of 130 m before the introduction sign for the fatigue arousal zone.
Validation of key parameters for the fatigue arousal zone
-
To verify the rationality and effectiveness of the key parameter design for the fatigue arousal zone in this paper, it is necessary to compare and validate it with engineering examples. As of the end of 2022, there are a total of 1,752 extra-long tunnels in China[45], and most of these extra-long tunnels do not have traffic facilities for fatigue arousal. This section compiles statistics on extra-long tunnels in China that have longer lengths and use fatigue arousal technology inside the tunnels. The design parameters are shown in Table 8.
Table 8. Design parameters statistics of the fatigue arousal zone of some extra-long tunnels in China.
Tunnel name Tunnel length (m) Amount Interval (m) Length (m) Form Introduction signs Zhongnanshan highway Tunnel 18,200 3 4,500 150 Blue sky and white clouds, sunset glow, 3D decorations Doesn't exist New erlangshan tunnel 13,459 3 4,000 120 The five-starred red flag, starry sky, maple leaf Exist Dapingni tunnel 12,300 2 4,000 100 Blue sky and white clouds − Chengkai tunnel 11,456 4 2,500 100 Four seasons landscape, 3D decorations Exist Yunshan tunnel 11,403 1 5,500 200 Color light strip Doesn't exist Baojiashan tunnel 11,200 1 − 200 Color light strip, 3D decorations Doesn't exist Baotashan tunnel 10,200 2 3,500 200 Color light strip Exist Six pangshan special tunnel 9,981 1 5,000 200 Blue sky and white clouds, underwater world Doesn't exist Yanglin tunnel 9,460 1 4,700 150 Landscape painting scroll, 3D decorations Exist Baodingshan tunnel no.2 8,775 2 3,000 120 Blue sky and white clouds, rockery stone scenery − Wunvfeng tunnel 7,930 1 4,000 120 Blue sky and white clouds, color light strip Doesn't exist Malanshan tunnel 7,904 2 − 200 Underwater world, mountain and river scenery Doesn't exist Qiganshan Tunnel 7,630 1 3,600 300 Mountain and river scenery − Xuefeng mountain tunnel 7,040 14 3,500 − Blue sky and white clouds Doesn't exist Huayan Tunnel 5,100 4 1000 100 Blue sky and white clouds Doesn't exist Dushu lake tunnel 3,460 1 1,500 100 Color light strip Doesn't exist From Table 8, first, it can be observed that for the location setup of the fatigue arousal zone, if only one such zone is set up within the tunnel, it is mostly located in the middle of the tunnel. However, if two or more fatigue arousal zones are set up, they are mainly concentrated at distances of 3500-4500 m and 7000-9000 m from the tunnel entrance. This paper utilizes the non-linear curve fitting of FDD to calculate the setup location of the fatigue arousal zone, which are situated at 2,700 m and 7100 m from the tunnel entrance. As the positions of fatigue arousal zones in the engineering examples are relatively dispersed, comparing to theoretical calculation results, it can be considered that the positions of fatigue arousal zones in this paper are relatively reasonable and align with engineering reality. Moreover, these theoretical positions align with the research results of Li et al.[46]. Second, regarding the length of the fatigue arousal zone, the lengths are mostly concentrated at 150 and 200 m, with a few at 100 and 120 m. Based on the correlation between visual adaptability and comfort in response to brightness variations and driving speed, the calculated minimum limit in this paper is 130 m, which is consistent with the research results of Chen[39]. For the fatigue arousal zone of tunnels less than 130 m in length, it is necessary to combine the actual illumination of the project with the theory of human eye adaptation for further verification. Third, regarding the design form, the colors in the fatigue arousal zones are mainly cool tones such as starry sky and blue sky with white clouds, or warm tones such as colorful light strips combined with 3D decorations like rockeries and flowers. The use of auditory and tactile stimuli is less common in extra-long tunnels. Fourth, for traffic induction design, as the definition of the fatigue arousal zone had not been standardized and design regulations were not explicitly specified before this, most extra-long tunnels have not set up relevant advance signs for the fatigue arousal zones, and further improvements are needed.
In conclusion, this paper has demonstrated the rationality and practical applicability of the key parameters designed for the fatigue arousal zone.
-
In order to effectively counteract short-term fatigue effects in extra-long tunnels, based on the theory of fatigue arousal, this paper defines the fatigue arousal zone as follows: 'the fatigue arousal zone' within extra-long tunnels refers to a designated section in the middle part of the tunnel, characterized by a certain length. Within this zone, various sensory stimuli, including visual, auditory, and tactile cues, are provided to the driver to induce a rapid return to the optimal arousal level. The purpose of the fatigue arousal zone is to alleviate short-term fatigue issues experienced by drivers in extra-long tunnels.
Based on data collected from natural driving fatigue experiments, this paper has constructed a quantitative dimensionless index of fatigue driving degree (FDD) and the threshold of driving fatigue (TDF), and conducted a study on the key parameters of fatigue arousal zones in extra-long tunnels. The research results are as follows: First, regarding the location setup of fatigue arousal zones, when the tunnel length is between 3−5 km, one fatigue arousal zone should be placed in the middle of the tunnel. When the tunnel length is between 5−10 km, a fatigue arousal zone should be placed at a distance of 2,700 m from the tunnel entrance, with a second one considered based on the actual tunnel conditions. When the tunnel length exceeds 10 km, two or more fatigue arousal zones should be set up, located at distances of 2,700 and 7,100 m from the tunnel entrance. Second, for the length of the fatigue arousal zones, the minimum limit is 130 m. For the fatigue arousal zone of tunnels less than 130 m in length, it is necessary to combine the actual illumination of the project with the theory of human eye adaptation for further verification. Third, regarding the form setup, the optimal color type for the fatigue arousal zone is the cool color tone. The maximum brightness values for different parts of the fatigue arousal zone are as shown in Table 7. Fourth, for traffic induction design, we set up the variable message signs (VMS) in the area ahead of the fatigue arousal zone, and the minimum recognition distance for traffic induction signs inside the tunnel is 130 m. Through a comparative verification with engineering examples, this paper concludes that the design of key parameters for fatigue arousal zones is reasonably sound and practical.
The research findings can provide a theoretical reference for fatigue arousal technology in extra-long tunnels. The main limitation of this study is that only the setting parameters of visual stimuli in the fatigue arousal zone were investigated, and the setting parameters and arousal effects of auditory and tactile stimuli were not experimentally verified. In future research, critical parameters such as stimulation methods, stimulation frequency, and stimulation intensity for auditory and tactile stimulation can be explored and validated.
-
The authors confirm contribution to the paper as follows: conceptualization: Lian G, Xie L; data curation: Lian G; formal analysis: Lian G; funding acquisition: Shang T; investigation: Lian G, Zhou A; methodology: Lian G; resources: Shang T; supervision: Shang T; validation; Zhou A; visualization: Xie L; writing – original draft: Xie L; writing – review & editing: Xie L, Zhou A. All authors reviewed the results and approved the final version of the manuscript.
-
The data that support the findings of this study are available on request from the corresponding author.
This research was sponsored by Natural Science Foundation of Chongqing, China (grant number CSTB2023NSCQ-MSX0742), and by the MOE (Ministry of Education in China) Project of Humanities and Social Sciences (grant number 22YJCZH143), and by the National Natural Science Foundation of China (General Program) (grant number 52172341).
-
The authors declare that they have no conflict of interest.
- Copyright: © 2023 by the author(s). Published by Maximum Academic Press, Fayetteville, GA. This article is an open access article distributed under Creative Commons Attribution License (CC BY 4.0), visit https://creativecommons.org/licenses/by/4.0/.
-
About this article
Cite this article
Shang T, Lian G, Xie L, Zhou A. 2023. Research on key parameters of the Fatigue Arousal Zone in extra-long tunnels based on natural driving experiments. Digital Transportation and Safety 2(4):284−297 doi: 10.48130/DTS-2023-0024 

Research on key parameters of the Fatigue Arousal Zone in extra-long tunnels based on natural driving experiments
- Received: 07 November 2023
- Accepted: 15 December 2023
- Published online: 28 December 2023
Abstract: To effectively mitigate the short-term fatigue effects of driving in extra-long tunnels, this study conducted natural driving experiments in five extra-long tunnels of varying lengths and tunnel group sections. Utilizing data obtained from natural driving fatigue experiments, this study identified perclos P80, variable coefficient of pupil diameter, and acceleration as fatigue sensitivity indicators, determined through significance tests of difference and correlation analysis. This study employed an ordered multi-class Logistic model to investigate the factors that influence driving fatigue in extra-long tunnels. The most significant variable in the model was perclos P80, which served as an indicator for classifying and identifying fatigue levels in extra-long tunnels. Following this, a dimensionless quantitative metric, the Fatigue Driving Degree, was formulated, and the Threshold of Driving Fatigue was established. Using the quantitative framework for driving fatigue, this paper standardized the definition of the fatigue arousal zone in extra-long tunnels. The study analyzed the operational principles and validated the key parameters of the fatigue arousal zone in extra-long tunnels. These parameters encompass the placement location, length, form, and traffic induction design of the fatigue arousal zone. The research findings can serve as a theoretical reference for the development of fatigue arousal technology in extra-long highway tunnels in China.
-
Key words:
- ITS /
- Traffic Safety /
- Optimization /
- Risk /
- Transportation Planning