


-
Road traffic crashes have become a serious issue in the modern world. They are the leading cause of death in developing countries for people under 30 years of age. Thousands of people are killed and injured everyday on roads. In 2015, the World Health Organization (WHO) predicted that the third leading cause of crashes in 2020 will be road traffic injuries which was the ninth leading cause in 1990[1].
In Bahrain, a crash is reported every 5 min[2]. Approximately 40% of the people involved in these crashes were reported to be under 25 years of age during 2003−2010[3]. In Bahrain, the death rate due to crashes was 3.66 deaths per 100,000 population, based on 2017 population statistics[4]. The total cost of traffic crashes includes victim related costs, administration costs and property damage costs[5]. Cost of crash is one of the major factors for calculating its severity level[6]. Estimation of severity levels is one of the basic requirements for analyzing crash data from different locations[7]. Crash costs can be used for comparative analysis of different locations by using equal basis of measurement i.e. monetary impact of crashes[8].
This study was conducted to estimate the severity levels of different types of crashes in Bahrain using their costs, by applying two different approaches, namely: the Human Capital Approach (HCA) and total reported costs. The comparison of these two approaches, despite their use in calculating cost of crashes, to estimate severity levels of road traffic crashes is not found in the literature. Then, using the costs obtained by the two approaches, the relative weights of each of the crash severity levels were found and compared with each other. These severity levels were also compared with the results from other studies. The comparison of crash costs from different approaches has been done by a number of researchers but the current study utilizes the crash severity weights for this comparison which has also not been found in the literature. The utilization of these weights would change the safety evaluation of crash sites.
-
Crash costs are considered an important component for evaluation of program and policy measures related to road design and safety improvement. Moreover, an awareness of the accurate estimate of crash costs enables efficient allocation and utilization of resources and budget from the government sector[9]. This is also substantiated by the fact that road conditions can greatly influence the crash costs, by as much as 40%[10]. The evaluation of crash costs could be greatly impacted by the type of method and approach used in calculation of the costs. The main components of these costs could be human costs, production loss and property damage.
Human loss could be evaluated through a stated-preference survey by inquiring about the willingness-to-pay (WTP) from the respondents. The HCA is generally used for estimating production loss while property damage can be estimated from the monetary damages caused due to the crashes[11]. Another method for production loss calculation is the friction cost method (FCM)[12]. There is not much literature found on the use of FCM.
The most important aspect of crash costs is related to determination of cost of human life. The possible approaches to do that includes WTP and value of preventing a fatality (VPF), which is also known as value of a statistical life (VSL). HCA is also used for VSL estimation by government organizations[13].
There exists a difference of opinion among researchers related to the use of WTP and HCA approaches. This difference is mainly associated with WTP being an ex-ante approach while HCA is an ex-post approach. A detailed discussion regarding WTP can be found in Giles[14]. The HCA approach incorporates both economic and epidemiological damages in monetary terms based upon the crash data[15].
WTP has been reported to overestimate the crash costs, as compared to HCA, which could be adjusted on the population density and income levels. A combination of both approaches has also been suggested to overcome the issues with both methods[16]. Such a combination, also referred to as harmonization, is advocated for the comparison of international crash data which is evaluated in diverse manners by different countries[17]. Such harmonization could be achieved by employing different methods to estimate different aspects of crash costs. Wijnen[18] has attempted to do that with the use of WTP for human costs, HCA for production losses and restitution costs for any other social costs.
There are limited studies available regarding the comparison of crash cost estimation methods. A review of comparison of traditional approaches has shown that the main reason behind this shortcoming is the lack of consensus related to techniques and their components among different stakeholders[19]. These comparisons have included the comparison on the basis of economic analysis related to effectiveness of countermeasures. It has been found that a crash-based approach is better than casualty-based approach for economic analysis[20]. On the other hand, the casualty-based approach is conveniently applied through hospital record data and includes both fatal and non-fatal injury crashes[21]. Having said that, there exists a large amount of literature that relies on the WTP method for calculation of crash cost, due to its wider application to different geographical regions[22, 23]. This also includes its use for economic analysis of crashes and their resulting injuries[24].
The review of the literature shows that different methods used for calculation of crash costs have been discussed rigorously, which points to the importance of this issue. Secondly, comparison and combination of these methods is also advocated in some of the more recent studies, especially those concerning international data. The crash costs are often used for calculation of severity-related parameters. Naturally, the next step in this research should be to compare and identify the impact of different estimation methods on the severity parameters. Moreover, there is a lack of literature which tries to determine and incorporate any hidden costs due to crashes. The present study is an attempt to fill this gap by utilizing total reported crash costs and compare the severity parameters based upon the costs calculated by HCA and reported costs with each other and those found in the literature.
-
The methodology of this study follows three main steps. Firstly, collection of crash and relevant economic data from different sources. Secondly, use of data to estimate the crash costs with different approaches. Lastly, the crash severity factors were calculated using the crash costs for different approaches and compared with each other and those already applied in the region and found in the literature. The methodology is shown in Fig. 1.
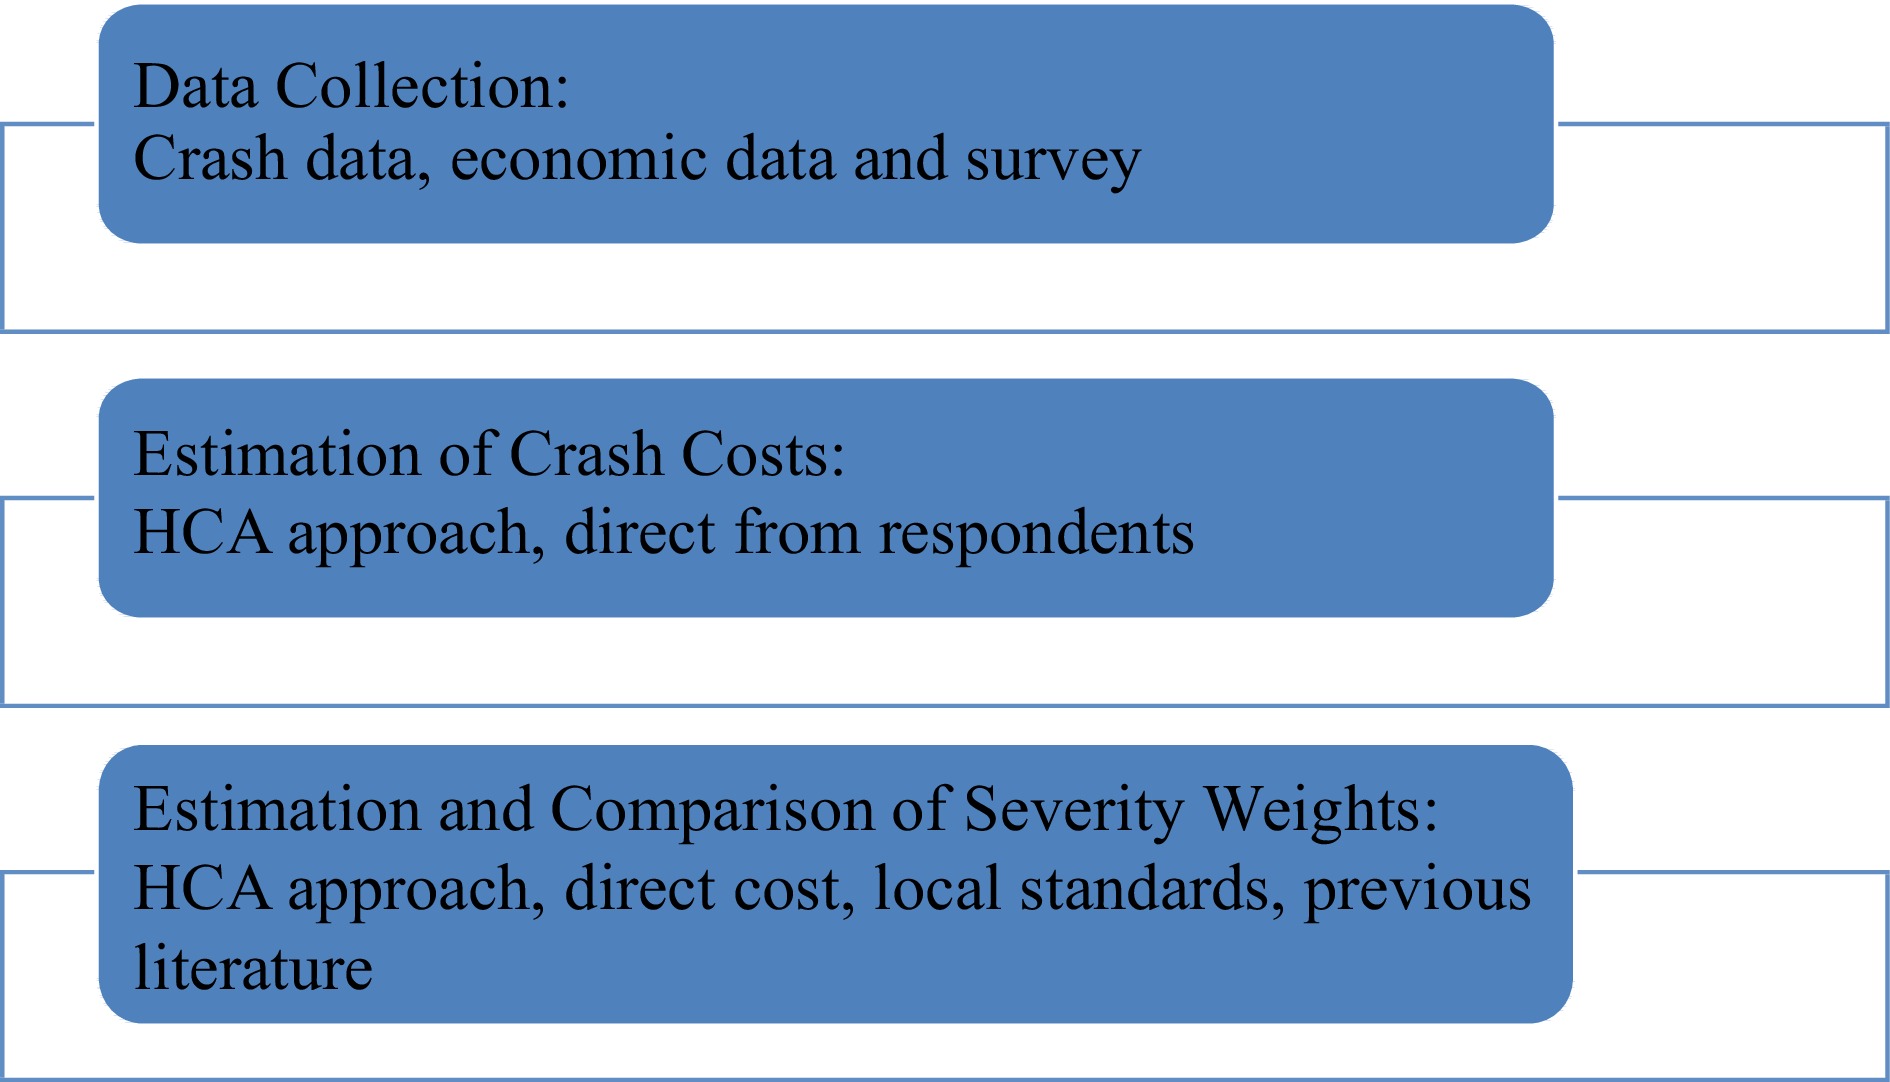
Figure 1.
Research methodology.
HCA estimates the loss of life or injury on current or future levels of output. This method considers the crash cost as any cost due to a crash incurred by the victim or any other organization in the form of property losses, production loss or any other item related to the crash. This approach was used in the estimation for traffic costs in Kuwait[25], Metro Manila[26] and Australia[14]. The above-mentioned studies have utilized three types of cost items in their analysis with HCA method including victim-related costs, administrative costs and property damage, they are shown in Fig. 2. It is an attempt to evaluate the value of all costs that are considered to be components of crashes, this includes the discounted costs for vehicle damage, medical costs and administrative costs (see Fig. 2 for more details). Information obtained from the Statistics of General Directorate of Traffic[2], insurance companies, highway roads sector of the Ministry of Works (MoW) and Ministry of Health[4, 27], was used to calculate the costs of crashes to society in 2017.
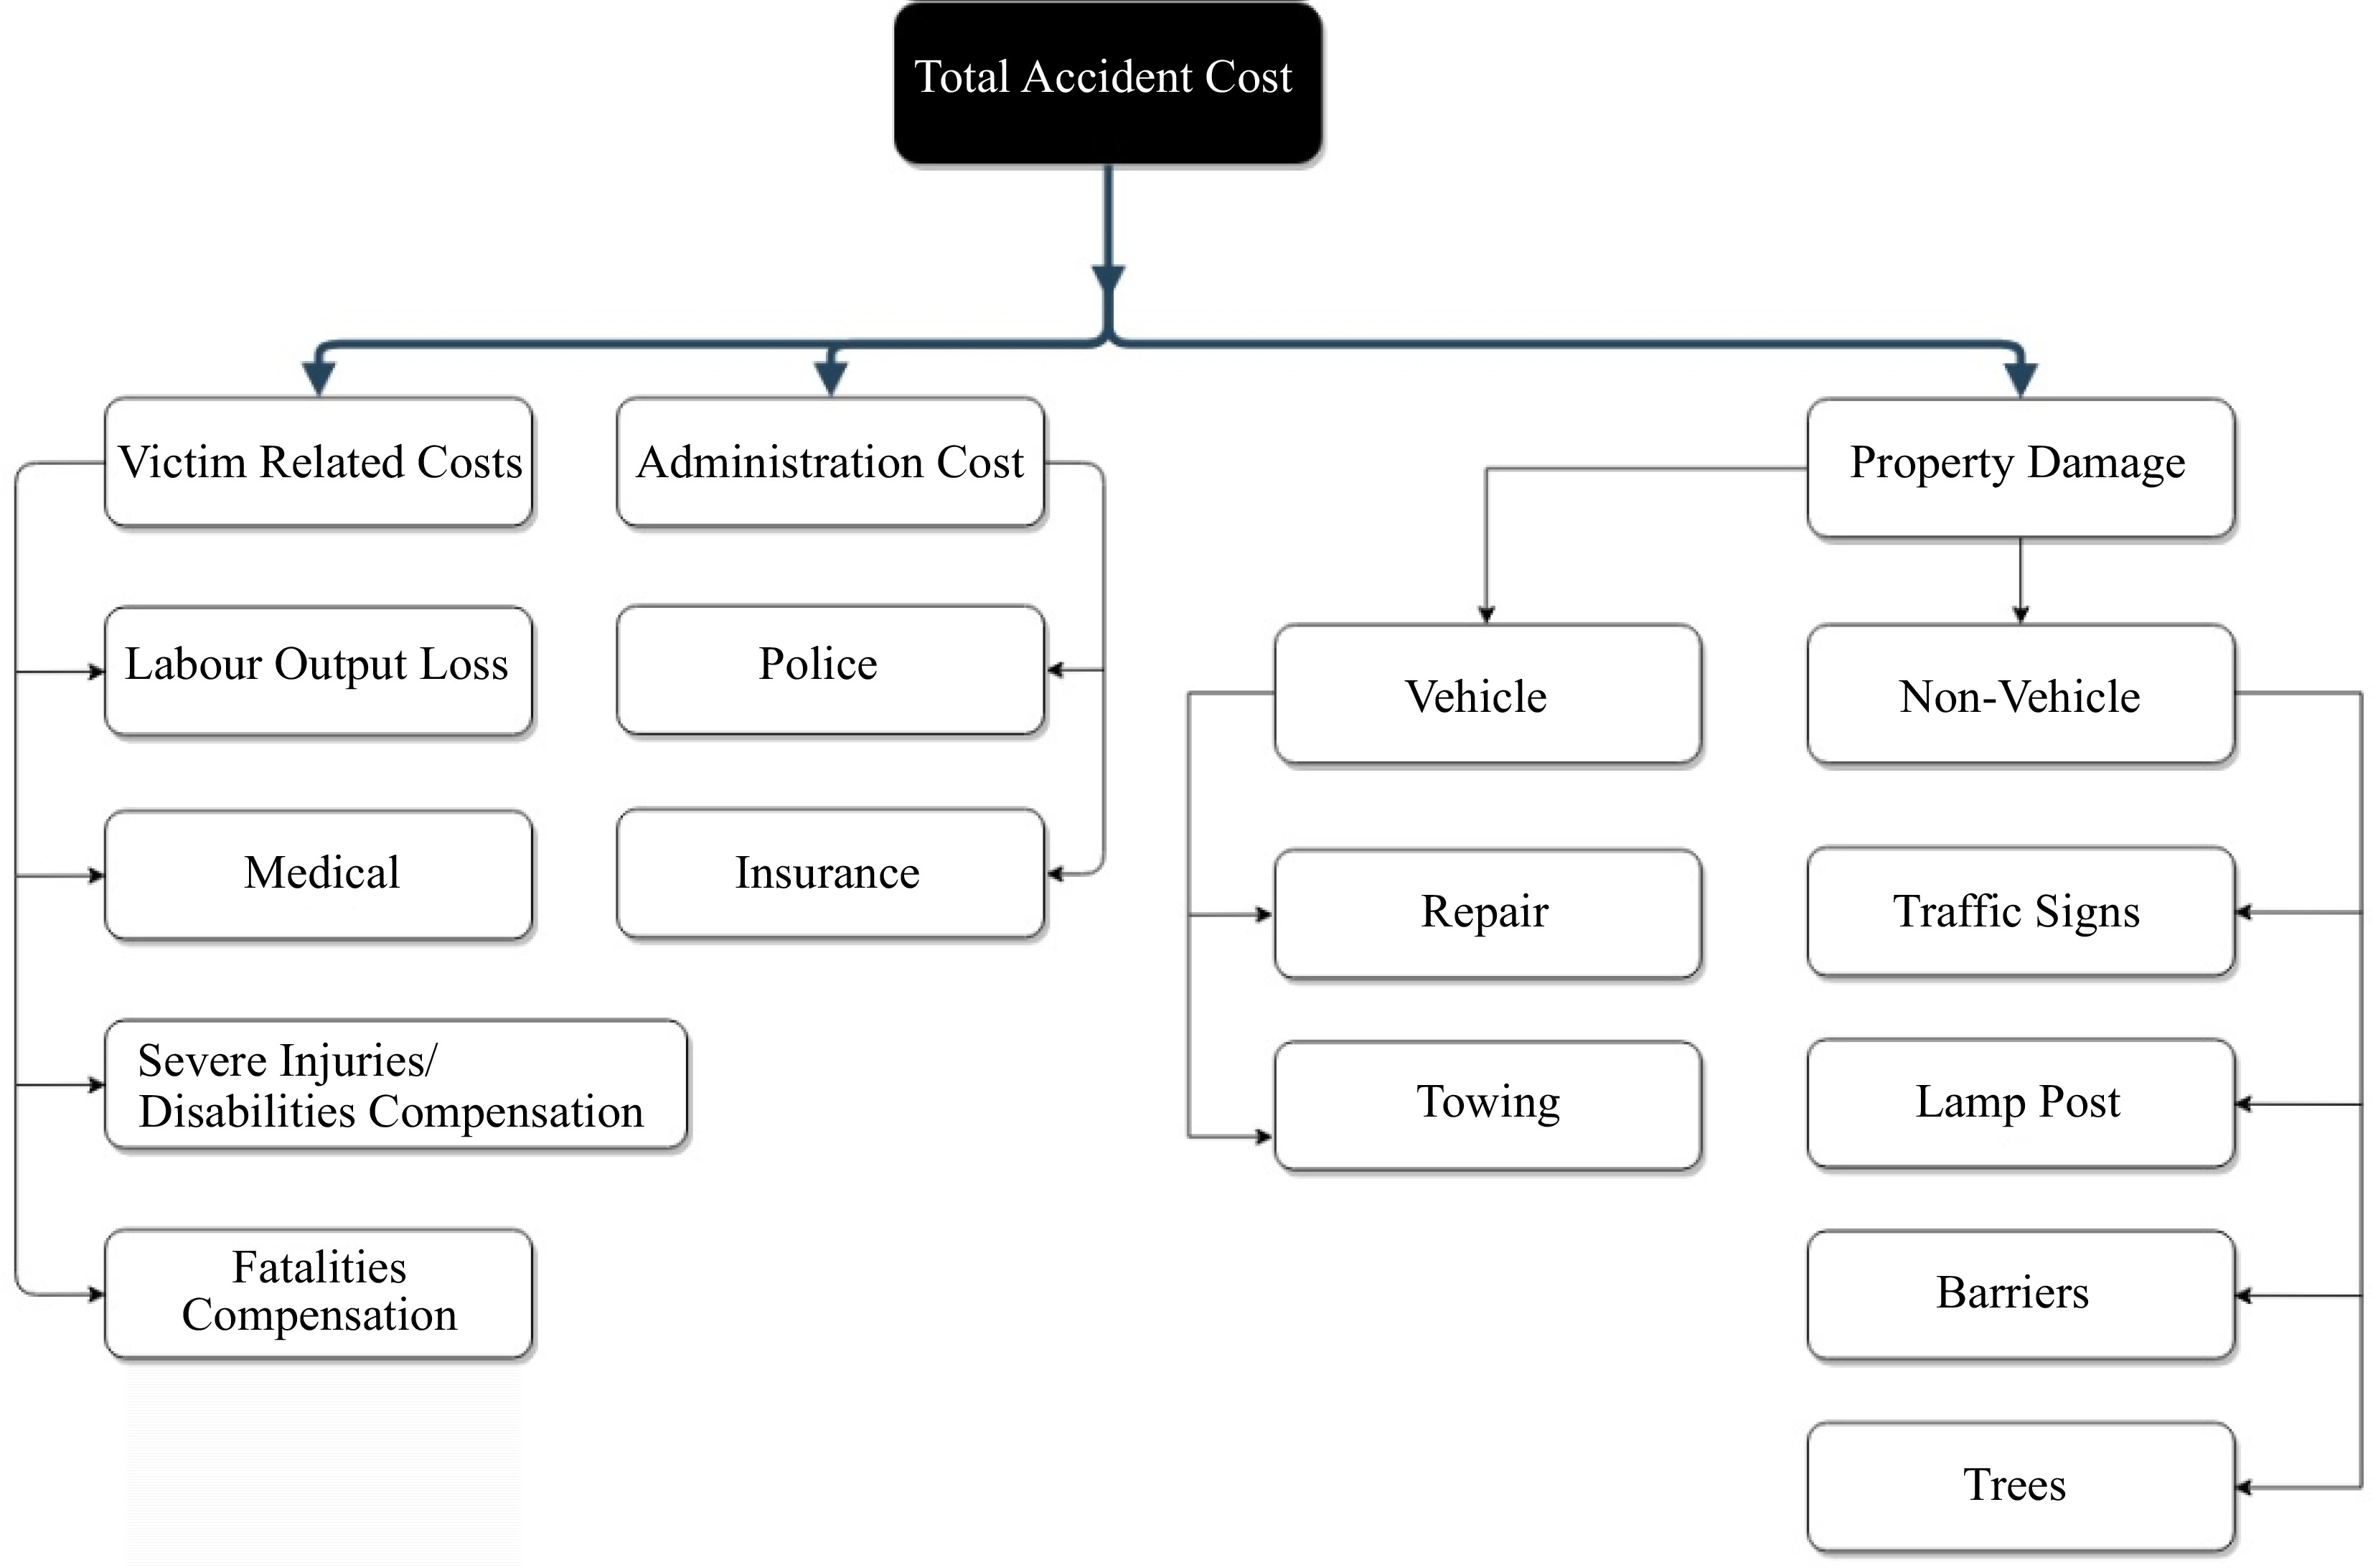
Figure 2.
Total crash cost using the Human Capital Approach.
It must be noted that some components that were considered in the study by De Leon et al.[26] were excluded in this study such as pain, grief and suffering costs. This was done as no reliable sources were found to estimate or determine these costs. Not many studies, related to traffic crashes and their costs in Bahrain, were found, which also made it very difficult to correlate the results with any other source. The procedure to estimate the cost components for Bahrain is provided below. These components included victim-related costs, property damage costs and administrative costs.
Victim-related costs
Labor output loss
-
A measure that considers the loss of financial income because of the crash. It is calculated by taking the average off days taken by the victim due to the crash and multiplying it by the average daily wage in Bahrain. The research team interviewed the doctors in the emergency department of Salmaniya Hospital (Bahrain), where the majority of the crash cases in Bahrain are taken. According to the responses collected from there for percentage of crashes and days taken off by the victim, a weighted average was calculated to be 3 d loss of work. These days include number of days for which the victim was hospitalized (if required) and those in which he/she was recommended to take bed rest. The average wage rate for Bahrain BHD 1077 per month, at the time of study, was taken from an online source[28].
Medical costs
-
A measure of the total medical costs per year caused by traffic crashes. It was found that the government's total medical cost is BHD 3,532,296 per year[4]. The total number of people administered to hospitals as a result of traffic crashes is 2,135 and the number of patients that arrive at the Emergency Room (ER) is 66,000 patients per year according to the medical crash and emergency statistic in 2017[27]. The percentage of people arriving at the ER due to road traffic crashes is found to be 3.2% (2,135/66,000 × 100). Hence, the medical costs were calculated by taking the same percentage of the total medical cost.
Severe injuries/disabilities
-
A measure of cost of the disabilities that occur as a result of a crash; this includes the health care provided to the victim for the remaining years of life. Serious crashes are assumed to lead to severe injuries and disabilities. The crash victim has to be hospitalized for more than a day in the hospital due to serious injuries, since one day observation is very common for any sort of injury.
The average cost is found by applying the present value equation as shown in Eqn (1)[29].
$ PV=P{(1+r)}^{n} $ (1) P is the average wage of a nurse, which is taken as BHD 600 as per the hospital records. n is the number of remaining life years affected by the crash for the victims. It was calculated as the difference of life expectancy and average age of victims involved in serious injury crashes in Bahrain; which were 77 and 32 years respectively, r is the effective discount rate, at the time of study, taken from online sources[30].
Fatalities
-
A measure of cost for the loss of the human life that has been lost in a crash. The present value approach was applied to this category, wherein P is the average wage of an employee, n is the number of years remaining life of the victims, which was taken as per the previous value taken in case of disability.
Administration cost
Police administration cost
-
Includes the amount paid for police assistance and services for the crash. It also includes the investigation costs or any other post-accident issues handled by the police. The cost is BHD 16 for the person at fault and BHD 6 for the person involved in the crash. The number of crashes and number of people involved in the accidents in 2017 are 1,151 and 1,961, respectively. The total cost is obtained by multiplying each categories' number by its cost.
Insurance administration cost
-
Includes the amount paid by the person at fault for the insurance to proceed with the claim. The same concept, as the police administration cost, is applied to find this cost. The insured party (at fault) pays the administration excess for the insurance company, which is averaged to be BHD 100, as per information provided by the insurance companies. This cost includes assistance provided by the insurance company in terms of repair, administration costs, medical care, etc.
Property damage
Vehicle damage only
-
Includes the cost of vehicle repair damage that is caused by a crash as well as the towing services. Data was collected from insurance companies for the cost of car repairs and the number of cars towed per month.
Non-vehicle damage
-
Includes the cost of damage done to objects located on highways. The cost of the items as per 2017, obtained through total reported costs by MoW, are shown in Table 1. The information about these costs was taken in-person from the concerned people in the ministry. The cost is obtained by multiplying the number of objects impacted during crashes by their cost and summing the totals.
Table 1. Cost of objects damaged in accidents during 2017.
Item Cost (BHD)
per objectNumber of objects
damaged during
accidents in 2017Total cost
(BHD)Concrete barrier 100.00 96 9,600 Lamppost 35.00 16 560 Traffic signs 100.00 11 1,100 Trees 100.00 10 1,000 The HCA method is argued to be deficient by not considering the cost to the drivers, which can change due to factors such as age, educational level and income[14]. Keeping this in mind, an online questionnaire was used, for collecting personal data related to crashes from the victims. In addition, responses for fatal and serious injuries were obtained by reaching out to insurance companies to collect the required data as the victims of these crashes were not available to fill in the form.
Finally, weights were calculated for different levels of accident severity, by dividing the costs of severe injury and fatal accidents with the cost of property damage and minor injury accidents. These weights are commonly used for aggregating accidents at a particular location and estimate its safety[7].
-
Total number of crashes recorded by directorate of traffic was 111,610 in 2017. The total cost of these crashes, using HCA, are shown in Table 2, the distribution of different cost components is shown in Fig. 3. The highest cost component was property damage due to high number of property damage crashes as these crashes constitute 95.2% of the total crashes in 2017.
Table 2. Total cost of road traffic crashes in 2017.
Category Cost (BHD) Total victim related cost 4,778,060 Labor output loss 517 Medical cost 114,038 Severe injuries/disabilities cost 2,706,853 Fatalities cost 1,956,652 Total administration cost 153,382 Police administration cost 38,282 Insurance administration cost 115,100 Total property damage 44,267,060 Vehicle damage only 44,254,800 Non-vehicle costs 12,260 Total crash cost 49,198,502 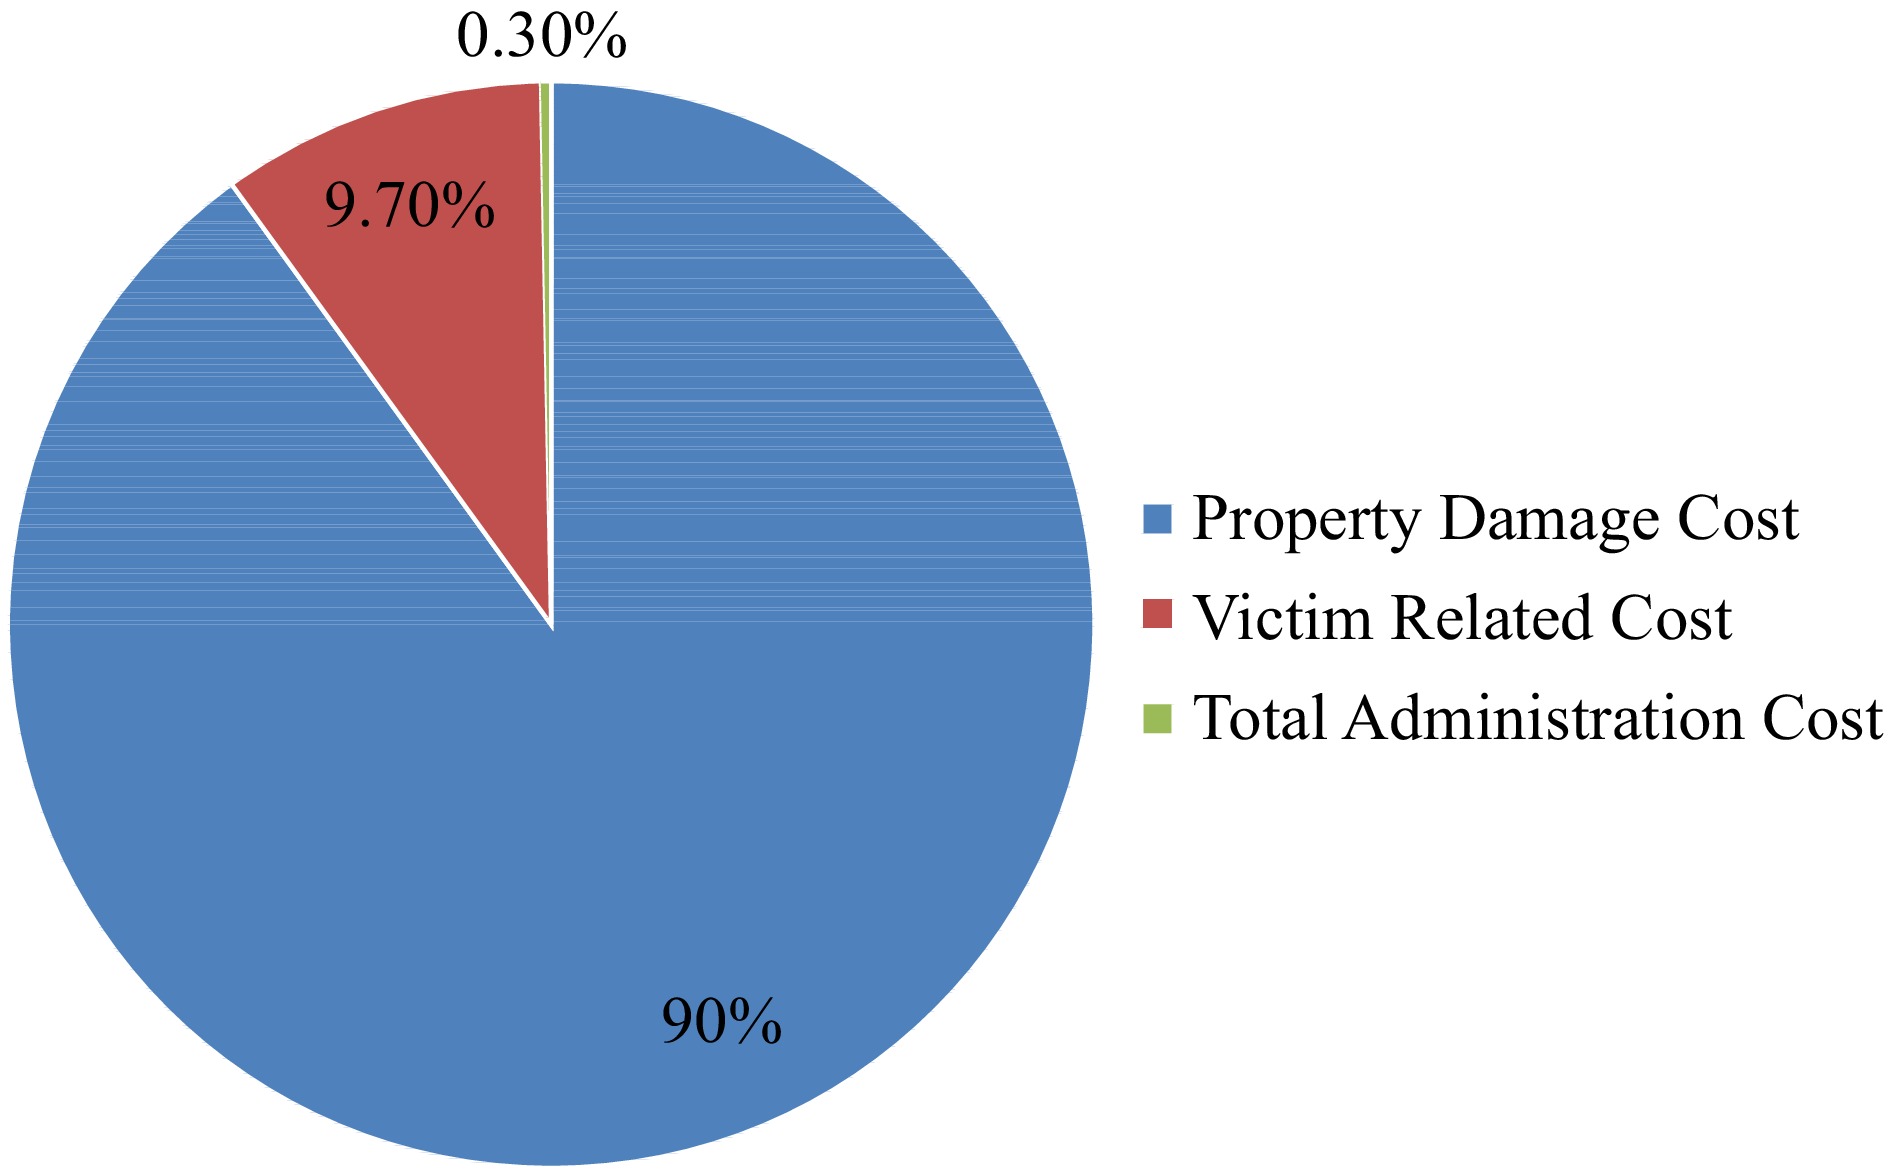
Figure 3.
Distribution of cost components.
The second highest component was victim related costs which is largely attributed to fatality costs. The average age of traffic crash related victims is 33 years which would mean that the victim's family loses their loved one at a relatively young age resulting in higher losses in earnings.
Survey data, comprising of 101 samples, were taken from the crash victims for calculating the severity levels using the total reported costs reported by the respondents in the survey. Initially, an online questionnaire was distributed randomly for the purpose of collecting personalized data related to accidents from the victims for this survey. The distribution of this sample in terms of gender and nationality is given in Table 3. The average age of respondents was 31 years with an average income of BHD 750 approximately. Eighty five percent of respondents reported having accidents with other vehicles, 12% had crashes with objects while the remaining had accidents with pedestrians. The distribution of crashes, in terms of severity, from the survey respondents is shown in Fig. 4. The survey was conducted online, however, responses for fatal accidents had to be collected from family members of victims of such accidents. Stratified sampling was used to collect a representative sample of the victims involved in the crashes. This data had more than 50% males from other nationalities, which was in accordance with the statistics published by the traffic directorate for the people involved in accidents. In addition, the percentage of different crash casualties/severities was also included in the survey as per population data.
Table 3. Distribution of gender and nationality.
Male Female Total Bahraini 48% 16% 63% Non-Bahraini 28% 9% 37% Total gender 75% 25% 100% 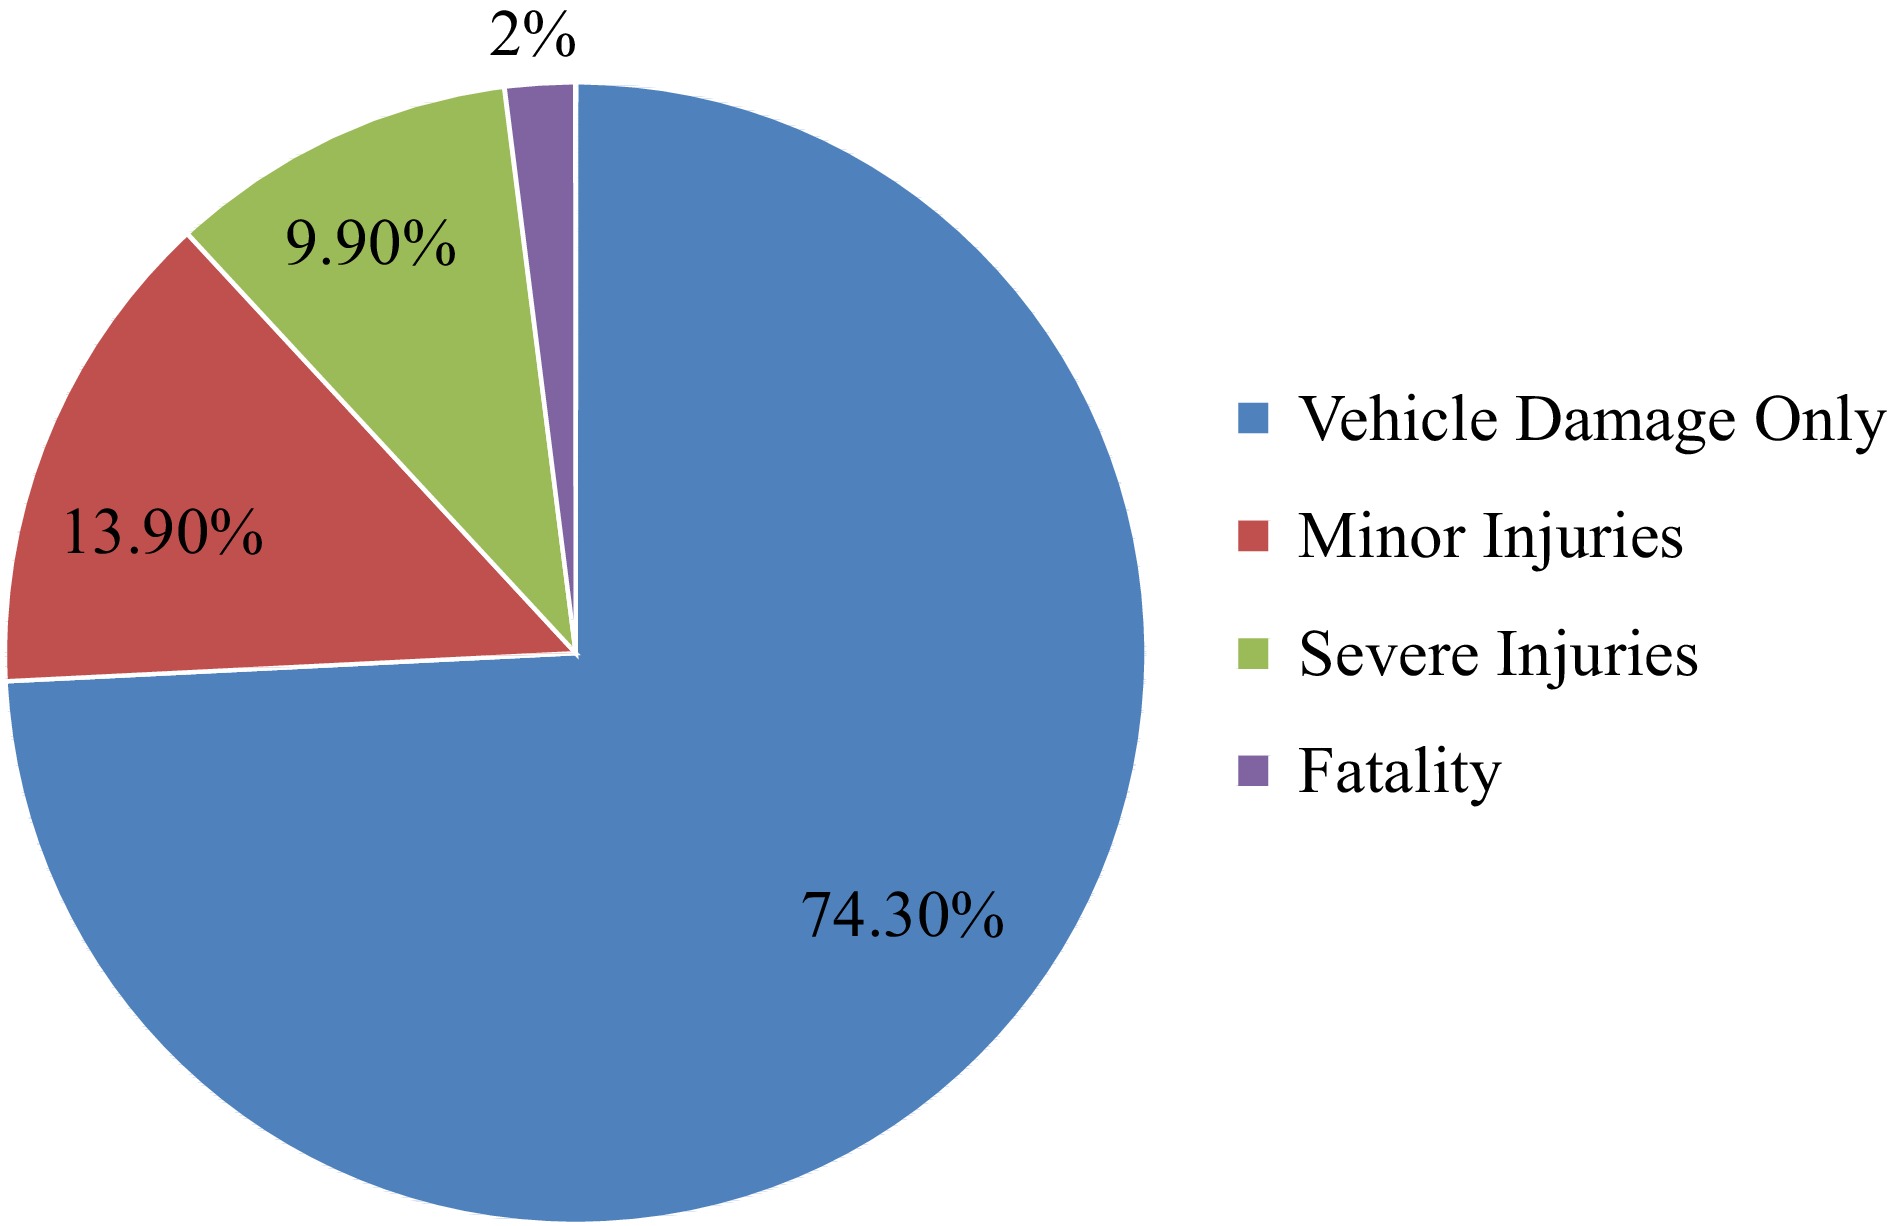
Figure 4.
Crash severity distribution of survey respondents.
A regression model was attempted using this data to predict the cost of crashes. However, the model did not show any meaningful relationships in terms of significance of variables on crash costs which could be attributed to many factors including sample size and effect of unknown variables. Hence, it was decided to directly take the average costs of severe injury, fatal accidents and minor injury and property damage crashes from the survey responses.
It should be noted at this stage that the minimum age of survey respondents was 18 years. Hence, this should be considered as one of the limitations of the crash costs obtained from the survey. The average cost of minor injury and property damage crashes, as per responses of the survey, was approximately BHD 589, while that for severe injury accident and fatal crashes was BHD 4,109 and BHD 21,000. Severity levels of crashes are calculated as the ratio of average cost of a specific severity to that of a property damage crash, as shown by Eqn (2).
$\rm Wi = CCi/CC_{PDMI } $ (2) Where Wi of crash severity 'i' (Fatality or Severe Injury), CCi is the crash cost for crash with severity level 'i' and CCPDMI is the crash cost for crash with severity level of Car Damage and Minor Injury.
These ratios (severity levels) are shown in Table 4, which were compared with that calculated by the HCA approach as well. Moreover, these severity levels were compared by those found in a previous study by De Leon et al.[26], and those used by the local authorities[31,32].
Table 4. Comparison of weights of different crash severity.
Severity De Leon Shehab HCA Direct cost Car damage and minor injury 1.00 1.00 1.00 1.00 Severe injury 1.40 3.00 14.78 6.97 Fatality 1.55 12.00 94.07 35.63 It can be concluded, from the comparison of severity levels, that the levels found in this study are higher than those calculated in the previous study or used by local authorities. There is also a vast difference between the levels calculated using the two different approaches in this study. Higher levels in this study could be attributed to the higher economic (income) status of residents in Bahrain as it is regarded among the high-income countries[26]. Another possible reason could be the lower age of victims involved in severe injury and fatal accidents which was 33 years, which is found to be much higher in some of the other previous studies[33, 34]. This also indicates the need to update the similarity levels used by local authorities using actual costs instead of adopting from other region(s).
-
This study was carried out to estimate the severity levels of accidents using costs of traffic crashes in Bahrain for 2017 crash data. Two different approaches were attempted for calculating the cost, namely, HCA and total reported costs. It was found that the data from the traffic directorate does not classify minor injury and car damage crashes separately. Hence, these crashes were taken under a single category for calculation of costs. Moreover, severity weights were also calculated treating the minor injury and car damage crashes as the reference. The crash data was taken from official sources, while the survey for the reported costs had a representative sample according to distribution of people involved in the crashes. Hence, the results could be considered valid for the population under study (i.e., Bahrain). The values of different cost components, calculated using HCA, were as follows: total victim related cost is BHD 4,778,060 representing 9.71% of the total cost, total administration cost is BHD 153,382 representing 0.31% of the total cost, total property damage cost is BHD 44,267,060 representing 90% of the total cost, and the total crash cost is BHD 49,198,502. The high proportion of victim-related costs is related to the fatal crashes wherein average victim age was found to be 32 years, resulting in a longer period of loss in productivity. This points to the need to investigate the involvement of young drivers in road crashes and measures to curtail it.
In the end, the severity levels obtained by the HCA method and total reported costs were compared to those calculated in another study and adopted by local authorities. It was found that severity levels calculated in this study were higher than others. Severity levels obtained by the HCA approach were 14.78 and 94.07 for severe injury accidents and fatal accidents, respectively. One the other hand, these values by using total reported costs were: 6.97 and 35.63. The HCA approach may be considered more preferable since it includes future effects of crashes in terms of loss of income and other items. On the other hand, total reported costs can be considered as an indicator of direct costs only. On the basis of this study, it is highly recommended to update the crash severity factors used locally which may result in reevaluation of safety measures and economic analysis of the costs. Secondly, the analysis could be further extended to evaluate and compare the severity factors for other countries, in the same region as Bahrain.
-
The authors confirm contribution to the paper as follows: study conception and design, data collection, analyses and draft manuscript preparation: Gazder U; analysis and interpretation of results: Abdulhusain BH, Mohamed AH, Ratrout N; manuscript preparation and formatting: Ahmed A. All authors reviewed the results and approved the final version of the manuscript.
-
The datasets generated during and/or analyzed during the current study are available from the corresponding author on reasonable request.
-
We would like to express our gratitude to the individuals that contributed in any way to help complete this project. Our appreciation, for aiding us with the required information, goes to: General Directorate of Traffic (General Directorate of Traffic, 2017), Ministry of Works, Ministry of Health, the insurance companies (BNI, AXA, United Insurance, Solidarity and GIG), Dr. Naeem Al Koumi and Dr. Semih Erhan for sharing their knowledge and Ms. Zahra Madan for helping with this project.
-
The authors declare that they have no conflict of interest.
- Copyright: © 2023 by the author(s). Published by Maximum Academic Press, Fayetteville, GA. This article is an open access article distributed under Creative Commons Attribution License (CC BY 4.0), visit https://creativecommons.org/licenses/by/4.0/.
-
About this article
Cite this article
Gazder U, Ahmed A, Abdulhusain BH, Mohamed AH, Ratrout N. 2023. Estimating the severity levels of road traffic crashes in Bahrain with crash costs estimated with different approaches. Digital Transportation and Safety 2(4):278−283 doi: 10.48130/DTS-2023-0023 

Estimating the severity levels of road traffic crashes in Bahrain with crash costs estimated with different approaches
- Received: 23 September 2023
- Accepted: 08 December 2023
- Published online: 28 December 2023
Abstract: An important issue in analyzing accident blackspots is the estimation of severity levels of different types of accidents. This study aims to estimate the severity level of accidents in Bahrain using crash costs. These crash costs were calculated by the Human Capital Approach (HCA) and total reported costs from the victims. The data was collected from the General Directorate of Traffic, insurance companies, Ministry of Works (MoW) and Ministry of Health. It was found, from the survey responses, that there was no significant effect of victim characteristics on the total cost of the accidents. The severity levels were found to be higher than those found in previous literature or adopted by local authorities which could be attributed to the economic conditions of Bahrain. Moreover, the weights found by both approaches were different from each other. Therefore, it is recommended to use the HCA approach due to its comprehensive calculations involving future costs.
-
Key words:
- Crash severity levels /
- Cost of accidents /
- Human capital approach /
- Reported costs.