-
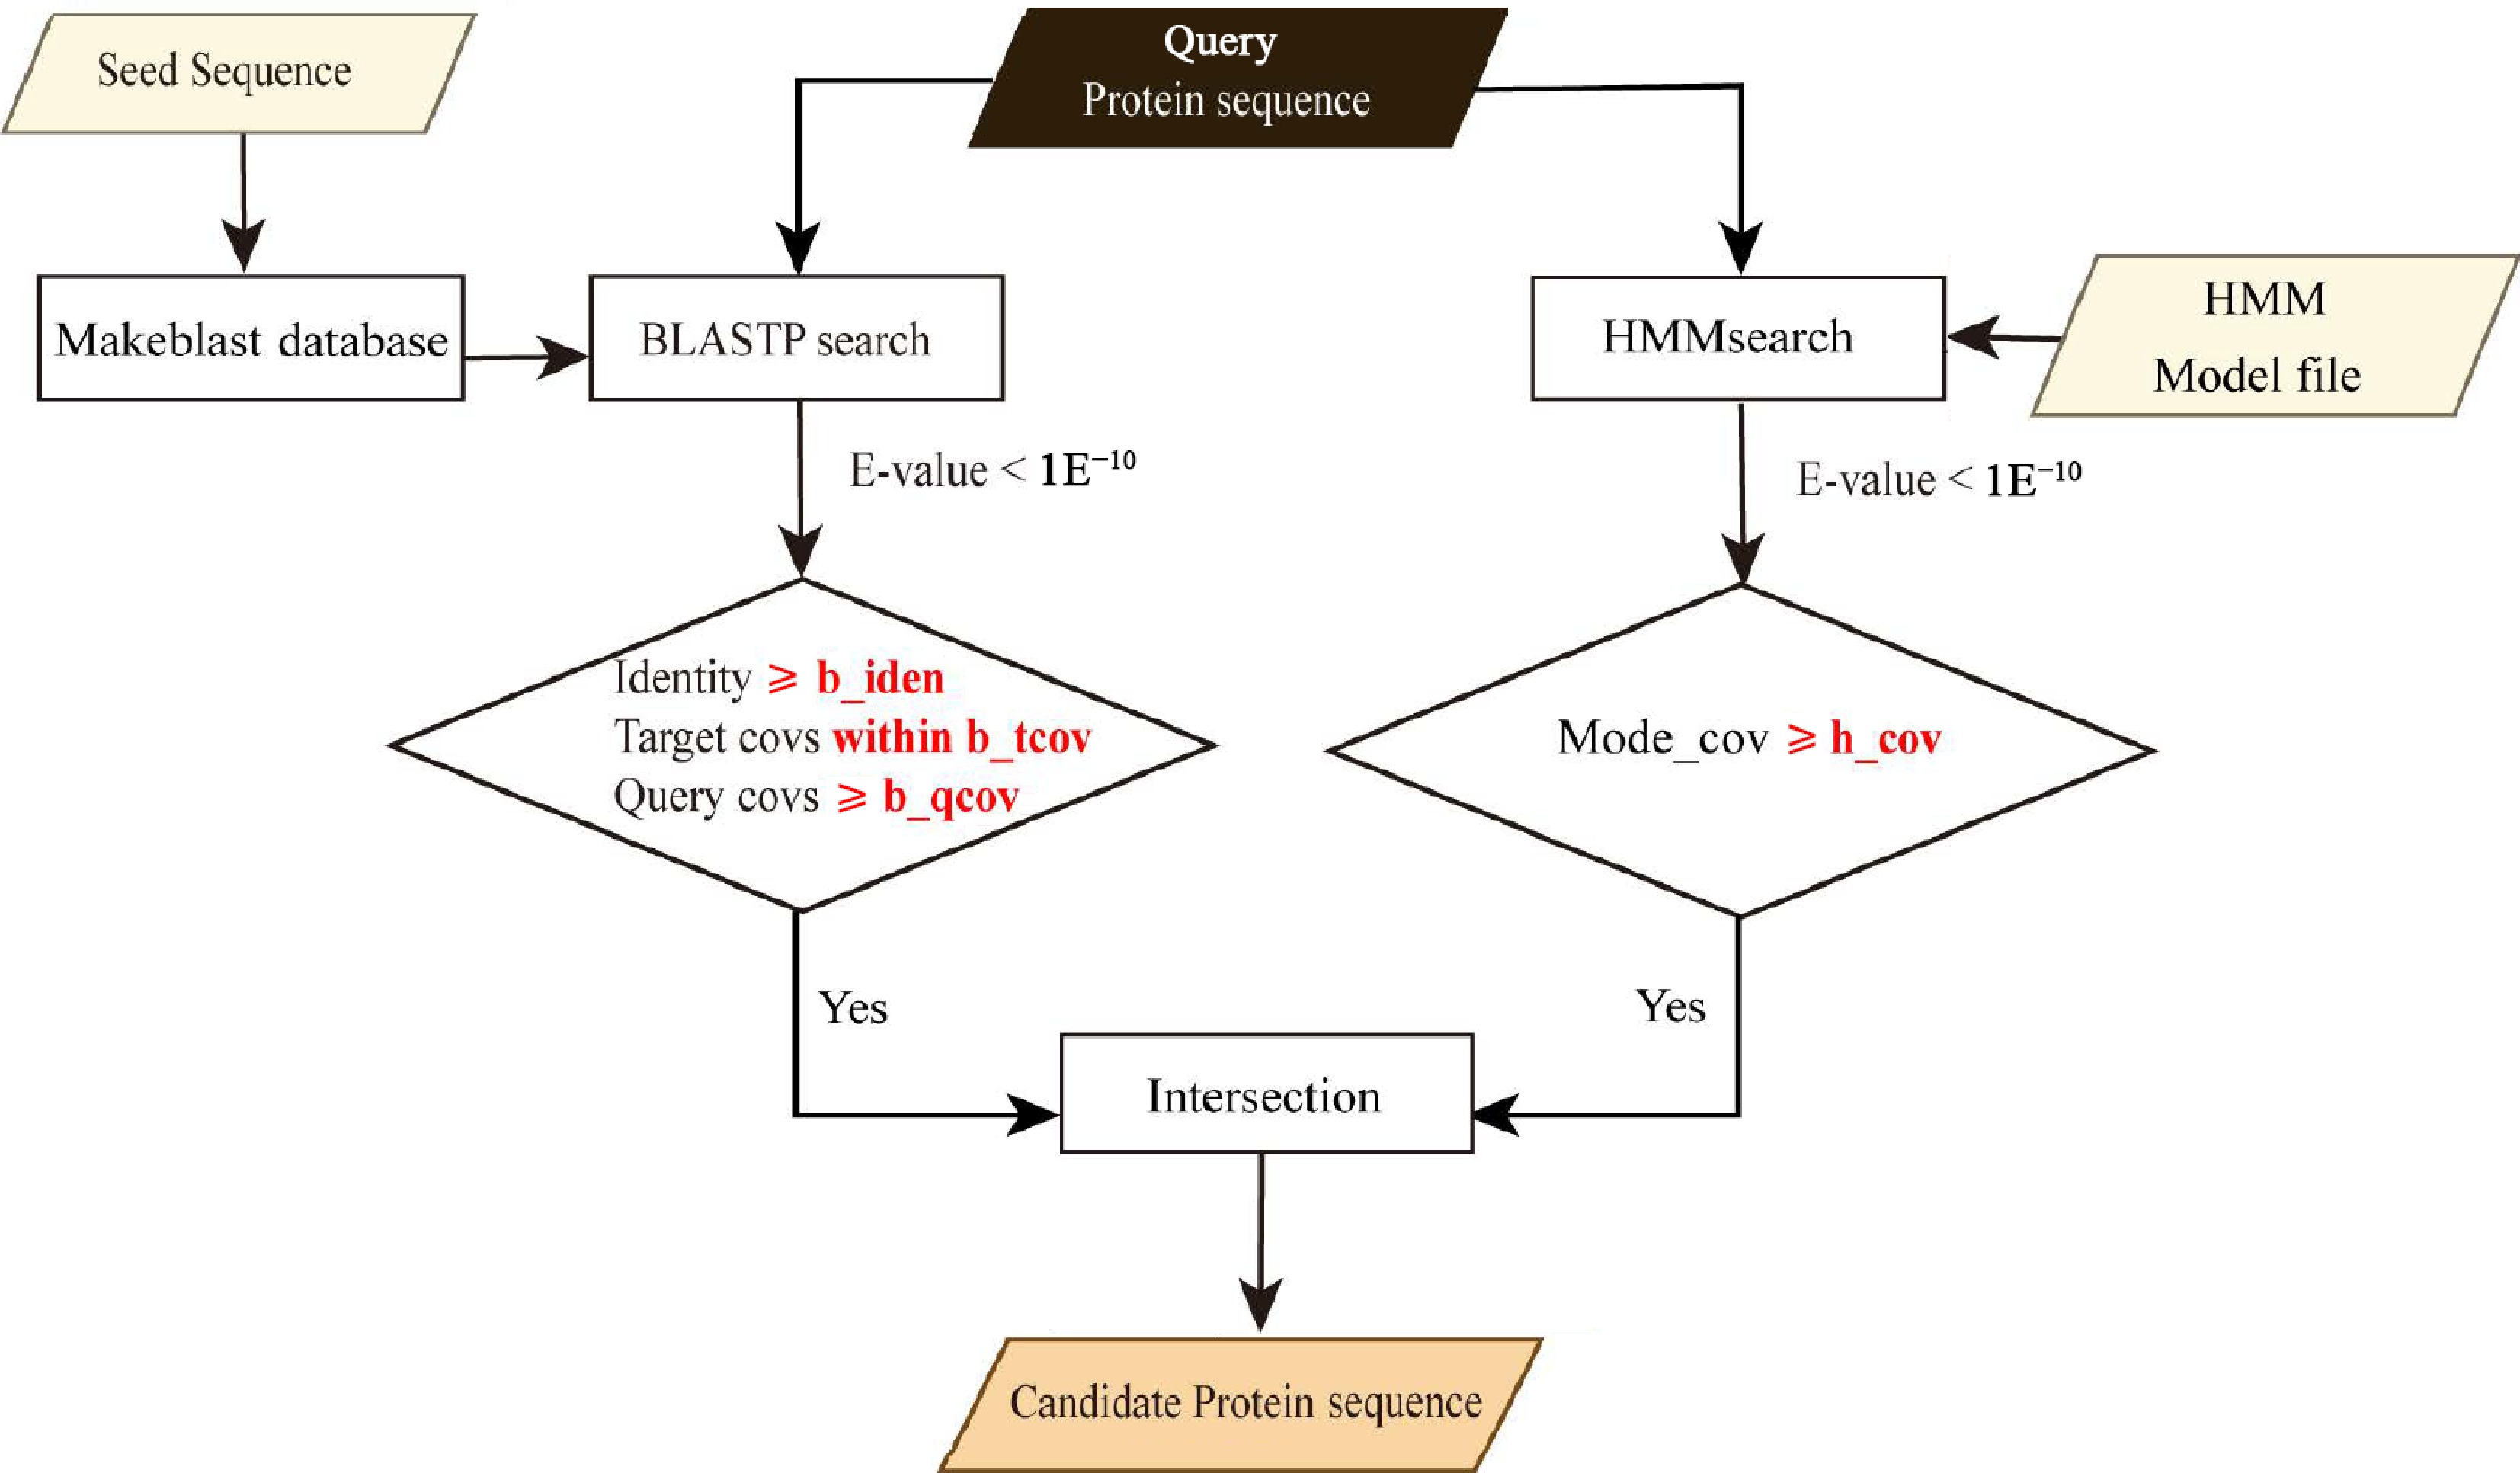
Figure 1.
Workflow of GFAnno. The local of 'seed sequence' file, 'HMM Model file' and the values of parameters (b_iden, b_qcov, b_tcov, and h_cov) were obtained from the config file.
-
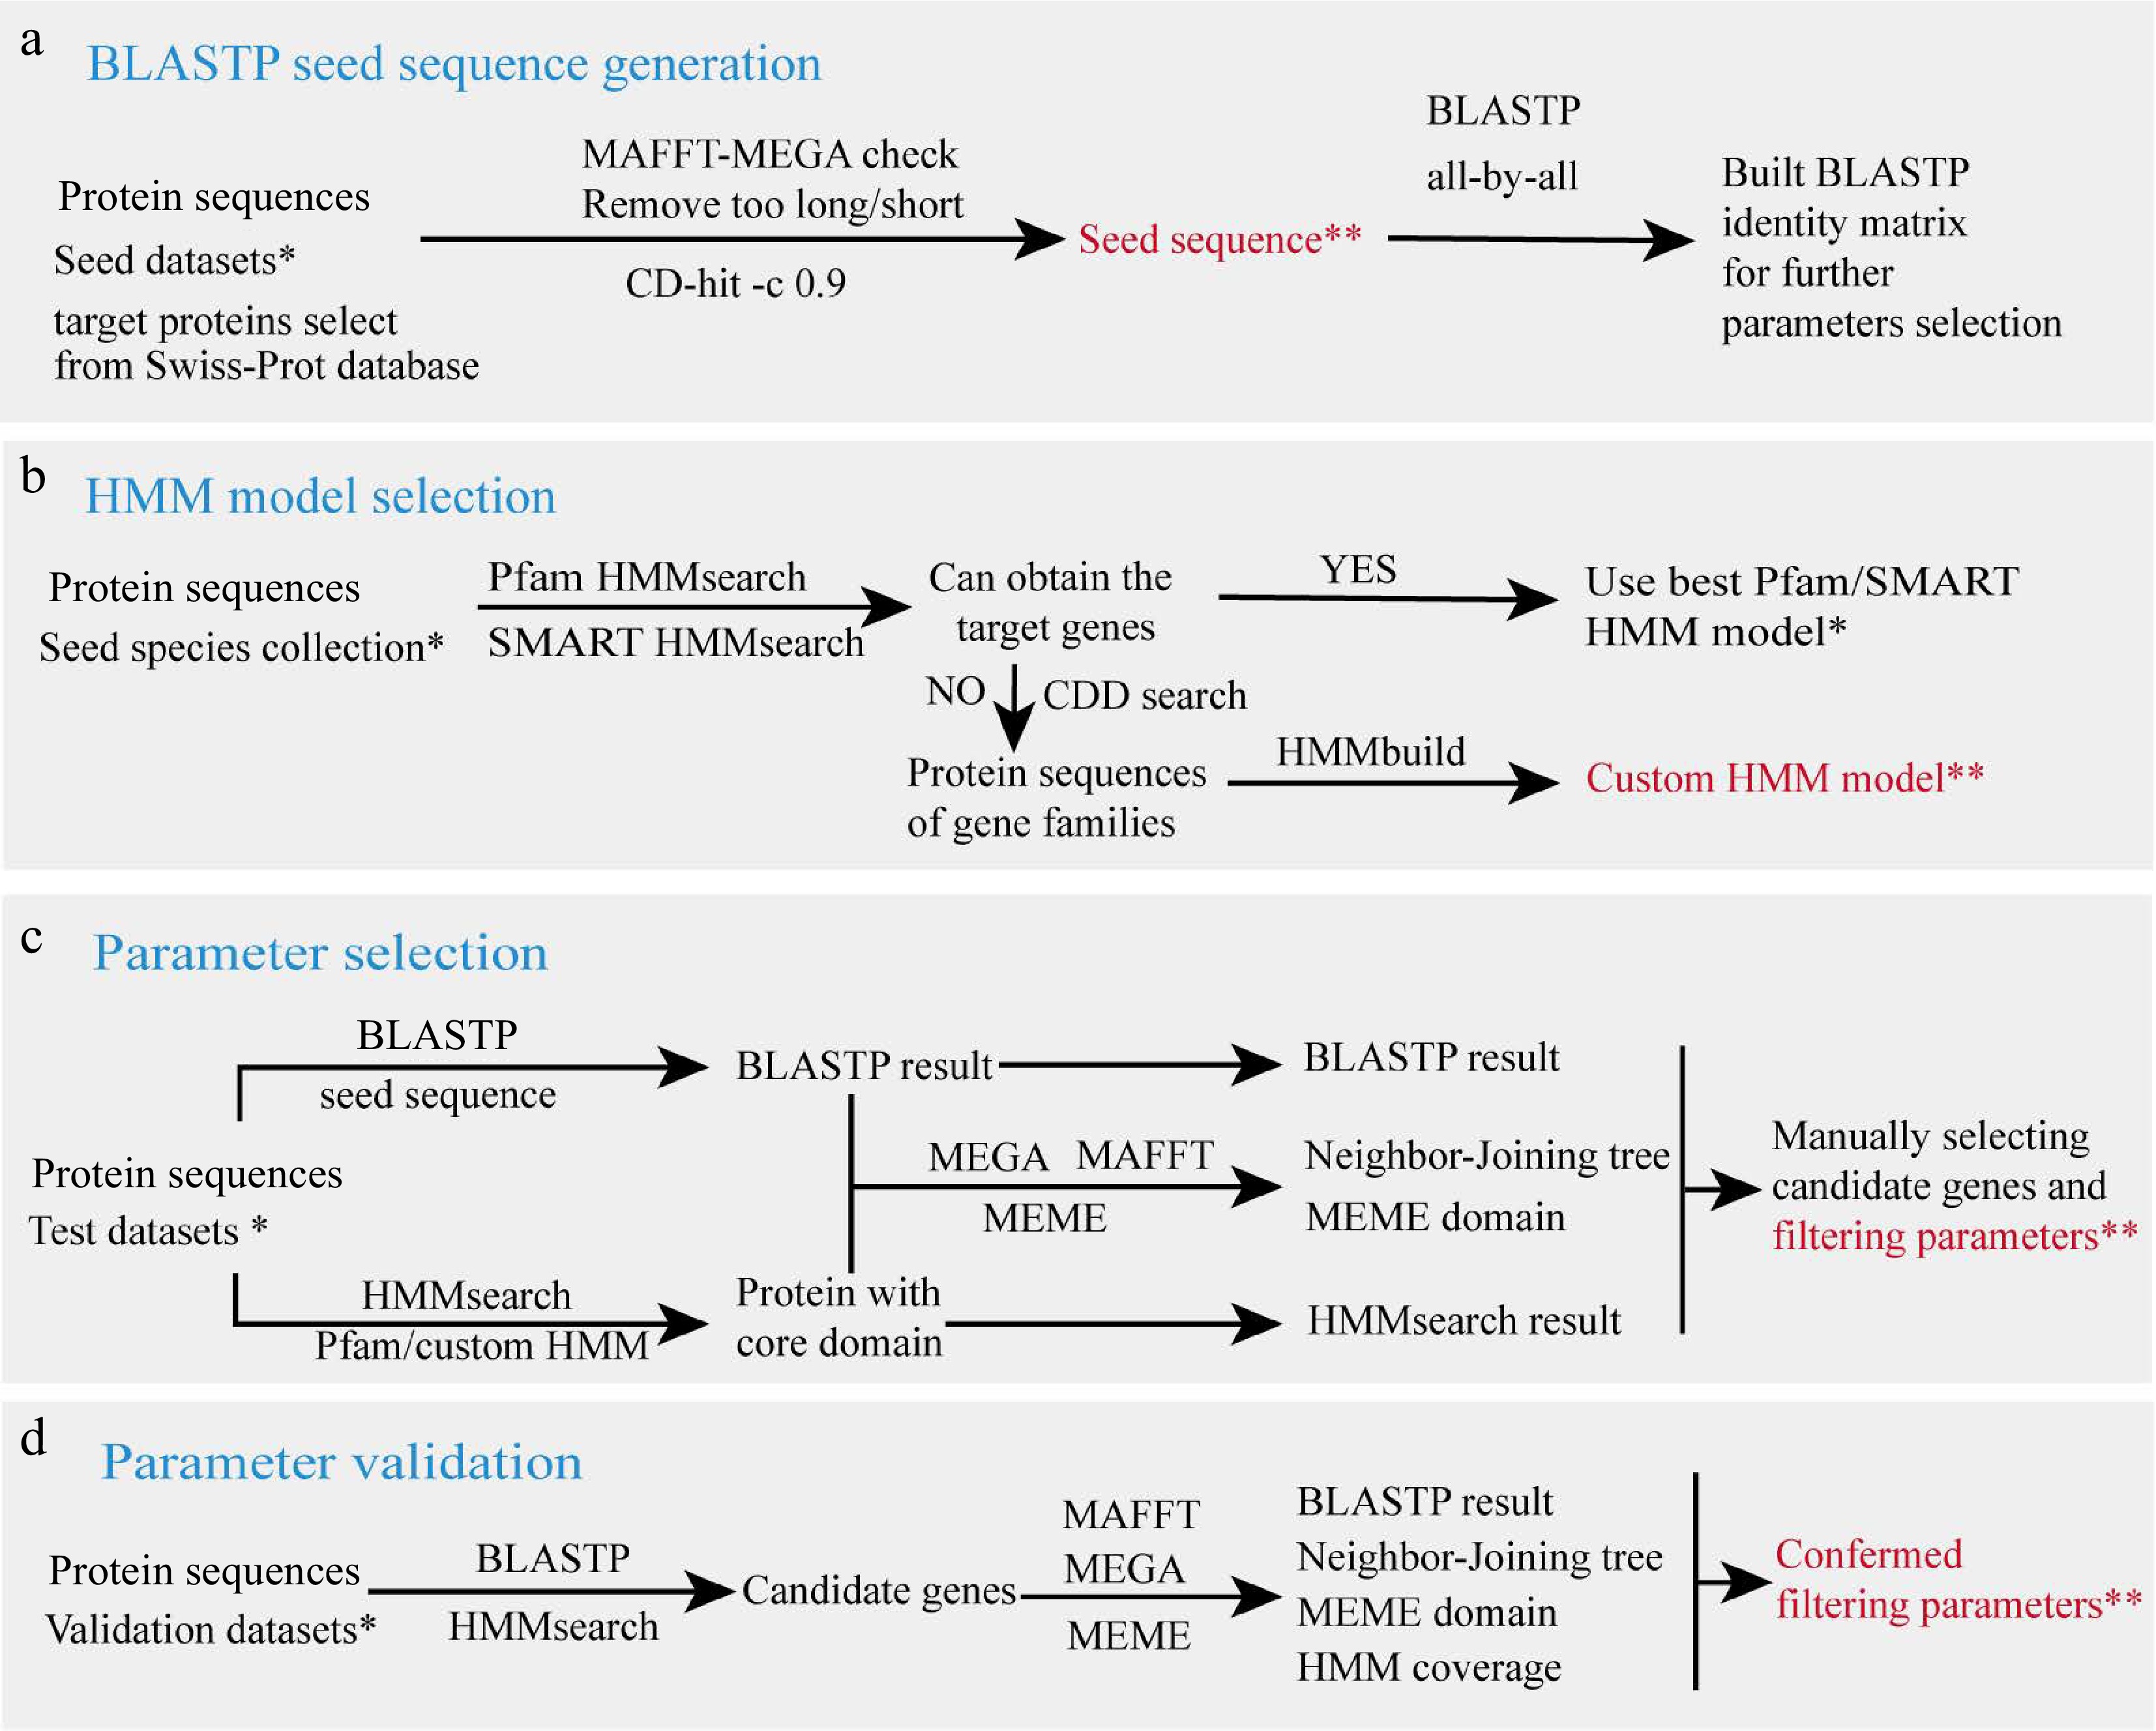
Figure 2.
Parameter filtering workflow. (a) BLASTP seed sequence generation. (b) HMM model selection. (c) Parameter selection. (d) Parameter validation. Species collections in each step are marked with a single asterisk (*), and output data is marked with double asterisks (**), which are provided in github.
-
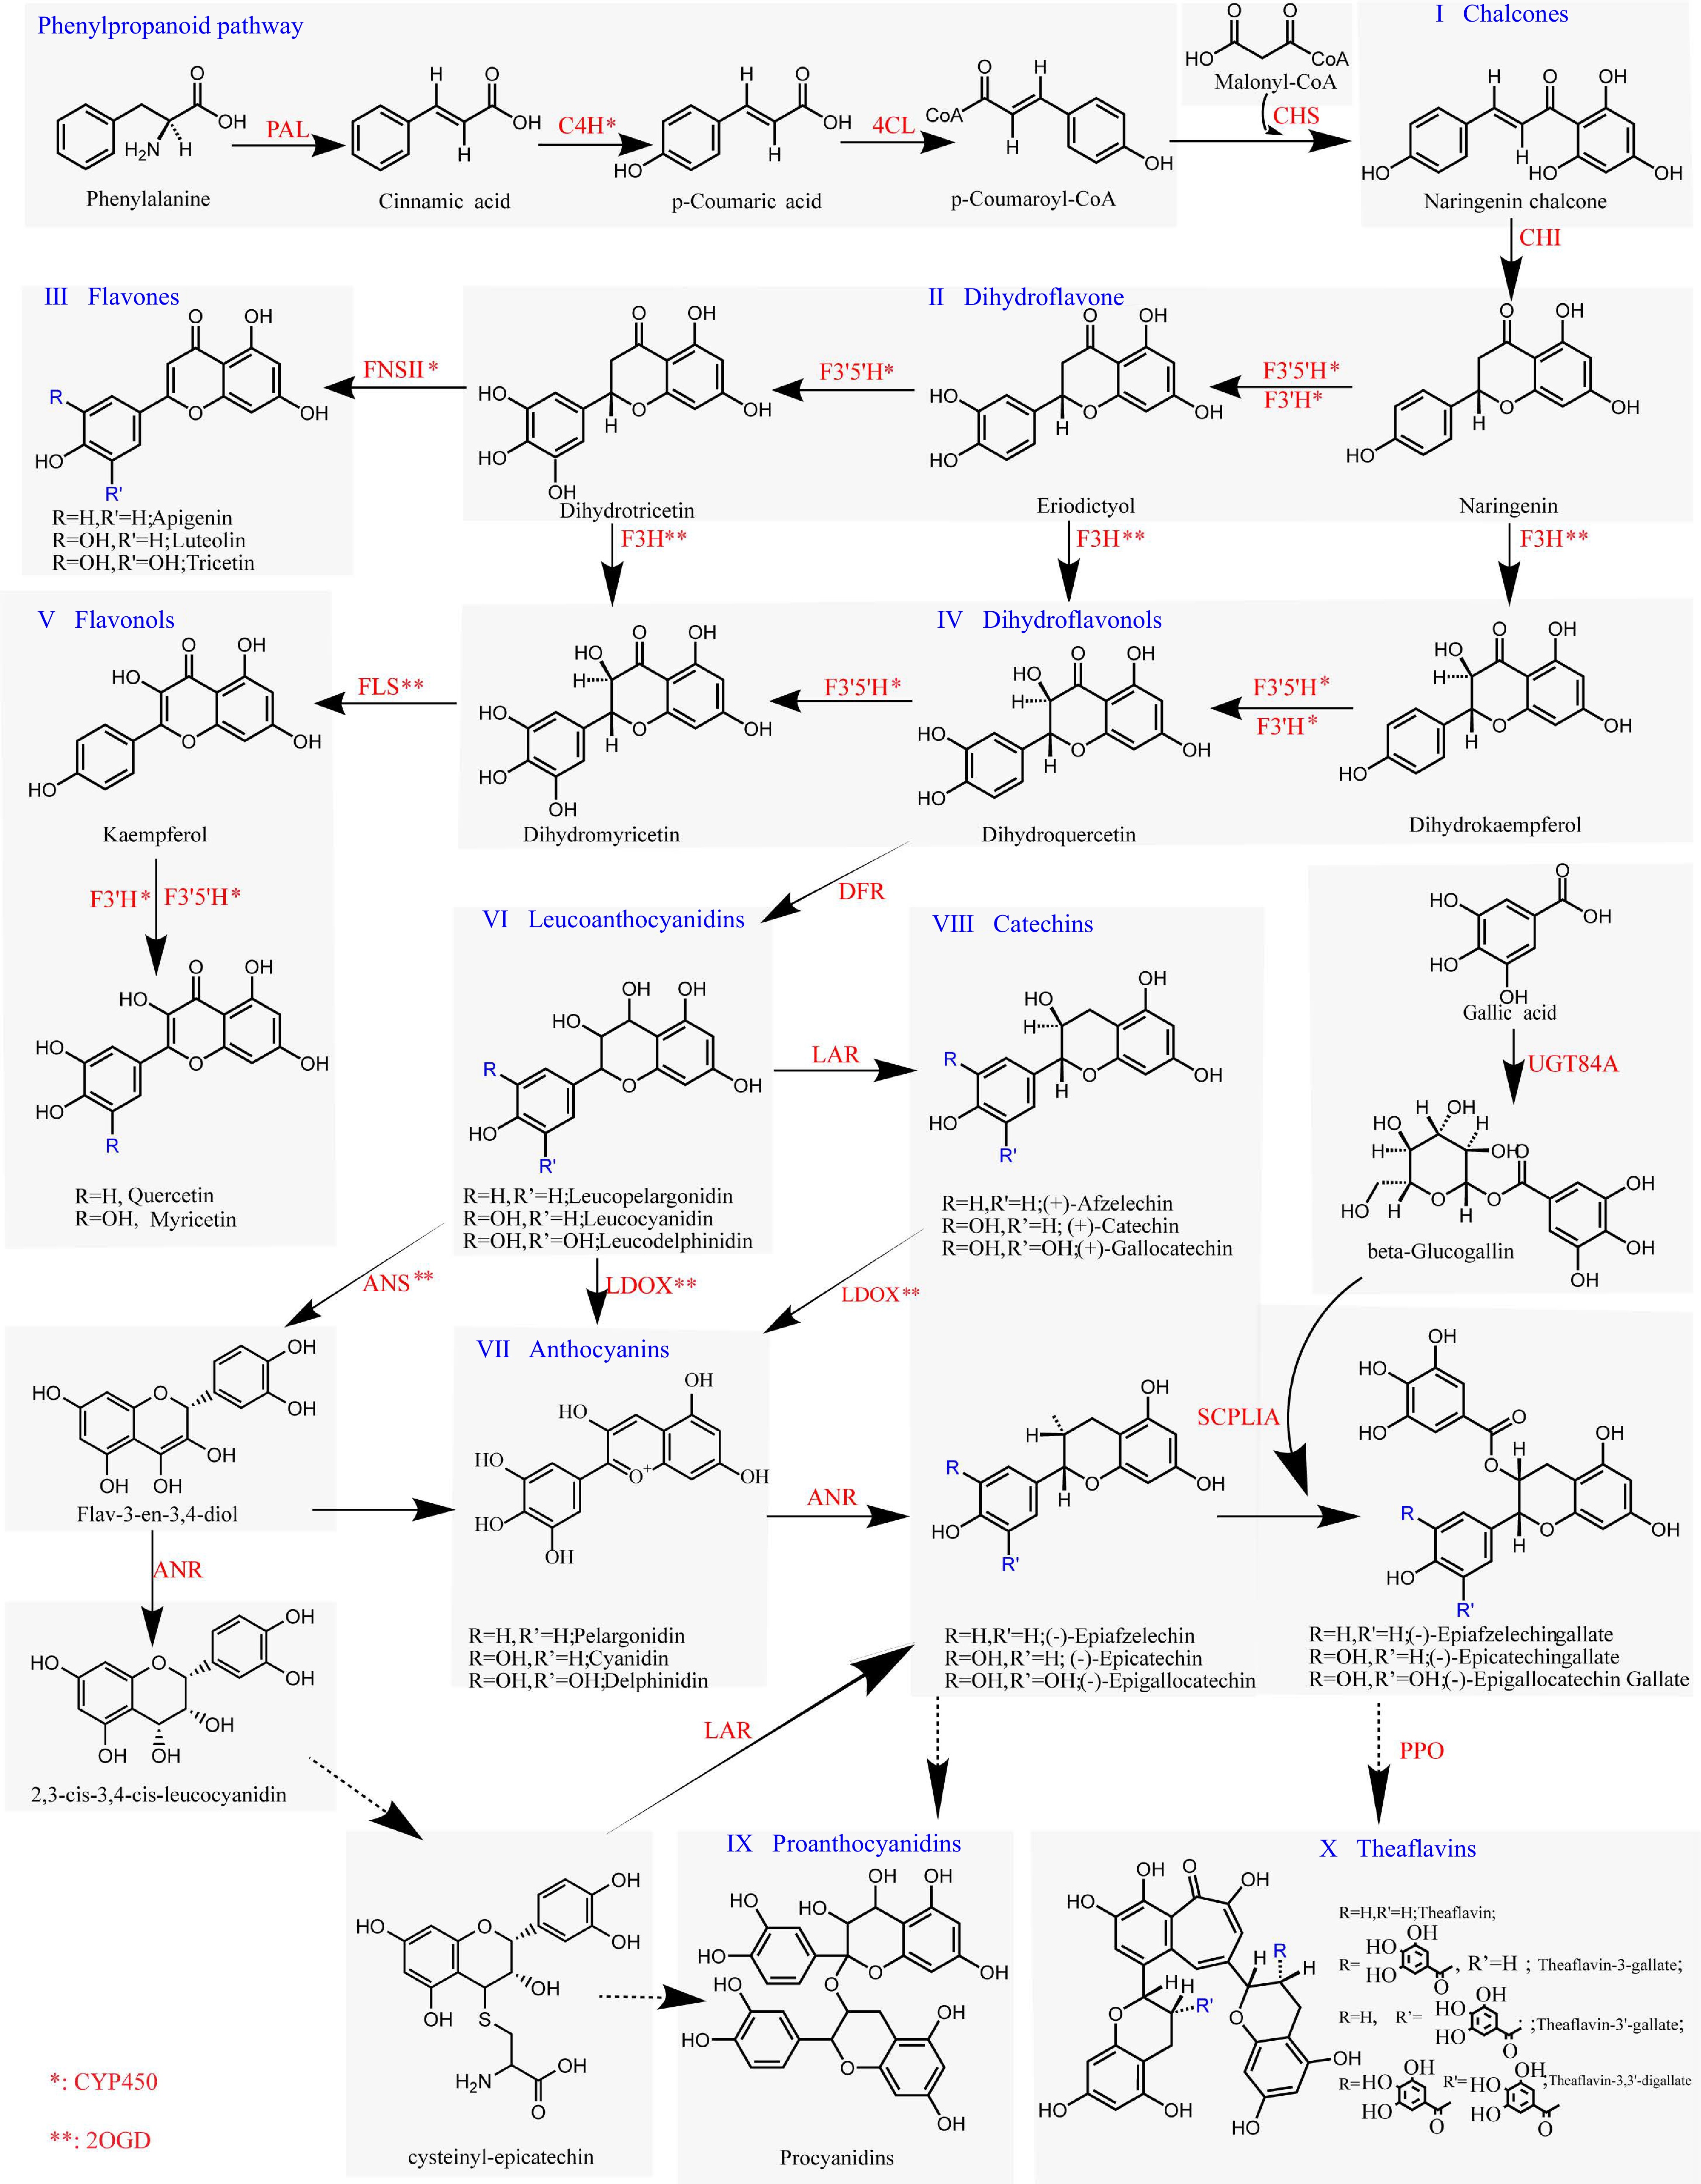
Figure 3.
Plant flavonoid biosynthesis pathway. Enzymes labeled with '*' indicate members of CYP450s, whereas genes labeled with '**' represent members of 2OGDs. Solid-line arrows indicate well-established mechanisms for the corresponding enzymatic reactions, and dashed-line arrows represent pathways where the mechanistic details are yet to be fully determined.
-
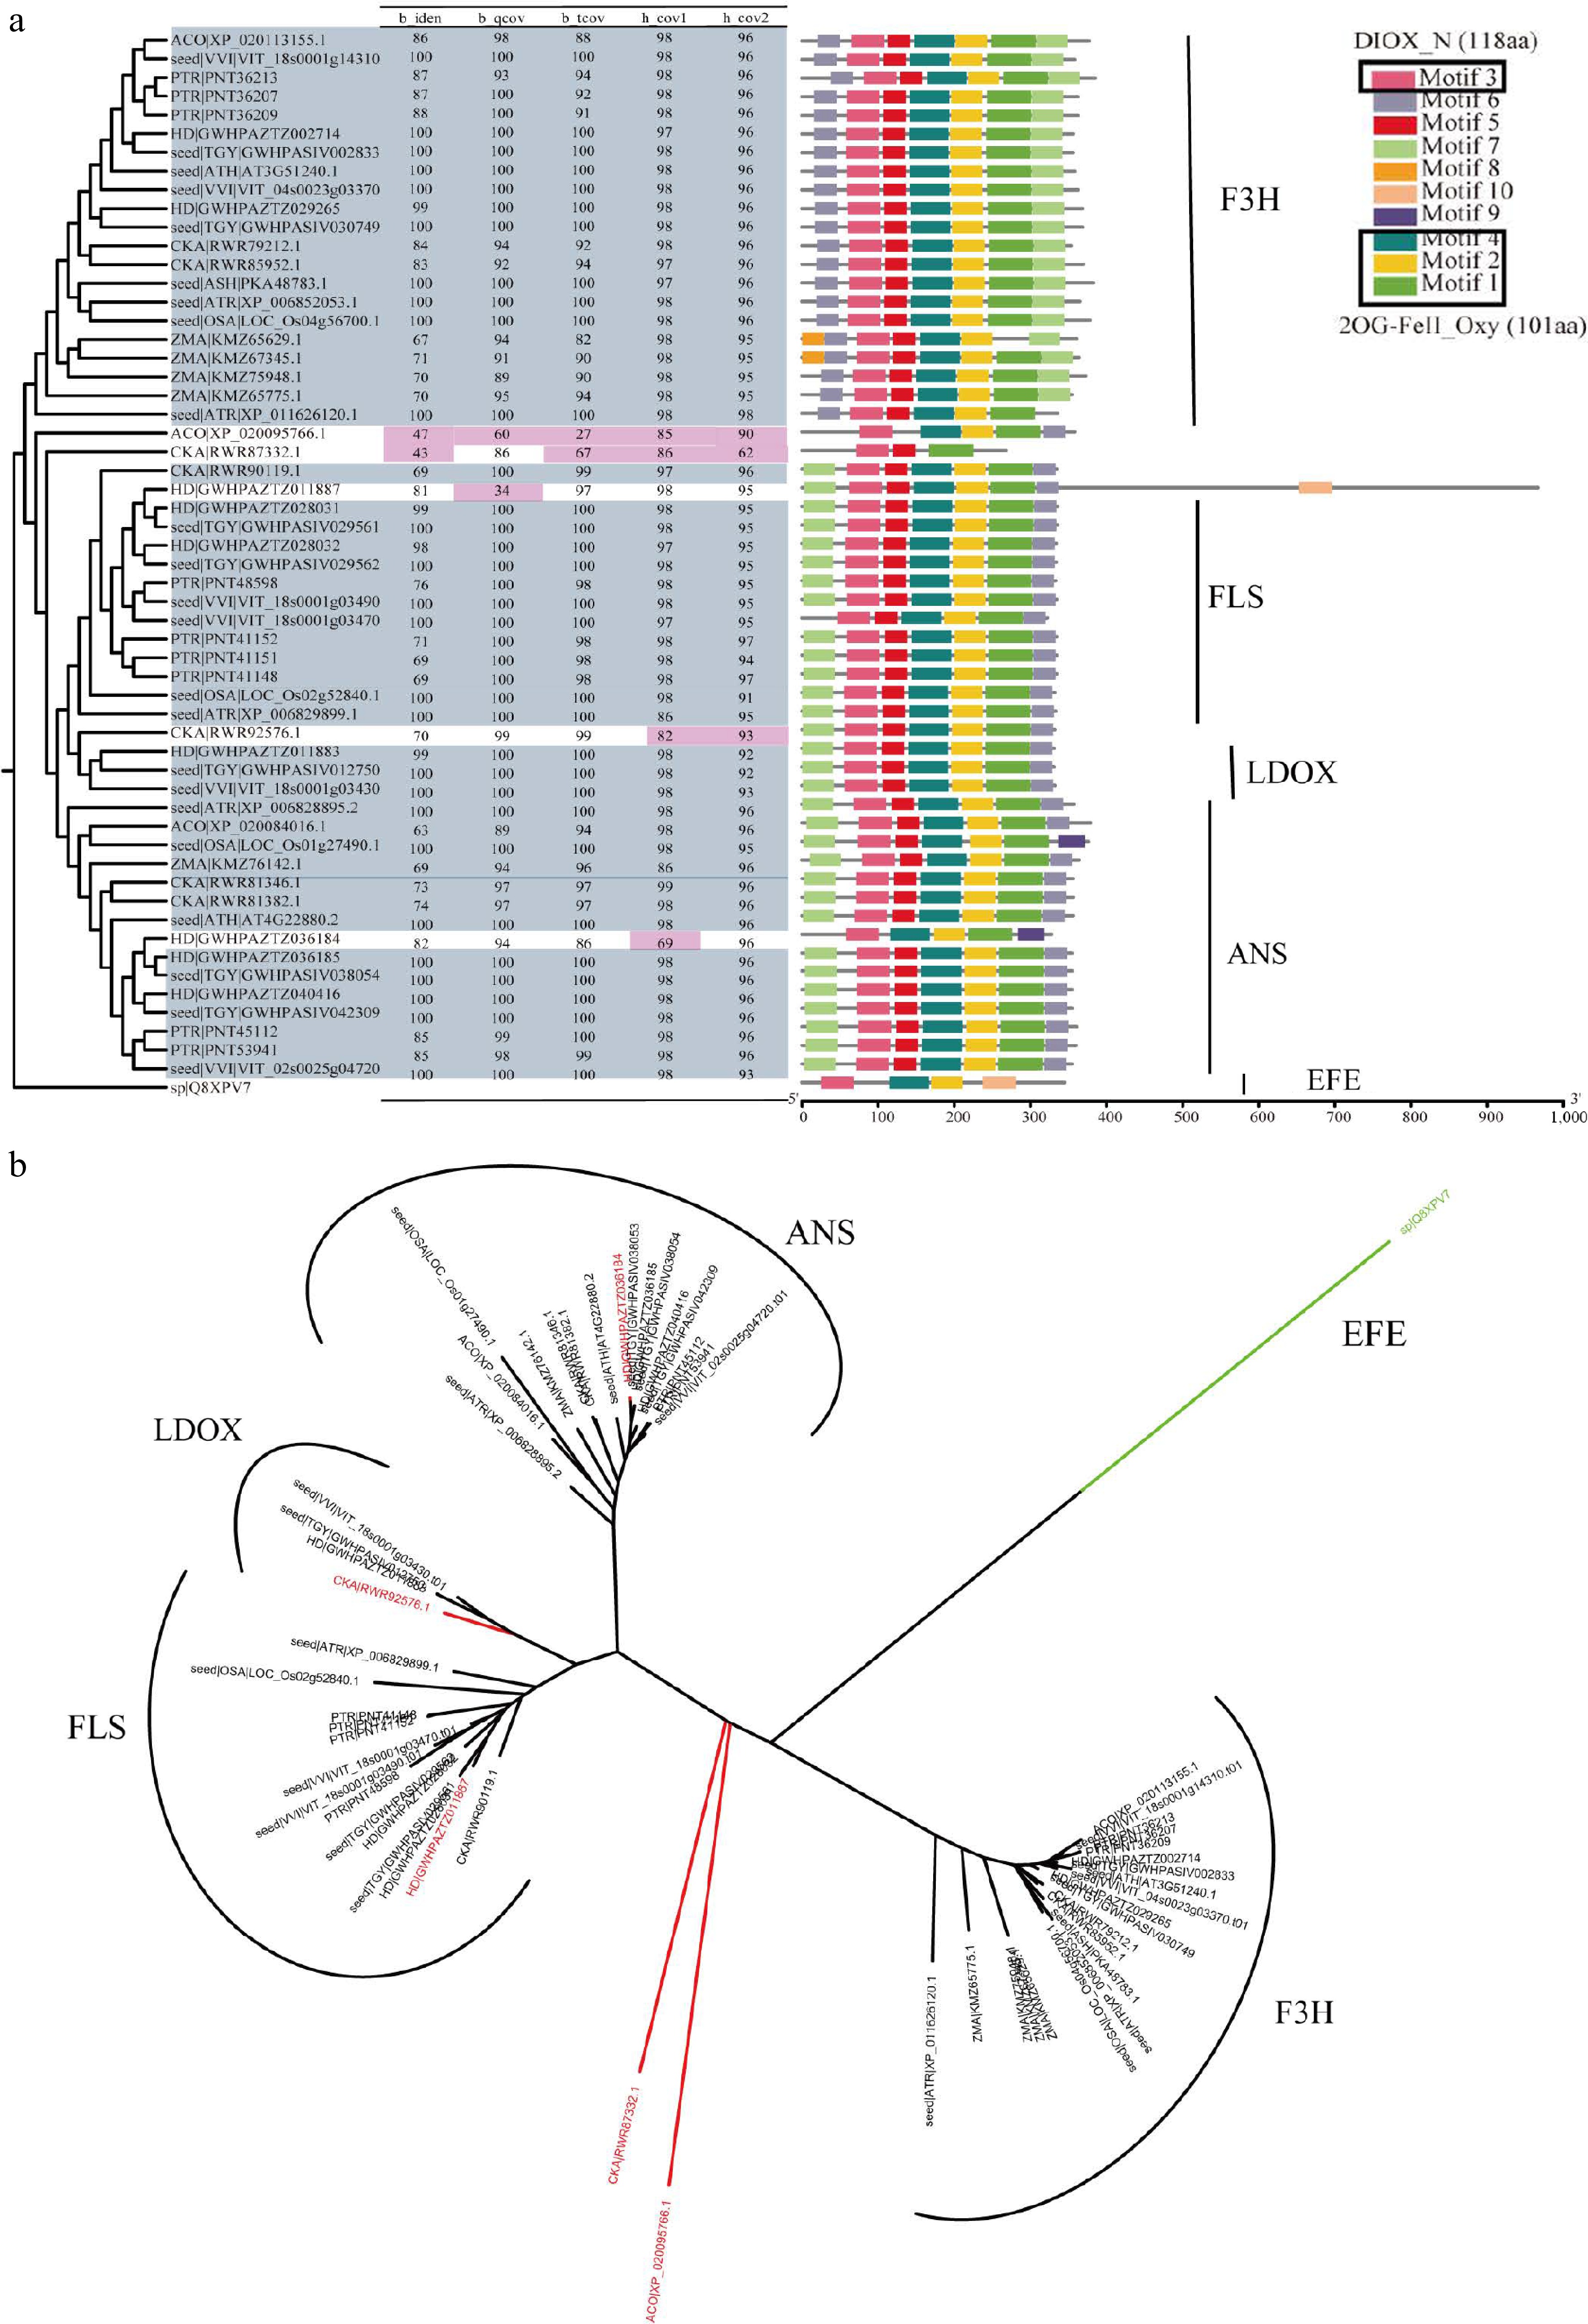
Figure 4.
Overview of F3H, ANS, LDOX, and FLS in 2OGD superfamily. (a) The parameter selection for candidate genes in F3H, ANS, LDOX, and FLS. The phylogenetic tree, four parameters, and conservation module diagram to illustrate the selection process. In the phylogenetic tree, genes selected for are represented in blue-gray, while parameters that have been excluded are marked in red. The conserved domains were created using MEME[21], and the HMM models used in HMMsearch are outlined in black boxes, with the model length displayed in parentheses following the model's name. (b) Neighbor join tree shows the distance relationships between four genes.
-
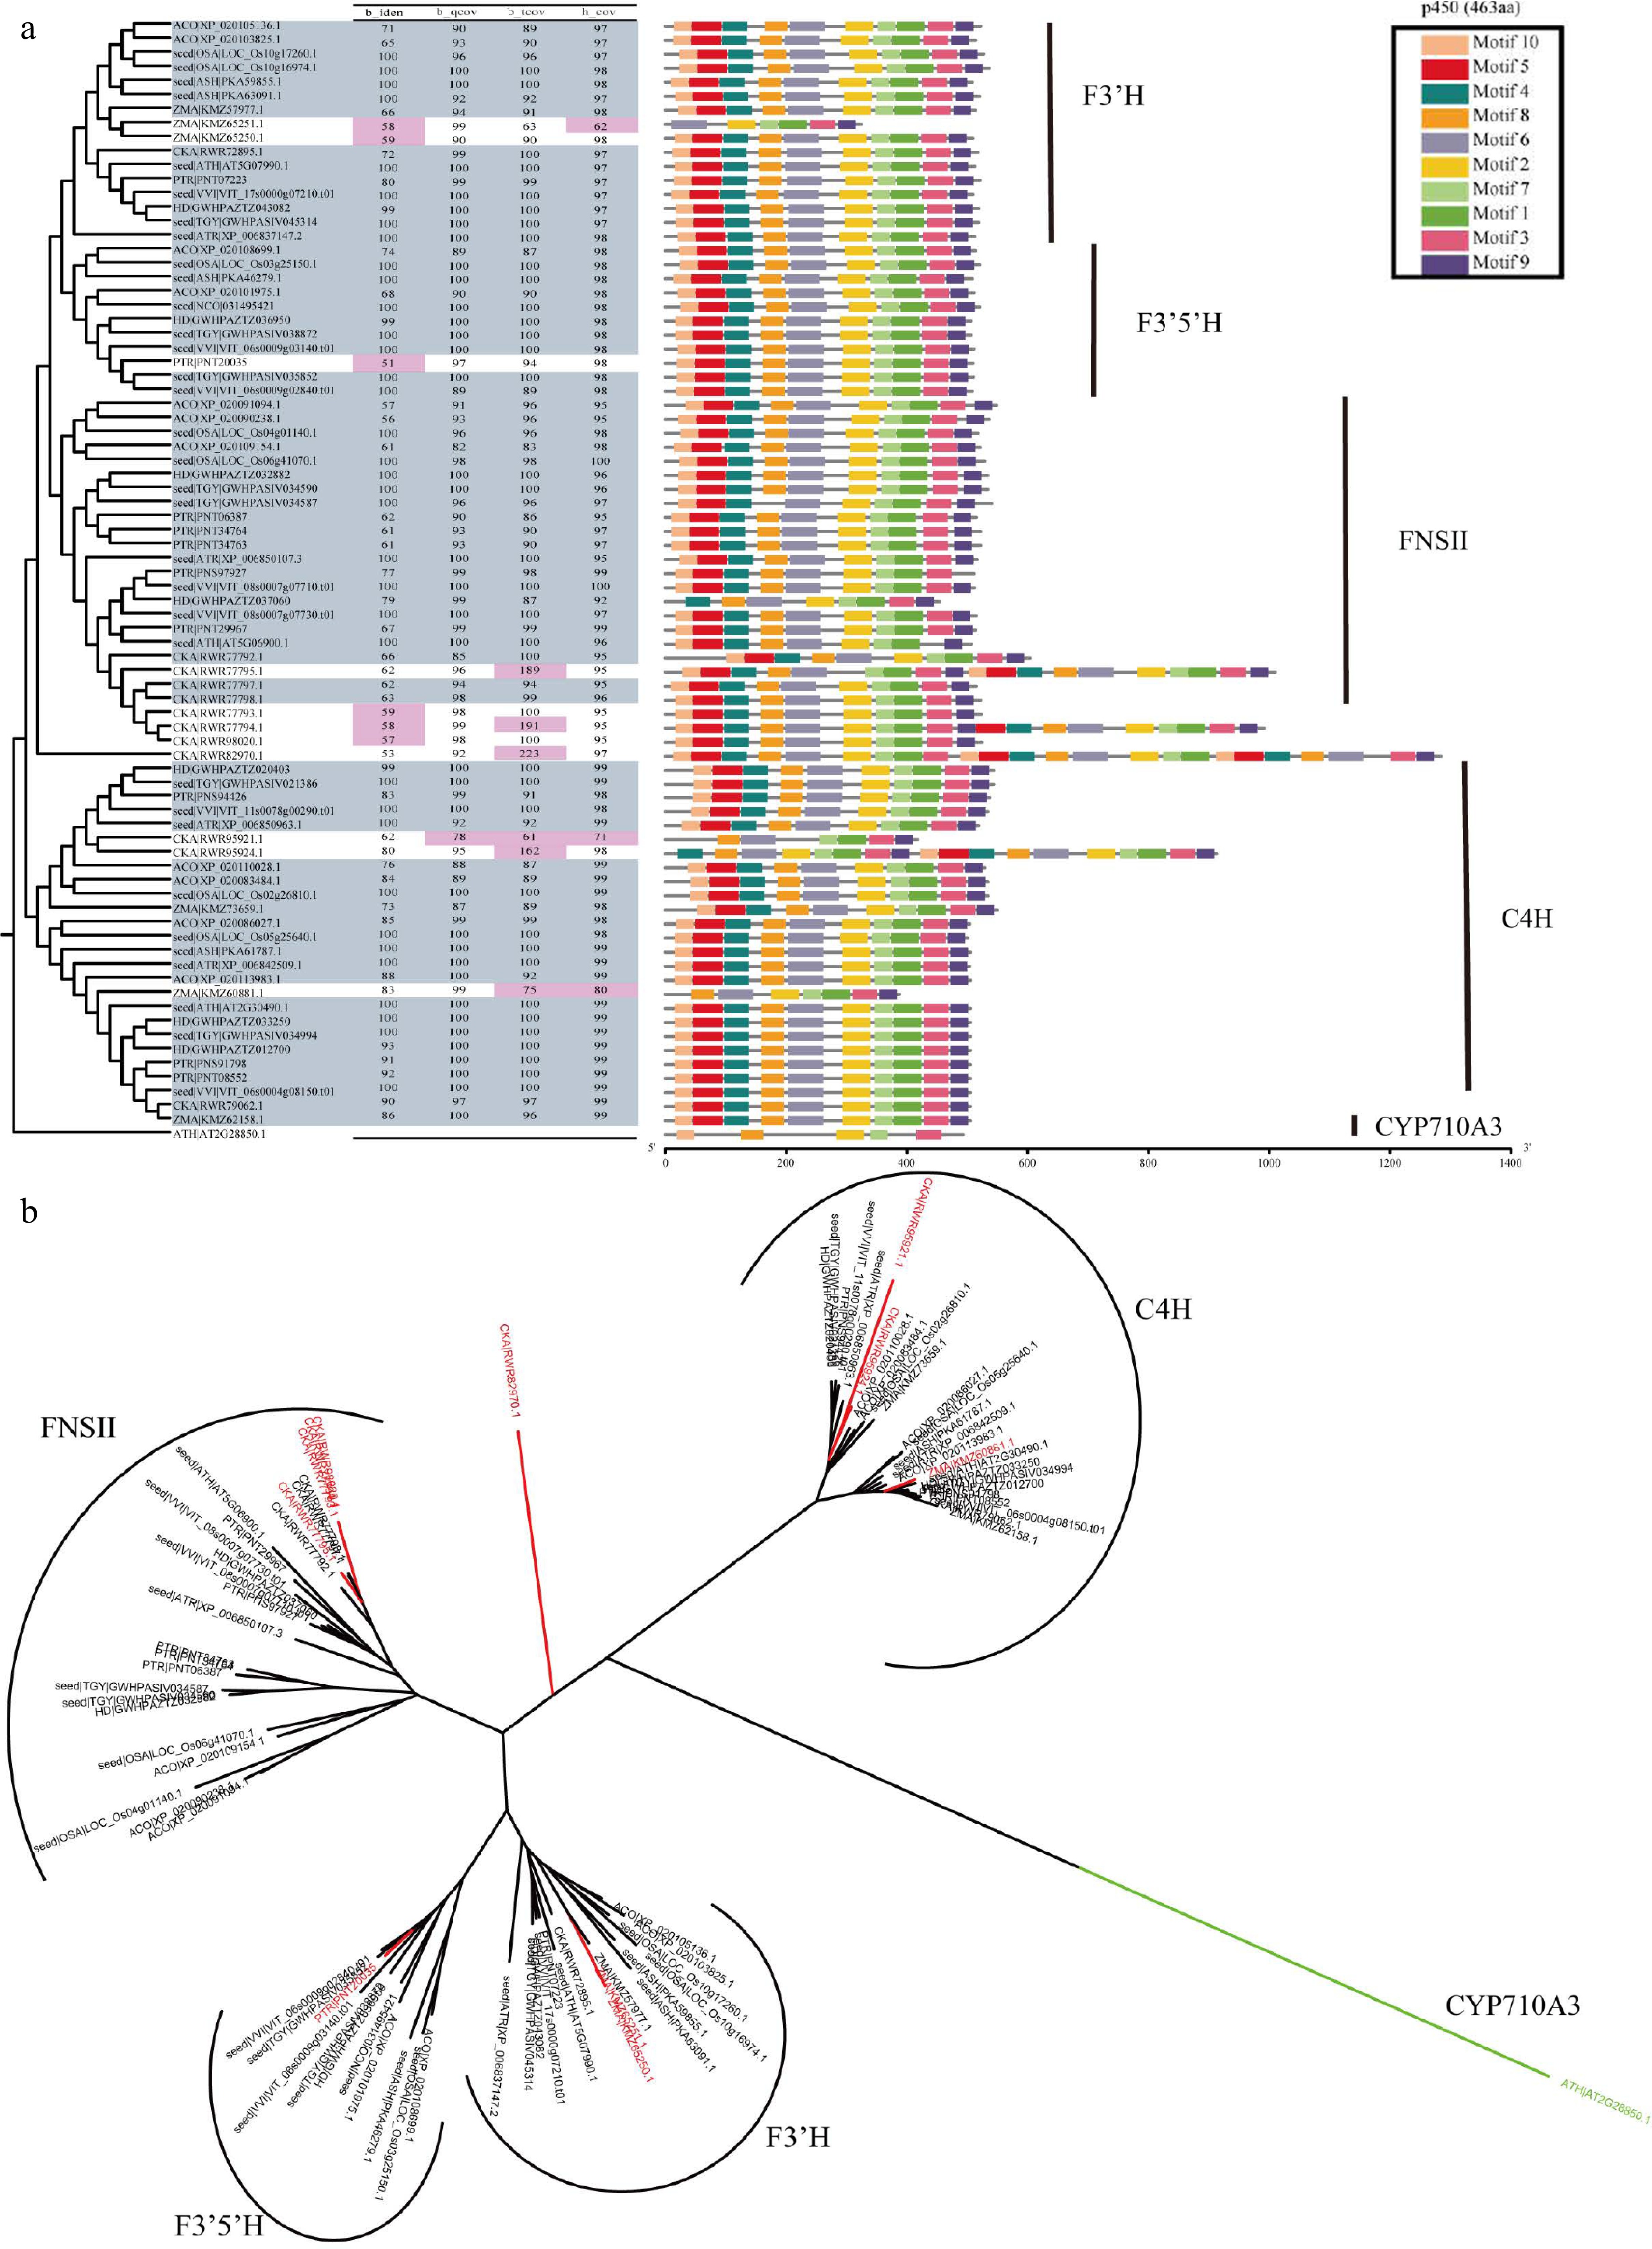
Figure 5.
Overview of F3'H, F3'5'H, FNSII and C4H in CYP450 superfamily. (a) The parameter selection for candidate genes. The phylogenetic tree, four parameters, and conservation module diagram to illustrate the selection process. In the phylogenetic tree, genes selected for are represented in blue-gray, while parameters that have been excluded are marked in red. The conserved domains were created using MEME[21], and the HMM models used in HMMsearch are outlined in black boxes, with the model length displayed in parentheses following the model's name. (b) Neighbor join tree shows the distance relationships between four genes.
-
Enzyme HMM/CDD ID Parameter setting b_iden b_qcov b_tcov h_cov 4CL PF13193.6 (AMP-binding_C)
PF00501(AMP-binding)40 70 60−120 90/90 CHI PF02431.15 (Chalcone) 35 70 70−130 90 CHS PF02797.15 (Chal_sti_synt_C)
PF00195.19 (Chal_sti_synt_N)50 80 80−120 90/90 LAR PF05368.13 (NmrA) 30 65 80−120 90 PAL PF00221.19 (Lyase_aromatic) 60 80 80−120 90 PPO PF12142.8 (PPO1_DWL)
PF12143.8 (PPO1_KFDV)35 70 70−130 90/90 SCPL4* PF00450.22 (Peptidase_S10) 70 80 80−120 90 SCPL5* PF00450.22 (Peptidase_S10) 70 80 80−120 90 UGT84A cl10013 40 80 80−120 90 DFR PF01370.21 (Epimerase) 60 80 80−120 90 ANR 55 80 80−120 90 F3H PF03171.23 (2OG-FeII_Oxy)
PF14226.9 (DIOX_N)60 80 80−120 90/90 FLS 60 80 80−120 90/90 LDOX 50 80 80−120 90/90 ANS 60 80 80−120 90/90 F3'H PF00067.25 (p450) 50 80 80−120 90 F3'5'H 60 80 80−120 90 C4H 70 80 80−120 90 FNSII 50 80 80−120 90 * SCPL4, SCPL5 in SCPLIA[24]. 'b_iden' denotes the identity of BLASTP; 'b_qcov' represents the 'query coverage per HSP' of BLASTP, 'b_tcov' represents the 'target coverage per HSP' of BLAST, and 'h_covc' indicates the HMM coverage of HMMsearch. Table 1.
Files and parameters used for the annotation pipeline.
Figures
(5)
Tables
(1)