


-
The complexity of plant secondary metabolism poses major challenges for analyses in different species due to the evolution of multiple independent pathways. With the rapid development of third-generation sequencing, the era of pan-genomics has fully arrived, offering us new opportunities to study the diversity of secondary metabolites in plants. However, the classical annotation methods for superfamily, gene family, and multicopy genes are similar, but with different parameter settings. Extensive research is required to manually examine sequence features, such as sequence similarity and coverage, as well as enzyme catalytic domains, in order to determine the identification parameters for each target gene[1,2]. This can create analytical obstacles for researchers outside of the field.
Taking gene annotation in the flavonoid biosynthesis pathway of tea plants as an example. Flavonoids are an important class of biologically active secondary metabolites produced by tea plants[3]. In addition to their myriad of health benefits, flavonoids contribute to the enjoyable flavors and overall sensory experience of tea. The flavonoid pathway is complex, involving a wide array of enzymes, which generates diverse metabolites. In tea plants, the copy number of key genes involved in flavonoid biosynthesis differs significantly among different tea genomes[4−6]. Annotation of the same genome using different tools and parameters often results in different gene numbers. For instance, we used Orthofinder[7] and utilized BLASTP[8] and HMMsearch[9] to annotate the C. sinensis genomes 'Shuchazao' (SCZ) and 'Yunkang10' (YK10) in two different studies and received different results[4, 6]. In addition, errors often occur when distinguishing multi-copy genes with very similar sequences within the same gene family. For example, the cytochrome P450 (CYP450, which includes Flavonoid 3'-Hydroxylase (F3'H), Flavonoid 3'5'-Hydroxylase (F3'5'H), Flavone Synthase II (FNSII), and Trans-cinnamate 4-Monooxygenase (C4H)) and the 2-oxoglutarate-dependent dioxygenase (2OGDs, which includes Flavanone 3-Dioxygenase (F3H), Anthocyanidin Synthase (ANS), Leucoanthocyanidin Dioxygenase (LDOX) and Flavonol Synthase (FLS)) superfamilies participate in multiple oxidation and hydroxylation reactions within the flavonoid biosynthesis pathway, leading to the production of various flavonoid compounds[10−13]. F3'H and F3'5'H, which hydroxylate a broad range of flavonoid substrates, are characterized by a high sequence similarity (Supplemental Fig. S1)[10−12]. Therefore, it is necessary to use precise annotation parameters for the accurate identification of different gene copies within these families to avoid false-positive or false-negative annotation results.
Here, we present 'GFAnno,' an open-source software package that integrates the workflow based on sequence similarity and conserved domain analysis into a single package. We used three dicots, two monocots, and a basal angiosperm species to generate the seed sequence, provide strict filtered and doubled checked parameters, allowing researchers to obtain annotations and classifications for the 18 key genes in the plant flavonoid biosynthesis pathway with just one command. Furthermore, this paper offers a parameter selection process and guidelines for creating parameters for the identification of other target genes, enhancing the applicability and scalability of this workflow.
-
We offer an open-source software package 'GFAnno' to annotate genes and gene families based on sequence features. GFAnno consists of a standalone command line program written in Python which runs on most Linux systems, which are freely available at https://github.com/qunjie-zhang/gfanno.
The GFAnno flowchart is summarized in Fig. 1. 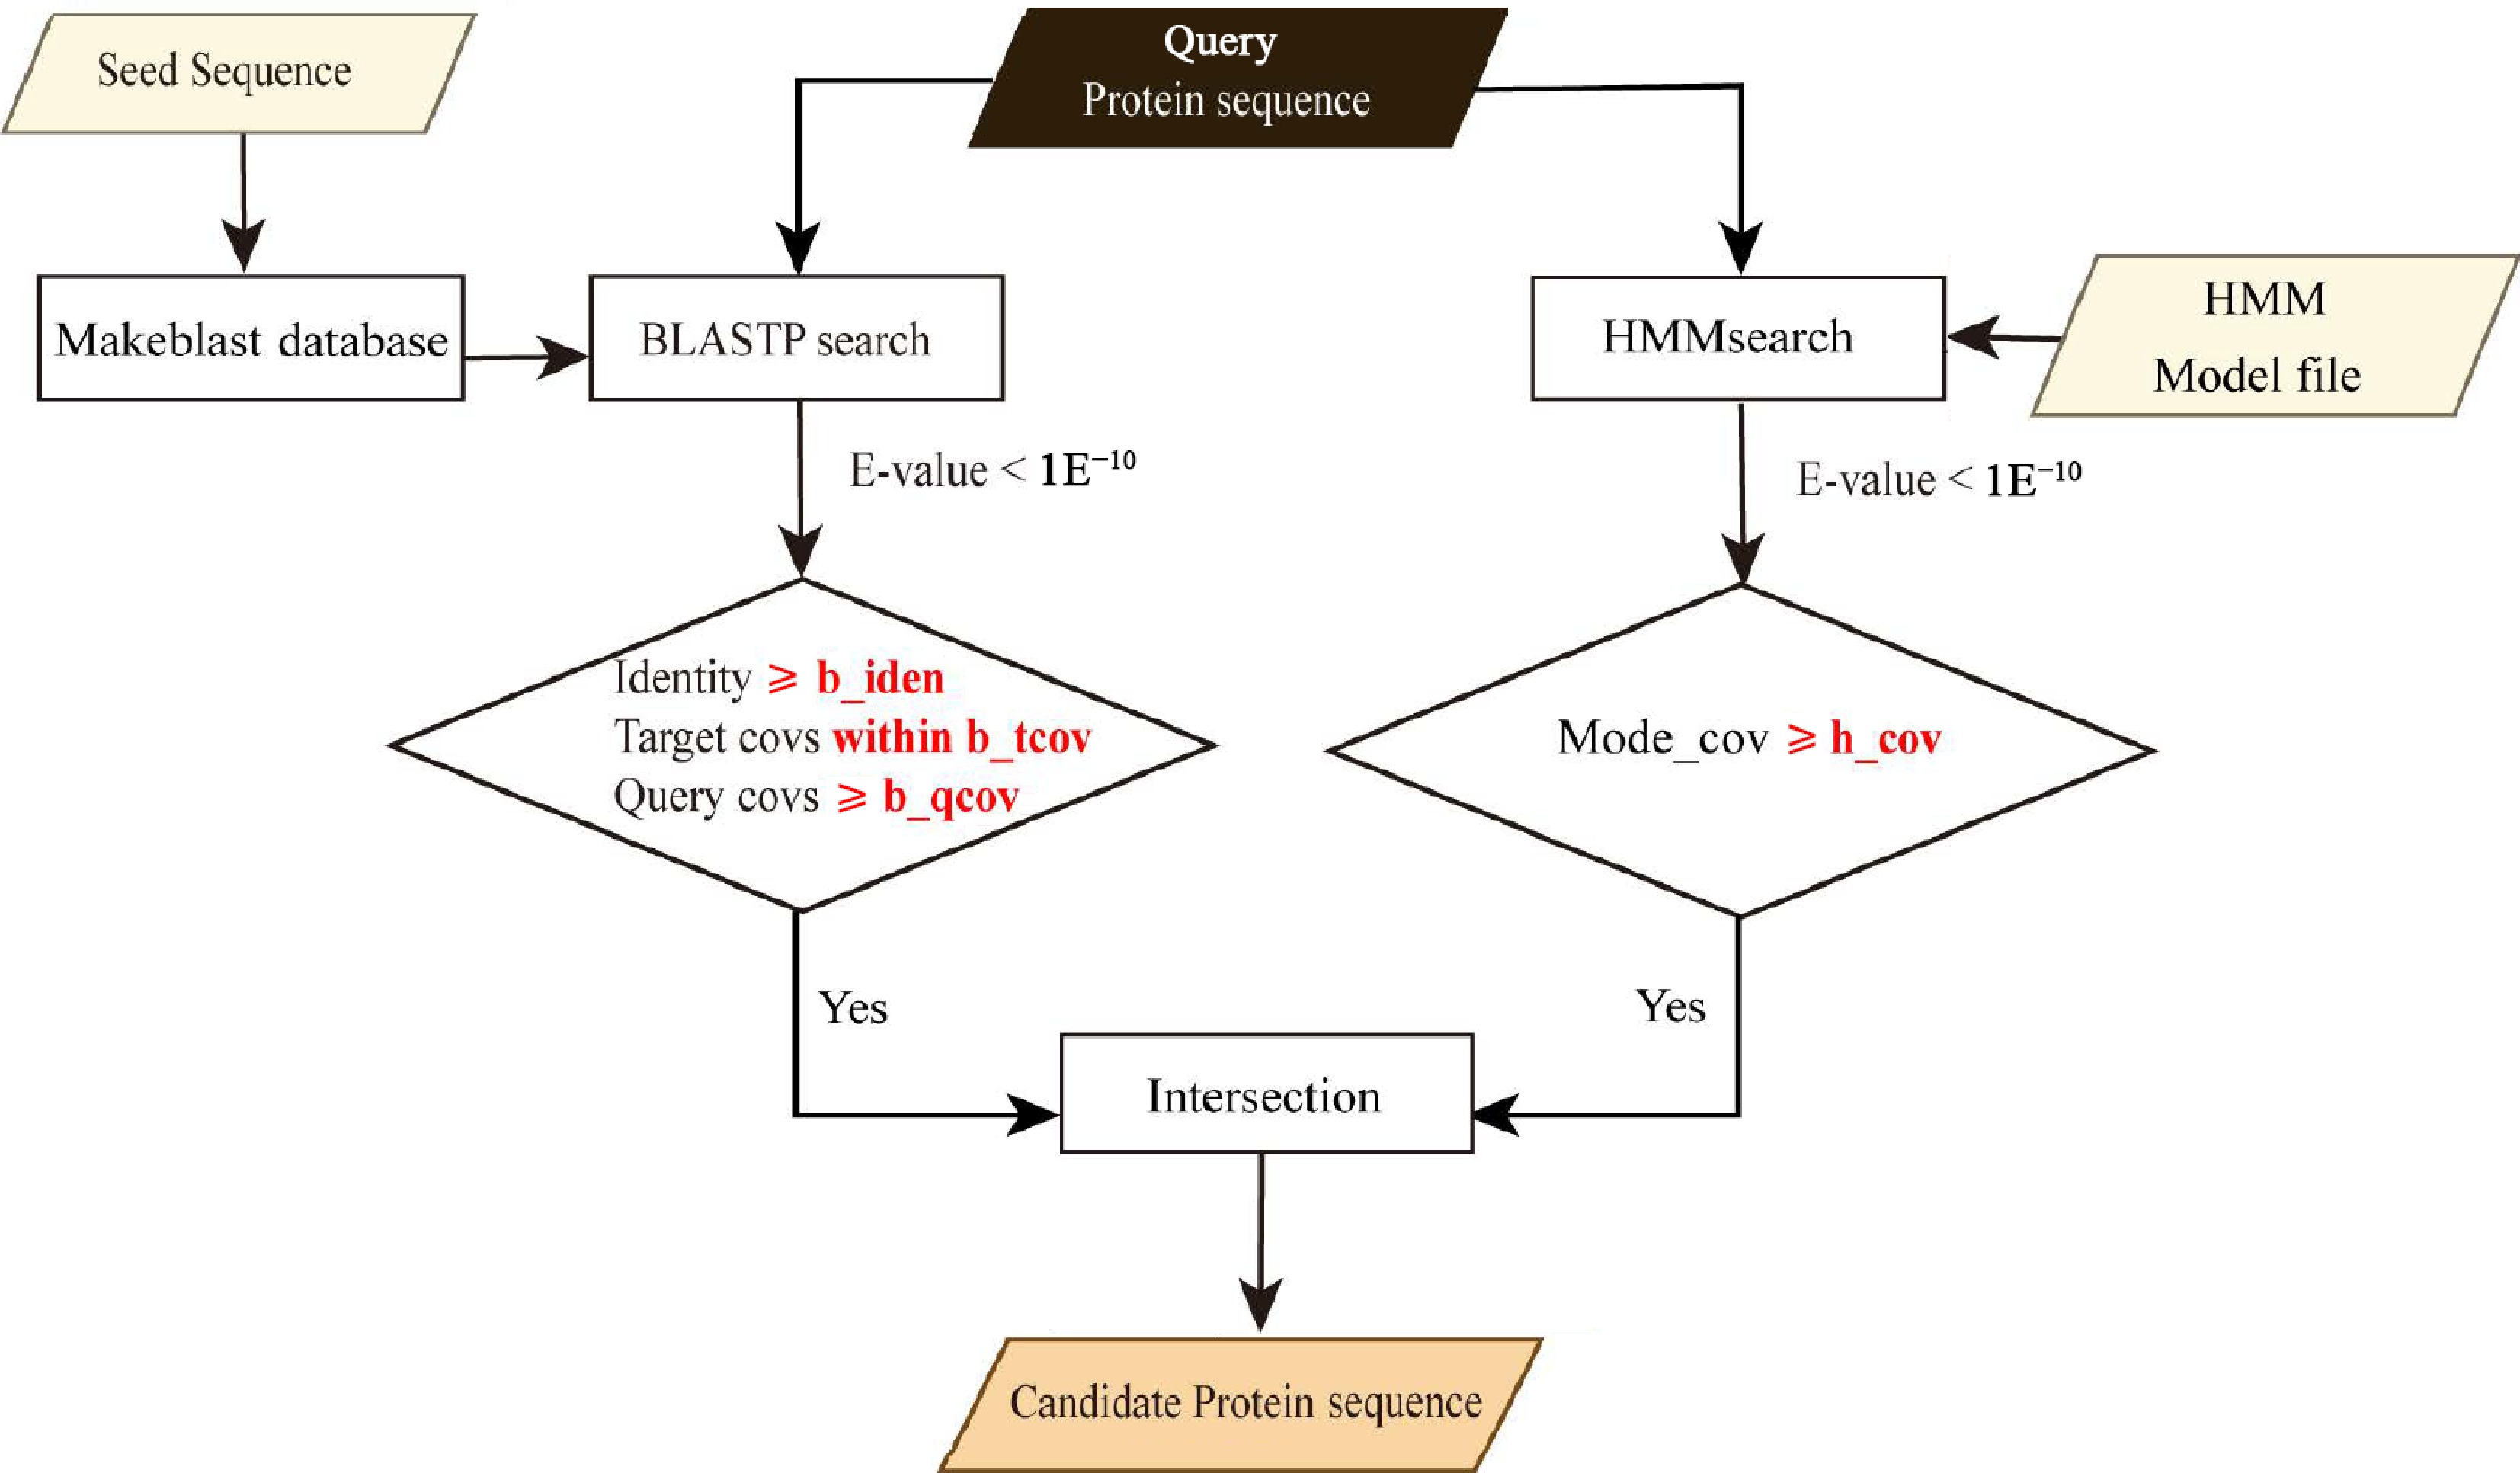
Figure 1.
Workflow of GFAnno. The local of 'seed sequence' file, 'HMM Model file' and the values of parameters (b_iden, b_qcov, b_tcov, and h_cov) were obtained from the config file.
File preparation
-
Obtain the Hidden Markov Model (HMM), BLASTP seed sequences, and prepare query protein files. Create a config file to include the local of 'seed sequence' file, 'HMM Model file' and the values of parameters (b_iden, b_qcov, b_tcov, and h_cov).
Perform BLASTP[8] searches with an E-value threshold of < 1E−10. Apply the filter parameters of identity ≥ b_iden, query coverages ≥ b_qcov and target coverages within b_qcov range to the search results.
Conduct HMMsearch[9] with an E-value threshold of < 1E−10. Apply the filter parameter of domain coverage ≥ h_cov to the search results.
Determine the intersection of the two filtered datasets, which will yield the remaining data representing the candidate genes of the target gene.
Parameters filtering workflow
-
The annotation process of GFAnno relies on the protein sequence files from known genes, important structural domain model files, and filtering parameters. Three datasets are used for the parameter selection process: the seed datasets are used to construct BLASTP[8] search the database and optimize the HMM model, the test datasets are used for parameter filtering, and the validation datasets are used to test whether the parameters selected earlier are correct. The production and filtering processes for these files are as shown in Fig. 2.
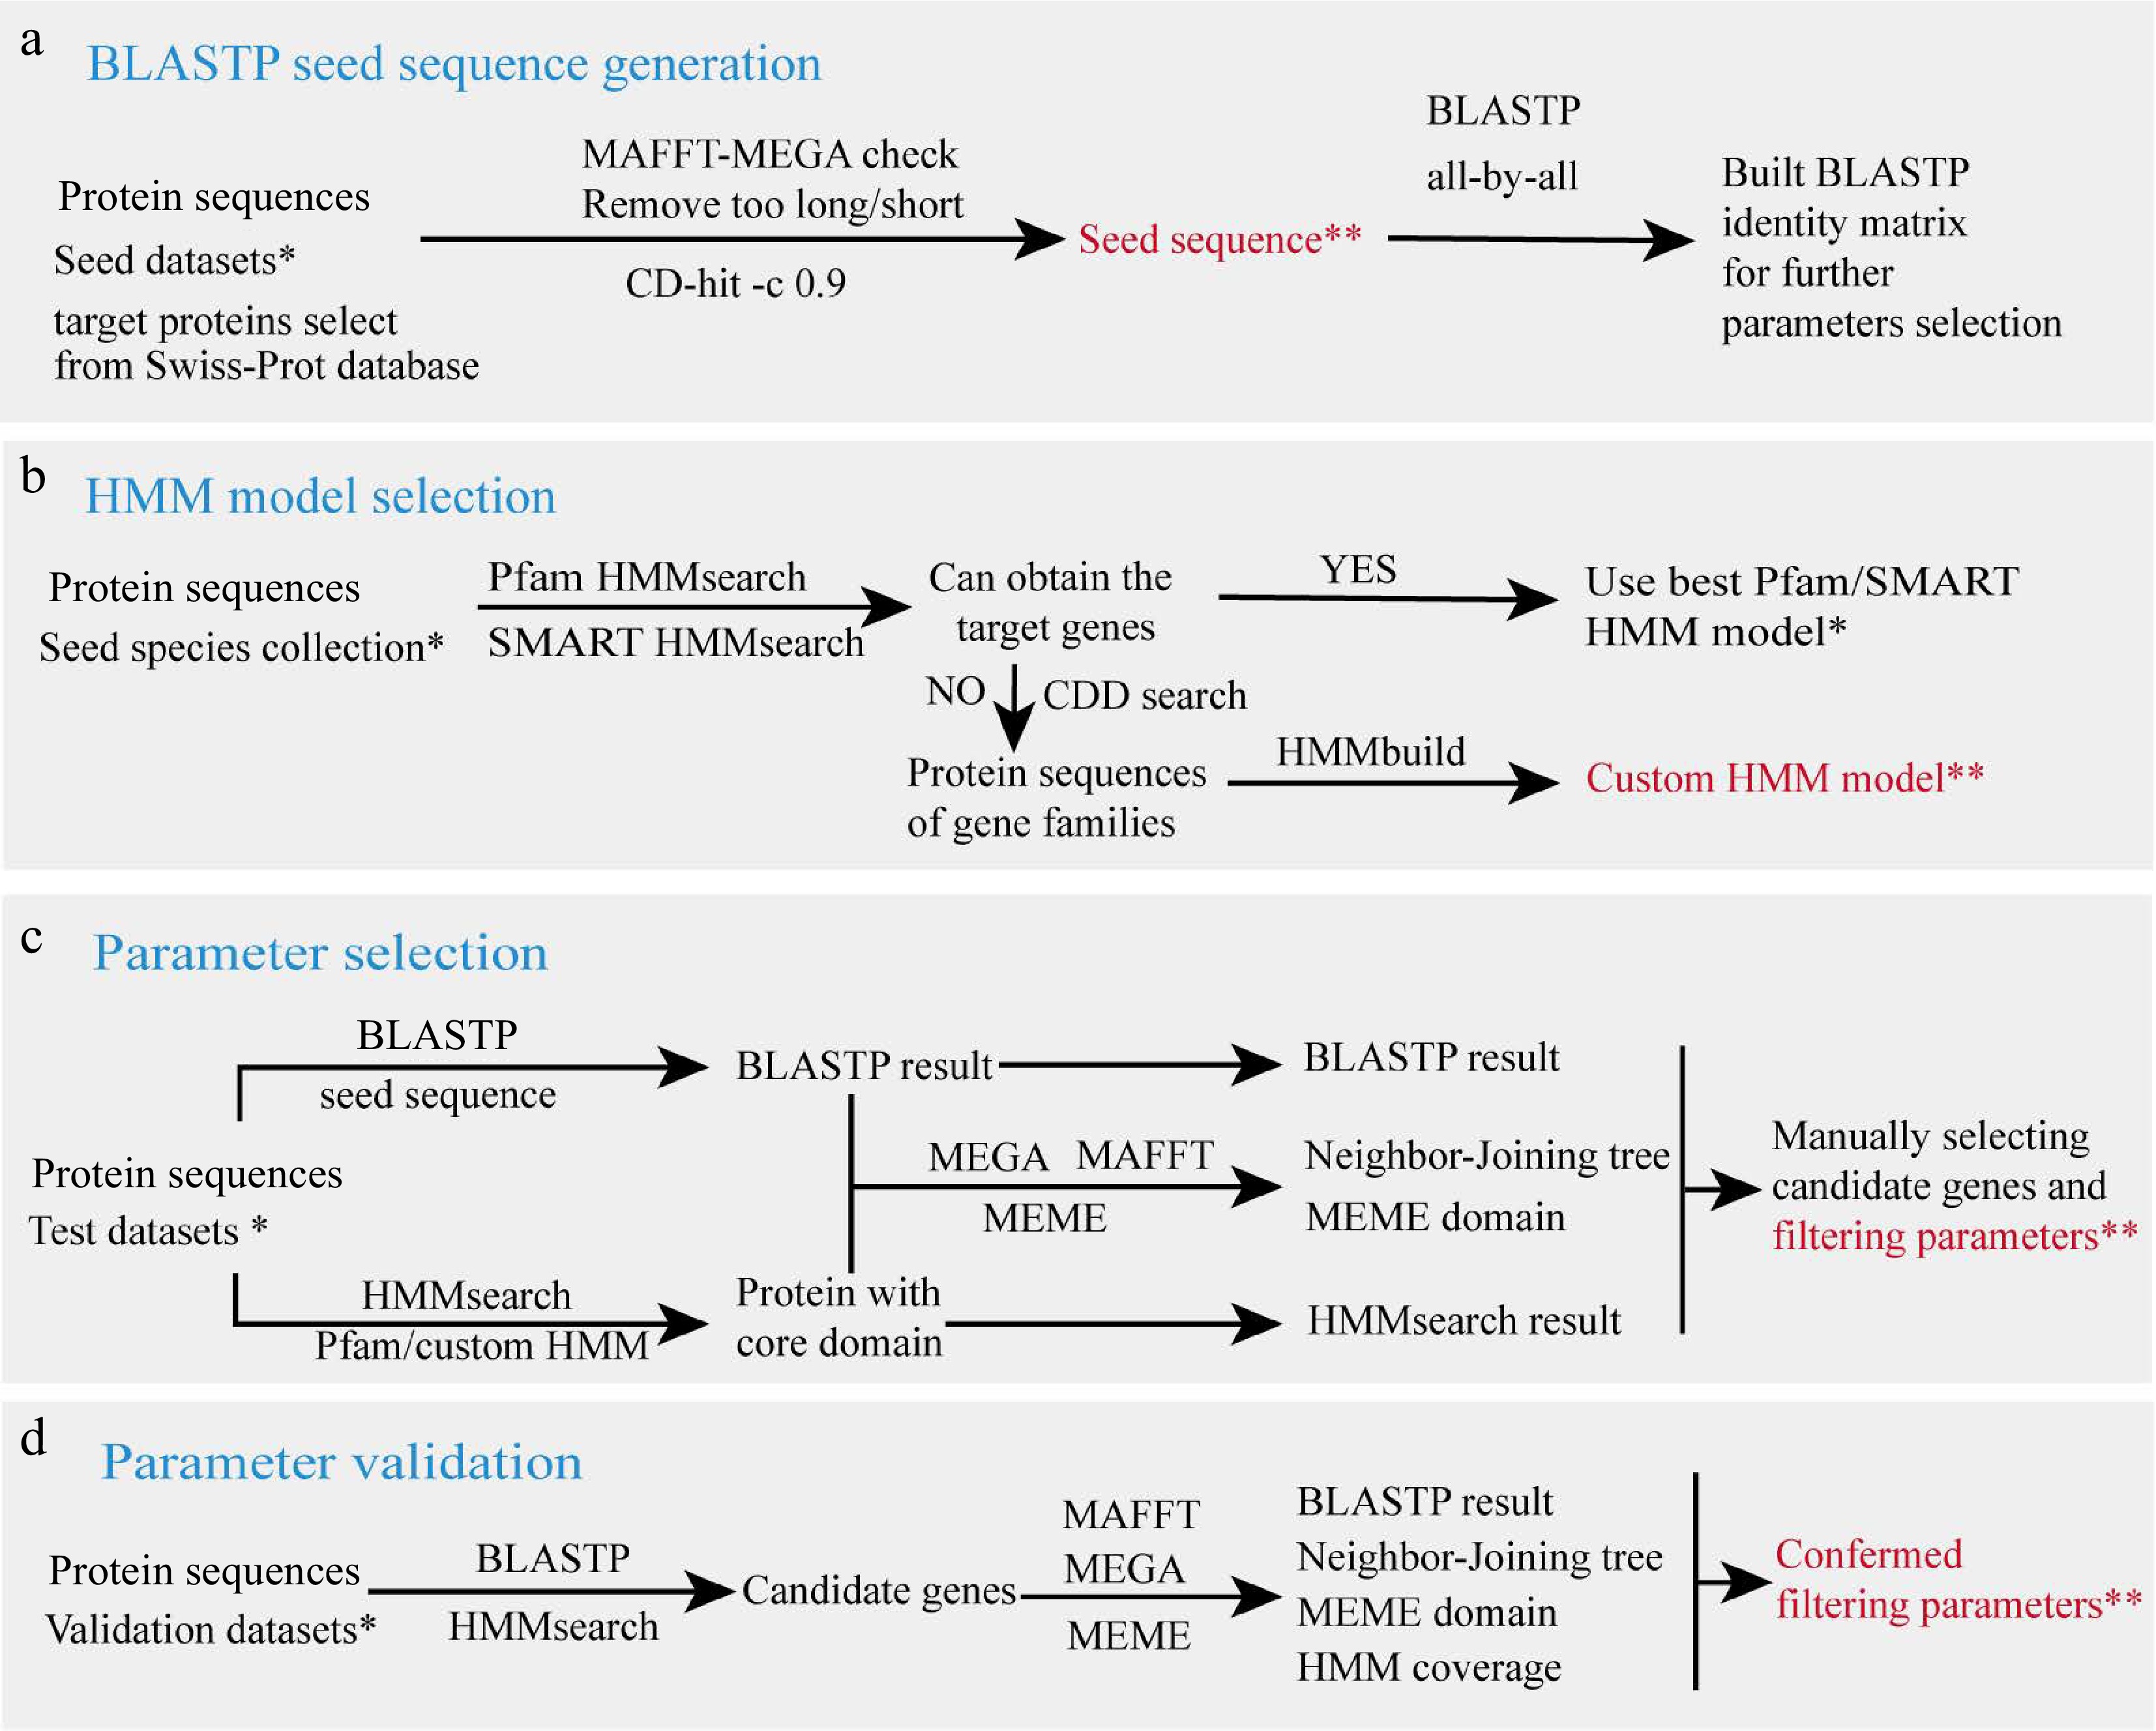
Figure 2.
Parameter filtering workflow. (a) BLASTP seed sequence generation. (b) HMM model selection. (c) Parameter selection. (d) Parameter validation. Species collections in each step are marked with a single asterisk (*), and output data is marked with double asterisks (**), which are provided in github.
BLASTP seed sequence generation
-
Based on the distribution range of the target gene, select a set of model species that represent various taxonomic positions as starting points for analysis. Obtain the reviewed protein sequence of target genes in selected species from the Swiss-Prot database (
www.uniprot.org/uniprotkb?query=reviewed:true )[14]. Remove sequences that are too long, too short, or have incomplete structural domains based on the common features of the target gene, then CD-hit (v 4.8.1)[15] with an identity threshold of 0.9 was used to reduce redundancy to build seed sequence for BLASTP. Subsequently, use an all-by-all BLASTP (v2.2.31+)[8] search to obtain a similarity matrix between seed sequences, find the lowest similarity value, and set it as the initial value for the subsequent 'b_iden' parameter.HMM model selection
-
Important structural domain files for gene families or superfamilies were obtained by downloading from Protein Families database (Pfam)[16] and SMART[17] database . We first use seed sequences to check whether the downloaded HMM domains are suitable for detecting the target gene. If not, we obtained the sequence of the gene family containing the gene from the Conserved Domain Database (CDD)[18] and used HMMbuild to build a custom model.
Parameter selection
-
The protein sequences of species in test datasets were first subjected to HMMsearch with an E-value threshold of < 1E−10. The protein sequences obtained from the HMMsearch were aligned using MAFFT (v7.310) for multiple sequence alignment. The alignment results were subsequently trimmed by TrimAl (v1.4.rev15)[19]. An evolutionary tree was constructed from the trimmed sequences using MEGA (v11.0.10)[20] with the following parameters: Neighbor-Joining method, Poisson correction, and bootstrap value of 1,000. For enhanced visual representation, the generated trees were further refined using iTOL[17]. The protein sequences obtained from the HMMsearch were further analyzed using BLASTP seed sequences with an E-value threshold of < 1E−10. The MEME[21] program was used to identify conserved motifs and the Tbtools[22] software was utilized for the visualization of specific domains and conserved motifs. Parameters for further batch searching were established by manually examining the BLASTP identity (b_iden), BLASTP query coverages (b_qcov), BLASTP target coverages (b_tcov), and HMMsearch domain coverage (h_cov) for the target genes.
Parameter validation
-
We validate the parameters obtained from the above steps using proteins from the test dataset to ensure good filtering results when expanding the dataset.
Flavonoid biosynthesis pathway used in this work
-
We conducted a systematic literature search using the PubMed database as primary source, selecting classic studies of these genes in plants or literature focused on functional research of these genes in tea plants (Supplemental Table S1). We incorporated research conducted by Cui et al.[23], which elucidated the involvement of UGT84A enzymes in the production of β-glucogallin as the acyl donor. Furthermore, we included the work of Yao et al.[24] that demonstrated the participation of Serine Carboxypeptidase-Like (SCPLIA) in the acylation of catechins. To address the challenges posed by the high similarity among members of the CYP450 (Supplemental Fig. S1) and 2OGD superfamilies, we implemented special annotations for these enzymes. Specifically, C4H, FNS II, F3'H, and F3'5'H, which are involved in hydroxylation and oxidation reactions[25], are denoted by an asterisk (*). Similarly, 2OGDs, such as F3H, FLS, ANS, and LDOX, which are involved in oxidation reactions[26, 27], are marked with a double asterisk (**) (Fig. 3).
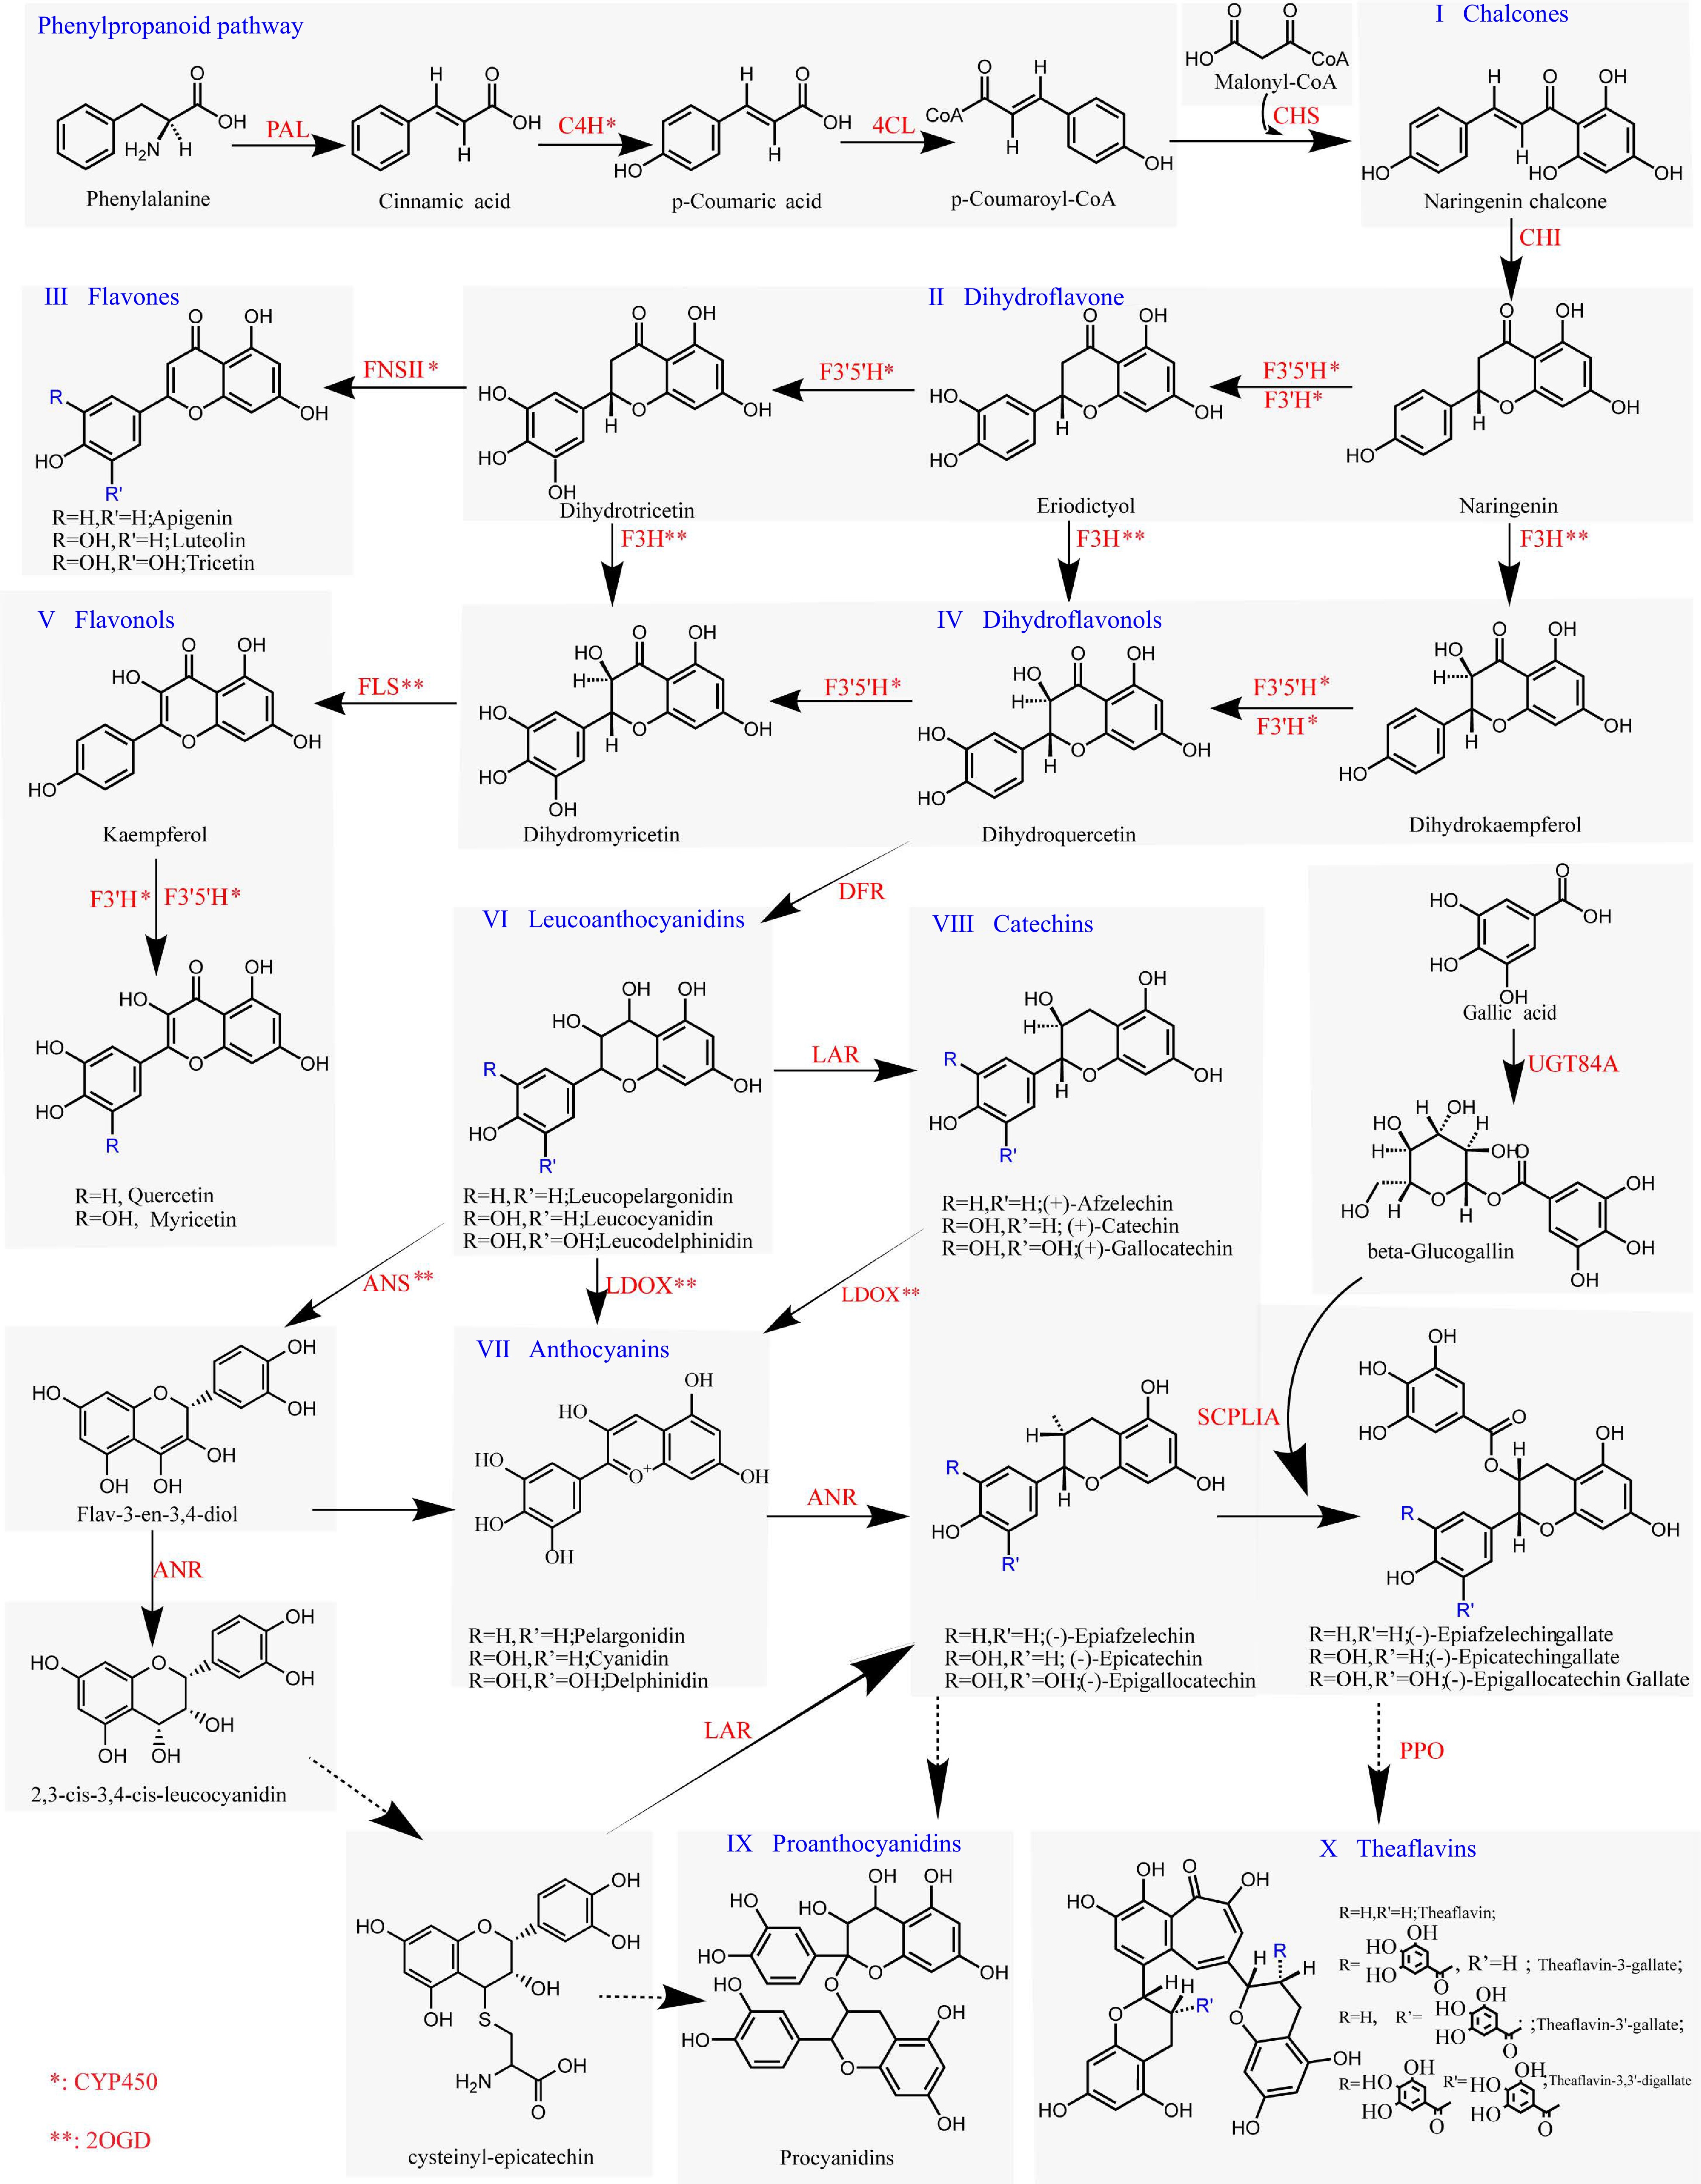
Figure 3.
Plant flavonoid biosynthesis pathway. Enzymes labeled with '*' indicate members of CYP450s, whereas genes labeled with '**' represent members of 2OGDs. Solid-line arrows indicate well-established mechanisms for the corresponding enzymatic reactions, and dashed-line arrows represent pathways where the mechanistic details are yet to be fully determined.
Species and protein used in this work
-
Flavonoids are primarily found in angiosperms, and some basal angiosperm groups have also been found to harbor genes associated with this pathway. In our study, we constructed the seed dataset using three dicots (Arabidopsis thaliana[28], Vitis vinifera[29] and C. sinensis 'Tieguanyin'[30]), two monocots (Oryza sativa[31] and Apostasia shenzhenica[32]), and a basal angiosperm (Amborella trichopoda[33]); the test dataset was constructed using two dicots (Populus trichocarpa[34] and C. sinensis 'Huangdan'[35]), a monocot (Zostera marina[36]), and a basal angiosperm (Cinnamomum kanehirae[37]); and the validation dataset was constructed using six dicots (Actinidia chinensis[38], Ficus hispida[39], C. sinensis 'Longjing 43'[40], C. sinensis 'Shuchazao'[41] and C. sinensis 'DASZ'[4]) and three monocots (Zea mays[42], Asparagus officinalis[43] and Musa balbisiana[44]) (Supplemental Table S2). We selected these species based on ensuring their representativeness and the quality of genome annotation for each species, while also including a broad representation of various taxonomic groups within angiosperms. We use The Benchmarking Universal Single-Copy Orthologs (BUSCO)[44] completeness integrity to indicate genome annotation quality. The seed dataset requires a BUSCO integrity score of over 90, while the test and validation datasets require a BUSCO integrity score of over 80 (Supplemental Table S2).
Filtering parameters for flavonoid biosynthesis-related gene in plants
-
Following the parameters filtering workflow in Fig. 2, we used proteins of the test species (Supplemental Table S2) downloaded from the Swiss-Prot database which have been validated for gene function (PE ≤ 2) to build the BLASTP seed sequence. In this work, for Uridine Diphosphate Galloyglycosyltransferase (UGT84A), Pfam HMM provided a model for the UGT superfamily (PF00201.21, UDPGT). However, only about 20% coverage was achieved when searching the model with known genes. Therefore, we downloaded the conserved sequence of the UGT superfamily (cl10013) from the CDD and built a custom model named cl10013.hmm for subsequent searches of the UGT84A. The KO IDs corresponding to these 18 genes were extracted from the KEGG database, and the annotation results were further validated using KAAS[45].
To provide a detailed parameter selection process, we provided a detailed presentation of the screening process and parameters for 18 genes (Figs 4−5, Supplemental Figs S2−S10). When selecting parameters, we initially set the b_iden based on the lowest value in the seed sequence identity matrix (Supplemental Table S3). In addition, the initial values of other parameters are as follows: b_qcov ≥ 70, 130 ≥ b_tcov ≥ 70, and h_covc ≥ 90. Subsequently, the process in Fig. 2 is completed using the test dataset to obtain accurate parameters. The final parameters obtained are listed in Table 1, and files and parameters used in this table can all be found on our GitHub page.
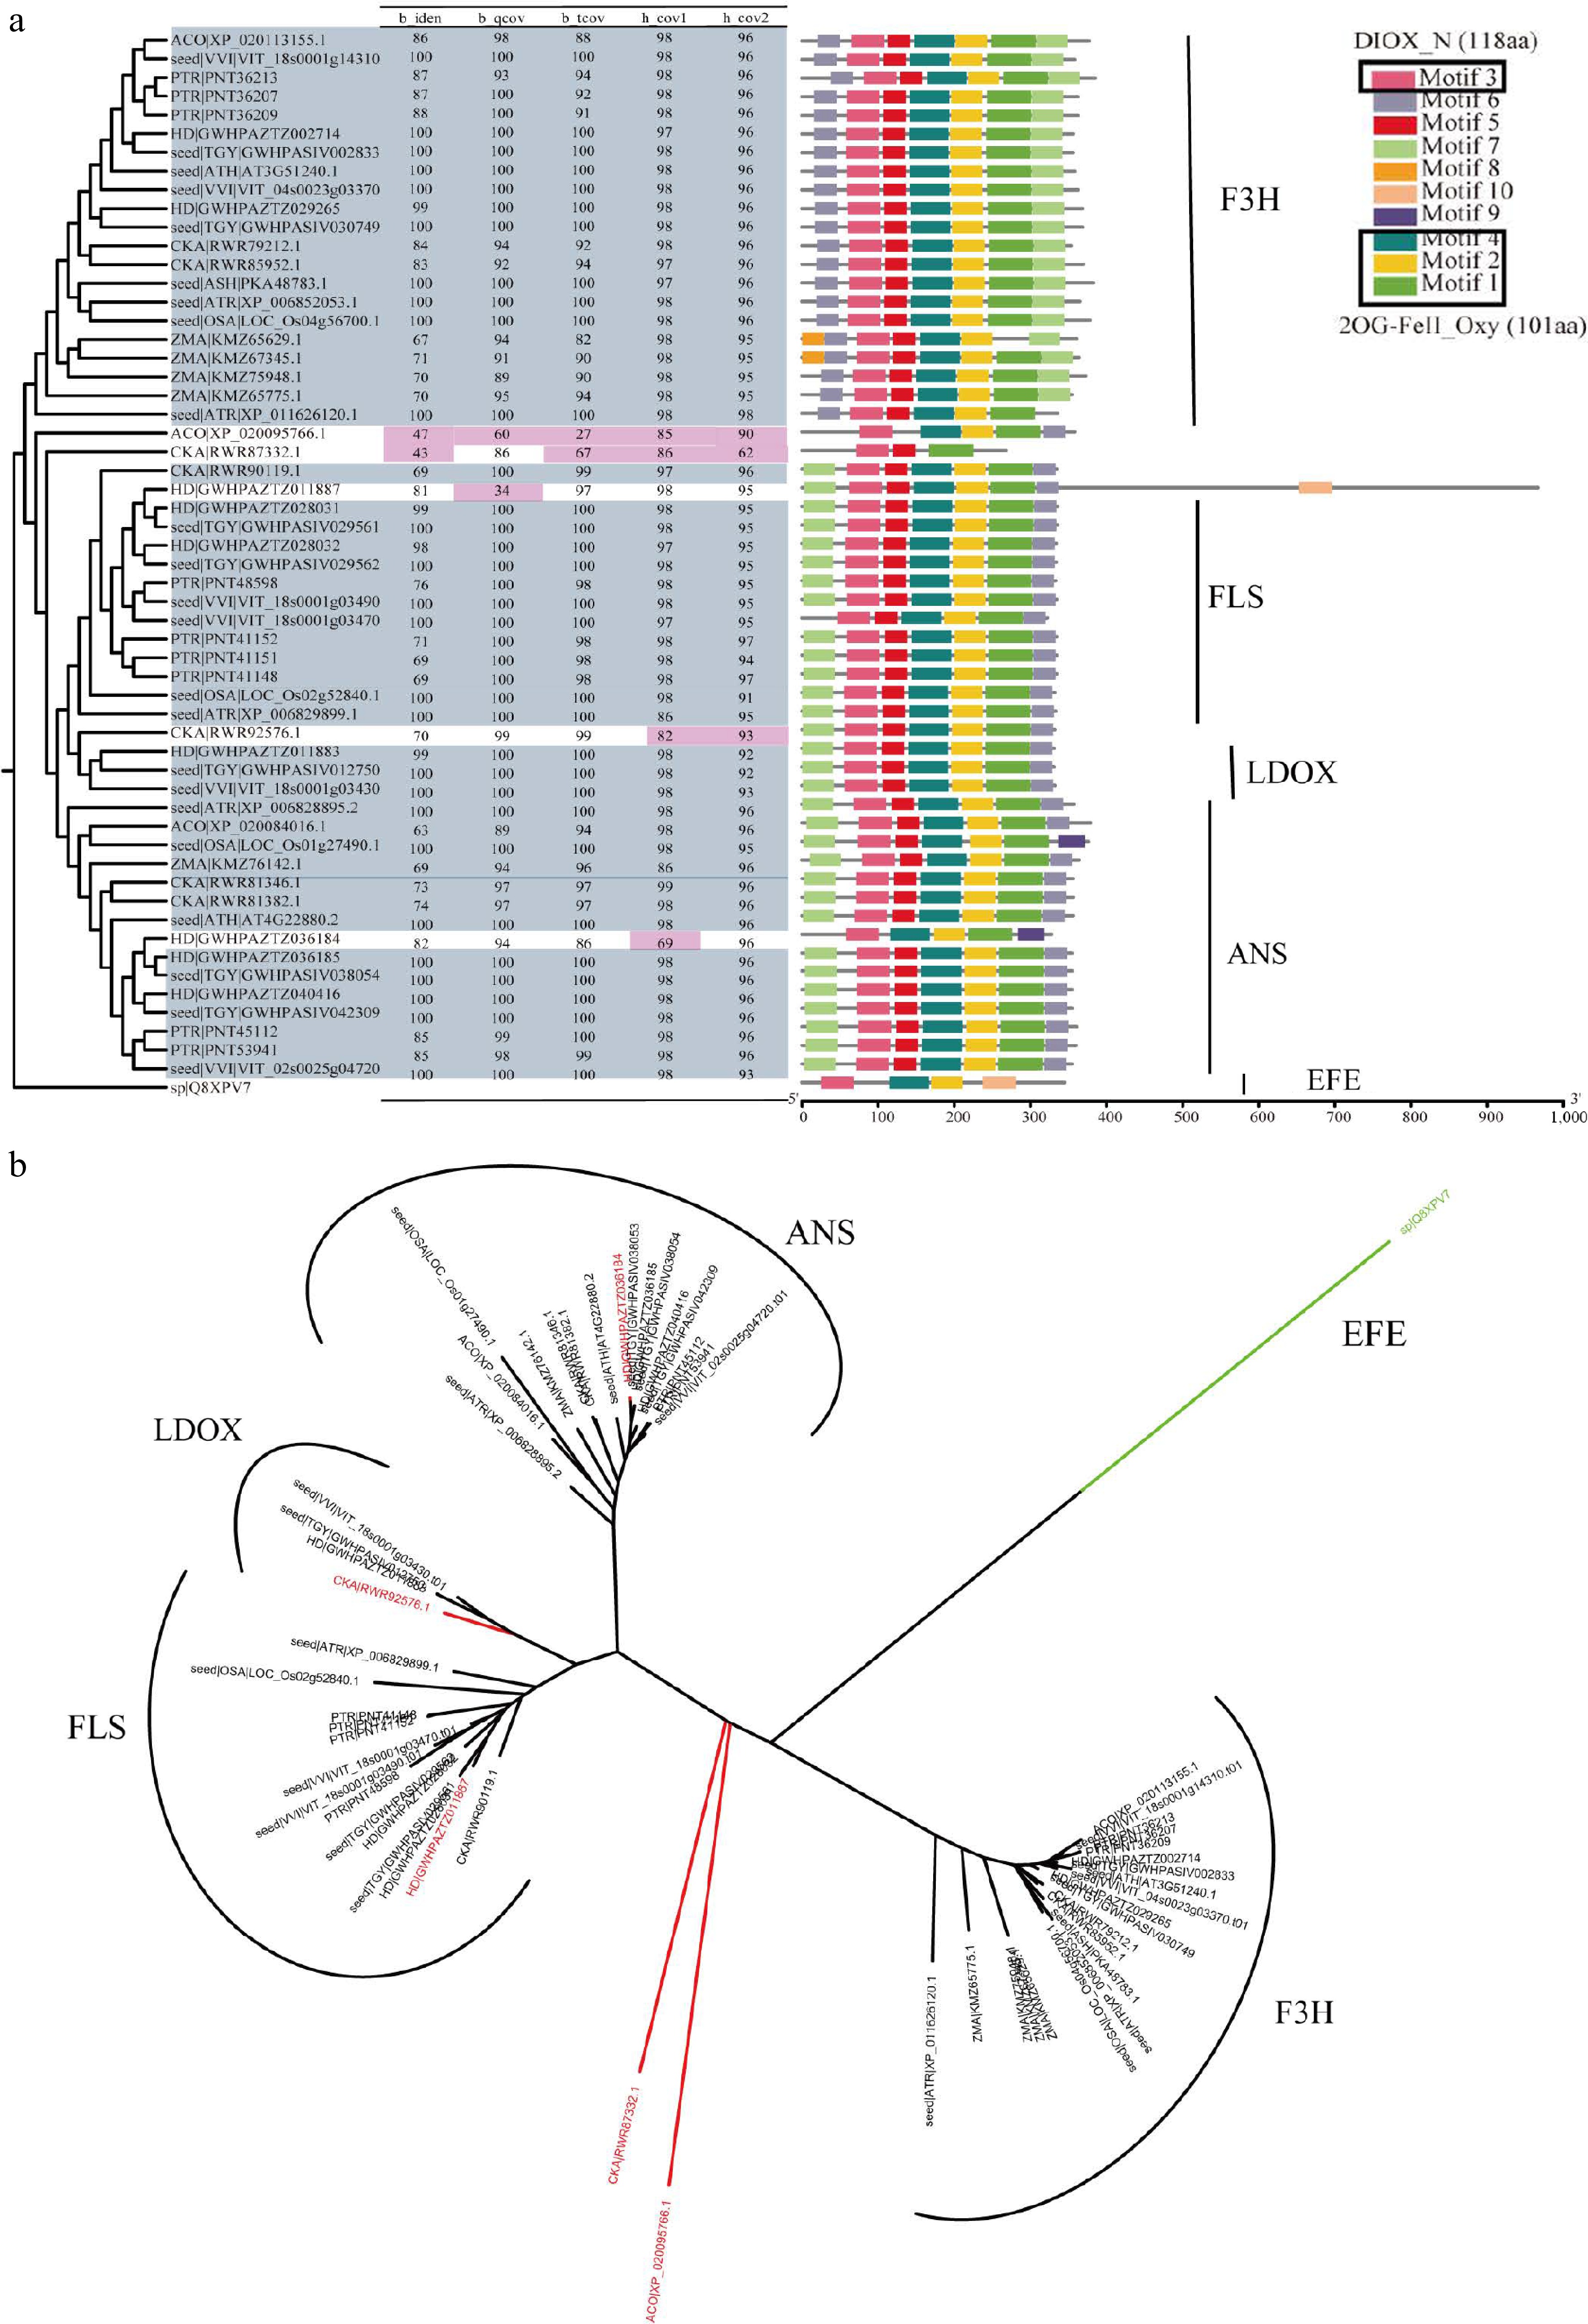
Figure 4.
Overview of F3H, ANS, LDOX, and FLS in 2OGD superfamily. (a) The parameter selection for candidate genes in F3H, ANS, LDOX, and FLS. The phylogenetic tree, four parameters, and conservation module diagram to illustrate the selection process. In the phylogenetic tree, genes selected for are represented in blue-gray, while parameters that have been excluded are marked in red. The conserved domains were created using MEME[21], and the HMM models used in HMMsearch are outlined in black boxes, with the model length displayed in parentheses following the model's name. (b) Neighbor join tree shows the distance relationships between four genes.
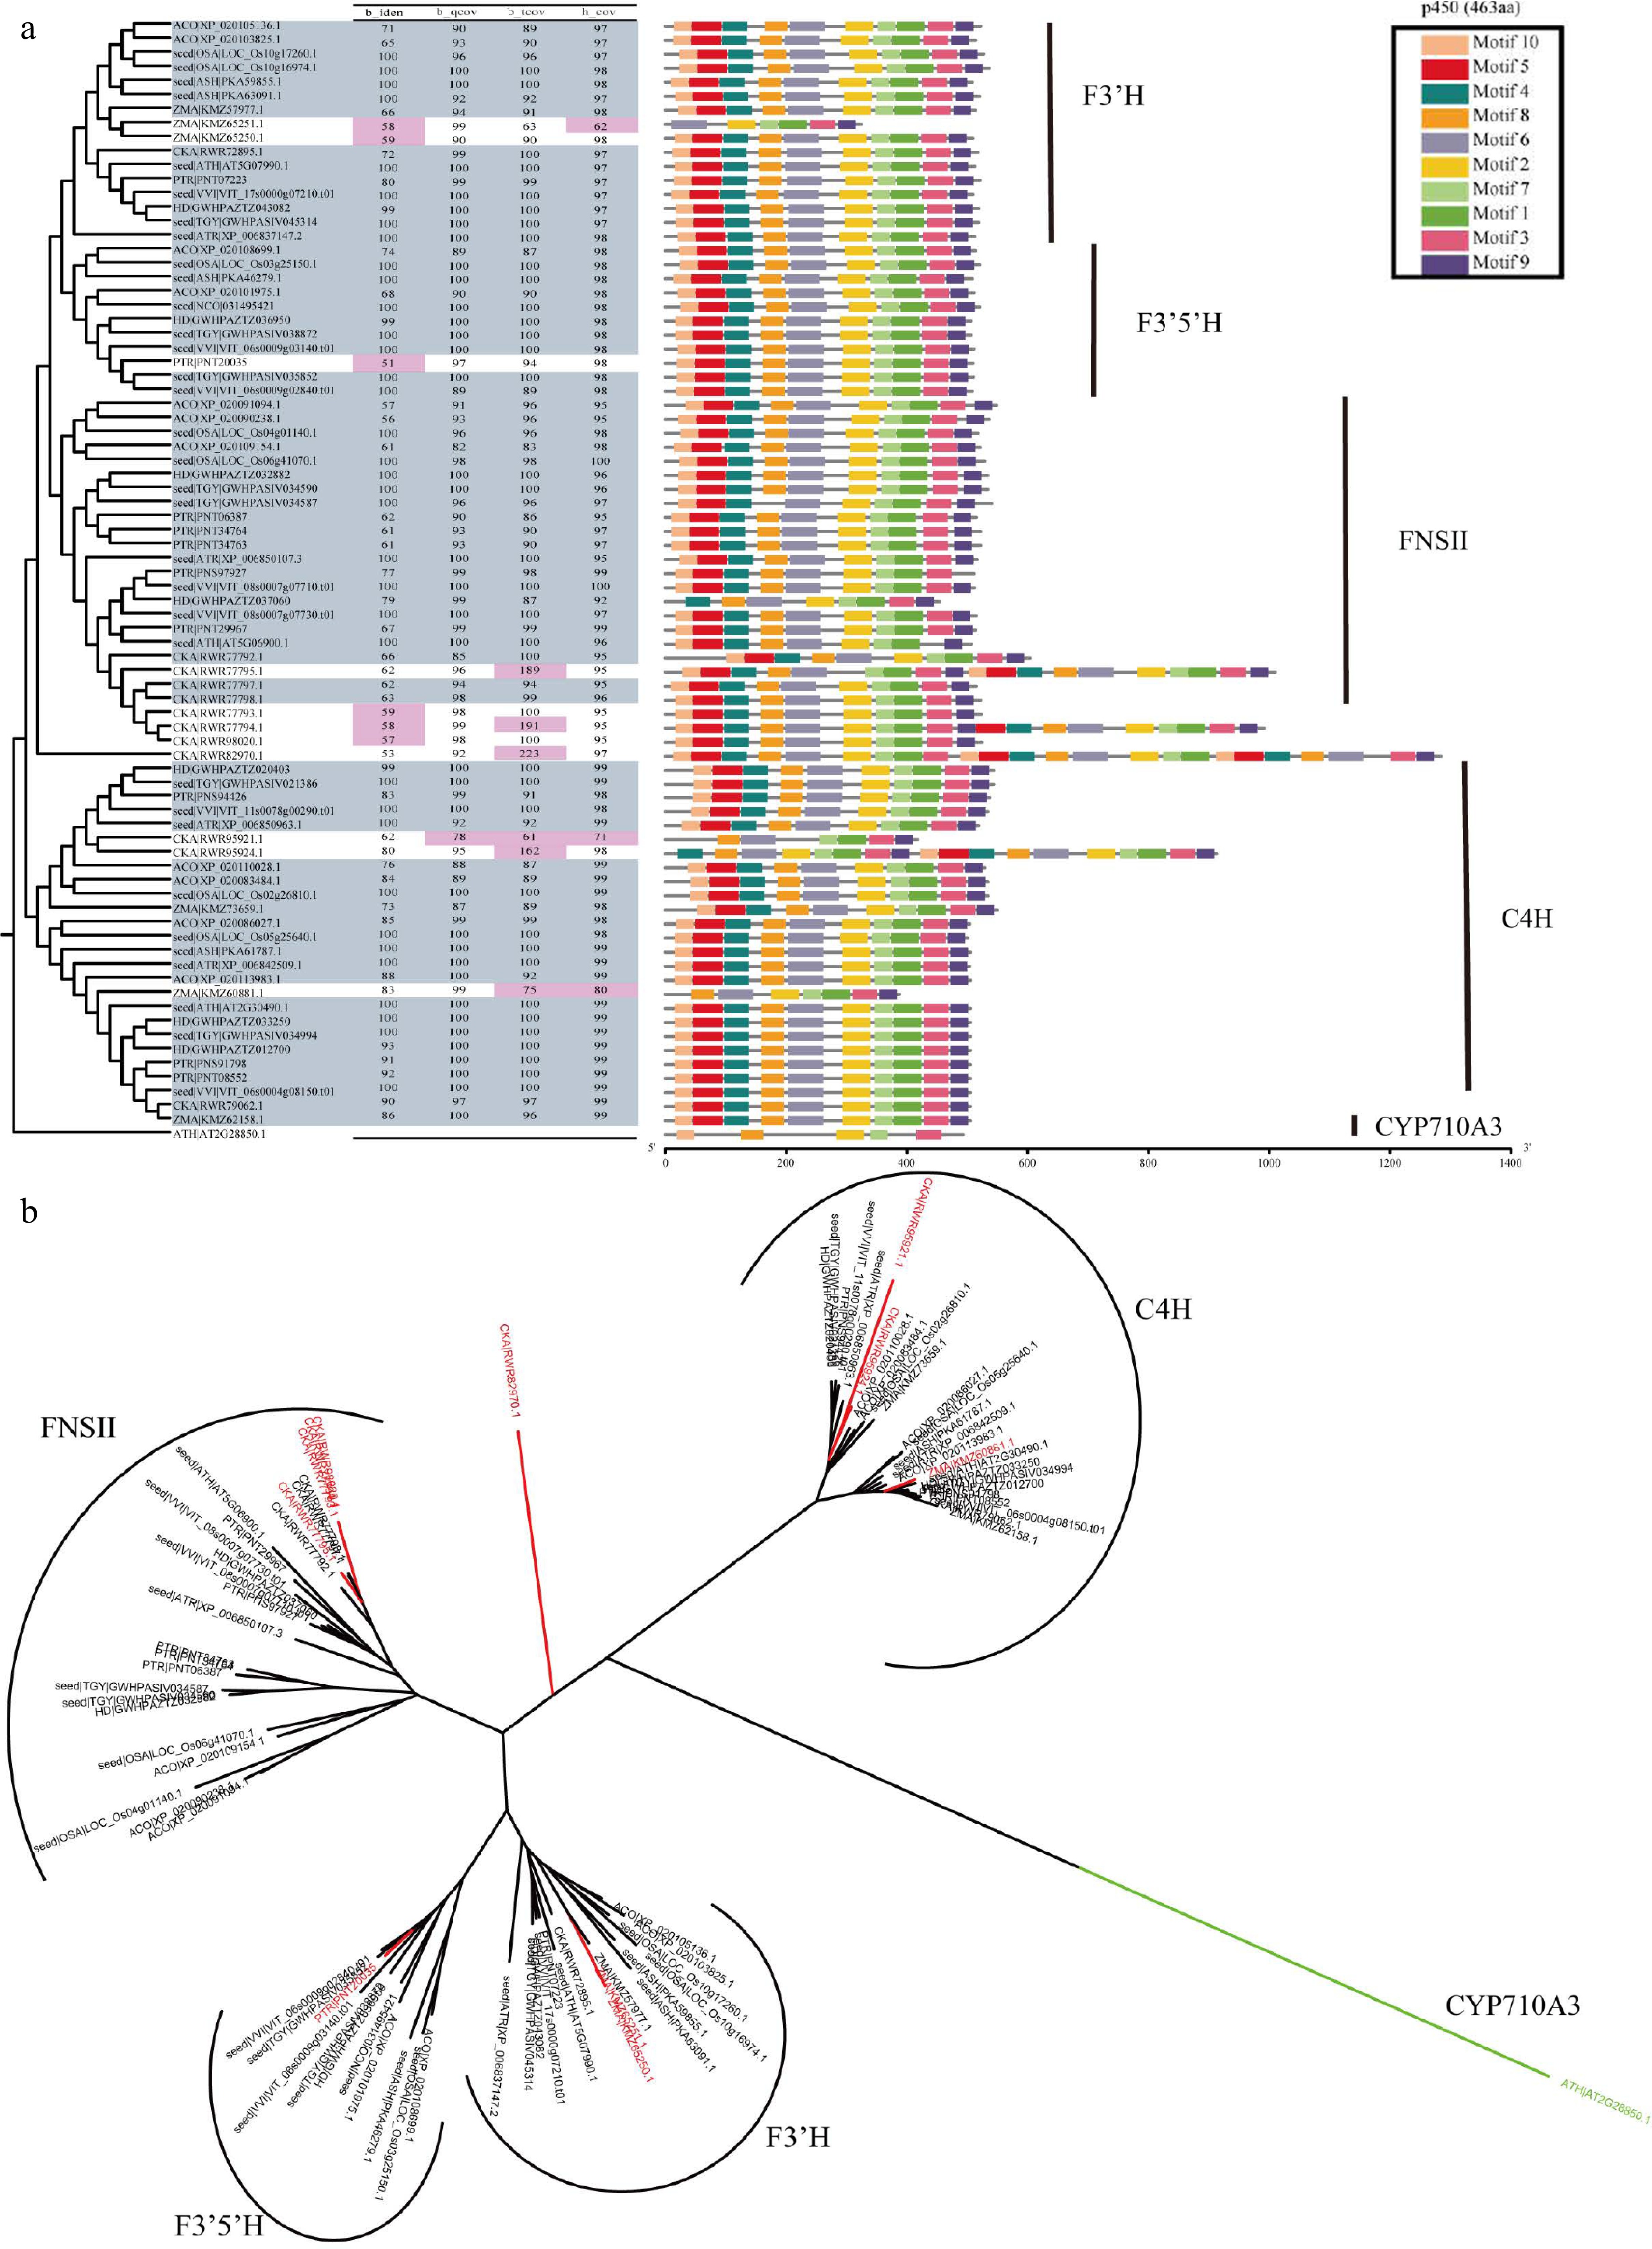
Figure 5.
Overview of F3'H, F3'5'H, FNSII and C4H in CYP450 superfamily. (a) The parameter selection for candidate genes. The phylogenetic tree, four parameters, and conservation module diagram to illustrate the selection process. In the phylogenetic tree, genes selected for are represented in blue-gray, while parameters that have been excluded are marked in red. The conserved domains were created using MEME[21], and the HMM models used in HMMsearch are outlined in black boxes, with the model length displayed in parentheses following the model's name. (b) Neighbor join tree shows the distance relationships between four genes.
Table 1. Files and parameters used for the annotation pipeline.
Enzyme HMM/CDD ID Parameter setting b_iden b_qcov b_tcov h_cov 4CL PF13193.6 (AMP-binding_C)
PF00501(AMP-binding)40 70 60−120 90/90 CHI PF02431.15 (Chalcone) 35 70 70−130 90 CHS PF02797.15 (Chal_sti_synt_C)
PF00195.19 (Chal_sti_synt_N)50 80 80−120 90/90 LAR PF05368.13 (NmrA) 30 65 80−120 90 PAL PF00221.19 (Lyase_aromatic) 60 80 80−120 90 PPO PF12142.8 (PPO1_DWL)
PF12143.8 (PPO1_KFDV)35 70 70−130 90/90 SCPL4* PF00450.22 (Peptidase_S10) 70 80 80−120 90 SCPL5* PF00450.22 (Peptidase_S10) 70 80 80−120 90 UGT84A cl10013 40 80 80−120 90 DFR PF01370.21 (Epimerase) 60 80 80−120 90 ANR 55 80 80−120 90 F3H PF03171.23 (2OG-FeII_Oxy)
PF14226.9 (DIOX_N)60 80 80−120 90/90 FLS 60 80 80−120 90/90 LDOX 50 80 80−120 90/90 ANS 60 80 80−120 90/90 F3'H PF00067.25 (p450) 50 80 80−120 90 F3'5'H 60 80 80−120 90 C4H 70 80 80−120 90 FNSII 50 80 80−120 90 * SCPL4, SCPL5 in SCPLIA[24]. 'b_iden' denotes the identity of BLASTP; 'b_qcov' represents the 'query coverage per HSP' of BLASTP, 'b_tcov' represents the 'target coverage per HSP' of BLAST, and 'h_covc' indicates the HMM coverage of HMMsearch. To verify the reliability of the parameters, we used the validation dataset to validate the parameters in Table 1 (Supplemental Figs S11 & S21). The results showed that our parameters can effectively identify all the 18 genes in Table 1.
-
The input to GFAnno includes the following options:
• The '-f / --fasta' flag specifies the input protein file in FASTA format.
• The '-c / --config' flag specifies the config file.
The config file can contain multiple genes, each with specific settings, including the local of seed file for BLASTP (blastp_seed) and corresponding filtering parameters (b_iden, b_qcov and b_tcov) for the target genes, the local of HMM file for HMMERsearch (hmm_file) and corresponding parameters (h_cov).
For first-time users of the software, you can use the '-g / --generate' parameter to generate a config file (flavno.ini) for the 18 genes involved in the plant catechin biosynthesis pathway, along with the required blast seed files and hmm_file files. If users need to annotate and filter other genes, they can refer to the format of the initial config file to create new filtering schemes.
Output
-
The output of GFAnno includes annotated target gene sequences along with their alignment parameters. A folder is created with the prefix specified by '-o', and within this folder, a series of FASTA files are generated, named using both the specified prefix and the names of the target genes. The 'stat' file contains at least four columns of information: gene ID, blastp_identity with the seed file, blastp_qcovs, blastp_tcovs with the seed file, and hmm_coverage. If multiple HMM files are provided, additional columns will be output for the hmm_coverage of the second and third HMM models.
For example, running it with '-o flavno -c flavno.ini' will create a folder named 'flavno. In this folder, you can find a series of FASTA files named after gene names. These files contain candidate genes that have been annotated by GFAnno using the input file. Additionally, there is a 'flavno.stat' file that provides alignment parameters for the corresponding genes.
-
Annotation methods for superfamily, gene family, and multicopy genes are similar, but with different parameter settings. Superfamily and family analysis focus on identifying characteristic structural domains and each gene or gene family has its own sequence characteristics. In the flavonoid metabolic pathway, DFR and ANR belong to the Short-chain dehydrogenases/reductases (SDRs) family (Supplemental Fig. S10), while F3H, FLS, ANS, and LDOX belong to the 2OGD superfamily (Fig. 4), C4H, FNS II, F3'H, and F3'5'H belong to the CYP450 superfamily (Fig. 5 & Supplemental Fig. S1). Species within the same superfamily share conserved domains, so they can use the same HMM model. Furthermore, conserved motif analysis showed that the candidate genes classified as CYP450 superfamily members shared four common regions, namely the heme-binding domain Phe-X-X-Glu-Arg-Arg-X-Cys-X-Gly, which is responsible for binding carbon monoxide, the Glu-X-X-Arg and the Ala-Gly-X-(Asp/Glu)-Thr-(Thr/Ser) motifs, which stabilizes the core structure and facilitates oxygen or substrate binding, respectively, and the hinge region Pro-Pro-Gly-Pro-Thr-(Gly/Pro)-Trp-Pro, which determines the correct orientation of CYP450 enzymes[46]. Characteristic iron-binding sites His-X-Asp-X(n)-His and the 2-oxoglutarate binding domain Arg-X-Ser, which are specific to 2OGDs[47]. The sequence similarity of LDOX and FLS, F3'H and F3'5'H is very high, and their phylogenetic relationship is also very close (Figs 4b & 5b). In our work, by using GFAnno, our parameters can accurately distinguish LDOX and FLS in the 2OGDs superfamily (Fig. 4a) and distinguish F3'H and F3'5'H in the CYP450 superfamily (Fig. 5a).
To assess the accuracy of the GFAnno flavonoid pathway gene annotation parameters, we utilized all proteins from Ficus hispida in a validation dataset as input and compared the results with KAAS annotations result (Supplemental Table S4). Supplemental Fig. S22 illustrates the phylogenetic relationships and comparison of conserved domains between the annotation results of GFAnno and KAAS. Red stars represent false positives from KAAS machine annotation, while green stars represent false negatives from KAAS annotation. Among the 18 genes, GFAnno effectively filtered out structurally incomplete sequences and some fused genes, resulting in an increase of 29.41% in accurate annotation results and the exclusion of 52.94% annotation errors. Additionally, other functional annotation software, such as InterPro[48] and blast2GO[49], employs a similar approach using BLASTP and HMMsearch separately, which tends to yield a large number of sequences from the same gene family. Therefore, we also compiled the results obtained solely using BLASTP and HMMsearch (Supplemental Table S4). It can be observed that such annotations effectively identify the source of sequences but face challenges in determining the completeness of the target sequences (Figs 4 & 5; Supplemental Figs S2−S22).
The above results indicate that, when conducting batch analyses for pan-genomic studies, accuracy is crucial. Therefore, our study serves as a valuable addition to genes and gene families annotation based on sequence features, it also provides a firm foundation for future flavonoid studies.
-
In conclusion, our study addresses the challenges in annotating genes related to the flavonoid biosynthesis pathway, offering 'GFAnno,' an open-source software package for gene and gene family annotation. We provide accurate parameters for precise identification of plant flavonoid biosynthesis-related genes. Our contribution lies in streamlining target gene annotation and establishing comparative benchmarks for analyzing the flavonoid biosynthesis pathway and comparing catalytic enzyme sequences, benefiting ongoing tea plant pan-genome research.
-
The authors confirm contribution to the paper as follows: study conception & design and project management: Zhang Q; data analyses: Lu C, Du L, Xiong Y, Zou L; Python code: Du L, Wang Z; draft manuscritp preparation: Lu C, Du L; manuscript revision: Zhang Q. All authors reviewed the results and approved the final version of the manuscript..
-
All data generated or analyzed during this study are included in this published article and its supplementary information files. The GFAnno software is accessible at
https://github.com/qunjie-zhang/gfanno . This study was supported by the Natural Science Foundation of China (32170625) (to Qunjie Zhang), Double first-class discipline promotion project (2021B10564001) (to Qunjie Zhang) and the Guangdong Special Support 318 Program (to Qunjie Zhang).
-
The authors declare that they have no conflict of interest.
-
# These authors contributed equally: Liuxu Du, Cui Lu, Zhentao Wang
- Supplemental Table S1 Enzymatic catalysis in the flavonoid synthesis pathway in tea plants.
- Supplemental Fig. S1
- Supplemental Table S2 Genome date used in this work.
- Supplemental Table S1
- Supplemental Table S3 Seed sequence information statistics.
- Supplemental Table S2
- Supplemental Table S4 Comparison of results from different annotation methods using F. hispida genome.
- Supplemental Figs S2
- Supplemental Fig. S1 Phylogenetic trees of CYP450 superfamily proteins. NJ tree was constructed using the protein sequences of three species (A. thaliana, TGY, DASZ) genomes. C4H,F3'5'H, FNS II and F3'H were marked in different colors.
- S10
- Supplemental Fig. S2 The parameter selection for 4CL of the test species.
- Supplemental Table S3
- Supplemental Fig. S3 The parameter selection for CHI of the test species.
- Supplemental Figs S11
- Supplemental Fig. S4 The parameter selection for CHS of the test species. The sequences marked with asterisks were previously misannotated in earlier studies[1].
- S21
- Supplemental Fig. S5 The parameter selection for LAR of the test species.
- Supplemental Table S4
- Supplemental Fig. S6 The parameter selection for PAL of the test species.
- Supplemental Fig. S22
- Supplemental Fig. S7 The parameter selection for PPO of the test species.
- Supplemental Fig. S8 The parameter selection for SCPL I A of the test species. The sequences marked with asterisks were previously misannotated in earlier studies[2].
- Supplemental Fig. S9 The parameter selection for UGT84A of the test species.
- Supplemental Fig. S10 The parameter selection for ANR and DFR in SDR superfamily of the test species.
- Supplemental Fig. S11 The parameter validation for C4H, FNS II, F3'H, and F3'5'H in CYP450 superfamily.
- Supplemental Fig. S12 The parameter validation for F3H, FLS, ANS, and LDOX in 2OG superfamily.
- Supplemental Fig. S13 The parameter validation for 4CL.
- Supplemental Fig. S14 The parameter validation for CHI.
- Supplemental Fig. S15 The parameter validation for CHS.
- Supplemental Fig. S16 The parameter validation for LAR.
- Supplemental Fig. S17 The parameter validation for PAL.
- Supplemental Fig. S18 The parameter validation for PPO.
- Supplemental Fig. S19 The parameter validation for SCPL I A.
- Supplemental Fig. S20 The parameter validation for UGT84A.
- Supplemental Fig. S21 The parameter validation for ANR and DFR in SDR superfamily.
- Supplemental Fig. S22 Comparison of results from Gfanno and KAAS annotation methods using F. hispida genome. Green stars indicate more correctly annotated genes by Gfanno than by KAAS, and red stars indicate incorrectly annotated genes by KAAS.
- Copyright: © 2024 by the author(s). Published by Maximum Academic Press, Fayetteville, GA. This article is an open access article distributed under Creative Commons Attribution License (CC BY 4.0), visit https://creativecommons.org/licenses/by/4.0/.
-
About this article
Cite this article
Du L, Lu C, Wang Z, Zou L, Xiong Y, et al. 2024. GFAnno: integrated method for plant flavonoid biosynthesis pathway gene annotation. Beverage Plant Research 4: e008 doi: 10.48130/bpr-0023-0041 

GFAnno: integrated method for plant flavonoid biosynthesis pathway gene annotation
- Received: 11 July 2023
- Revised: 09 December 2023
- Accepted: 14 December 2023
- Published online: 01 March 2024
Abstract: Flavonoids are important secondary metabolites synthesized by tea plants. However, inconsistencies in the variations in gene annotation methods across numerous studies, have hindered the comparison of results from previous studies. In this work, we offer 'GFAnno', an open-source software package which annotates genes and gene families based on sequence features, along with annotated parameters for 18 key genes related to the flavonoid biosynthesis pathway. The package takes a protein sequence file as input, performs gene annotation based on the identity and coverage of pre-prepared known seed protein sequences and the coverage of conserved Hidden Markov Model (HMM) domain. We used 11 dicotyledon, seven monocotyledon, and two basal angiosperm genomes to construct three datasets. We then use the seed species collection to construct seed sequences, use the test species collection to follow strict parameter selection rules, and use the validation species collection to verify the accuracy of the analysis results. The annotation results of validation collection using the filtering parameters by test collection shows that, our parameter selection can effectively exclude various structurally incomplete and abnormal proteins, while correctly distinguishing genes with high sequence similarity, such as Flavonoid 3'-Hydroxylase (F3'H) and Flavonoid 3'5'-Hydroxylase (F3'5'H) in the cytochrome P450 (CYP450). Our work aids ongoing tea plant pan-genome research by offering a convenient software for target gene annotation and sets comparative standards for analyzing the flavonoid biosynthesis pathway and conducting sequence comparison of catalytic enzymes.