


-
Citrus Pu-erh tea (CPT), also known as Ganpu tea, is a novel type of citrus blend-tea that is co-fermented with citrus peel (Citrus reticulata Blanco cv. Chachiensis) and Pu-erh tea (Camellia sinensis var. assamica)[1]. The earliest record of tea processed with citrus peel appeared 1,400 years ago in the Tang Dynasty[2]. Nowadays, thousands of enterprises have been involved in the production of citrus tea which was tailored to satisfy consumers' flavor desires along with the emergence of food-pairing hypothesis[3]. The citrus Pu-erh tea which was made by peel produced between August and September in Xinhui District of Guangdong, China, and the ripened Pu-erh tea produced in Yunnan, China so-called 'Xiao Qing Gan' is the most popular, and is familiar with most consumers[4,5]. However, few systematic studies have been conducted on its flavor.
The mellow taste and hedonistic aroma of citrus Pu-erh tea were generated during stuffing fermented tea to citrus pericarps and then redrying them together[2,6]. During the sun-drying and fermentation process, numerous enzymes and compounds were catalyzed to transform in the citrus peels, producing specific compounds with a fruity aroma[4]. For example, flavonoid glycosides such as hesperidin and phenolic acids were usually considered to be the critical flavor contributors[2,7]. Meanwhile, the degradation, oxidation, glycosylation and other reactions that occur in Pu-erh tea under conditions of high humidity and temperature with microorganisms also lead to the generation of volatile compounds[7]. The previous results have investigated the impact of different citrus species on CPT and showed that the fundamental odorants associated with the aroma of citrus blend black teas were mainly the outstanding combination of heptanal, limonene, linalool, and trans-β-ionone[8,9]. Wang et al. also demonstrated that an interaction of various volatiles originating from white tea and citrus occurred and significantly changed the properties of their olfactory properties[10]. Thus, the tangy aroma of the citrus peel is a perfect match for the mellow earthiness of Pu-erh tea, resulting in its attractive aroma.
Flavor wheel had a strong advantage for revealing the flavor characteristics of samples. Flavor wheel is a quantitative analysis tool that standardizes the quality of a sample, and flavor descriptions are organized according to categories and arranged in a disc-shaped frame that is systematic yet concise and clear[11,12]. Flavor is affected by both aroma (volatiles) and taste (non-volatiles)[13]. In 1987, Suffet et al. created the first drinking water flavor wheel containing both olfactory and gustatory descriptions to represent the diversity of odor and aroma qualities[14], while the Specialty Coffee Association of America (SCAA) developed the first flavor wheel in 1995, which has now been updated to a more detailed and comprehensive flavor wheel with three levels and nine categories[15]. The establishment and updating of flavor wheel can enable professional sensory evaluation groups or amateur consumers to have more standards and bases for judging when conducting sensory evaluations and favoritism tests[16,17], which shows that flavor wheel is instructive for the industry in new product research and development, while for academic research, it has a great advantage in revealing the composition of aroma and odor characteristics. In addition, with the flavor wheel providing the basic framework for the formation of the aroma and odor of that sample, and a rough grasp of the compounds corresponding to each kind of flavor, it can shed some light on food cooking and even flavor pairing[18,19].
Based on this, in this paper, the solvent-assisted flavor evaporation (SAFE) with high recovery rate was used to extract the three different parts of the CPT (CP, OF, IT), which was combined with the GC-MS-O method to analyze the volatile chemical components. And then the untargeted metabolomics by ultra-high-performance liquid chromatography-mass spectrometry (UHPLC-MS/MS) is to study its non-volatile compounds, in order to identify the different metabolic pathways and metabolites affecting the flavor of our CPT. After obtaining the key volatile compounds and non-volatile compounds, a more complete flavor wheel was drawn by combining both of them with the sensory evaluation results for co-analysis, so as to reveal the crucial compounds affecting the flavor of CPT brewing and the differences among the three parts of CPT. This study will significantly increase the knowledge of CPT infusion flavors and provide insights into manufacturing techniques for CPT qualities that will enable companies to improve the quality of blended tea in the future to meet the marketing standards of the products in question. It will also provide data for future flavor matching practices.
-
Citrus Pu-erh tea samples which were processed by full-sunlight withering and have been stored for five years were purchased from local tea plantations in Jiangmen City (Guangdong, China) in October 2021. In these samples, the citrus peel of Xiao Qing Gan refers to the citrus peel produced in Xinhui, Guangdong province, while Pu-erh tea refers to the sun dried green raw tea of Yunnan large leaf tea. The purchased samples were vacuum-packed and stored at room temperature until usage. Before the chemical analyses, the sample was divided into three parts: out-layer fruit (OF) peel, inside tea (IT) powder, and whole citrus Pu-erh tea (CP). Samples were ground into small particles and passed through 30 mesh filter. The infusion was prepared by the methods reported earlier[20]. Each sample was taken by 5 g and mixed with 100 mL of boiling water for 5 min to take the 1st round of extract, the residues were repeated by mixing with 75 mL of boiling water at two time intervals (3 min and 2 min respectively). Then, the three rounds of each infusion (extract) were combined after filtration and cooled in an ice bath for subsequent instrumental analysis and sensory evaluation.
The preparation of metabolites was as follows: Each powdered samples (i.e., CP, IT, OF) in 0.05 g constant weight was respectively mixed with 400 μL of methanol-acetonitrile (1:1) (v:v) solvent in a 2 mL centrifuge tube. After the mixture was ground for 6 min (−10 °C, 50 kHz) and extracted using low-temperature ultrasonic extraction for 30 min (5 °C, 40 kHz), the extract was placed at −20 °C for 30 min and then centrifuged for 15 min (13,000 g, 4 °C) to precipitate the dissolvable residues. Finally, the supernatant was taken for analysis.
Chemicals
-
The following authentic standards were commercially purchased, including (+)-limonene (≥ 99%), γ-terpinene (≥ 95%), (+)-dihydrocarvone (98%), (E)-p-mentha-2,8-dien-1-ol (98%), (−)-pinocarveol (98%), (+)-carvone (≥ 98%), perillaldehyde (98%) from Sigma-Aldrich (Shanghai, China). 2,3-dimethyl pyrazine (98%), nonanal (95%), phenol (≥ 99%), 2-pyrrolaldehyde (98%), carvacrol (99%), methyl anthranilate (99%), 2,4-di-tert-butylphenol (97%) from TCI (Shanghai, China). 2,4-dimethyl styrene (98%), piperitone (> 94%), p-cymene (99%), prenol (≥ 99.5%), decanal (97%) and limonene glycol (98%) from Aladdin (Shanghai, China). (Z)-carveol (97%), p-cymenol (99%), linalool (≥ 98%), perillalcohol (≥ 98%) from Sinopharm Chemical Reagent Co., Ltd. (Shanghai, China). 2-ethylhexanol (99%), β-pinene (95%), methyl methanthranilate (98%), palmitic acid (99%), benzophenone (99.5%), dimethyl sulfone (99%) and 1,2-dimethoxybenzene (98%) from Merck (Darmstadt, Germany). β-ionone (98%), citronellal (≥ 98%) and vanillin (99.5%) from Yuanye Bio-Technology Co., Ltd (Shanghai, China). 4-methoxyacetophenone (99%), styrene (> 99.5%), o-Cresol (≥ 99.7%), p-Cresol (≥ 99.7%), terpinen-4-ol (≥ 98%), (−)-carveol (97%) and α-terpineol (≥ 96%) from Macklin (Shanghai, China). Octanoic acid (≥ 99.9%), thymol (> 99%), lauric acid (98%), benzaldehyde (> 99%), benzyl alcohol (≥ 99%) and phenylethyl alcohol (≥ 99%) from Boer (Shanghai, China).
C7−C30 (n-alkanes) and 1,2-dichlorobenzene (internal standard) were purchased from Sigma-Aldrich (Shanghai, China). Dichloromethane, anhydrous sodium sulfate, acetone and sodium chloride were obtained from Sinopharm Chemical Reagent Co., Ltd. (Shanghai, China). All reagents were of analytical grade.
Solvent-Assisted Flavor Evaporation (SAFE)
-
Isolation of the volatiles was performed according to a typically adopted method[21]. For each sample, 100 mL of infusion and 100 μL of 1,2-dichlorobenzene (100 mg/kg, solved in acetone) were mixed and extracted with dichloromethane (3 × 100 mL) at 200 rpm using a magnetic stirrer (85-1, Shanghai Meiyingpu Instrument Manufacturing Co., Ltd., Shanghai, China) at room temperature for 3 h (3 × 1 h). Afterwards, all of the organic phase extract was combined, filtered, and concentrated to 150 mL using a rotary evaporator (RE 52-86A, Shanghai Yarong Biochemical Instrument Factory, Shanghai, China), then poured into a 500 mL distillation flask of SAFE apparatus (Glasbläserei Bahr, Manching, Germany) under a 40 °C water bath and 5 × 10⁻⁵ mbar vacuum to concentrate the organic phase, and separate the volatiles from the nonvolatile fraction. Each extract of SAFE was further concentrated to 5 mL by a rotary evaporator under 40 °C and finally concentrated to 1 mL by a nitrogen stream. The concentrate was immediately analyzed in Dr Feng's lab.
Gas Chromatography−Mass Spectrometry−Olfactometry (GC−MS−O) analysis
-
A gas chromatograph 6890A equipped with a 5975C mass selective detector (Agilent Technologies, Santa Clara, CA, USA) and an ODP-3 olfactory detection port (Gerstel, Mühlheim an der Ruhr, Germany) was used for flavor analyses. Separation of the volatiles was performed using two fused silica capillaries: HP-INNOWAX and HP-5 (both 60 m × 0.25 mm i.d., 0.25 μm film thickness; Agilent Technologies, USA) at a flow rate of 1.0 mL/min. The flow split ratio at the end of the column was 1:1 between the detector and olfactory port. The SAFE extract (2 μL) was injected into the injection port at 250 °C in a splitless mode. The oven temperature was programmed at 40 °C (held for 3 min), ramped at 5 °C /min to 100 °C (held for 1 min), then ramped to 180 °C at a rate of 3 °C /min, and ramped to 230 °C at a rate of 4 °C /min and held at 230 °C for 5 min. Mass spectrometer condition was set at electron ionization (EI) mode with the ionization energy of 70 eV and the ion source temperature of 230 °C. The scan range was 30−450 m/z in full-scan mode.
Five trained panelists (two males and three females, aged 23−42 years, nonsmokers) were selected for GC-O analysis. The retention times (RTs), odor attributes smelled from the sniffing port, and aroma intensities (AIs) were recorded. The AIs were evaluated on a five-point intensity scale: 0 (none), 3 (moderate) and 5 (strong). Each sniff was performed in triplicate and consisted of two evaluation sessions for the compounds that were eluted between 0−30 min and 31−60 min to minimize nasal discomfort and fatigue[22].
Metabolite analysis based on UHPLC–MS/MS
-
An UHPLC-Q Exactive HF-X system was used to separate and analyze the metabolites. An ACQUITY HSS T3 (100 mm × 2.1 mm i.d., × 1.8 μm; Waters, Milford, USA) column was used for chromatographic separation of the metabolites. Mobile phase A was composed of 95% water and 5% acetonitrile (containing 0.1% formic acid), and mobile phase B was composed of 47.5% acetonitrile, 47.5% isopropanol and 5% water (containing 0.1% formic acid). The injection volume was 3 μL, and the column temperature was set at 40 °C. The details of the gradient elution procedure and the experimental parameters were the same as a previous study[23].
Identification and quantification of the volatile compounds
-
Identification of the volatiles was based on mass spectra compared with NIST Mass Spectral Library 11 Vision; standard chemicals; odor descriptions of authentic, and retention indices (RI) with reference values (
https://webbook.nist.gov/chemistry/ ). The retention indices (RIx) of detected chemicals was calculated as below: RIx = 100Z + 100[(lg tx − lg tz)/(lg tz+1 − lg tz)], where Z is the number of carbon atoms of n-alkane which appears in front of the identified compound in the same GC condition; tx, tz and tz+1 are the retention time of the identified compounds, the lower alkane, and upper alkanes, respectively[24].Quantification of the volatiles was calculated according to the standard curves. Firstly, three infusion samples were extracted by dichloromethane until achieving each odorless matrix. The standard chemicals were then dissolved and diluted with the artificial odorless matrix at a concentration ranging from 50 to 30,000 mg/L for six levels (1:5, 1:25, 1:100, 1:250, 1:500 and 1:1,000). Each standard chemical matrix (100 mL) with 100 μL of 1,2-dichlorobenzene was extracted by the SAFE procedure and finally analyzed by GC-MS (As described above). Calibration curves were constructed by the following formula[24]: Ax/Ai = a(Cx/Ci) + b. A and C represent the peak area and the concentration, while x and i represent the authentic compound and internal standard, respectively. The concentration of each volatile compound was calculated based on the calibration equation above. The result was an average of three replicates. The limit of detection (LOD) and the limit of quantitation (LOQ) was defined as the concentration of a standard compound whose signal-to-noise (S/N) ratio was 3 and 10, respectively[25].
Aroma Extract Dilution Analysis (AEDA)
-
Each concentrated original solution of SAFE was stepwise diluted with dichloromethane for proportions of 1:2; 1:4; 1:8 … 1:2n and submitted to GC-O analysis under the same GC conditions as described above using an HP-INNOWAX column. The maximum dilution factor of a sample (2n) in which no odorant could be detected by GC-O was defined as the flavor dilution factor (FD)[21]. The larger FD values indicate the greater contribution of the aroma compound to the overall aroma.
Calculation of aroma contribution index
-
Odor activity value (OAV) was calculated as the ratio of the concentration to the odor detection threshold in water. Aroma character impact value (ACI) is the fraction of the sum of OAV for individual compounds in a mixture, which can further estimate the aroma contribution of individual components[26]. It is calculated as the following formula: ACI% = (Pi/Ti)/(∑Pk/Tk), where ∑P is the sum of concentration percentage of all compounds, T is the odor threshold of the compounds in the water[27].
Sensory evaluation
-
The sensory evaluation of the three infusion samples was performed using quantitative descriptive analysis. The sensory evaluation procedures were carried out according to Wang et al. with slight modification[28]. Thirty-five healthy and non-smoking assessors were recruited from the students and staff members of the School of Perfume and Aroma Technology (Shanghai Institute of Technology, Shanghai, China). A panel of 10 well-trained panelists (five males and five females with age ranging from 20−42 years) were selected for their familiarity with three infusion samples based on the enforced triangle test. Before sensory evaluation, all panelists were trained about the characteristics of infusion samples and the sensory evaluation requirements (such as the definition of quality attributes and the method of scoring) for more than 2 h per day and lasted a week to familiarize them with the descriptive terms of the infusion. Thereafter, the vocabulary of CPT infusion samples' sensory attributes was generated. In addition, the panelists were trained to reach consensus on rating the intensity of the ten defined aroma attributes, including 'sweet', 'minty', 'fruity', 'woody', 'fatty', 'phenolic', 'roasted', 'floral', 'herbal', and 'musty' which were identified using reference compounds of vanillin, dihydrocarvone, prenol, perillaldehyde, octanoic acid, 2,4-dimethyl styrene, 2-pyrrolaldehyde, benzophenone, 2-ethylhexanol, and p-cymene, respectively. Each sensory attribute was taken on a 10-point intensity scale (0−3, weak; 4−6, middle; 7−9, strong). To validate the reliability of the intensity scale, the recorded data of repeated panel performances were compared using different means of the analysis of variance (ANOVA).
The sensory analysis was performed at room temperature under daylight with individual booths. Before sensory evaluation, the infusion samples were presented in plastic cups labeled with randomly selected three-digit numbers. The assessors were asked to take three short sniffs to sense the aroma of the samples first and to rinse their mouths with pure water to minimize any residual effect. Each sample was evaluated in triplicate and carefully scored after sensory judgment.
E-tongue measurements for taste evaluation
-
The E-tongue (TS-5000Z, Insent Inc., Japan) comprises lipid membrane sensors of basic tastes (umami, sourness, sweetness, saltiness, bitterness, astringency) and corresponding aftertaste (aftertaste-astringency, aftertaste-bitterness and richness) was used. The sensors were conditioned by a conditioning, calibration and diagnostic process before the analysis. Reference solution (30 mM KCl and 0.3 mM tartaric acid aqueous) and washing solution (30% ethanol adding 100 mM hydrochloric acid for the negatively charged sensors; 100 mM potassium chloride and 10 mM potassium hydroxide for the positively charged sensors.) were prepared[29]. Three measurement phases were performed as follow: sample detection (120 s), aftertaste detection (40 s), and washing (10 s). The average taste strength value from 110 to 120 s during sample detection was calculated to be the final result. Each sample was measured in triplicate, and each tea infusion was measured four times[30].
Statistical and data processing
-
The statistical data from GC-MS was analyzed by Microsoft Excel 2019 (Microsoft, Redmond, WA, USA) and expressed as mean ± standard deviation (SD). The descriptive analysis data was evaluated by SPSS version 26.0 (SPSS Inc., Chicago, IL, USA) and performed one-way analysis of variance (ANOVA). The significant differences (p ≤ 0.05) among individual samples for each aroma attribute were identified by the SNK test. Other figures were made by Origin Pro 2021 (OriginLab Corporation, Northampton, MA, USA). The correlations between sensory attributes and volatile compounds were analyzed by PLSR using the Simca 14.1 (Umetrics, Sweden). The identification of metabolites was based on biochemical databases, such as the Kyoto Encyclopedia of Genes and Genomes (KEGG) (
www.genome.jp/kegg ). The data were analyzed on the online platform of Majorbio Cloud Platform. Heatmap and bubble diagram were employed using the scipy (Version 1.0.0) Python on the Majorbio Cloud Platform (https://cloud.majorbio.com ). -
The sensory evaluation of the three samples (CP, IT, OF) showed significantly different results (p ≤ 0.01 or p ≤ 0.001) (Supplemental Table S1). As shown in Fig. 1a, the CP sample had more prominent aromas in characteristics of phenolic (7.75), fatty (6.00) and minty (4.75) flavors, the IT sample had more roasted (7.25), musty (8.00) and herbal (7.25) aromas, and the OF sample outperformed the other two samples in woody (3.00), fruity (3.25), and floral (7.00) aroma attributes. However, these three samples had similar scores in the aroma of fruity attribute (IT = 2.75, OF = 3.25, CP = 2.25, p ≤ 0.01).
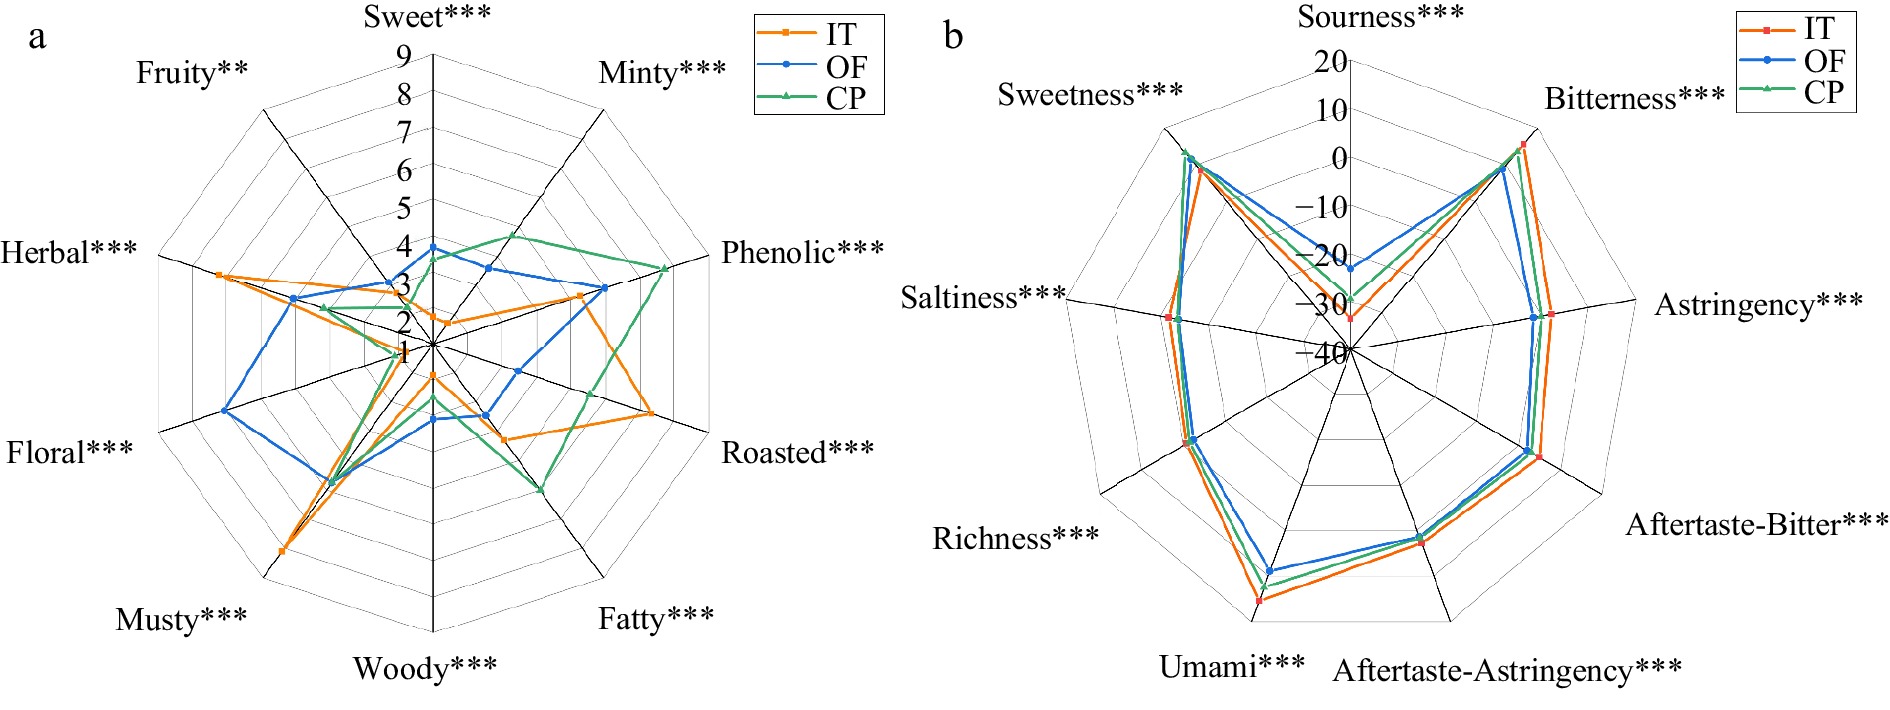
Figure 1.
Sensory spider plot of three CPT infusion samples, (a) sensory evaluation of three CPT samples based on ten aroma attributes, (b) taste profiles of three CPT samples by E-tongue. Note: *, ** and *** significant at p ≤ 0.05, p ≤ 0.01 and p ≤ 0.001.
Figure 1b showed the significant difference (p ≤ 0.01) in the taste attributes of three CPT infusion samples according to the data of Supplemental Table S2 analyzed by E-tongue. Except for the sweetness and sourness, all the other seven attributes showed the highest scores in the IT sample and the lowest scores in the OF sample. This indicates that the taste attributes' intensity of CP sample was moderated by the IT and OF. For the score of sweetness attribute, it seems there is a synergistic effect between the OF and IT, making the CP samples with the highest score in sweetness. Overall, the differences in the scores of the aromas and taste attributes among the three CPT samples were obvious, which could be clearly distinguished even after years of co-fermentation. Thus, the differences in their specific substances deserve further study.
Identification and quantitation of volatiles by SAFE-GC-MS-O
-
Based on the four identification methods (Table 1), 47 volatile compounds were identified, including six alkenes, six phenols, 14 alcohols, seven aldehydes, six ketones, two esters, three acids, and three others. The aroma descriptions and FD factors of aroma-active compounds determined by AEDA were also listed (Table 1). Compounds with low FD factors are assumed to be less or not important for odor impressions[22]. The results showed that the FD factor of one compound varied greatly from sample to sample. For example, 2,4-dimethyl styrene (FD = 2,048), α-terpineol (FD = 1,024), p-cymenol (FD = 128), 2-ethylhexanol (FD = 2,048), and phenylethyl alcohol (FD = 16) were determined in the IT sample, but those compounds had no or much lower FD factors in the CP and OF samples. This indicates that these compounds contributed more to the aroma profile of the IT samples. Similarly, benzyl alcohol (FD = 2,048), nonanal (FD = 64), and dihydrocarvone (FD = 16) showed higher FD values in the OF sample than in IT and CP samples. Nevertheless, some compounds with larger FD values in CP, such as p-cymene (1,024), carvacrol (1,024), thymol (1,024), linalool (8), (+)-carvone (1,024), methyl methanthranilate (2,048), and methyl anthranilate (1,024), also showed higher values both in IT and OF samples. The above results were initially obtained by the AEDA sniffing method to screen the key aroma-active compounds of each sample, which are needed for validation.
Table 1. Identification analysis of volatile compounds in citrus Pu-erh tea samples.
No. Compounds RIa Aroma descriptionb FDc IMd HP-INNOWAX HP-5MS cal. ref. cal. ref. IT OF CP Alkenes A1 styrene 1295 1272 − 890 sweet, balsam, floral(acacia) 2 1 − MS, RI, S, O A2 β-pinene 1135 1115 − 978 woody, pine, hay, green 2 − − MS, RI, S, O A3 (+)-limonene 1232 − 1001 − citrus, herbal, sweet 4 4 4 MS, RI, S, O A4 γ-terpinene 1277 1255 − 1064 oily, woody, lime, herbal − 1 − MS, RI, S, O A5 p-cymene 1305 1280 1103 1026 musty, woody, spice 1024 1024 1024 MS, RI, S, O A6 2,4-dimethyl styrene 1459 1433 1076 1078 phenolic, spicy, soil, plastic 2048 64 2 MS, RI, S, O Phenols B1 phenol 2037 2028 − 981 phenolic, plastic, rubber 2 − 4 MS, RI, S, O B2 o-cresol 1998 2010 1060 musty, phenolic, herbal, leathery 1 − 1 MS, RI, S, O B3 p-cresol 2950 2079 1097 1098 phenolic, floral(narcissus) − − 8 MS, RI, S, O B4 carvacrol 2226 2225 1296 1307 spice, woody, phenolic 2048 1024 1024 MS, RI, S, O B5 thymol 2239 2172 1292 1297 herbal, phenolic, roasted 1024 1024 1024 MS, RI, S, O B6 2,4-di-tert-butylphenol 2323 2330 1512 1513 phenolic − 2048 2048 MS, RI, S, O Alcohols C1 prenol 1340 1323 − 778 fruity, green, floral(lavender) 2 4 − MS, RI, S, O C2 linalool 1553 1549 1101 1104 herbal, green, floral(rose), 16 8 8 MS, RI, S, O C3 α-terpineol 1714 1170 1190 1191 pine, citrus, woody, floral(lilac) 1024 512 32 MS, RI, S, O C4 Z-carveol 1842 1869 1220 1220 vegetable,green, caraway 16 8 4 MS, RI, S, O C5 p-cymenol 1868 1851 1185 1188 sweet, fruity(cherry), camphor 128 8 4 MS, RI, S, O C6 (-)-carveol 1884 1846 1231 1225 minty, green, herbal, spicy − 4 4 MS, RI, S, O C7 limonene glycol 2298 2325 1345 1342 minty, roasted, 2 1 1 MS, RI, S, O C8 perillalcohol 2018 2021 − 1300 spicy(cardamom), floral(violet) 1 2 1 MS, RI, S, O C9 benzyl alcohol 1903 1885 − 1034 floral(rose), phenolic − 2048 2 MS, RI, S, O C10 2-ethylhexanol 1496 1490 − 1026 citrus, fresh, floral, oil, sweet 2048 4 − MS, RI, S, O C11 terpinen-4-ol 1602 1636 1177 herbal, woody, earthy, musty 4 32 64 MS, RI, S, O C12 (-)-pinocarveol 1679 1666 1137 1140 warm, woody, fennel, cereal − 4 2 MS, RI, S, O C13 phenylethyl alcohol 1940 1923 − 1121 floral(rose) 16 − − MS, RI, S, O C14 (E)-p-mentha-2,8-dien-1-ol 1645 1641 1120 1121 fatty, popcorn, minty 4 4 1024 MS, RI, S, O Aldehydes D1 vanillin 2615 2550 1397 1394 sweet(chocolate), creamy − 1 4 MS, RI, S, O D2 nonanal 1410 1396 − 1102 waxy, fatty, orange − 64 − MS, RI, S, O D3 decanal 1513 1504 − 1195 sweet, waxy, citrus(orange), floral 4 − − MS, RI, S, O D4 citronellal 2023 1488 − 1158 sweet, floral, herbal, waxy, citrus − 4 − MS, RI, S, O D5 benzaldehyde 1556 1529 − 961 almond, fruity(cherry) 16 8 − MS, RI, S, O D6 perillaldehyde 1814 1807 1276 1279 woody, pine, sweet(balsam), minty − 32 16 MS, RI, S, O D7 2-pyrrolaldehyde 2065 2048 1013 1015 musty, beefy, burnt, roasted, smoky 1024 − 1024 MS, RI, S, O Ketones E1 dihydrocarvone 1636 1645 1198 1200 herbal, minty, rubber, rice − 16 8 MS, RI, S, O E2 β-ionone 1964 1953 1485 1490 powdery, floral(orris), woody − 8 − MS, RI, S, O E3 piperitone 1758 1743 1266 1268 woody, minty, camphor − 8 4 MS, RI, S, O E4 (+)-carvone 1764 1744 1244 1245 minty, fruity, spice 1024 2048 1024 MS, RI, S, O E5 benzophenone 2533 2505 − 1625 floral (rose, geranium) 4 4 2 MS, RI, S, O E6 4-methoxyacetophenone 2106 2120 1341 1345 fatty, sweet, anisic 2 − 2 MS, RI, S, O Esters F1 methyl methanthranilate 2100 2068 1408 1402 fruity, musty, sweet 2048 2048 2048 MS, RI, S, O F2 methyl anthranilate 2283 2257 − 1338 floral (orange flower), fruity(grape) 1024 2048 1024 MS, RI, S, O Acids G1 octanoic acid 2033 2070 1191 fatty, waxy, rancid, oily, green, cheesy 2 1 4 MS, RI, S, O G2 lauric acid 2489 2502 1570 fatty, fruity(coconut), oily 2 − 2 MS, RI, S, O G3 palmitic acid 2512 2890 1968 1964 phenolic, waxy, fatty − 2 4 MS, RI, S, O Others H1 dimethyl sulfone 1944 1912 − 915 roasted, sulfurous, burnt 2 2 2 MS, RI, S, O H2 2,3-dimethyl pyrazine 1373 1352 − 911 nutty, butter, coffee, caramel, roasted 4 − − MS, RI, S, O H3 1,2-dimethoxybenzene 1743 1740 1145 1143 musty, creamy, phenolic, sweet 2 − 1 MS, RI, S, O a Retention index of compounds on an HP-INNOWAX column and HP-5MS column. Cal means the RI value calculated by the formula. Ref means the RI value confirmed by comparison retention index to reference standards in the same condition (https://webbook.nist.gov/). b Aroma description. The aroma description vocabulary was generated by the GC-O evaluation team by comparing the aroma characteristics at actual concentrations with the literature and spectral library descriptions. c FD factor, flavor dilution factor determined on a HP-INNOWAX column. '−' means not being detected. d Identification method: MS means identified by comparison with the NIST mass spectral library 11 Vision database; RI means confirmed by comparison retention index; S means confirmed by authentic standard chemicals; O means confirmed by aroma descriptor. The concentration of each individual compound was determined by its standard curve (Supplemental Table S3) and listed in Table 2. Figure 2a presents the chemical profiles of the 47 compounds. There was a same trend in categories of alcohols, esters, ketones and alkenes, with the lowest percentage levels in the CP samples among the three samples. Alcohols, including straight-chain and branched alcohols derived from the reduction of Strecker aldehydes or the hydrolysis of glycoside precursors were regarded as the third largest group of volatiles detected in teas[13]. Under the influence of citrus peel, it occupies the largest proportion among the detected compounds in the three samples, with a percentage of 45% (IT), 44% (OF), and 34% (CP). Alkenes are the most important volatile components in citrus fruits[10]. Phenols (27%) and acids (10%) had the highest percentage levels in the CP samples among all three samples. As shown in Fig. 2b, the color coding changed from green to gray, reflecting the chemical concentration decreasing from high to low levels. The concentration of the same compound varied considerably among different samples, which also reflected the differences of the FD factors of compounds in different samples in the qualitative results mentioned above.
Table 2. Quantitative analysis of volatile compounds in citrus Pu-erh tea samples.
No. Compounds OT (mg/kg)A Concentration (mg/kg)B OAVC ACI%D IT OF CP IT OF CP IT OF CP A1 styrene 0.065 26.54a 8.29b − 408.26 127.49 − 0.0526 0.0041 − A2 β-pinene 0.14 4.09a − − 29.24 − − 0.0038 − − A3 (+)-limonene 0.034 233.62a 159.49b 120.07c 6871.15 4691.00 3531.55 0.8852 0.1513 0.9724 A4 γ-terpinene 1 − 37.35a − − 37.35 − − 0.0012 − A5 p-cymene 7.2 94.59a 80.77b 76.74c 13.14 11.22 10.66 0.0017 0.0004 0.0029 A6 2,4-dimethyl styrene 0.085 16.71c 30.69b 56.52a 196.62 361.01 664.97 0.0253 0.0116 0.1831 B1 phenol 5 179.14a − 150.89b 35.83 − 30.18 0.0046 − 0.0083 B2 o-cresol 1.4 19.59b − 20.07a 14.00 − 14.34 0.0018 − 0.0039 B3 p-cresol 0.0039 − − 83.12a − − 21311.63 − − 5.7137 B4 carvacrol 2.29 1070.68c 1413.74b 2900.15a 467.54 617.35 1266.44 0.0602 0.0199 0.3487 B5 thymol 1.7 1215.72a 590.69c 1011.75b 715.13 347.46 595.14 0.0921 0.0112 0.1542 B6 2,4-di-tert-butylphenol 0.5 − 120.60b 955.01a − 241.20 1910.02 − 0.0078 0.5259 C1 prenol 0.25 1.78b 2.88a − 7.12 11.54 − 0.0009 0.0004 − C2 linalool 0.00022 150.37a 69.68b 58.20c 683488.63 316718.51 264532.69 88.0482 10.2151 72.8359 C3 α-terpineol 1.2 1139.07a 883.02b 694.31c 949.23 735.85 578.59 0.1223 0.0237 0.1593 C4 Z-carveol 0.25 1732.26c 2991.85a 2243.32b 6929.04 11967.40 8973.28 0.8926 0.3860 2.4707 C5 p-cymenol ND 607.73b 713.37a 445.52c − − − − − − C6 (-)-carveol 0.25 − 285.04a 274.93b − 1140.16 1099.72 − 0.0368 0.3028 C7 limonene glycol ND 610.42a 148.96c 474.19b − − − − − − C8 perillalcohol 1.1 169.07b 279.38a 147.65c 153.70 253.98 134.23 0.0198 0.0082 0.0370 C9 benzyl alcohol 2.54 − 69.75a 48.40b − 27.46 19.05 − 0.0009 0.0052 C10 2-ethylhexanol 0.3 333.98a 42.32b − 1113.25 141.07 − 0.1434 0.0045 − C11 terpinen-4-ol 1.2 282.27a 220.39b 155.74c 235.22 183.66 129.78 0.0303 0.0059 0.0357 C12 (-)-pinocarveol ND − 93.72a 78.28b − − − − − − C13 phenylethyl alcohol 0.086 177.55a − − 2064.56 − − 0.2660 − − C14 (E)-p-mentha-2,8-dien-1-ol ND 1658.63b 1349.01c 1829.85a − − − − − − D1 vanillin 0.053 − 402.51a 356.40b − 7594.58 6724.47 − 0.2449 1.8515 D2 nonanal 0.0011 − 28.40a − − 25817.10 − − 0.8327 − D3 decanal 0.003 54.60a − − 18200.57 − − 2.3446 − − D4 citronellal 0.006 − 58.38a − − 9729.28 − − 0.3138 − D5 benzaldehyde 0.75 98.19a 23.93b − 130.92 31.91 − 0.0169 0.0010 − D6 perillaldehyde 0.03 − 134.70a 75.84b − 4490.11 2528.15 − 0.1448 0.6961 D7 2-pyrrolaldehyde 65 225.12a − 147.44b 3.46 − 2.27 0.0004 − 0.0006 E1 dihydrocarvone 3.25 − 82.27b 128.87a − 25.31 39.65 − 0.0008 0.0109 E2 β-ionone 0.000007 − 18.17a − − 2595440.13 − − 83.7102 − E3 piperitone 0.68 − 55.93a 28.08b − 82.25 41.29 − 0.0027 0.0114 E4 (+)-carvone 0.16 1285.06b 1406.29a 1215.37c 8031.61 8789.32 7596.06 1.0346 0.2835 2.0915 E5 benzophenone ND 149.77c 591.43a 157.09b − − − − − − E6 4-methoxyacetophenone ND 76.68b − 94.61a − − − − − − F1 methyl methanthranilate 0.349 2611.54b 2902.11a 2352.80c 7482.93 8315.50 6741.56 0.9640 0.2682 1.8562 F2 methyl anthranilate 0.003 116.02b 307.63a 105.30c 38672.96 102541.93 35101.20 4.9819 3.3073 9.6647 G1 octanoic acid 3 27.78b 4.16c 64.19a 9.26 1.39 21.40 0.0012 0.0000 0.0059 G2 lauric acid 10 175.08b − 431.46a 17.51 − 43.15 0.0023 − 0.0119 G3 palmitic acid 10 − 337.30b 1437.30a − 33.73 143.73 − 0.0011 0.0396 H1 dimethyl sulfone ND 243.11b 145.86c 492.16a − − − − − − H2 2,3-dimethyl pyrazine 0.8 20.18a − − 25.23 − − 0.0033 − − H3 1,2-dimethoxybenzene ND 389.68a − 92.04b − − − − − − A The odor detection thresholds in water were obtained from previous studies[12,45] and online database (www.vcf-online.nl/VcfHome.cfm). B Concentration (mg/kg), The concentration of each volatile compound was calculated based on the calibration equation in Supplemental Table S3. C OAV (Odor activity value). D ACI (Aroma character impact value). All results were expressed as mean value (n = 3). Values bearing different lowercase letters (a, b, c) were significantly different (p ≤ 0.05). 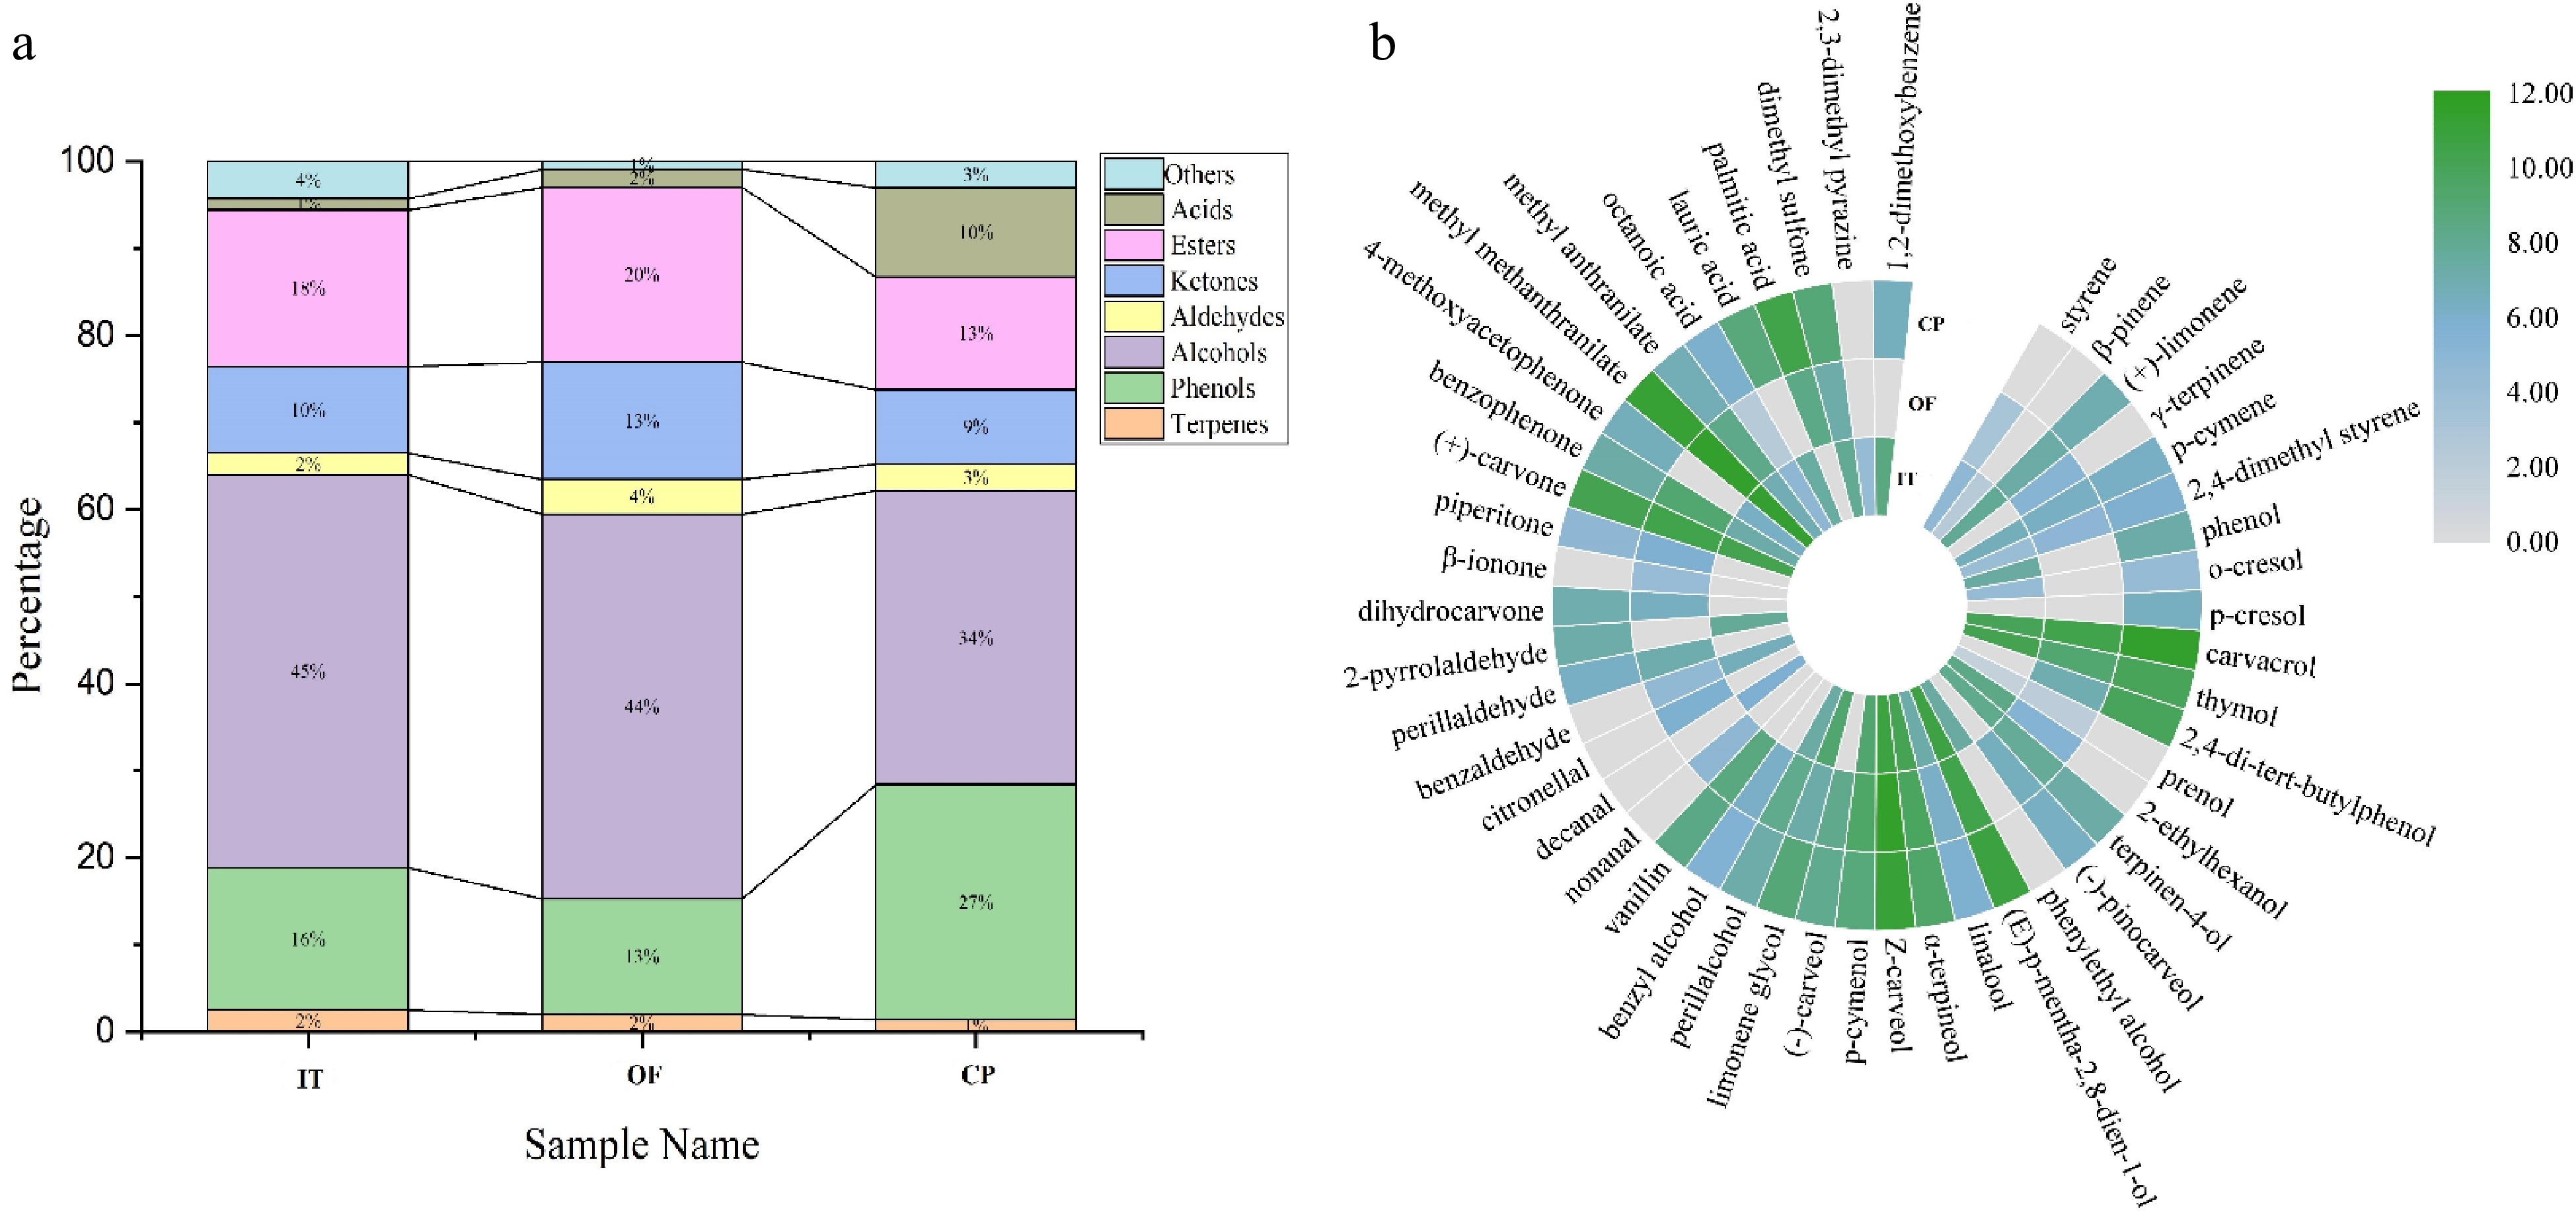
Figure 2.
Distribution map of volatile aroma substances, (a) species distribution profile of volatile compounds, (b) concentration distribution of each volatile compounds in three CPT infusion samples.
Evaluation and validation of key aroma-active compounds
-
Odor activity value (OAV) and aroma character impact value (ACI) were calculated for quantitative assessment of the contribution of key aroma-active compounds to the overall aroma for a particular sample (Table 2)[27,31]. OAV ≥ 1 were considered to contribute significantly to the overall aroma of the samples[32]. The number of compounds with OAV values greater than one was 27, 30 and 27 for IT, OF and CP, respectively. The top ten key aroma-active compounds in the CP sample were linalool (OAV = 264,532), methyl anthranilate (OAV = 35,101), p-cresol (OAV = 21,311), Z-carveol (OAV = 8,973), (+)-carvone (OAV = 7,596), methyl methanthranilate (OAV = 6,741), vanillin (OAV = 6,724), (+)-limonene (OAV = 3,531), perillaldehyde (OAV = 2,528), 2,4-di-tert-butylphenol (OAV = 1,910). Notably, compounds with high concentration does not necessarily have a high OAV value, which is determined by its odor threshold. Although the content of linalool was far below than others, its olfactory detection threshold of 0.00022 mg/kg made it as the key aroma-active compound in all three samples[8]. This phenomenon was also observed in the IT and OF samples. For example, the extremely low odor thresholds of ionone (0.007 µg/kg), resulted in a high FD (8) and OAV. Three more substances were also ranked in the top ten aroma-impact volatiles in the OF samples based on their OAV values: β-ionone (OAV = 2,595,440), nonanal (OAV = 25,817), and citronellal (OAV = 9,729). Similarly, decanal (OAV = 18,200), phenylethyl alcohol (OAV = 2,064), 2-ethylhexanol (OAV = 1,113) and α-terpineol (OAV = 949) were considered to have played important roles in the aroma contribution in IT. ACI results revealed more information of volatiles in three samples, linalool (88, 10, 72), β-ionone (−, 84, −), methyl anthranilate (5, 3, 10), (+)-carvone (1, 0.3, 2), methyl methanthranilate (1, 0.3, 1.9), (+)-limonene (0.9, 0.1, 1), p-cresol (−, −, 5.7), Z-carveol (0.9, 0.4, 2.5), phenylethyl alcohol (0.3, −, −), perillaldehyde (−, 0.1, 0.7), citronellal (−, 0.3, −), decanal (2, −, −), nonanal (−, 0.8, −), vanillin (−, 0.2, 1.9), α-terpineol (0.1, 0.02, 0.2), 2-ethylhexanol (0.1, 0.005, −), (−)-carveol (−, 0.04, 0.3), 2,4-di-tert-butylphenol (−, 0.01, 0.5), thymol (0.1, 0.01, 0.1), carvacrol (0.1, 0.02, 0.3) and 2,4-dimethyl styrene (0.02, 0.01, 0.2). The aforementioned 21 volatile compounds had high ACI values in the corresponding samples and their corresponding OAV values were also high. They could be categorized as the key aroma-active compounds corresponding to the three samples.
To further confirm the key aroma-active compounds in the CPT samples, aroma recombination was conducted to initially simulate the aroma of each sample based on quantitative results (Fig. 3)[26]. Statistical analysis revealed a significant difference on one or two odor attributes (p ≤ 0.05). On this basis, further aroma omission experiments were carried out to verify the contribution of a specific group or individual aroma compounds to the overall aroma (Table 3). Significance results were derived from the frequency of sniffing by the evaluators. For the CP samples, the volatile compounds that had a significant effect on the overall aroma were methyl methanthranilate (N = 15, N means the number of being recognized), methyl anthranilate (N = 15), linalool (N = 14), (+)-carvone (N = 13), vanillin (N = 13), Z-carveol (N = 13), 2,4-dimethyl styrene (N = 11), (+)-limonene (N = 9), (−)-carveol (N = 8), terpinen-4-ol (N = 8), 2,4-di-tert-butylphenol (N = 8), and thymol (N = 8). For the OF sample, β-ionone (N = 13), citronellal (N = 12) and nonanal (N = 8) also had significant effects on the overall aroma. In the IT sample, styrene (N = 11), decanal (N = 9) and benzaldehyde (N = 8) were more deficient. The result showed that the key aroma-active compounds of all three CPT samples were captured in the absence experiment, with a more consistent overall aroma but also more distinct individual characteristics. The results of this aroma omission experiment are consistent with the conclusions of the top ranked compounds calculated from the OAV values and ACI values.
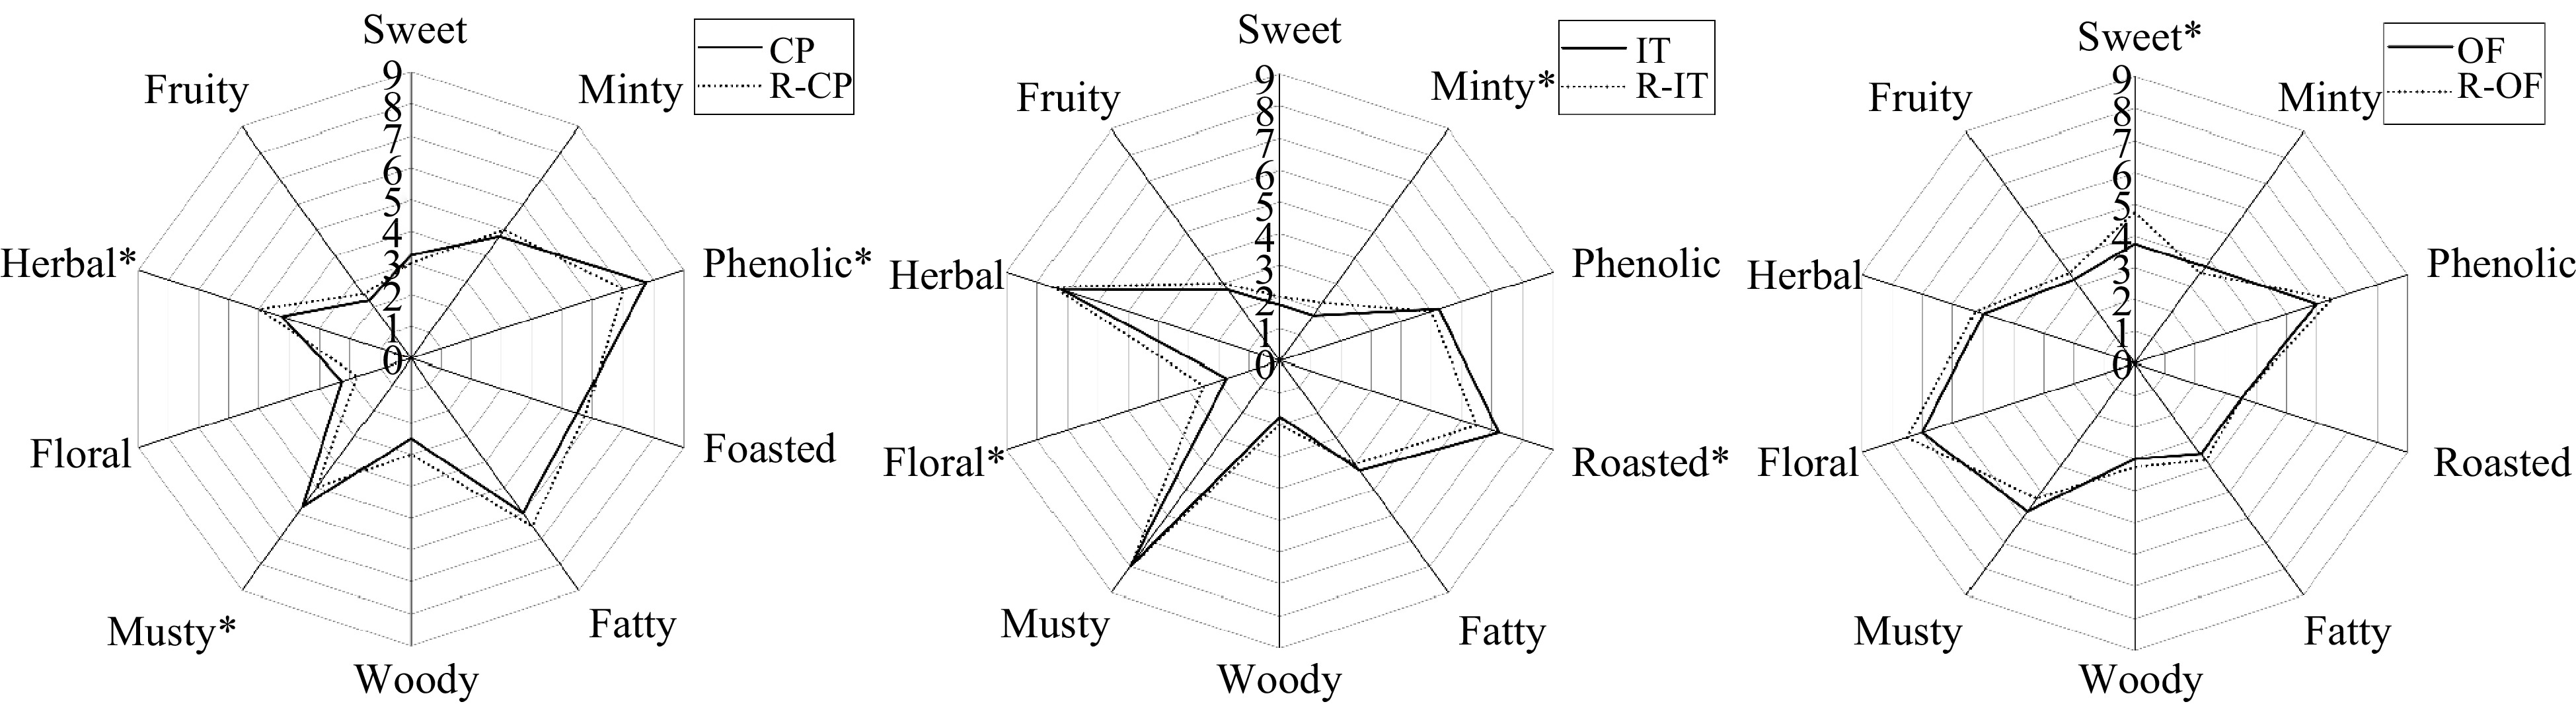
Figure 3.
Descriptive sensory analysis radar diagram of recombination model and corresponding CPT samples. Note: The sensorial parameters indicated with * are significantly different between samples (p ≤ 0.05).
Table 3. Omission tests of three citrus Pu-erh tea based on aroma recombination model.
No. Odorants omitted from the complete recombinant Numbera Significanceb IT OF CP IT OF CP 1 octanoic acid, lauric acid, palmitic acid 6 9 11 * ** ** 1−1 octanoic acid 5 6 5 * * * 1−2 lauric acid 5 2 5 * − * 1−3 palmitic acid 2 6 7 − * * 2 thymol, carvacrol, phenol, o-cresol, p-cresol, 2,4-di-tert-butylphenol 8 7 9 ** * ** 2−1 thymol 9 8 8 ** ** ** 2−2 carvacrol 6 7 7 * * * 2−3 phenol 4 1 5 * − * 2−4 o-cresol 5 3 4 * − * 2−5 p-cresol 2 4 8 − * * 2−6 2,4-di-tert-butylphenol 8 7 8 ** * ** 3 linalool, perillalcohol, p-cymenol, limonene glycol, terpinen-4-ol, prenol, 2-ethylhexanol 15 15 15 *** *** *** 3−1 linalool 14 15 14 *** *** *** 3-2 perillalcohol 5 6 5 * * * 3−3 p-cymenol 2 3 2 − − − 3−4 limonene glycol 1 2 3 − − − 3−5 terpinen-4-ol 8 9 8 ** ** ** 3−6 prenol 5 4 1 * * − 3−7 2-ethylhexanol 6 5 3 * * − 4 phenylethyl alcohol, α-terpineol, (E)-p-mentha-2,8-dien-1-ol, (−)-pinocarveol, benzyl alcohol, (−)-carveol, Z-carveol 15 14 15 *** *** *** 4−1 phenylethyl alcohol 6 1 2 * − − 4−2 α-terpineol 8 7 7 ** * * 4−3 (E)-p-mentha-2,8-dien-1-ol 1 2 2 − − − 4−4 (−)-pinocarveol 2 2 3 − − − 4−5 benzyl alcohol 3 7 6 − * * 4−6 (−)-carveol 3 7 8 − * ** 4−7 Z-carveol 14 13 13 *** *** *** 5 p-cymene, β-pinene, styrene, 2,4-dimethyl styrene, (+)-limonene, γ-terpinene, 1,2-dimethoxybenzene 13 11 11 *** ** ** 5−1 p-cymene 6 6 5 * * * 5−2 β-pinene 6 3 3 * − − 5−3 styrene 11 3 3 ** − − 5−4 2,4-dimethyl styrene 10 9 11 ** ** ** 5−5 (+)-limonene 15 10 9 *** ** ** 5−6 γ-terpinene 3 7 2 − * − 5−7 1,2-dimethoxybenzene 3 2 1 − − − 6 benzaldehyde, 2-pyrrolaldehyde, perillaldehyde, decanal, nonanal, citronellal, vanillin 9 12 13 ** *** *** 6−1 benzaldehyde 8 4 1 ** * − 6−2 2-pyrrolaldehyde 6 3 7 * − * 6−3 perillaldehyde 2 7 6 − * * 6−4 decanal 9 2 2 ** − − 6−5 nonanal 3 8 4 − ** * 6−6 citronellal 4 12 5 * *** * 6−7 vanillin 5 12 13 * *** *** 7 2,3-dimethyl pyrazine, methyl methanthranilate, methyl anthranilate, dimethyl sulfone 14 15 15 *** *** *** 7−1 2,3-dimethyl pyrazine 6 3 4 * − * 7−2 methyl methanthranilate 14 15 15 *** *** *** 7−3 methyl anthranilate 13 14 15 *** *** *** 7−4 dimethyl sulfone 5 3 3 * − − 8 (+)-carvone, dihydrocarvone, piperitone, benzophenone, 4-methoxyacetophenone, β-ionone 13 14 15 *** *** *** 8−1 (+)-carvone 12 13 13 *** *** *** 8−2 dihydrocarvone 3 6 7 − * * 8−3 piperitone 4 7 8 * * ** 8−4 benzophenone 4 5 4 * * * 8−5 4-methoxyacetophenone 2 3 4 − − * 8−6 β-ionone 4 13 5 * *** * a The number of panelists who perceived the aroma difference by means of a triangle test. Fifteen panelists were invited for aroma omission experiment. b Levels of significance, defined based on the number of panelists who were able to determine the difference in aroma omission. −, not significant (0−3, p > 0.05); *, significant (4−7, p ≤ 0.05); **, highly significant (8-11, p ≤ 0.01); ***, very highly significant (12−15, p ≤ 0.001). Relationship between key aroma-active compounds and sensory evaluation
-
After confirming the key aroma-active compounds, the correlation between the sensory evaluation scores and the quantitative results of each substance obtained from the instrumental analysis were established using the PLSR model (Fig. 4). Three parallel experiments showed good reproducibility of results, and the same group of samples clustered in similar positions in the results. The ten sensory evaluation descriptors can also be better distinguished from each other. The experimental results have clearly reflected the correlation between the sensory evaluation results and the compounds, according to the correlation coefficient R2, X1 = 0.488, X2 = 0.436, and the summation reach 0.924[2].
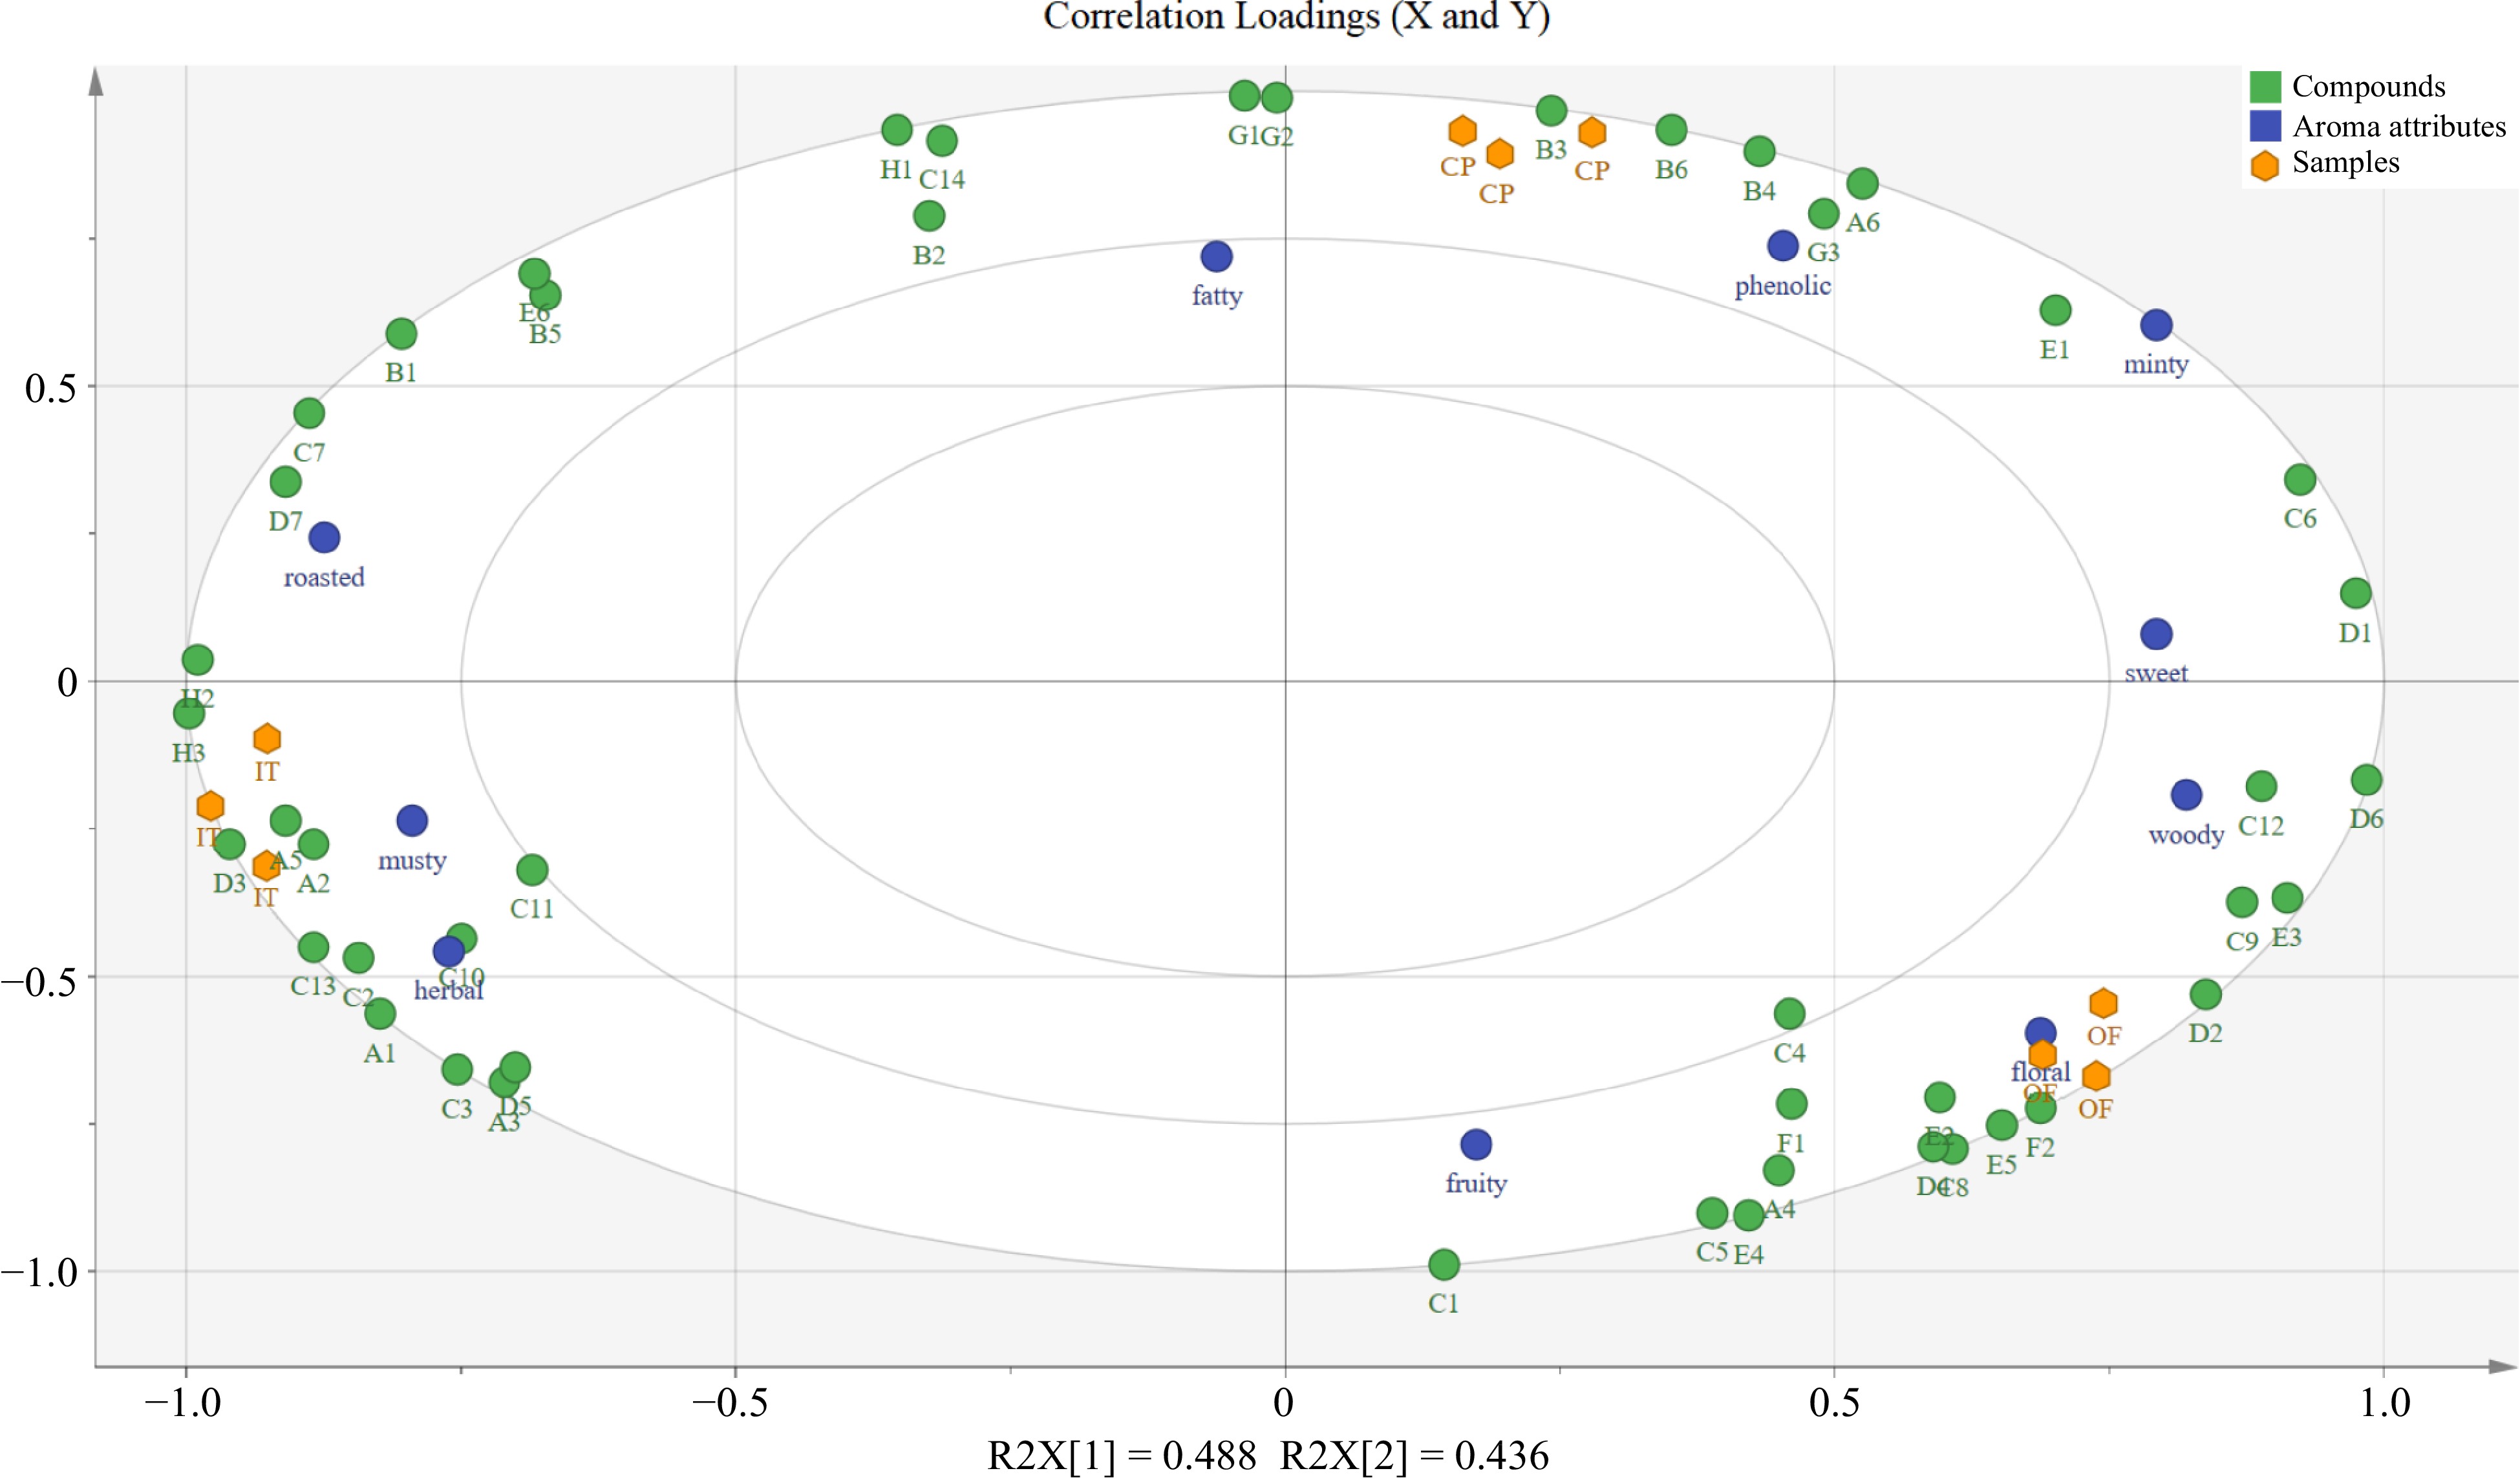
Figure 4.
Correlation loadings plot for aroma-active compounds (X-matrix) and sensory attributes (Y-matrix) of three CPT samples.
The CP samples were mainly located in the upper right corner and associated closely with aroma attributes such as fatty, phenolic and minty flavors. Among them, compound G1 (octanoic acid) has a strong correlation with fatty. Pang et al.[20] also identified octanoic acid in Pu-erh tea and described its flavor as 'sweaty' with a higher concentration. The perception is indeed different depending on the concentration. Phenols were considered a major class of volatiles giving smoky, and phenolic characteristics to Pu-erh tea[13]. Compounds B4 (carvacrol), B6 (2,4-di-tert-butylphenol), and B3 (o-cresol) are more inclined to present phenolic aroma attributes. B5 (thymol) is responsible for phenolic, roasted or woody flavor and was also detected in oolong tea. E1 (dihydrocarone) has a strong association with minty flavor. The OF samples were mainly located in the lower right corner, and close to the four aroma attributes of fruity, floral, woody, and sweet notes. This result is consistent with its higher scoring of those aroma attributes in the sensory evaluation (Fig. 1a). In particular, F1 (methyl methanthranilate, alternate name dimethyl anthranilate) is reported as a volatile marker in citrus peel with a fruity and sweet note[10,33]. F2 (methyl anthranilate) was widely recognized as a grape flavor compound, and has been detected widely in teas deriving from anthranolic acid[10,34,35]. In this experiment, both F1 and F2 were considered as the top five key aroma-active compound of CPT samples with high FD values and high OAV values. E5 (benzophenone) and E2 (β-ionone) have a more significant floral aroma. β-ionone is obviously a significant contributor to the aroma of dark teas formed from carotenoid degradation[36]. D1 (vanillin) has a strong correlation with sweet. In the IT sample located in the lower left corner of Fig. 3, the main aroma characteristics were roasted, musty, and herbal notes. Three sensory attributes are close to each other and the flavor compounds are clustered. A3 ((+)-limonene) was determined to contribute the most to the aroma quality of the corresponding citrus[8,33]. C2 (linalool) is a nearly ubiquitous aroma compound in plants which shows a herbal-like note in the specific concentration in this study[35,36]. Combining the aroma descriptions of single compound standards, it can be concluded that compounds like C11 (terinen-4-ol) and C10 (2-ethylhexanol) are more associated with herbal aroma attributes. Terpinen-4-ol and α-terpineol are isomers, both have a pleasant herbal-like odor similar to lilacs[32]. Compounds like A5 (p-cymene) are the main compounds that cause the samples to produce musty aroma attributes. Wang et al. supposed that p-cymene may come from both citrus and tea leaves, and there might be the simple additive effects between the volatile compounds of pure tea and citrus[8]. The p-cymene content was inversely related to the maturity of the citrus fruit, that is, the lower the citrus maturity, the higher the content of this component[10]. Some compounds located in the upper left corner of Fig. 3, which were less relevant in terms of aroma matching, probably because these compounds were detected in only one sample (IT or CP or OF).
Among these compounds, combining the FD factors, OAV and ACI values calculated earlier, the key aroma-active compounds can be categorized into the following aroma notes, such as sweet (vanillin); floral (β-ionone); fruity (methyl anthranilate, methyl methanthranilate, citronellal, (+)-carvone, Z-carveol); roasted (thymol); musty (p-cymene), woody (perillaldehyde); herbal (linalool, (+)-limonene, α-terpineol, 2-ethylhexanol); phenolic (2,4-di-tert-butylphenol, p-cresol, carvacrol, 2,4-dimethyl styrene); minty (dihydrocarvone); fatty (octanoic acid).
Identification of non-volatiles related to the taste of CPT
-
Non-volatile substances in three CPT samples were identified by non-targeted metabolomics. Each sample was repeated by six times, and analyzed by the multivariate statistical analysis (Supplemental Fig. S1), which showed that the three samples had significant differences, and a total of 2,743 metabolites were detected, of which a total of 1,890 were the same metabolites. Tea flavonoids are widely recognized as critical flavor contributors and crucial health-promoting bioactive compounds, and have long been the focus of research worldwide in food science[37]. Figure 5 is a heat map showing the KEGG metabolic pathway enrichment, in which each dot represents a metabolic pathway, and shows the top 20 metabolic pathways participating in the experimental project. Among them, glucosinolate biosynthesis and flavonoid biosynthesis showed significant differences form others (p ≤ 0.05). A total of 29 compounds were involved in the two metabolic pathways, of which 14 compounds contributed to taste (Fig. 6). Four compounds in the CP samples were derived from the citrus peel. For example, neohesperidin is a flavanone glycoside, which has been found in different citrus fruits, is widely used as a natural source to produce neohesperidin dihydrochalcone, a semisynthetic sweetener used in the food industry[38]. Leucopelargonidin belongs to anthocyanidin, compared with leucoanthocyanidin and leucodelphinidin, it often as a minor component was established and contribute both bitterness and astringency[39,40]. Some amino acids, such as Tryptophan, Tyrosine, homomethionine were increased after withering, which contributed to the umami and sweet, mellow taste of tea[41,42]. Most flavan-3-ols (mainly EGCG, ECG, GC, and other catechins) were found to be strongly correlated with the bitter and puckering astringent tastes, different from the mouth-drying or velvety-like astringent taste of flavanols glycosides. Aromadendrin levels decreased significantly as yellowing duration, and the umami and sweetness also decreased at the same time[43]. Chlorogenic acid and desmethylxanthohumol contribute to bitterness[44,45]. Sakuranetin and taxifolin have the potential of bitter-masking, which can enhance 'sweet' and suppressed 'sour', 'bitter', 'astringent' and 'aftertaste'[46, 47]. Since flavan-3-ols are thought to be associated with the bitterness and astringent tastes, Xu et al.[2] supposed that citrus peel could speed up the fermentation of Pu-erh tea so as to contribute to the unique flavor of citrus Pu-erh tea.
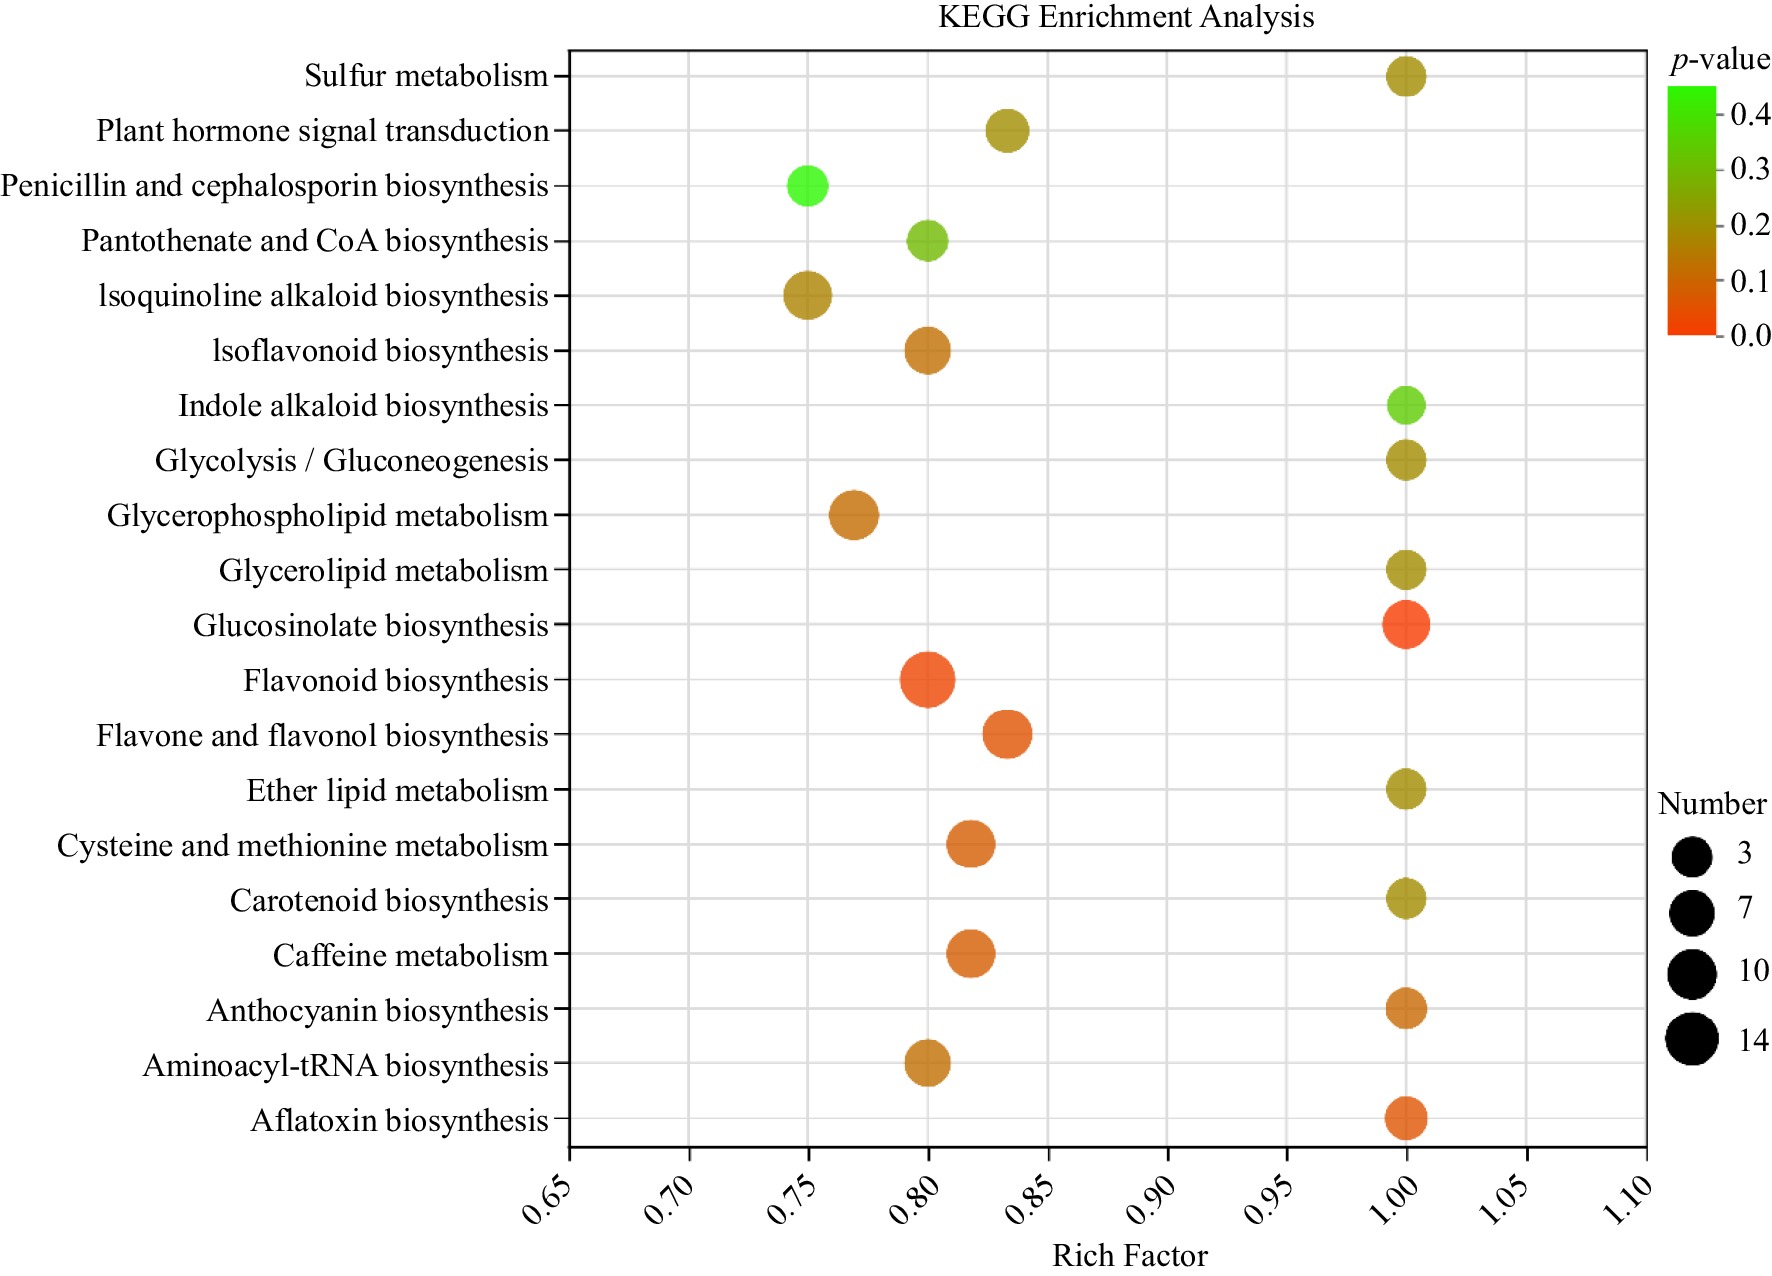
Figure 5.
KEGG enrichment analysis of TOP20 metabolic pathways in untargeted metabolomics.
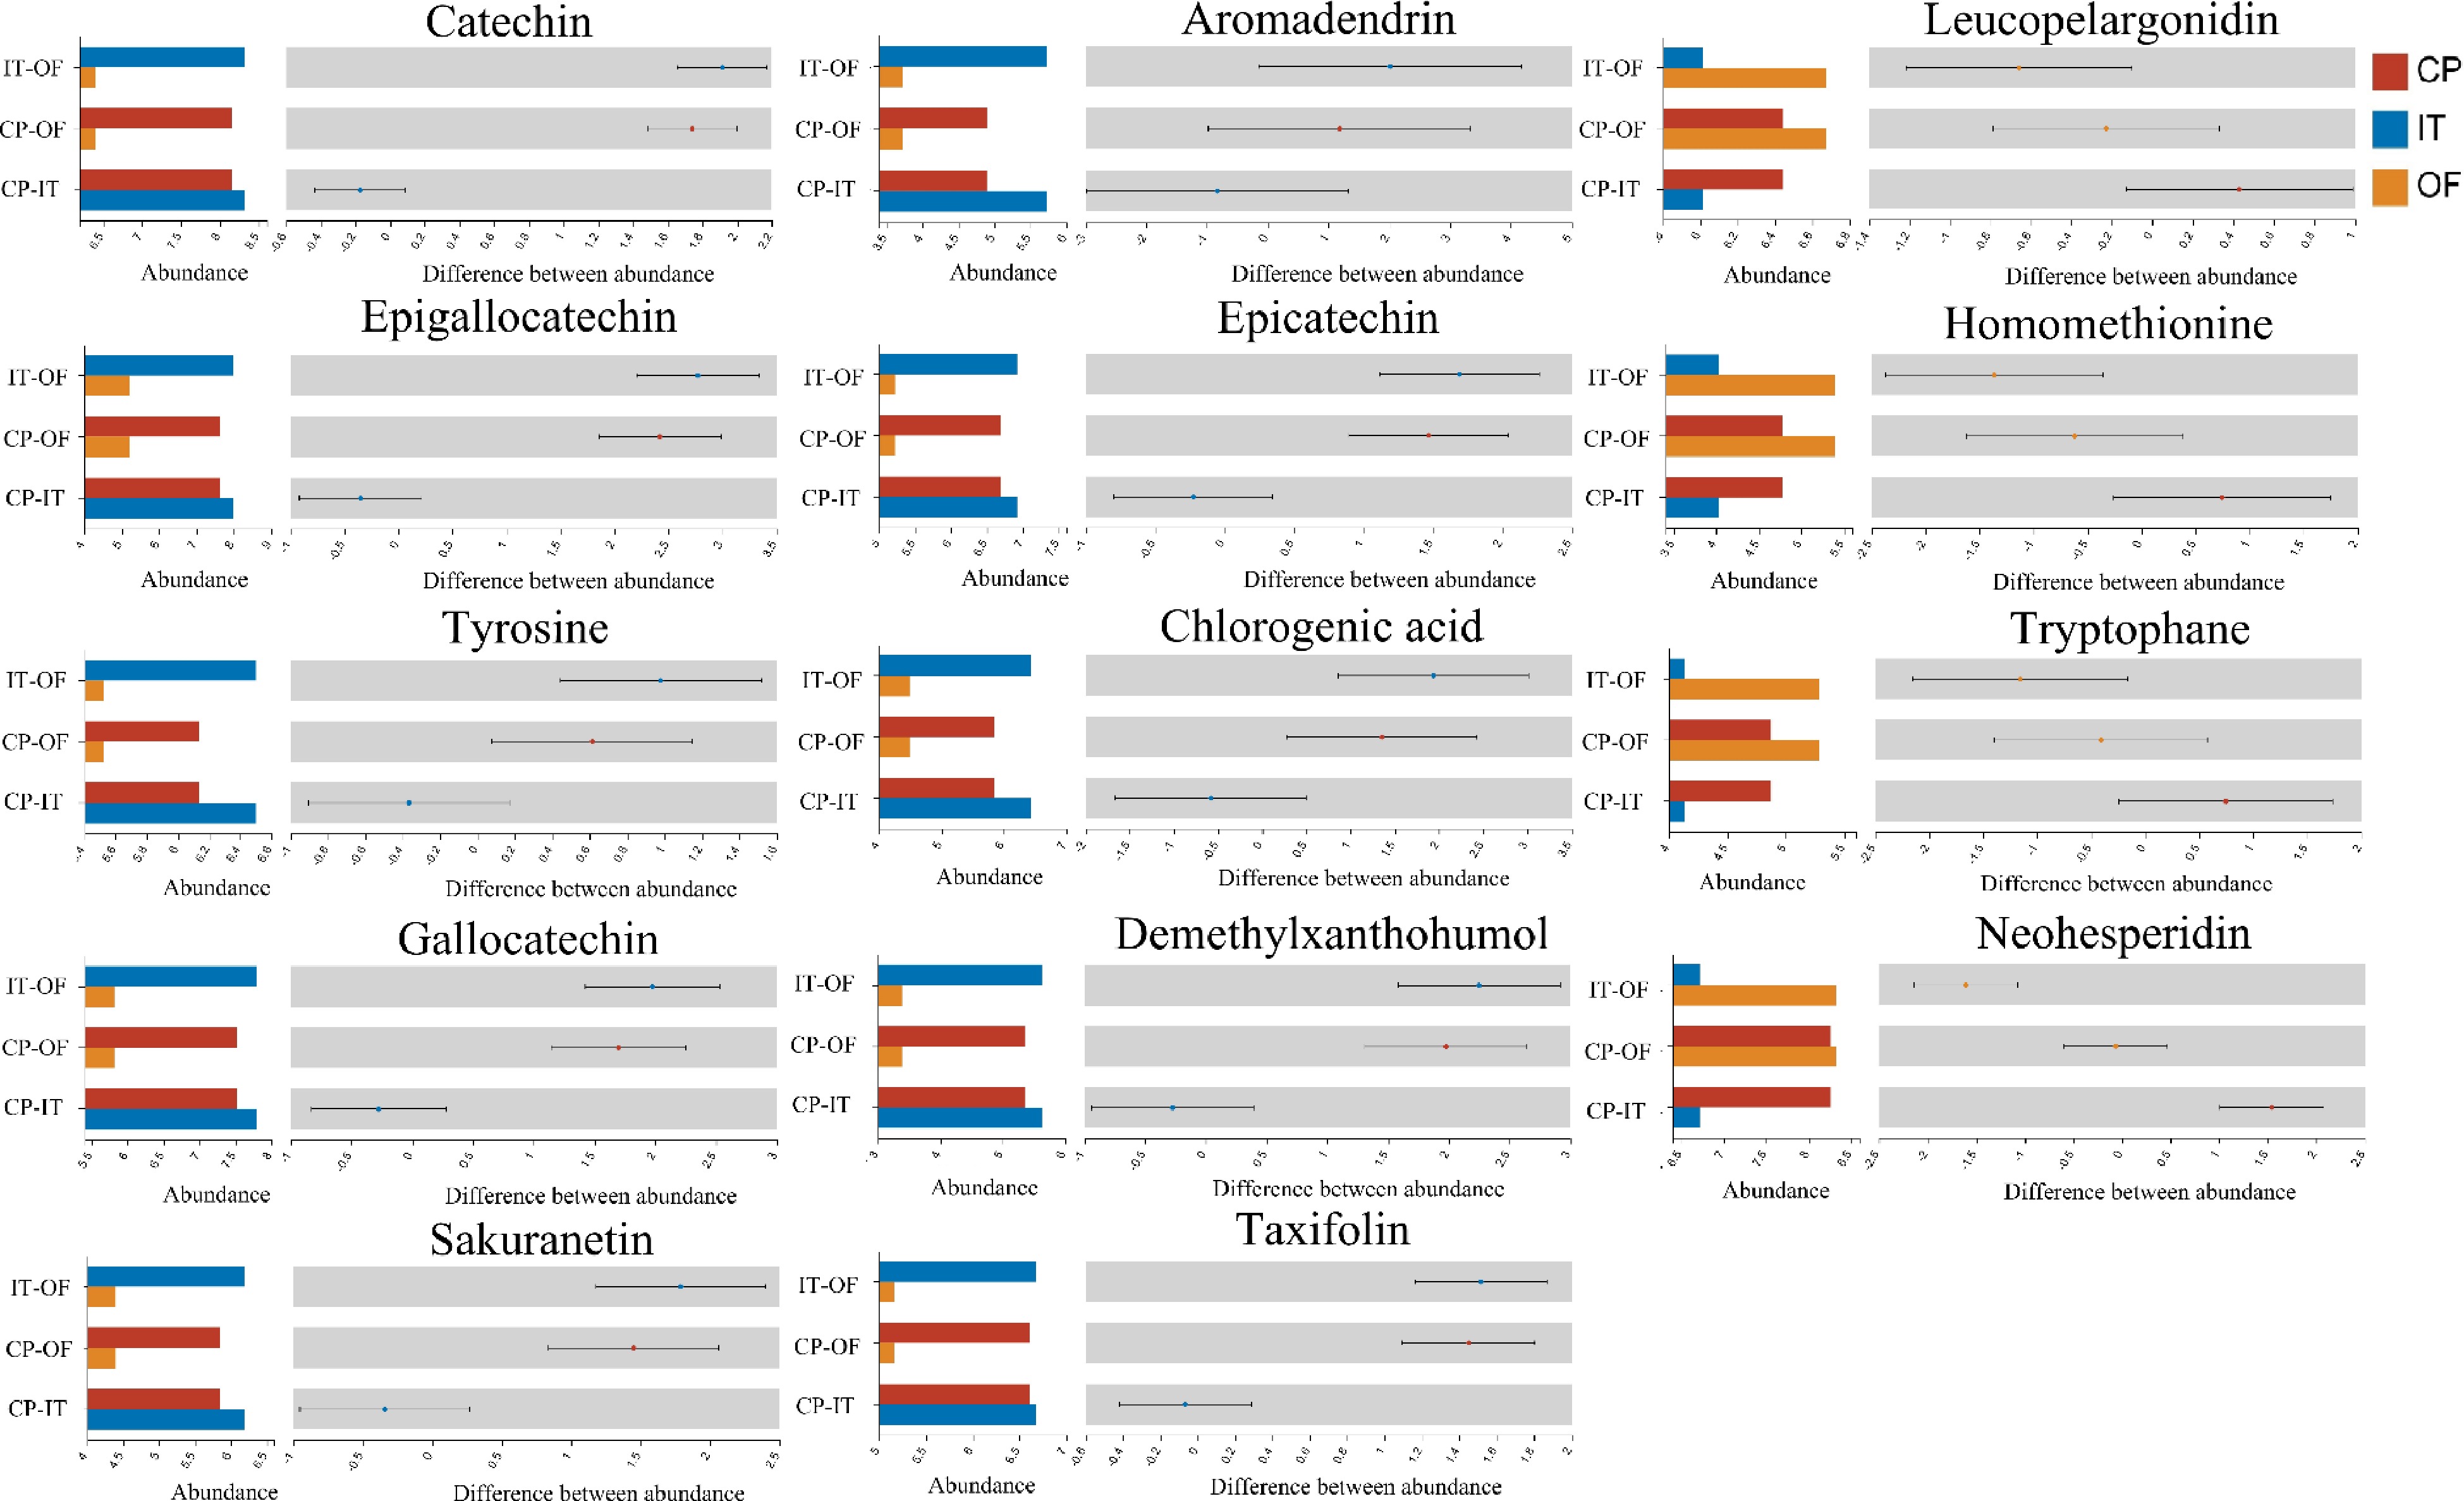
Figure 6.
Non-volatile compounds that significantly contributed to taste of three CPT samples.
Conclusions and outlook
-
The 47 flavor substances with their flavor description (35 aroma-active compounds and 12 taste-related compounds) in the CP samples were plotted on the flavor wheel (Fig. 7). Of which, 15 substances in the upper left corner were considered as the main flavor substances provided by IT. O-cresol, p-cresol, and phenol in box A shared similar structures, with cresol as the basic structure which has a methyl group in the para or adjacent position and have phenolic as the main aroma profile. The 13 compounds in the upper right corner were considered to be the flavor substances provided by citrus peel, three of them in box B were structurally similar and provided mainly minty or woody aroma characteristics. The two aldehydes (perillaldehyde and vanillin) in box C contribute to the aroma characteristics of woody and sweet for CP. The substances in the yellow part at the bottom of Fig. 7 can be divided into three main categories. The substances in box F are mainly the sources of musty, roasted and phenolic aroma characteristics. The compounds in box E are mainly the sources of floral, herbal, and fruity aromas, and some correlations are also found in their chemical structural formula, and there is more cis-trans isomerism. The two esters in box D are particularly similar in structure, both with a carboxyl substituent linked to the benzene ring, differing only in the number of carbon atoms attached to the amino substituent of methyl methanthranilate in the benzene ring neighboring substituent, which is considered to be more relevant for floral and fruity aromas (Fig. 3). Flavanol glycosides with low thresholds are important flavor substances in tea leaves[48]. The five compounds in the G box are mainly derived from the inner tea and provide bitterness and astringency.
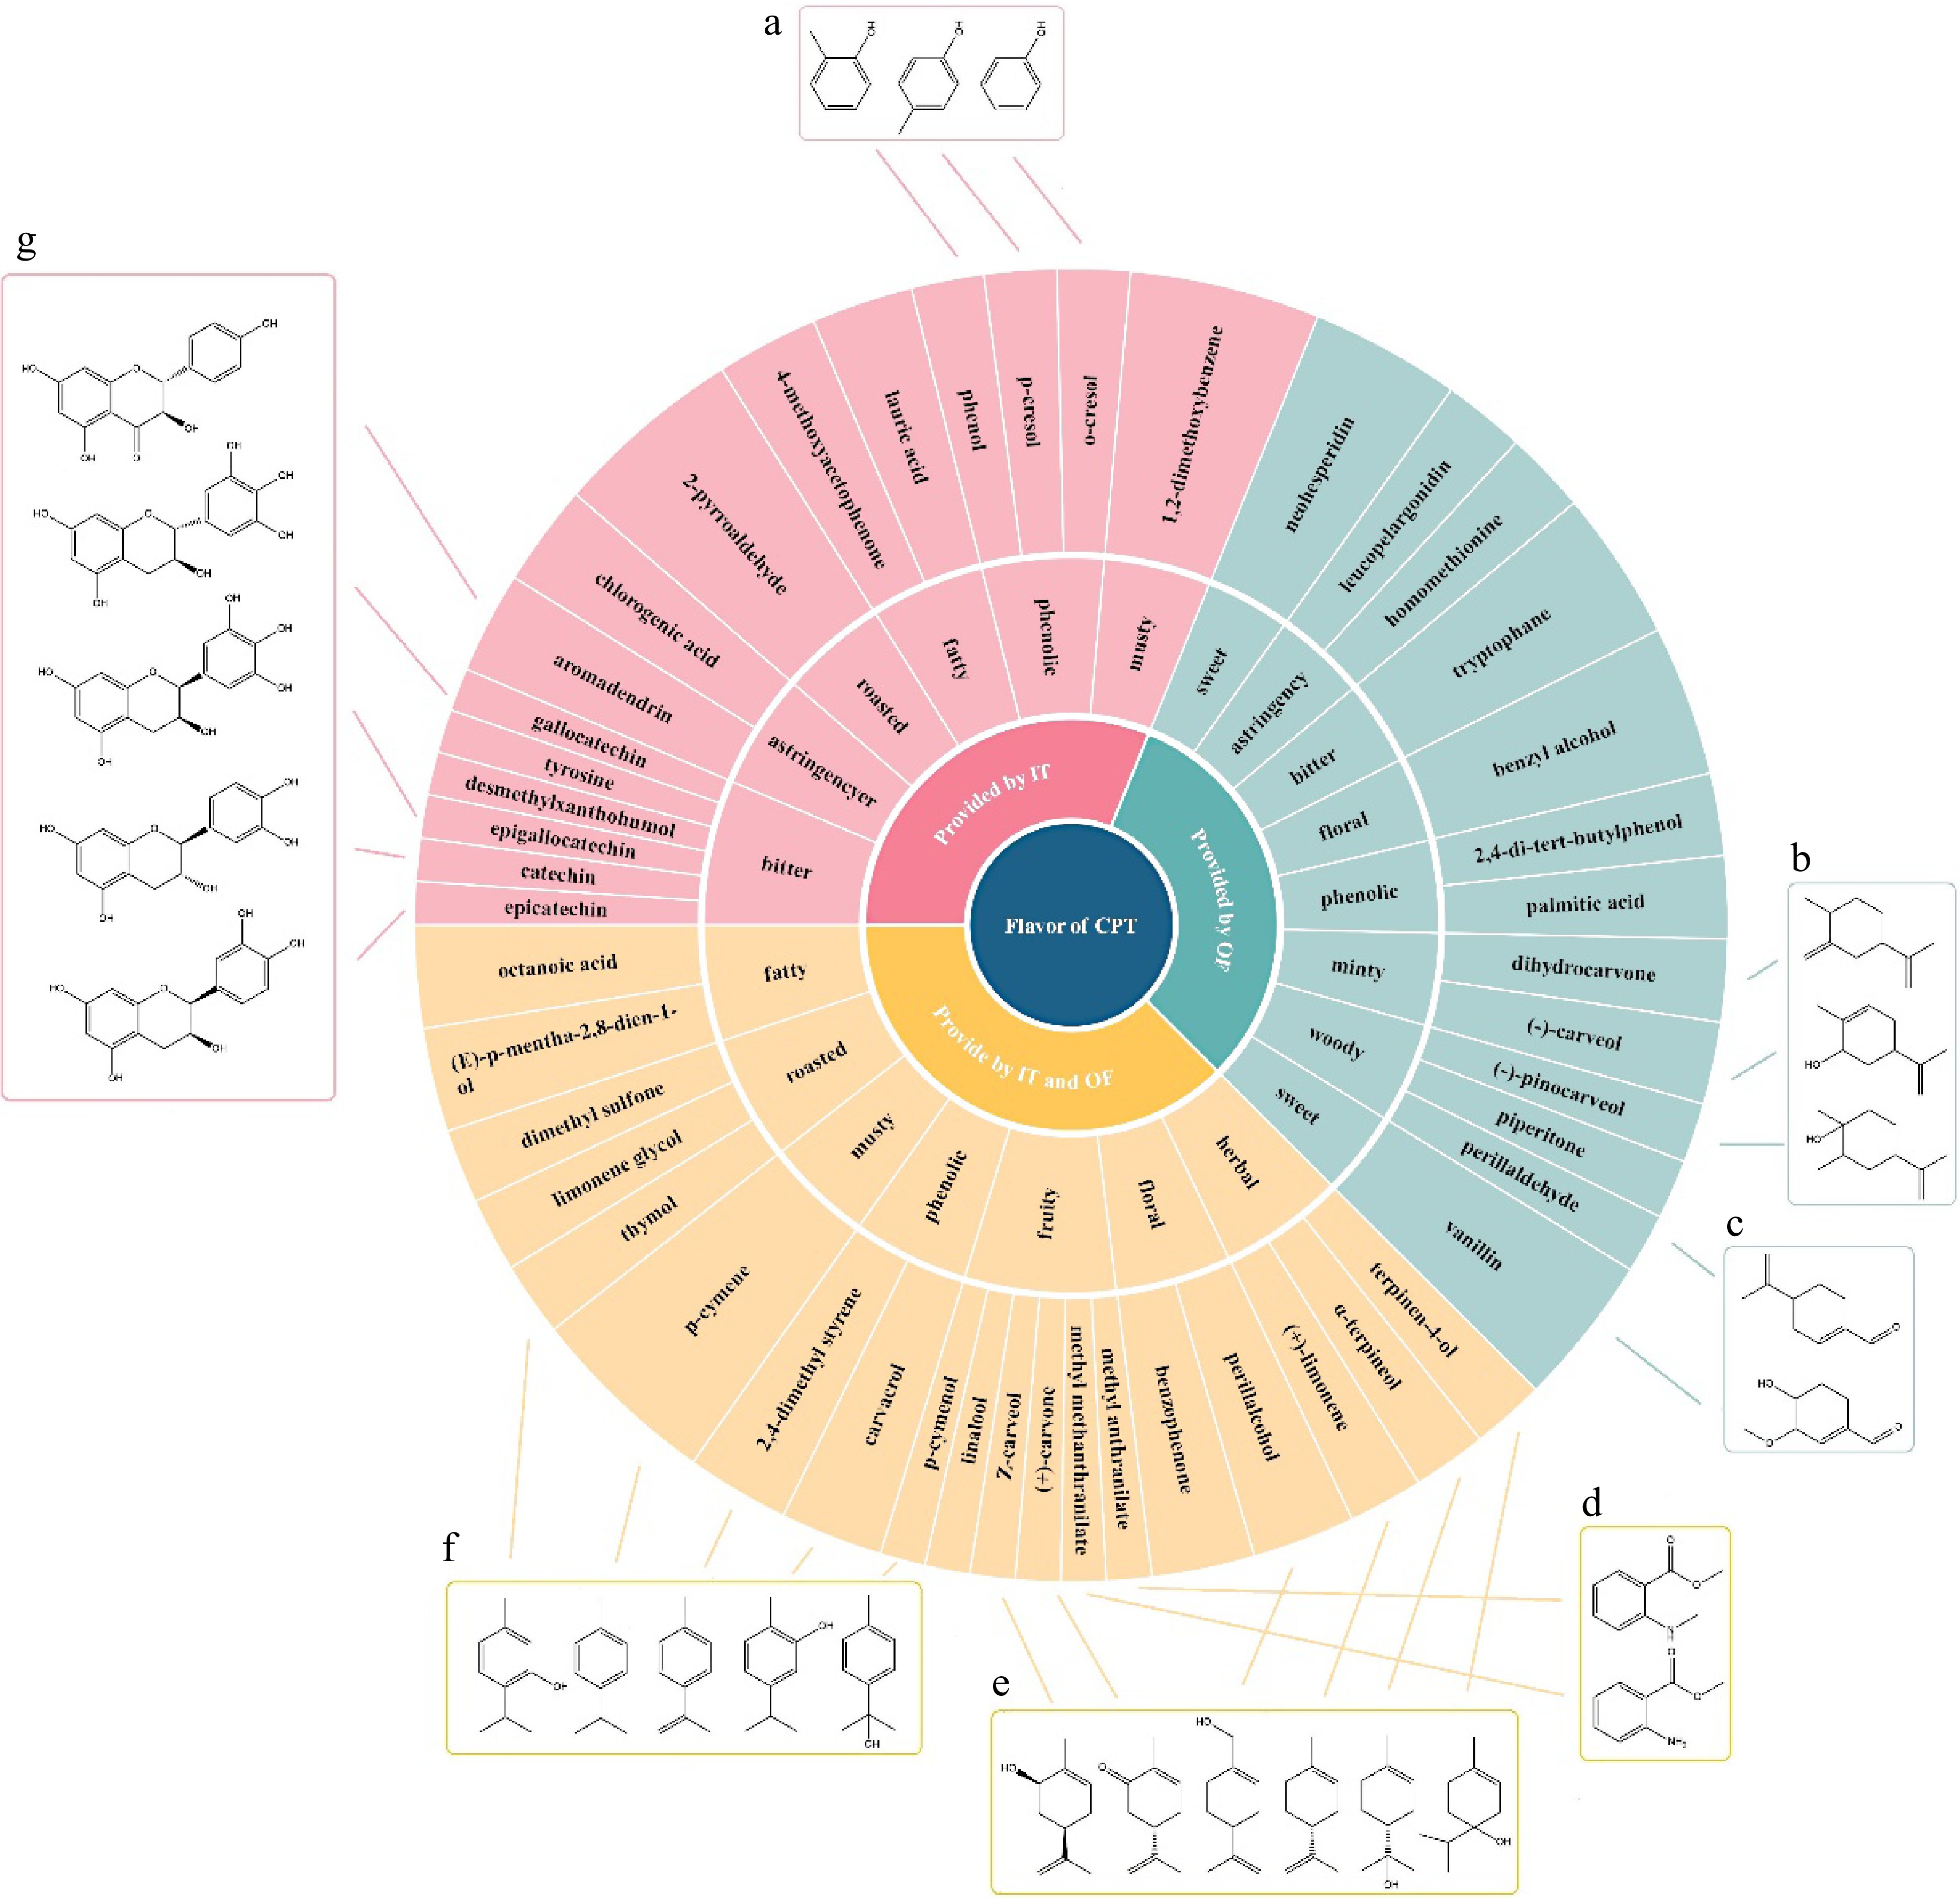
Figure 7.
Flavor wheel of key flavor compounds of CPT infusion samples. Compounds marked with molecular structure in frames (a)−(g) were specific to the IT, OF or both IT and OF.
These findings have given some insights on the relationship between structure and aroma characteristics and yielded the main source of flavor compounds of the CP samples. Even after five years of co-fermentation under sunlight, the flavor substances in three samples were still not identical. Most of the aroma substances of the whole fruit sample of citrus tea (CP) were found in both the OF and IT samples, which can be considered to be attributed by both Pu-erh tea and citrus peel. Based on the flavor wheel and the results of the previous screening of key aroma-active compounds, it can be concluded that some of the main characteristics aromas were provided by both IT and OF, and their corresponding key aroma-active compounds were fatty (octanoic acid), roasted (thymol), musty (p-cymene), phenolic (2,4-dimethyl styrene), fruity (methyl methanthrenilate), floral (benzophenone) and herbal (terpinene-4-ol, α-terpinol, (+)-limonene). These detected components can preliminarily explain ingredient-ingredient relation and ingredient-compound relation, which were proposed to support food pairing and further derived flavor pairing[18,49]. For example, compounds in CP that were affected by the OF and IT samples were floral (benzyl alcohol), phenolic (2,4-di-tert-butylphenol), minty (dihydrocarone), woody (perillaldehyde) and sweet (vanillin, neohesperidin) notes. In the OF part, the citrus peel mainly provided fruity (methyl anthranilate) note, floral (β-ionone, benzophene) notes, while in the IT part, Pu-erh tea mainly provided musty(p-cymene) note and herbal (α-terpineol) note and most of the FD values of these aroma components are higher than in the CP part. Generally, the higher FD values, the greater the contribution of the volatile components to the overall aroma. Benzophene provides rose-like or geranium-like floral notes and β-ionone is the representative component of violet aroma that may cooperate with benzyl alcohol so that enhanced faint floral note in CP, musty note and herbal note can also enhance and match the woody (perillaldehyde) note cause their aroma types are close to each other. It can be seen that OF part improved the flavor of Pu-erh tea and gave citrus Pu-erh tea a unique and coordinated flavor.
In summary, this research studied the flavor profile and revealed taste metabolites of citrus Pu-erh tea, which is expected to provide some useful information for the quality control of the citrus Pu-erh tea.
-
The authors confirm contribution to the paper as follows, original draft writing: Sun J, Cai W; data analysis: Sun J, Cai W; methodology: Yao L, Song S, Wang H; conceptualization: Feng T, Yu C; manuscript review and editing: Feng T, Chen D, Yao L, Lu J, Wang H, Liu Q; partial funds and consultant: Lu J, Feng T . All authors read and approved the final manuscript.
-
All data generated or analyzed during this study are included in this published article and its supplementary information files.
The support of the Key Laboratory of cigarette flavoring Technology in Tobacco Industry (TX2018001), Shanghai Gaofeng & Gaoyuan Project for University Academic Program Development (1021GN203004005) and Royal Society of New Zealand Catalyst Seeding Fund (21-AUT-005-CSG).
-
The authors declare that they have no conflict of interest.
-
# These authors contributed equally: Jiaqing Sun, Weitong Cai
- Supplemental Table S1 Mean intensity values of the ten attributes of the Citrus Pu-erh tea samples during sensory evaluation.
- Supplemental Table S2 Mean intensity values of the taste of the Citrus Pu-erh tea samples using electronic tongue.
- Supplemental Table S3 Standard curves of aroma-active compounds of Citrus Pu-erh tea samples.
- Supplemental Fig. S1 Results of multivariate statistical analysis of untargeted metabolomics.
- Copyright: © 2024 by the author(s). Published by Maximum Academic Press, Fayetteville, GA. This article is an open access article distributed under Creative Commons Attribution License (CC BY 4.0), visit https://creativecommons.org/licenses/by/4.0/.
-
About this article
Cite this article
Sun J, Cai W, Feng T, Chen D, Lu J, et al. 2024. Revealing the flavor profile of citrus Pu-erh tea through GC-MS-O and untargeted metabolomics. Beverage Plant Research 4: e009 doi: 10.48130/bpr-0024-0001 

Revealing the flavor profile of citrus Pu-erh tea through GC-MS-O and untargeted metabolomics
- Received: 04 November 2023
- Revised: 03 December 2023
- Accepted: 08 December 2023
- Published online: 01 March 2024
Abstract: Chinese citrus Pu-erh tea is recognized for its unique flavor, which is composed of key aroma-active compounds and affected by taste-impact metabolites. In this study, the whole citrus Pu-erh tea (CP), its out-layer fruit (OF) container and inside tea (IT) powder, were analyzed by solvent-assisted flavor evaporation (SAFE) coupled with GC-MS-O and UHPLC-MS/MS. As a result, 47 important volatiles were identified, including 27 (IT), 30 (OF) and 27 (CP) volatiles that were screened out based on their odor activity value (OAV) and aroma character impact value (ACI), and further validated by aroma omission/recombination experiment. Combined with the sensory evaluation and PLSR model, the aroma profile of CP was characterized with the following ten flavor attributes: sweet (vanillin); floral (β-ionone); fruity (methyl anthranilate, methyl methanthranilate, citronellal); roasted (thymol); musty (p-cymene), woody (perillaldehyde); herbal (linalool, α-terpineol); phenolic (2,4-di-tert-butylphenol, p-cresol); minty (dihydrocarvone); and fatty (octanoic acid) volatiles. As for the non-volatile taste-impact chemicals, the most prominent metabolites were identified as flavonoids that mainly contributed to the taste of bitter (catechin, epicatechin, gallocatechin), astringency (leucopelargonidin) and sweet (neohesperidin). This novel finding has provided an insight and better understanding of the aroma profile of citrus Pu-erh tea and some guidance for flavor pairing and taste improvement.
-
Key words:
- Citrus Pu-erh tea (CPT) /
- Aroma and taste /
- Key aroma-active compounds /
- Metabolites /
- Flavonoid